Glutathione binding to the plant AtAtm3 transporter and implications for the conformational coupling of ABC transporters
- Division of Chemistry and Chemical Engineering, Howard Hughes Medical Institute, California Institute of Technology, United States
Figures
Figure 1 with 1 supplement

ATPase activities of AtAtm3.
ATPase activities measured in (a) the detergent n-dodecyl-β-D-maltoside (DDM) and (b) nanodiscs formed by membrane scaffolding proteins (MSP) and the lipid 1-palmitoyl-2-oleoyl-glycero-3-phosphocholine (POPC). The ATPase activities were measured in the absence of substrate (●), at 2.5 mM GSSG (■) and 10 mM GSH (▲). The corresponding values of Vmax and Km in different substrate conditions derived from fitting to the Michaelis-Menten equations are indicated. Each condition was measured three times with the individual data points displayed.
-
Figure 1—source data 1
Numerical data for the graphs depicted in Figure 1a and b.
- https://cdn.elifesciences.org/articles/76140/elife-76140-fig1-data1-v2.xlsx
Figure 1—figure supplement 1
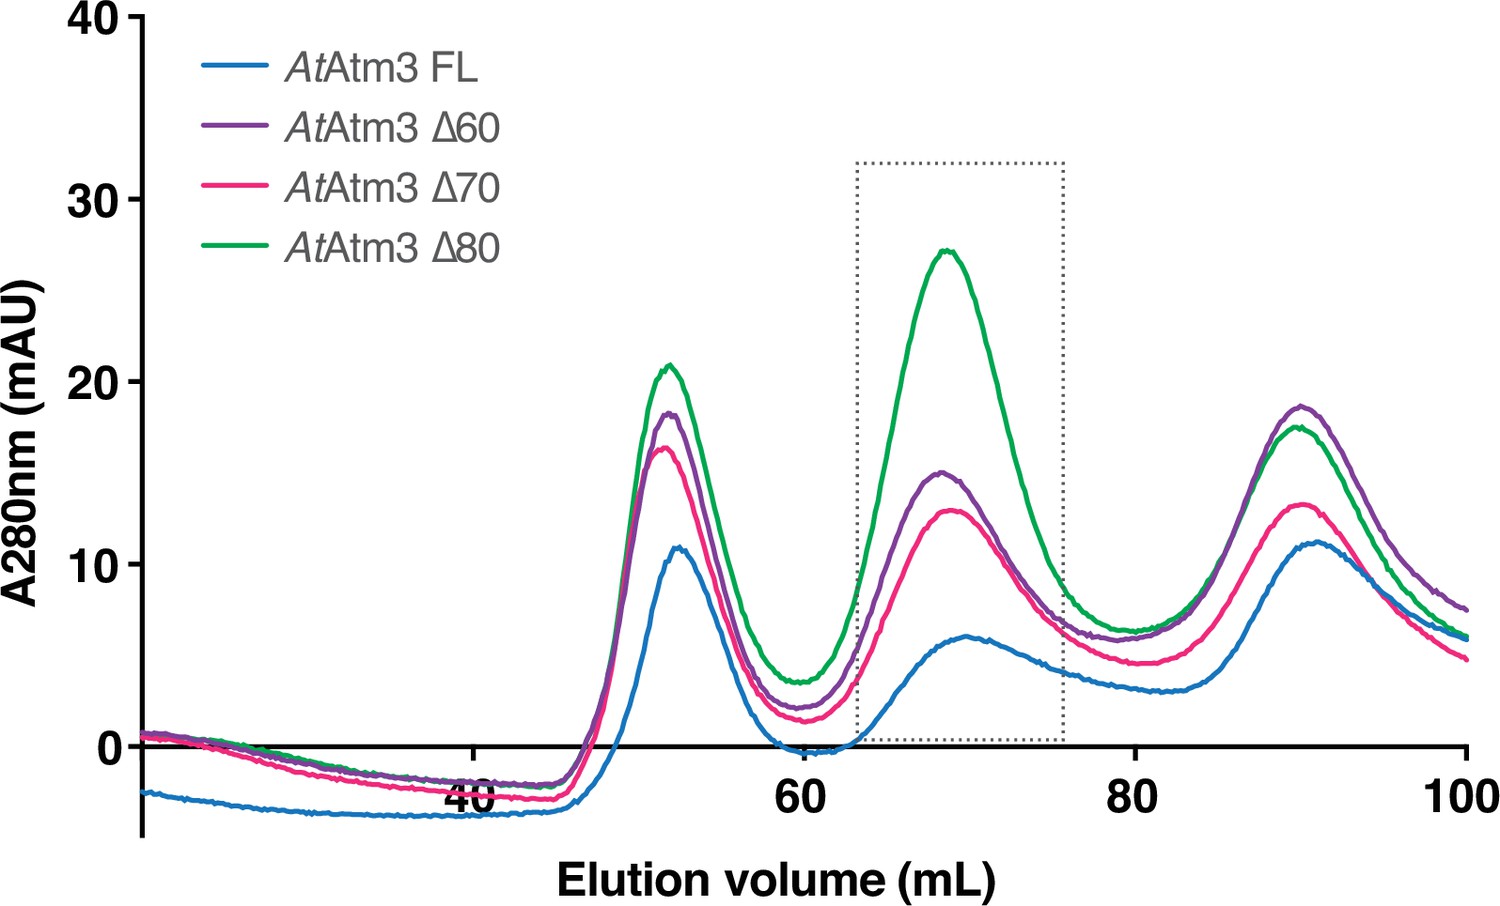
AtAtm3 constructs.
Size exclusion chromatography profile of AtAtm3 constructs using HiLoad 16/60 Superdex 200 (GE Healthcare). Fractions for structural and functional analysis are boxed with dotted lines.
Figure 2 with 8 supplements

Structures of AtAtm3.
(a) Inward-facing conformation in the apo state. (b) Inward-facing conformation with oxidized glutathione (GSSG) bound. (c) TM6s (residues 416–460) in the inward-facing conformation. (d) TM6s in the GSSG-bound inward-facing conformation. The location of GSSG is indicated. (e) Residues important in stabilizing GSSG binding site, identified by PDBePISA (Krissinel and Henrick, 2007). (f) Closed conformation with MgADP-VO4 bound. (g) Outward-facing conformation with MgADP-VO4 bound. (h) TM6s in the closed conformation. (i) TM6s in the outward-facing conformation.
Figure 2—figure supplement 1
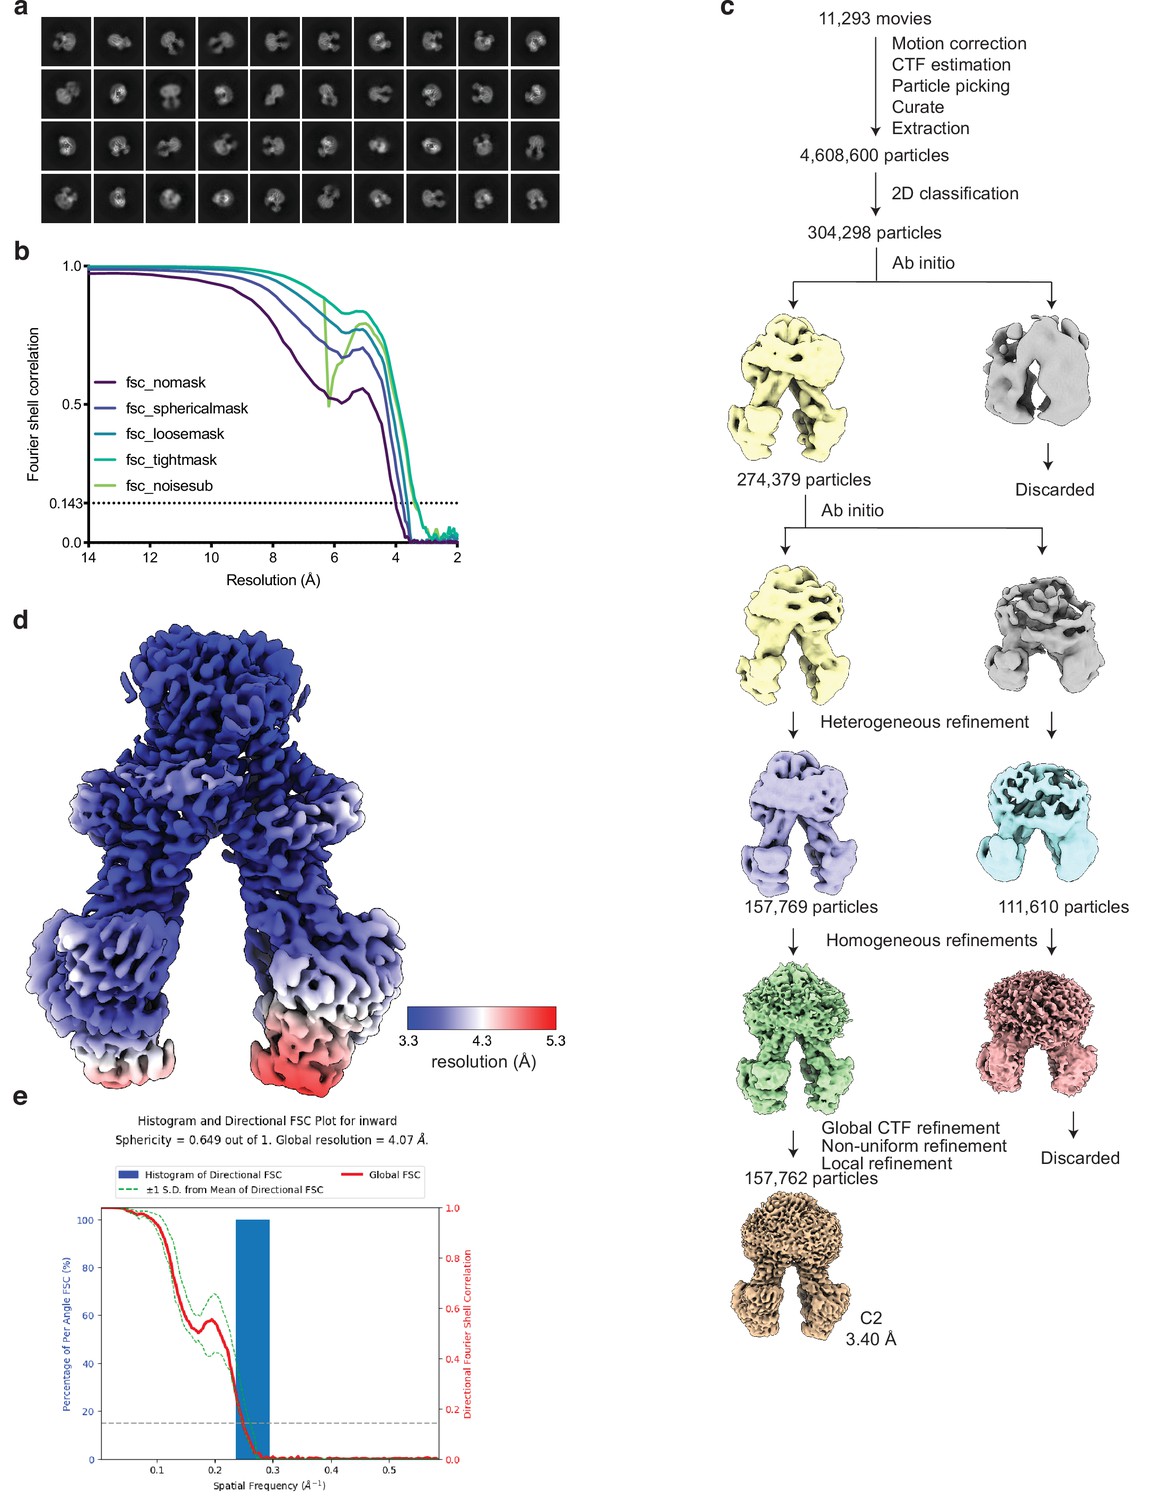
Single-particle cryo-electron microscopy (cryoEM) structure of AtAtm3 in the inward-facing conformation.
(a) Examples of two-dimensional (2D) classes, (b) FSC curves showing the resolution estimate for the final reconstruction, (c) workflow of single-particle data processing, (d) local resolution estimation of the AtAtm3 inward-facing conformation, and (e) 3dfsc of the final reconstruction calculated using the 3dfsc server (Tan et al., 2017).
Figure 2—figure supplement 2

Structural alignment of AtAtm3 to other ATM transporters.
(a) Overall alignment of inward-facing AtAtm3 to ScAtm1 (PDB ID: 4myc) with an overall root mean square deviation (rmsd) of 2.6 Å. (b) Overall alignment of inward-facing AtAtm3 to NaAtm1 (PDB ID: 6vqu) with an overall rmsd of 2.1 Å. (c) Half-transporter alignments ScAtm1 (PDB ID: 4myc) and NaAtm1 (PDB ID: 6vqu) to inward-facing AtAtm3 to with rmsds of 2.3̊ and 2.0 Å, separately.
Figure 2—figure supplement 3
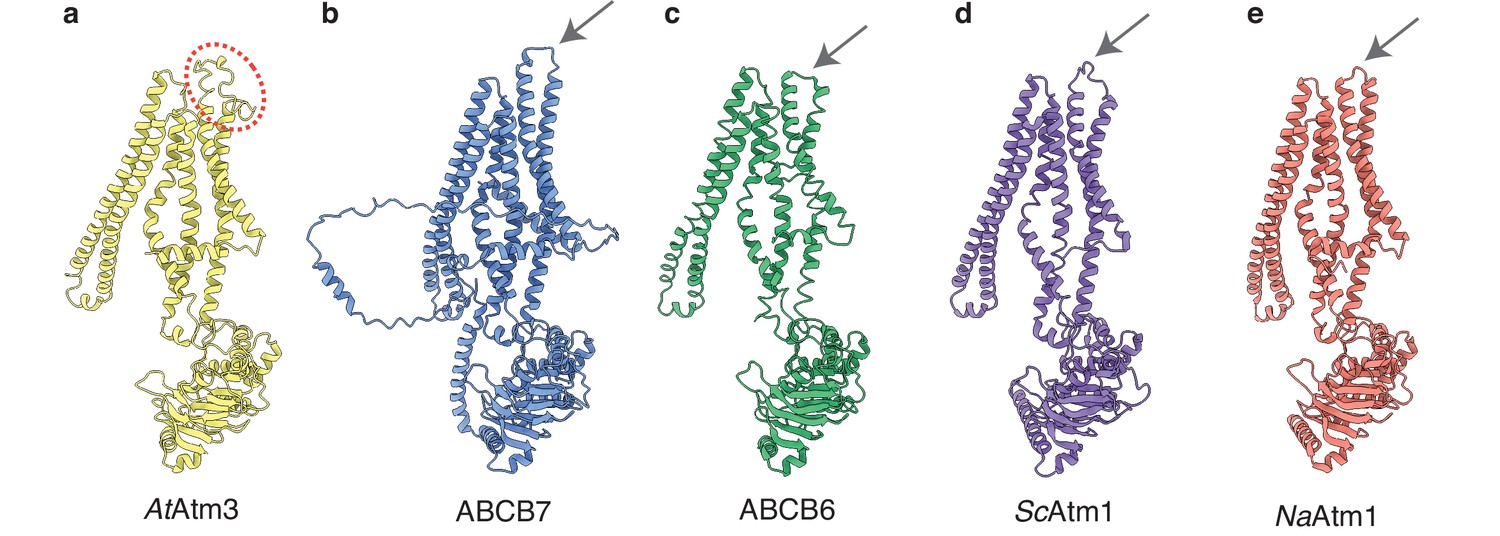
Half-transporter comparison of transporters in the ATM family.
(a) Half-transporter structure of the inward-facing AtAtm3 with the loop between TM1 and TM2 shown in circle. (b) Half-transporter structure of the Alpha-fold 2 model of ABCB7 (Jumper et al., 2021; Varadi et al., 2022). (c) Half-transporter structure of ABCB6 (PDB ID: 7ekm). (d) Half-transporter structure of ScAtm1 (PDB ID: 4myc). (e) Half-transporter structure of NaAtm1 (PDB ID: 4mrn). The loops between TM1 and TM2 in ABCB7, ABCB6, ScAtm1, and NaAtm1 are pointed by an arrow, separately.
Figure 2—figure supplement 4
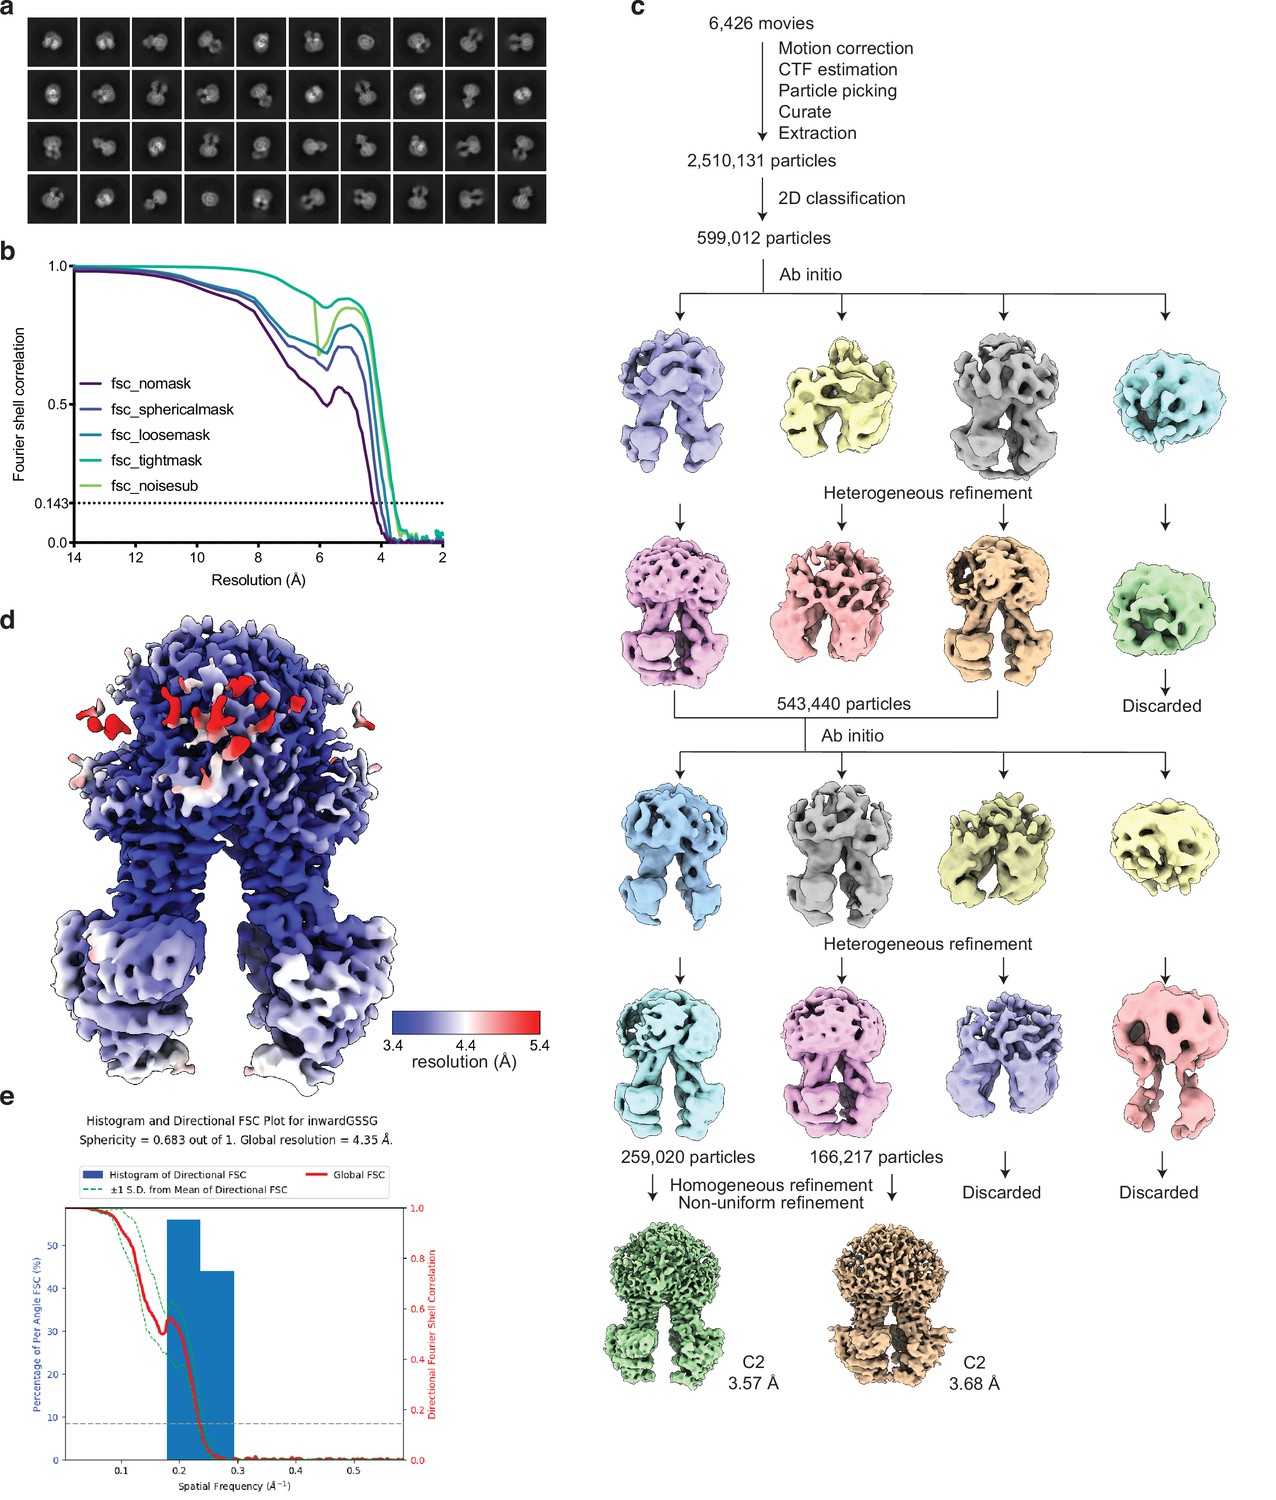
Single-particle cryo-electron microscopy (cryoEM) structure of AtAtm3 in the inward-facing conformation with oxidized glutathione (GSSG) bound.
(a) Examples of two-dimensional (2D) classes, (b) FSC curves showing the resolution estimate for the final reconstruction, (c) workflow of single-particle data processing, (d) local resolution estimation of the AtAtm3 inward-facing conformation with GSSG bound, and (e) 3dfsc of the final reconstruction calculated using the 3dfsc server (Tan et al., 2017).
Figure 2—figure supplement 5
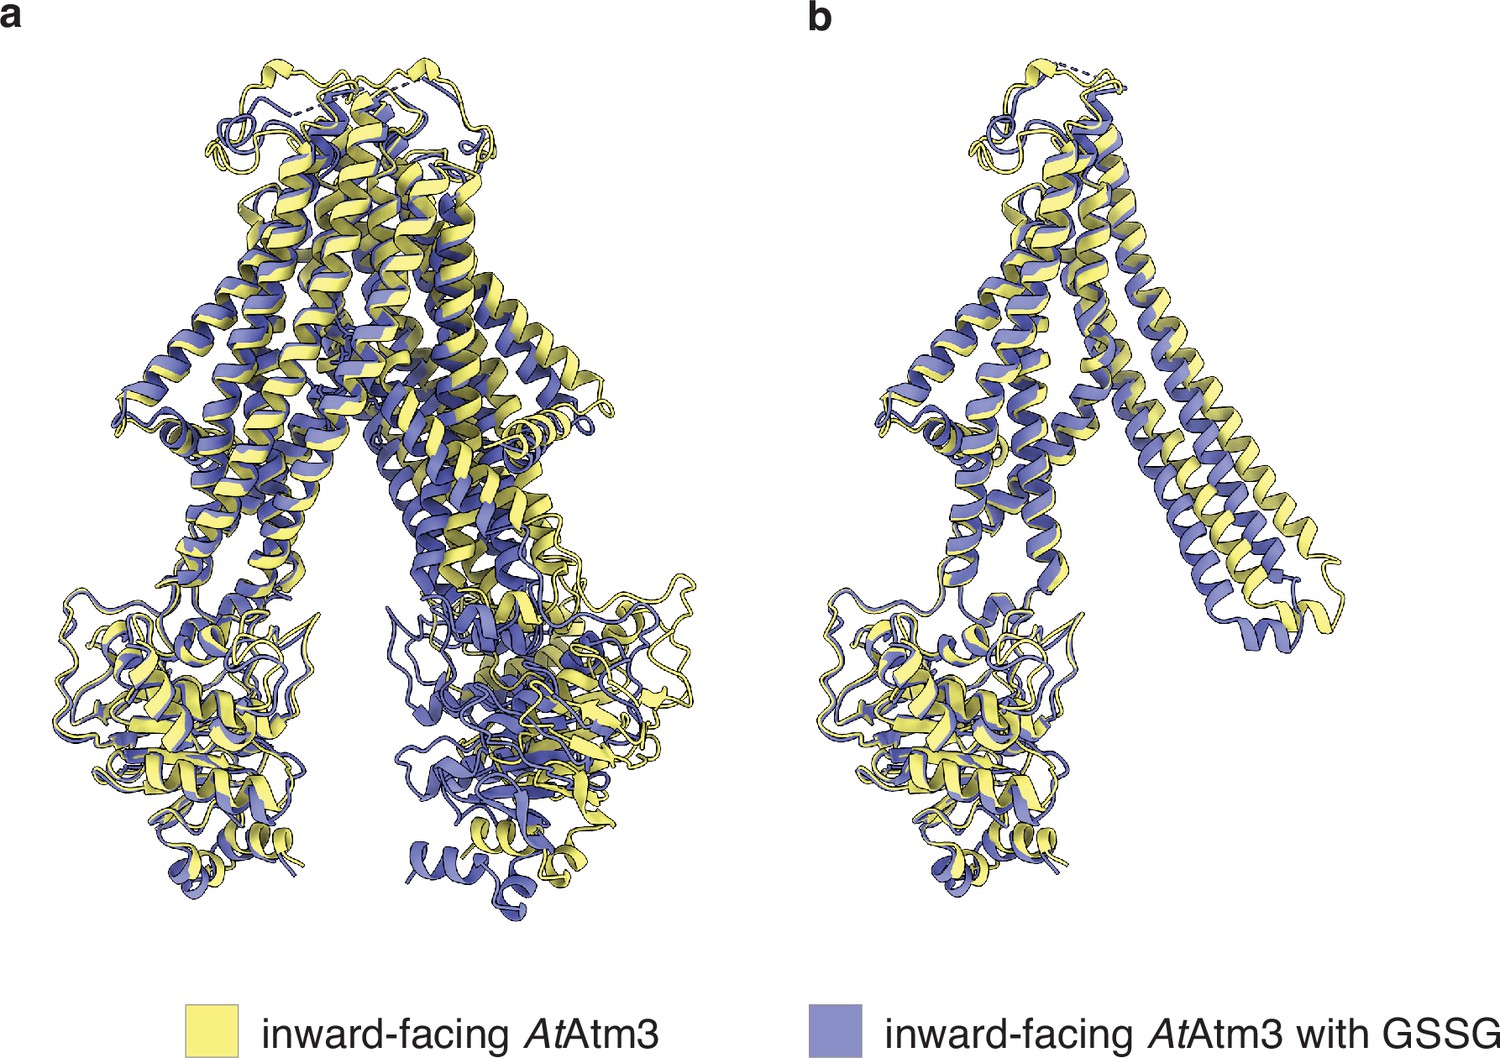
Structural alignment of AtAtm3 in the inward-facing conformation.
(a) Overall alignment of inward-facing AtAtm3 in the apo state to the oxidized glutathione (GSSG)-bound state with an overall root mean square deviation (rmsd) of 2.9 Å. (b) Half-transporter alignment inward-facing AtAtm3 in the apo state to the GSSG-bound state with an rmsd of 1.6 Å.
Figure 2—figure supplement 6
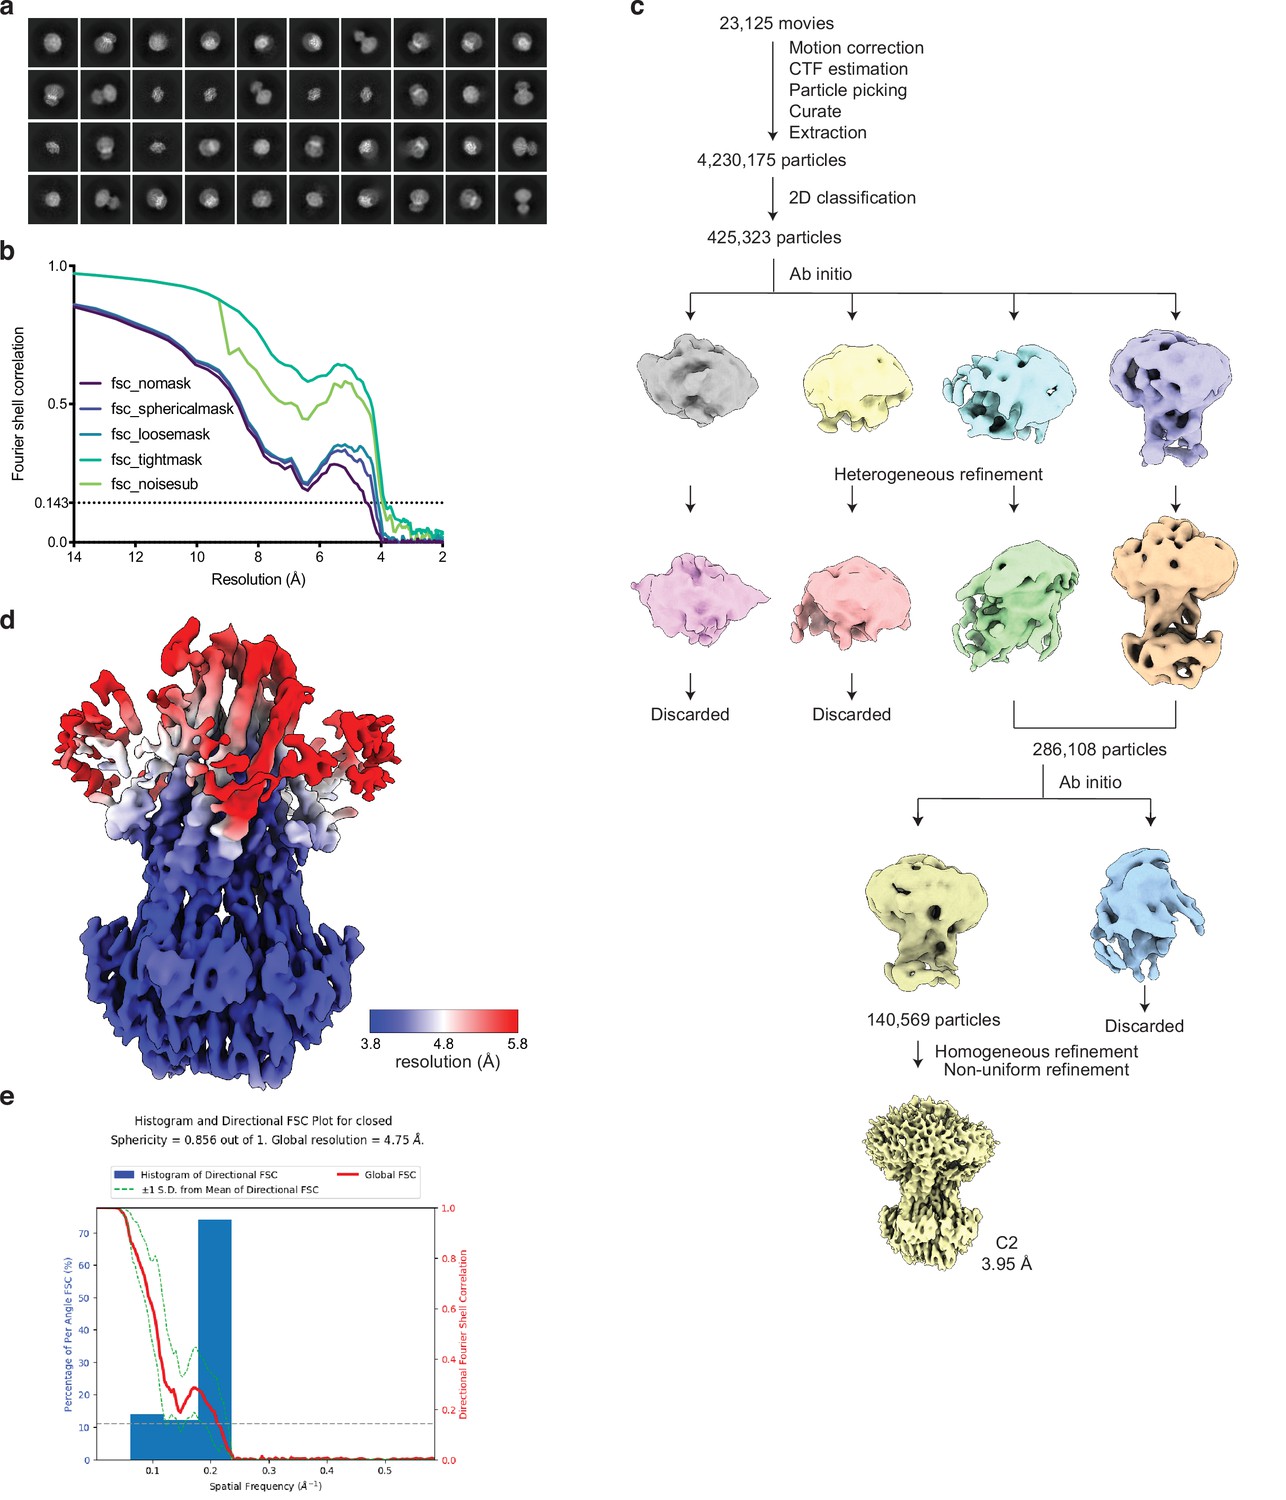
Single-particle cryo-electron microscopy (cryoEM) structure of AtAtm3 in the closed conformation.
(a) Examples of two-dimensional (2D) classes, (b) FSC curves showing the resolution estimate for the final reconstruction, (c) workflow of single-particle data processing, (d) local resolution estimation of the AtAtm3 closed conformation, and (e) 3dfsc of the final reconstruction calculated using the 3dfsc server (Tan et al., 2017).
Figure 2—figure supplement 7
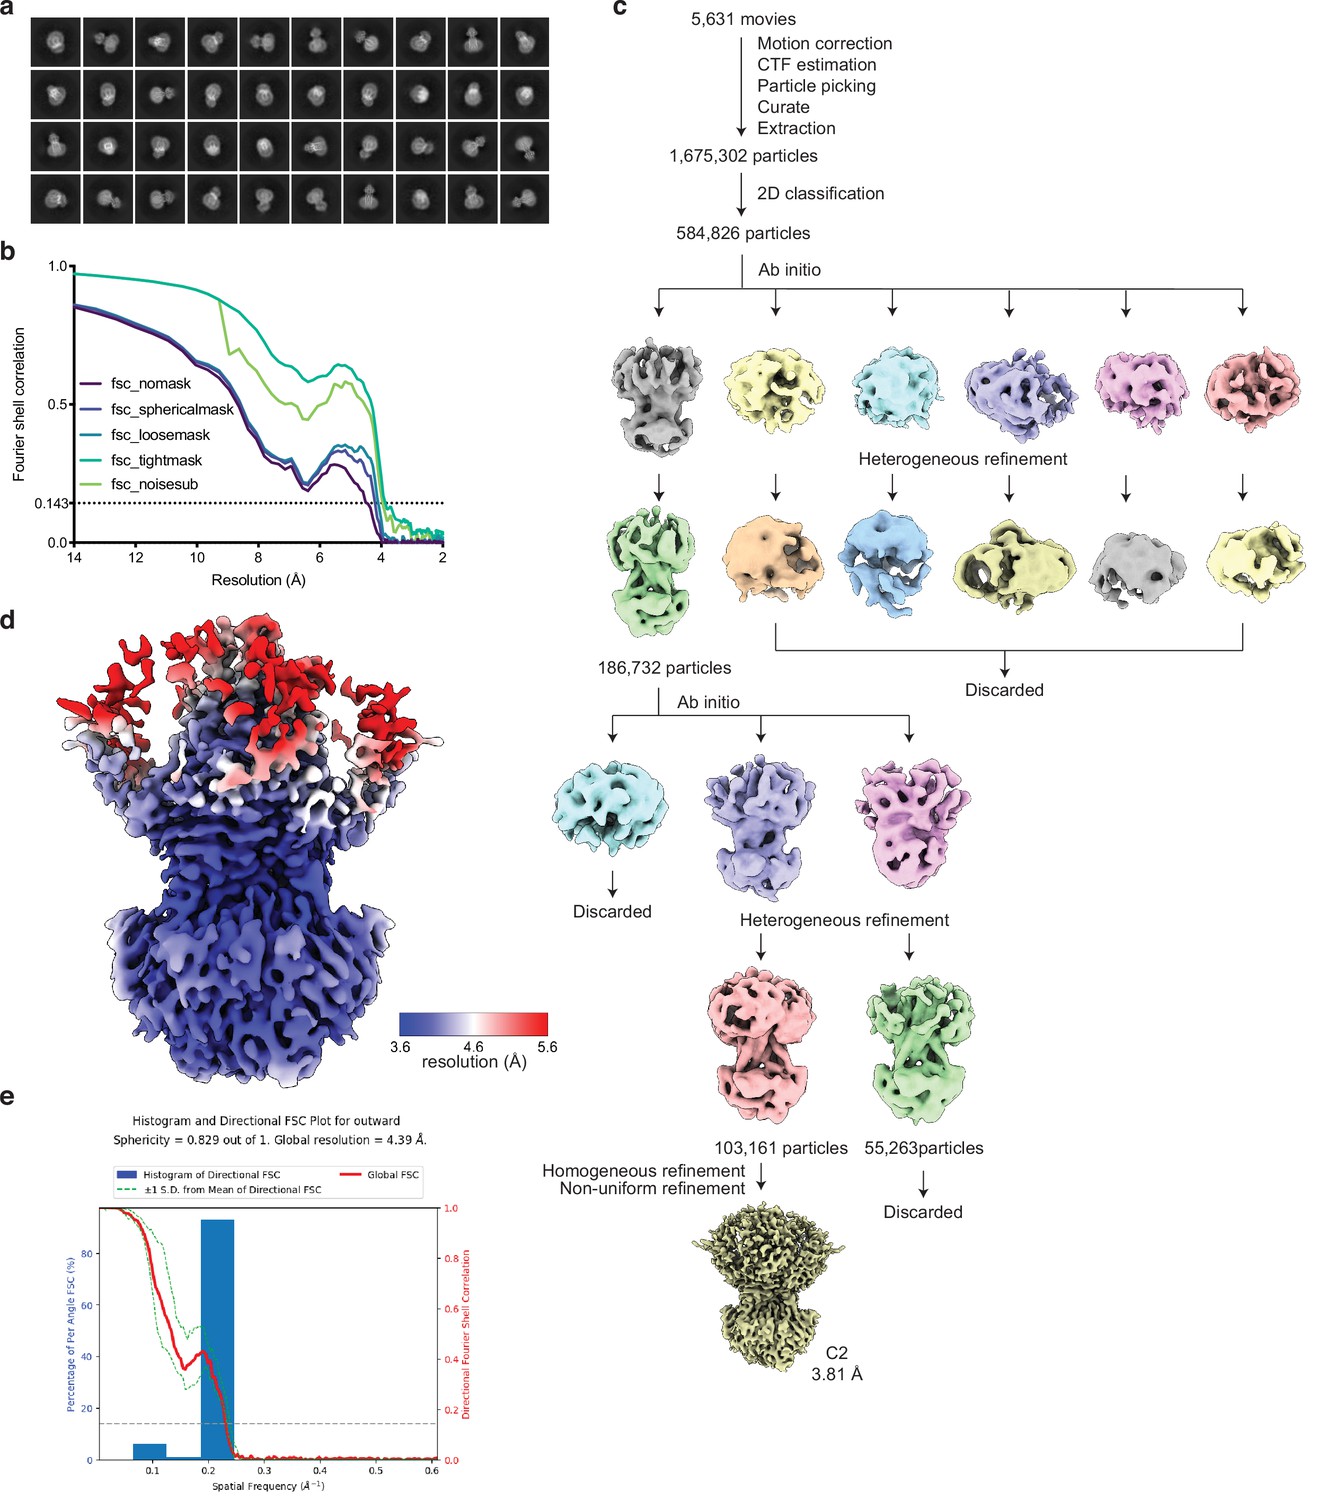
Single-particle cryo-electron microscopy (cryoEM) structures of AtAtm3 in the outward-facing conformation.
(a) Examples of two-dimensional (2D) classes, (b) FSC curves showing the resolution estimate for the final reconstruction, and (c) workflow of single-particle data processing, (d) local resolution estimation of the AtAtm3 outward-facing conformation, and (e) 3dfsc of the final reconstruction calculated using the 3dfsc server (Tan et al., 2017).
Figure 2—figure supplement 8
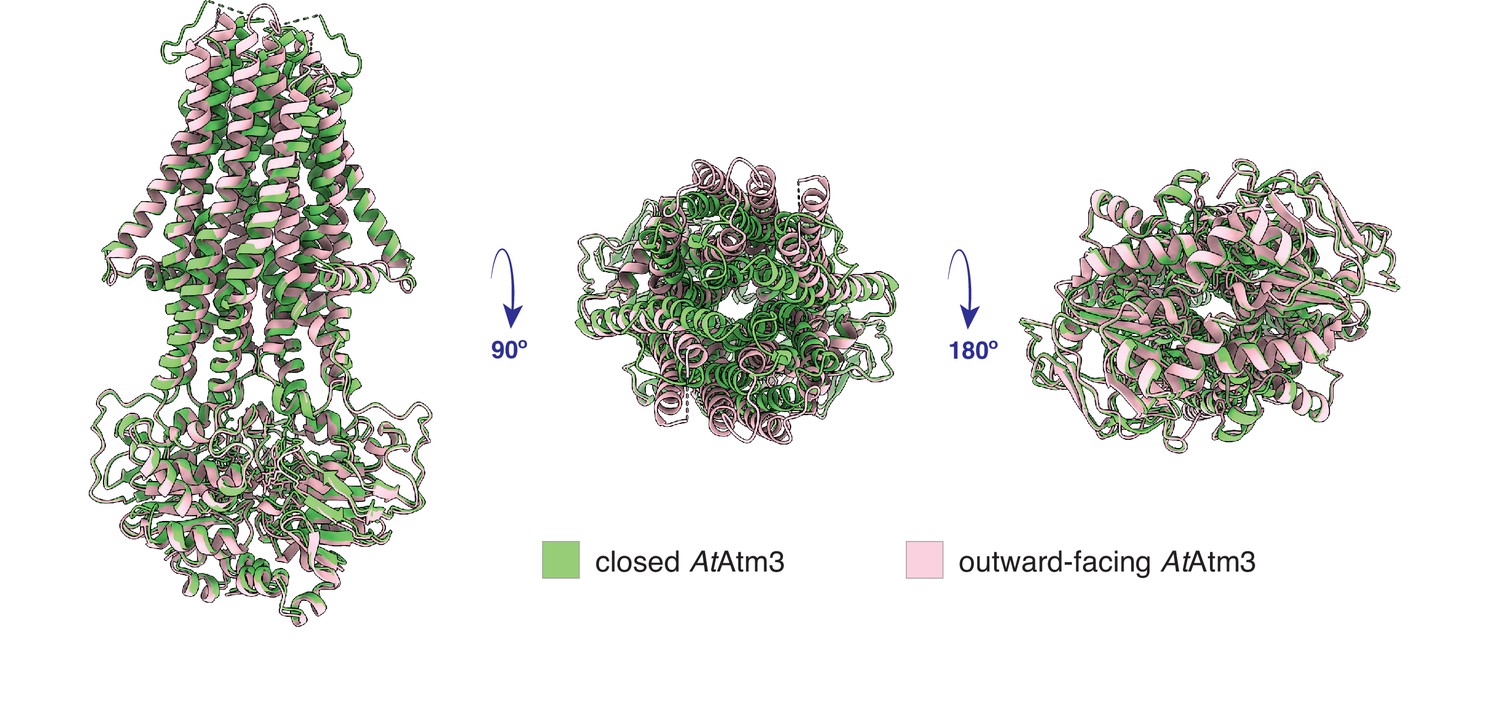
Structural alignment of AtAtm3 in the closed and outward-facing conformation.
Overall alignment of AtAtm3 in the closed and outward-facing conformation with an overall root mean square deviation (rmsd) of 1.7 Å.
Figure 3 with 1 supplement
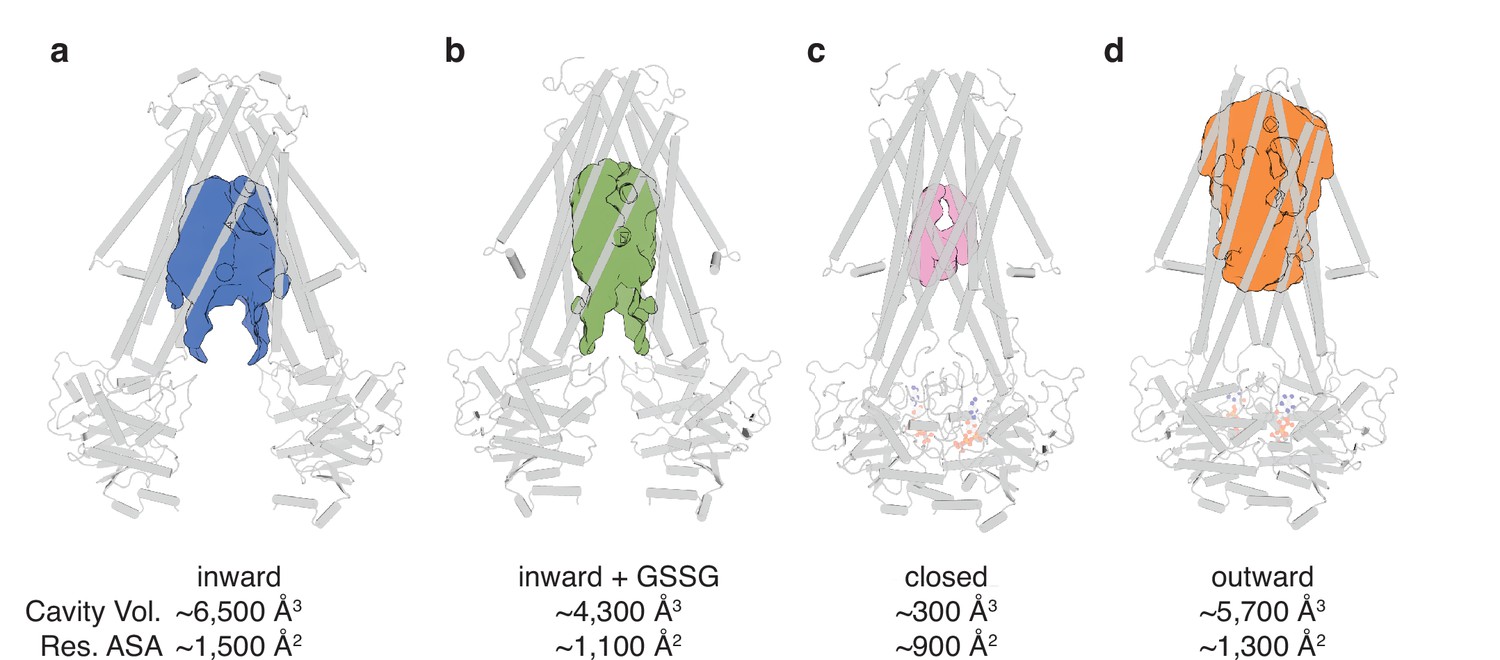
Binding cavity analysis.
(a) Central cavity of the apo inward-facing conformation. (b) Central cavity of the inward-facing conformation with oxidized glutathione (GSSG) bound. (c) Closed conformation with a restricted cavity observed. (d) Central cavity of the outward-facing conformation. Cavity volumes were measured by CastP (Tian et al., 2018) using a probe radius of 2.5 Å. AtAtm3 is shown as a gray cartoon representation, while cavities are depicted as color surfaces. The accessible solvent areas (ASA) of the key residues in the GSSG binding pockets of different structures were calculated by Areaimol in CCP4 (Winn et al., 2011).
Figure 3—figure supplement 1
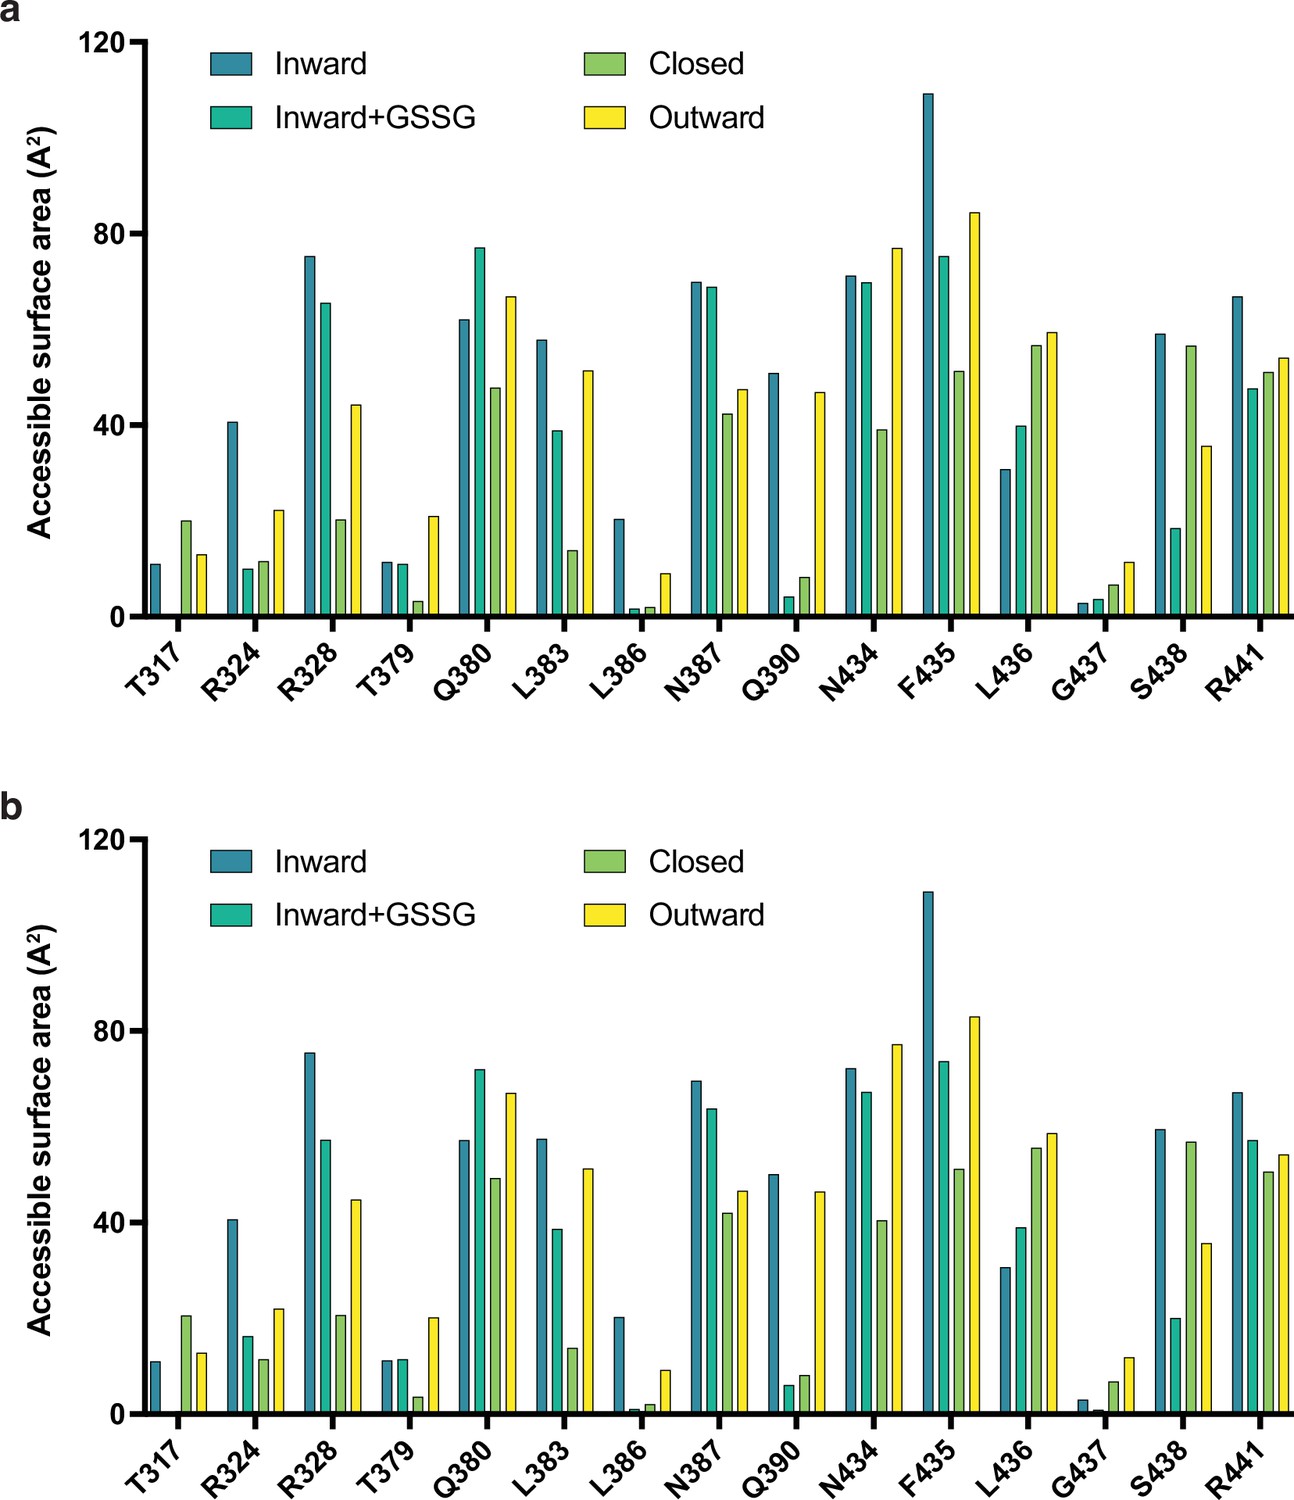
Accessible surface area of binding site residues.
Accessible surface area for oxidized glutathione (GSSG) binding pocket residues in (a) chain A and (b) chain B, calculated by Areaimol in CCP4 (Winn et al., 2011).
Figure 4 with 1 supplement

Substrate binding site conservation.
(a) Sequence conservation of AtAtm3, NaAtm1, ScAtm1, human ABCB7, and human ABCB6 calculated by ConSurf (Landau et al., 2005) plotted on a cartoon and surface representations of a half-transporter of AtAtm3 in the GSSG-bound inward-facing conformation. Oxidized glutathione (GSSG) is shown in spheres. (b) Conservation of key residues in the GSSG binding pocket. Residues in one chain colored based on the conservation and residues in the second chain are colored in gray. All residues and GSSG are shown in ball and sticks.
Figure 4—figure supplement 1

Sequence `alignment of selected Atm family transporters.
Sequence alignment was generated using STRAP (http://www.bioinformatics.org/strap/). At: Arabidopsis thaliana; Na: Novosphingobium aromaticivorans, and Sc: Saccharomyces cerevisiae (yeast). ABCB7 and ABCB6 are human ABC transporters. Positions of the six transmembrane helices are indicated above the sequence alignment. The key residues interacting with oxidized glutathione (GSSG) or reduced glutathione (GSH) are highlighted in yellow. The substrate interacting residues are identified based on the structures of GSSG-bound NaAtm1 (PDB ID: 4mrs) and AtAtm3 (PDB ID: 7n59), and the GSH-bound structure of ScAtm1 (PDB ID: 4myh).
Figure 5
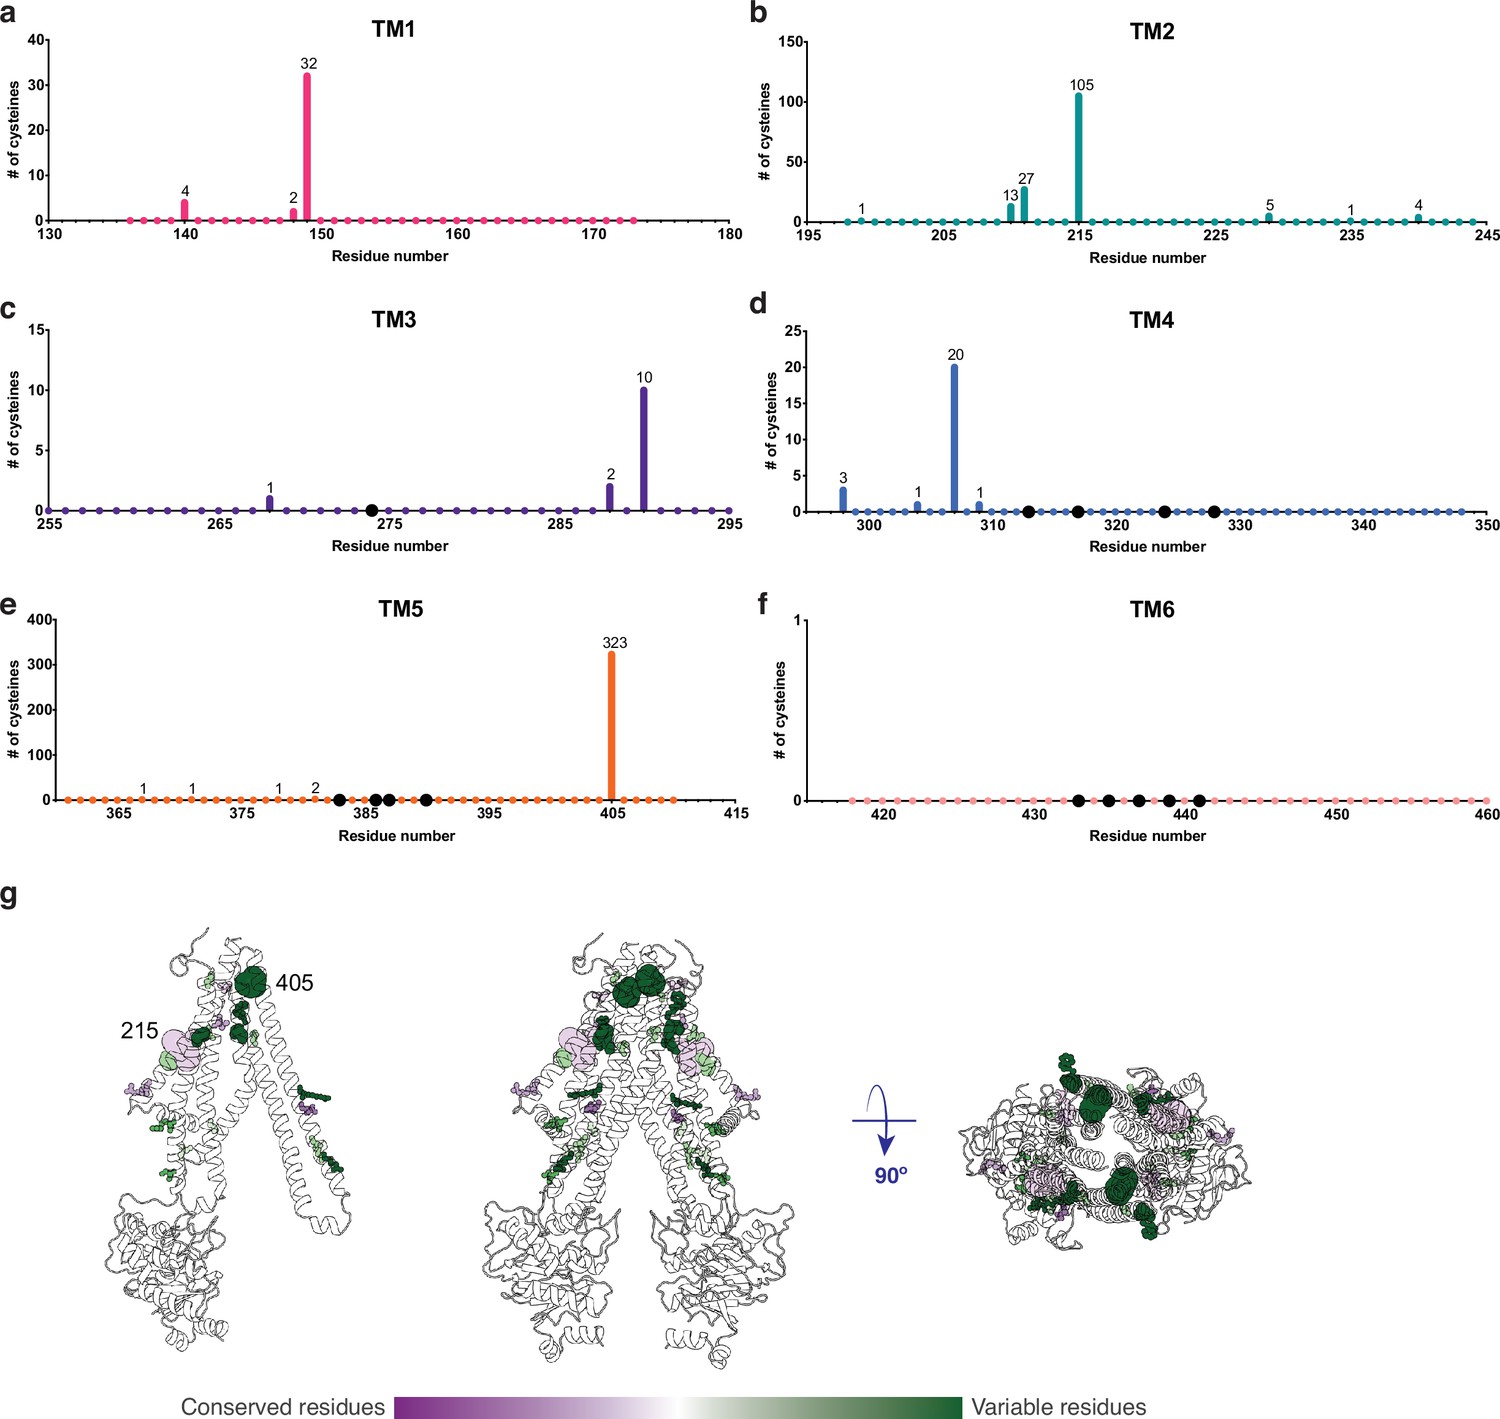
Cysteine residues found in transmembrane helices in an alignment of 410 AtAtm3 homologs.
(a–f) Residues are numbered based on the AtAtm3 sequence. Small colored dots represent different residue positions, while the larger black dots indicate residues observed to interact with glutathione in the NaAtm1 and AtAtm3 structures. The numbers above a given residue indicate the number of sequences in the alignment with a cysteine at that position; unlabeled positions denote positions where no cysteines were observed in the alignment. (g) Transmembrane cysteine residues in the inward-facing conformation of AtAtm3. All positions with cysteine counts are shown in spheres. AtAtm3 residues at positions that have 1–10 counts of cysteines are depicted with small spheres, residues at positions that have 11–100 counts of cysteines are depicted with medium sized spheres, and residues at positions with 101 and greater counts of cysteines are depicted with large spheres. The spheres are colored based on the Consurf coloring used in Figure 4. The distance between the Cα’s of two 215 residues is 37 Å, and the distance between the Cα’s of two 405 residues is 25 Å.
Figure 6 with 1 supplement
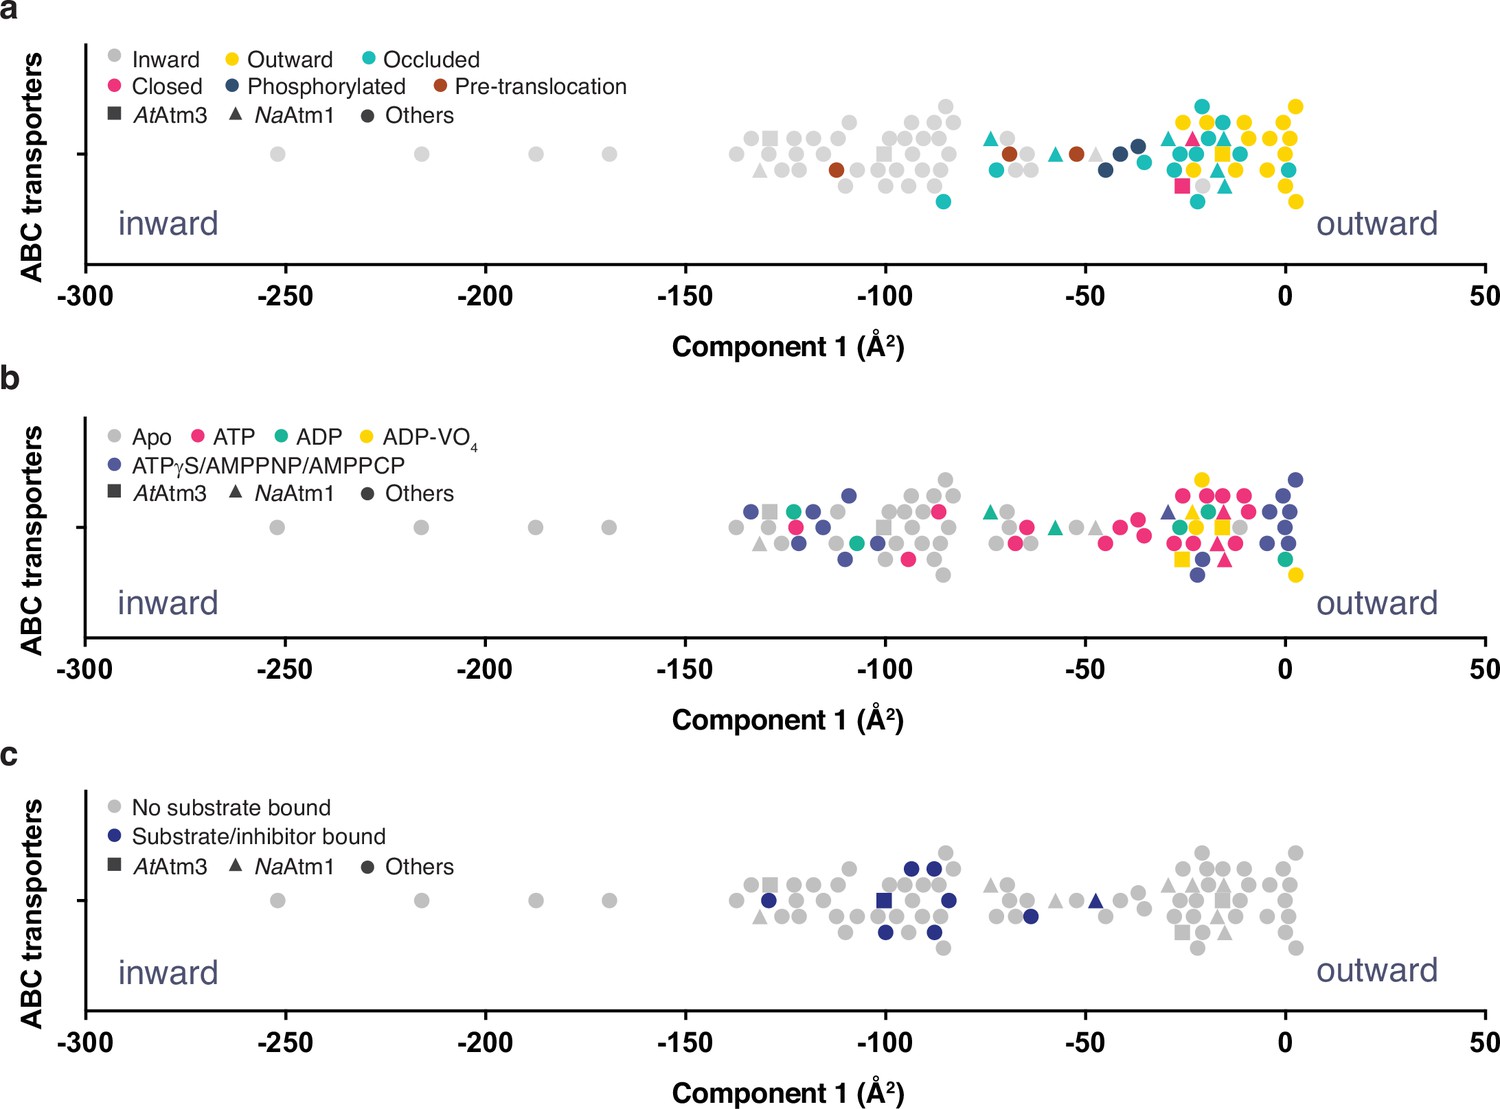
Principal component analysis (PCA) of type IV ATP binding cassette (ABC) exporters.
(a) One-dimensional plot of component 1, colored according to the conformational states assigned in the original publications. The plot is oriented with the most inward and most outward conformations to the left and right, respectively. (b) One-dimensional plot of component 1 with inward-facing to outward-facing structures, colored by their nucleotide states. (c) One-dimensional plot of component 1 with inward-facing to outward-facing structures, colored by their substrate states. Each marker (square (■), triangle (▲), circle (●)) represents a unique half-transporter structure. Squares (■) represent structures of AtAtm3, triangles (▲) represent structures of NaAtm1, and circles (●) represent structures for other ABC transporters.
Figure 6—figure supplement 1
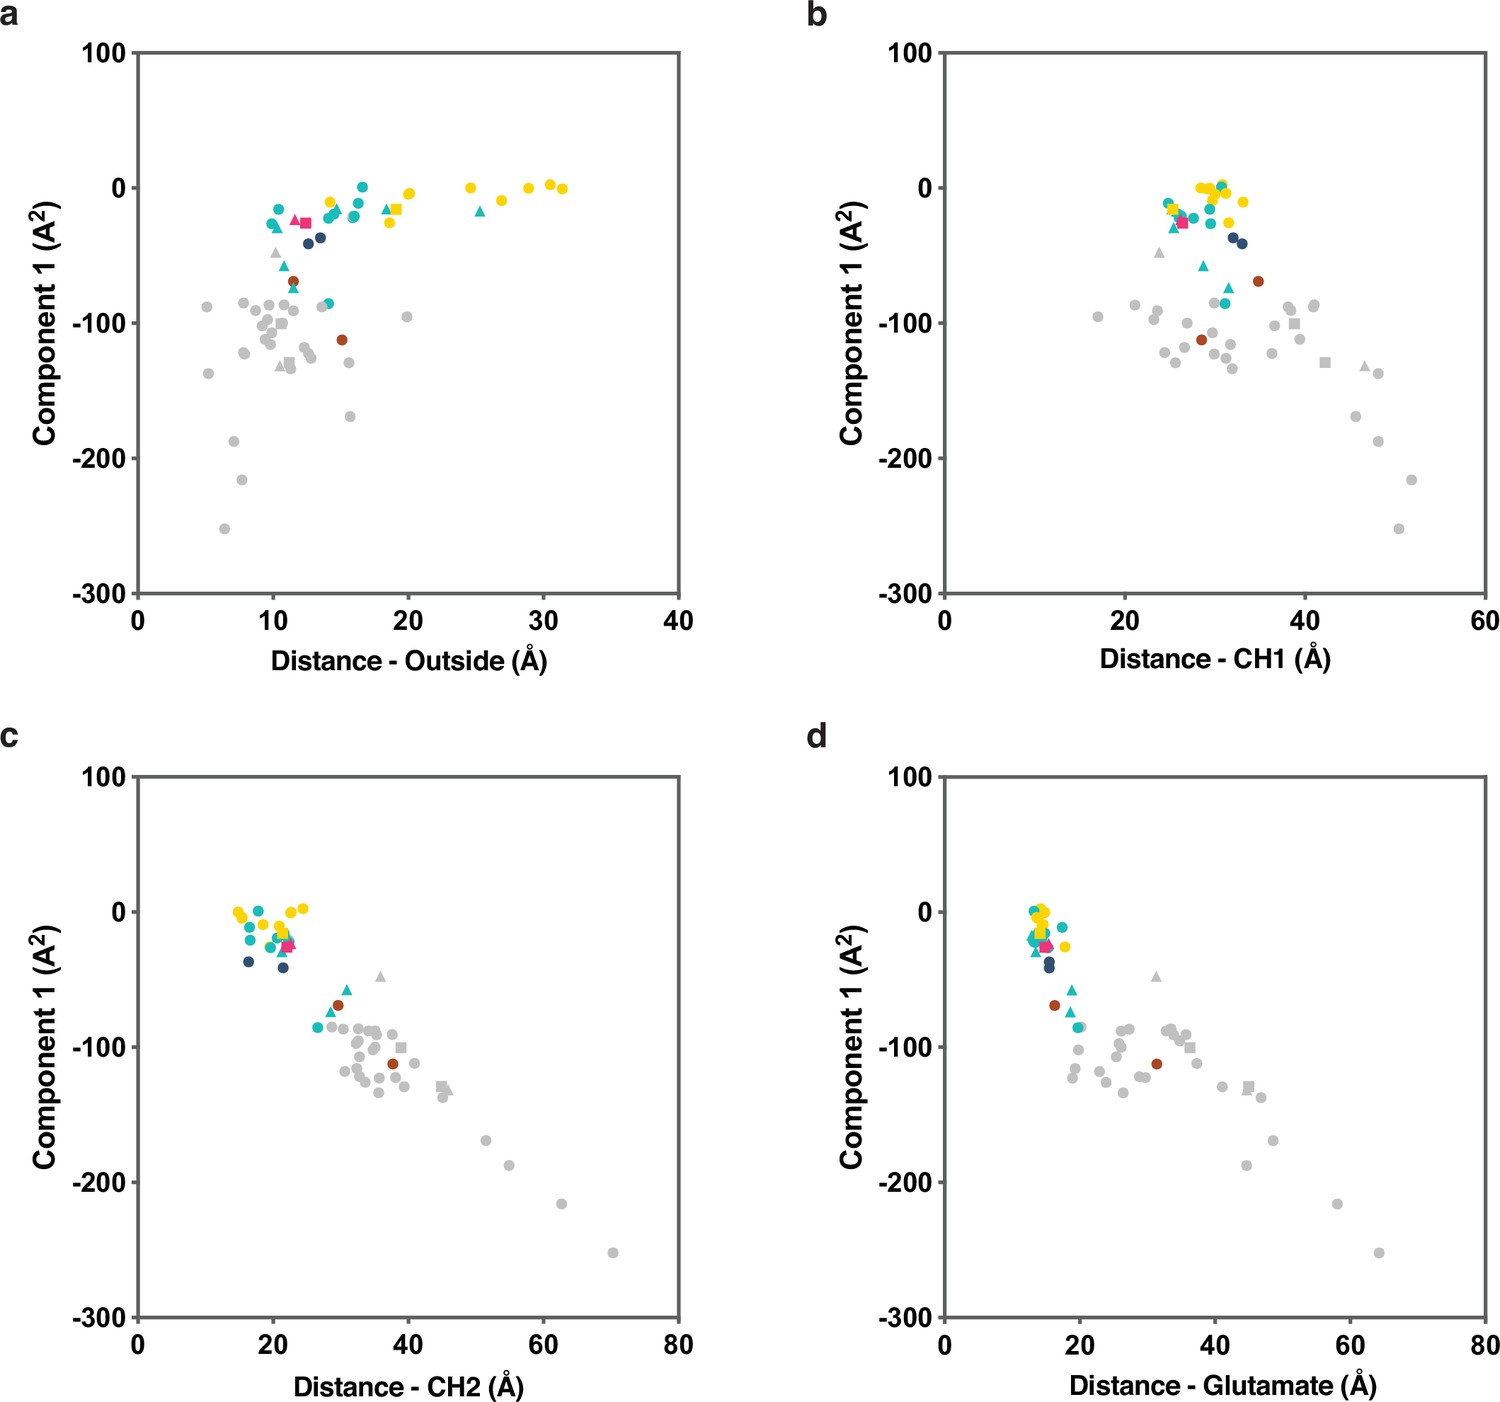
Comparison of principal component analysis (PCA) and distance measurements of ATP binding cassette (ABC) exporters.
Component 1 of PCA is plotted against the distances measured between residue pairs (a) on the ‘outside’ of the transporter, (b) from coupling helices 1, (c) from coupling helices 2, and (d) between the conserved glutamate residues after the Walker-B motif of a homodimeric/heterodimeric transporter. Residues and distance measurements are included in Supplementary file 2.
Additional files
-
Supplementary file 1
Cryo-electron microscopy (cryoEM) data collection, refinement, and validation statistics.
- https://cdn.elifesciences.org/articles/76140/elife-76140-supp1-v2.docx
-
Supplementary file 2
Principal component analysis (PCA) and distance measurements.
Calculated component 1 values in PCA are listed for different transporters. For heterologous transporters, transporter encoded in one polypeptide and transporters with different conformational states in one PDB file, ‘_A/B’ is added at the end of each PDB to represent different half-transporters and/or different conformations. Residues used for distance measurements and the corresponding distance for each transporter are listed. Grayed out cells represent distances that cannot be measured for the second half-transporters of heterodimeric transporters.
- https://cdn.elifesciences.org/articles/76140/elife-76140-supp2-v2.docx
-
Transparent reporting form
- https://cdn.elifesciences.org/articles/76140/elife-76140-transrepform1-v2.pdf
-
Source code 1
Fortran source code for the Principal Component Analysis.
- https://cdn.elifesciences.org/articles/76140/elife-76140-code1-v2.zip
Download links
A two-part list of links to download the article, or parts of the article, in various formats.
Downloads (link to download the article as PDF)
Open citations (links to open the citations from this article in various online reference manager services)
Cite this article (links to download the citations from this article in formats compatible with various reference manager tools)
Glutathione binding to the plant AtAtm3 transporter and implications for the conformational coupling of ABC transporters
eLife 11:e76140.
https://doi.org/10.7554/eLife.76140


