Brain-wide analysis of the supraspinal connectome reveals anatomical correlates to functional recovery after spinal injury
- Department of Biomedical Sciences, Marquette University, United States
- Department of Neurological Surgery, University of Miami, United States
- Helen and Robert Appel Alzheimer's Disease Research Institute, Cornell University, United States
Figures
Figure 1 with 6 supplements
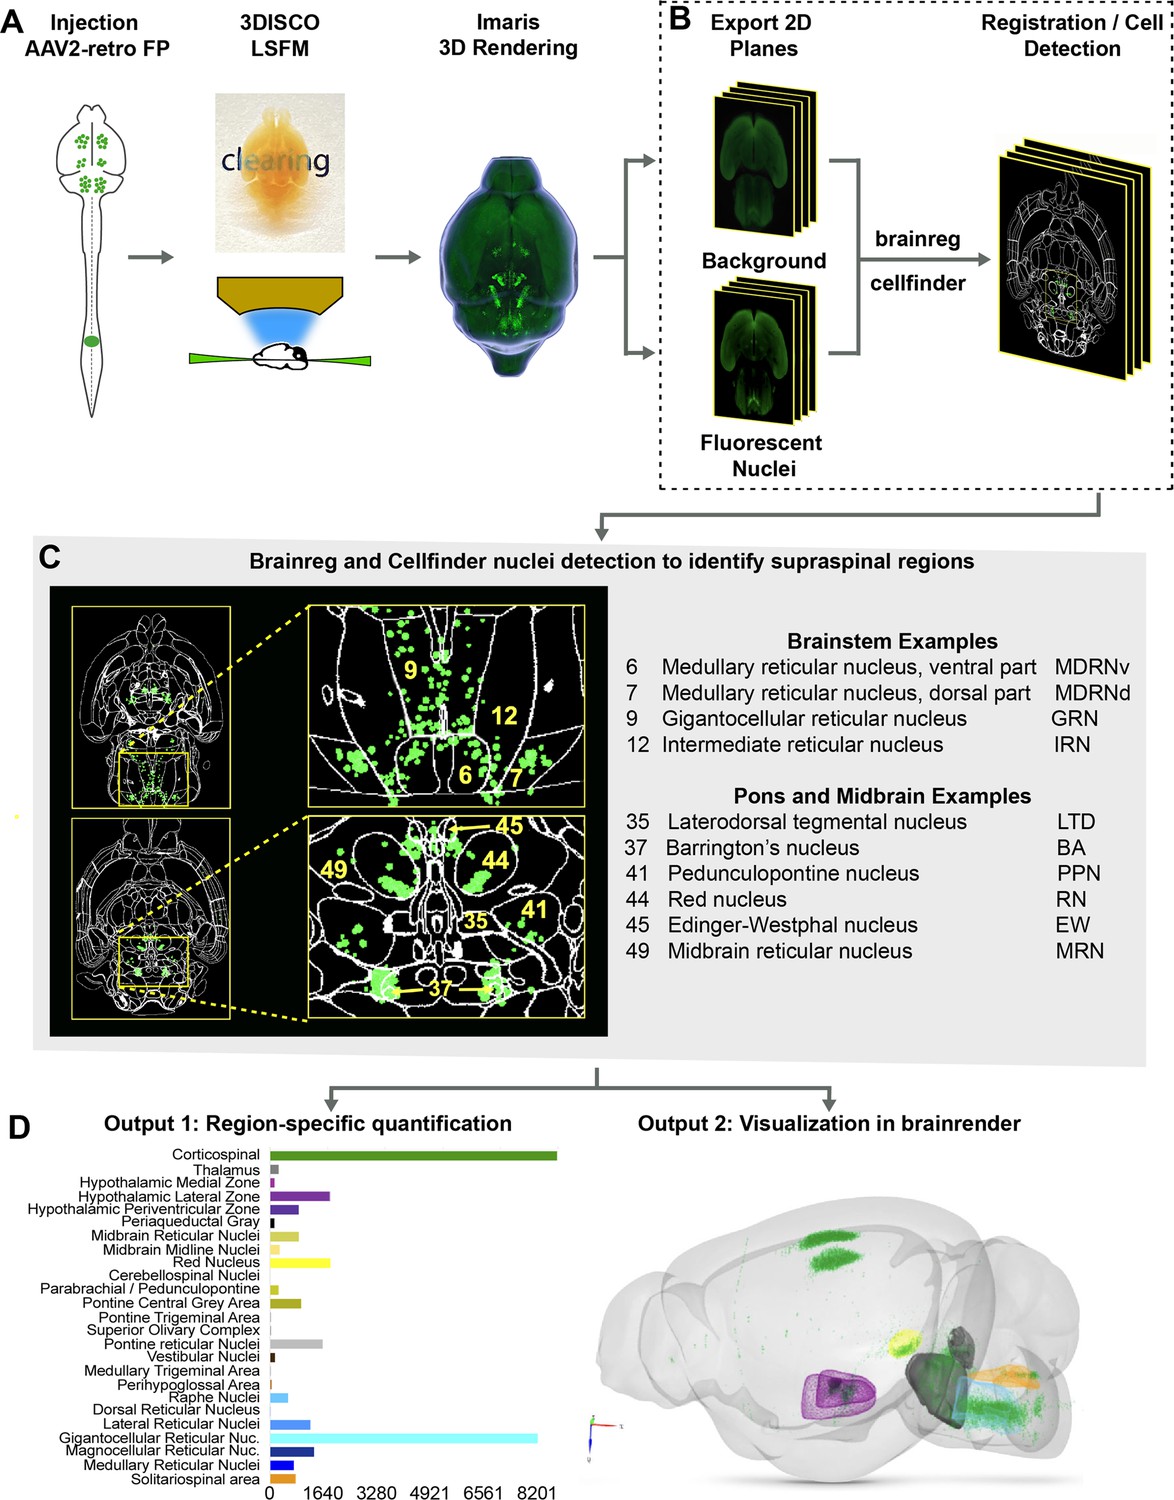
A pipeline and web resource for the detection and spatial registration of supraspinal projection neurons.
(A) Tissue preparation and initial imaging. AAV2-retro-H2B-mGL is injected to the spinal cord, followed by perfusion, tissue clearing, light sheet imaging, and 3D processing using Imaris software. (B) Image registration. A complete series of background and fluorescent nuclei images are exported for registration to standard 3D space by brainreg and cell nuclei detection by cellfinder. (C) An example of cellfinder output, showing horizontal brain sections with brain regions outlined and detected cell nuclei indicated in green. (D) Example output available at https://3Dmousebrain.com/. On the left are quantitative nuclei counts for identified brain regions, and on the right is 3D visualization of supraspinal locations generated by brainrender, an interactive Python-based tool.
Figure 1—figure supplement 1
Nuclear localization of retrograde fluorophores enhances detection of supraspinal neurons in cleared brain tissue.
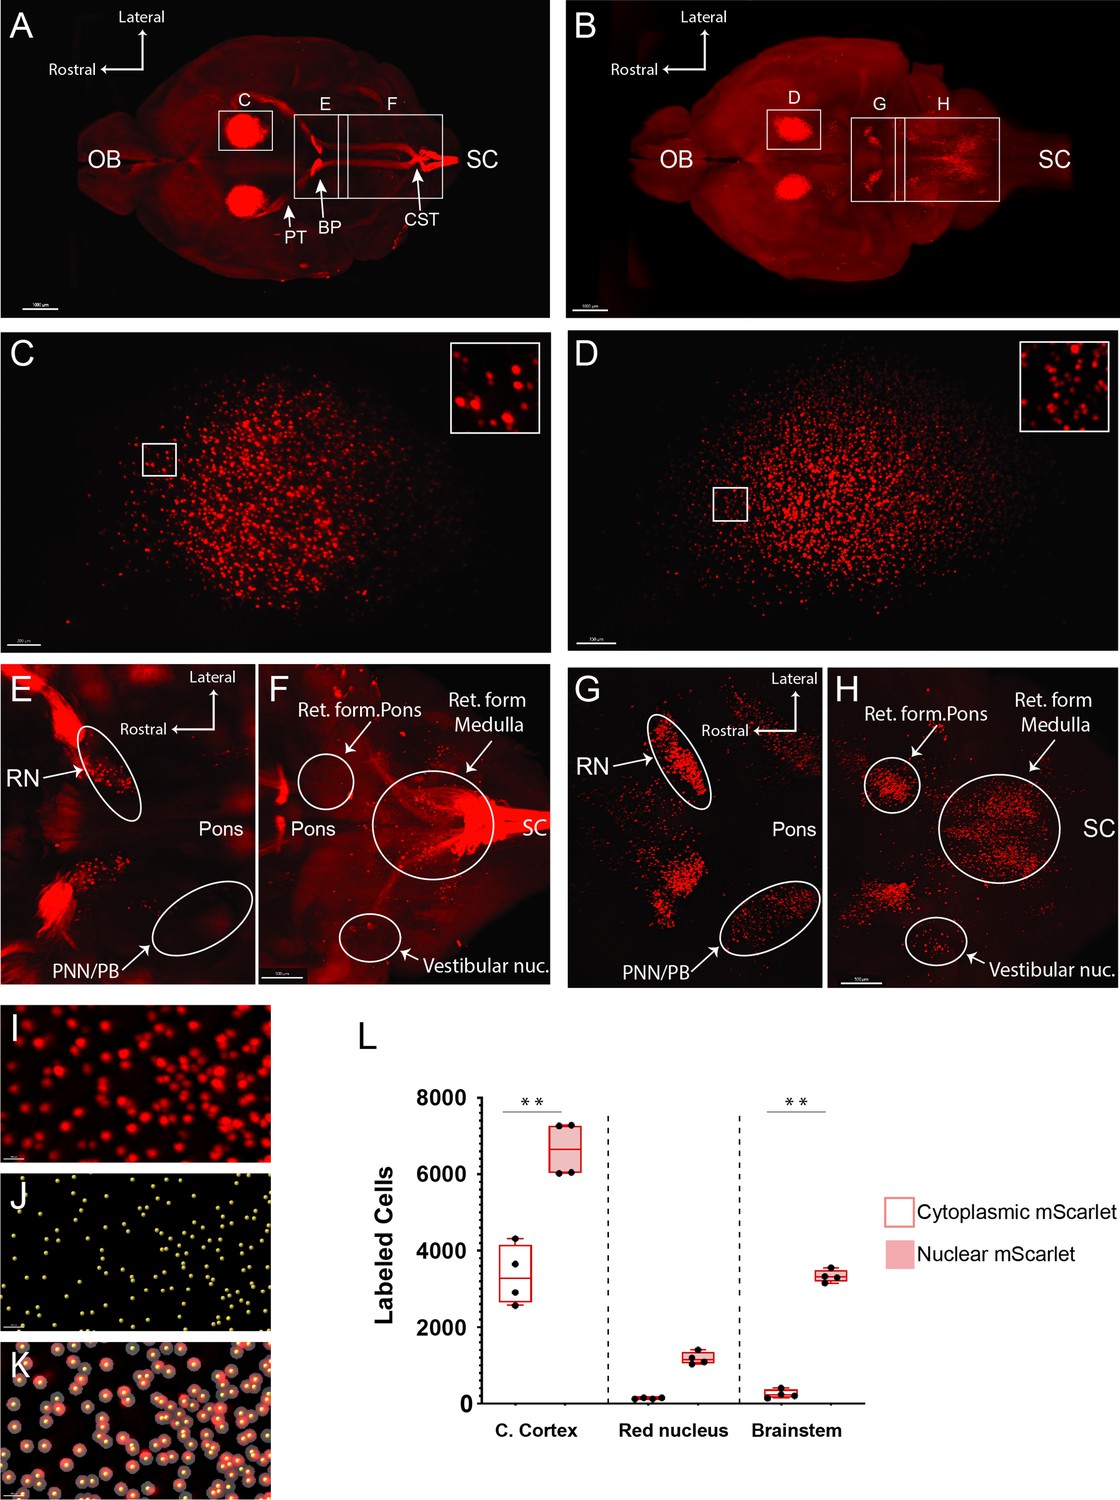
Whole brains were cleared using 3DISCO and imaged by light sheet fluorescence microscopy (LSFM) 2 weeks after lumbar injection of AAV2-retro-mScarlet or H2B-mScarlet. (A, B) Horizontal views of whole brains with cytoplasmic (A) and nuclear-localized mScarlet (B). (C, D) High-magnification views of cerebral cortex showing corticospinal tract neurons with cytoplasmic or nuclear label. Insets in (C) and (D) reveal more clearly the difference in labeling between cytoplasmic and nuclear-localized mScarlet (E, H) Horizontal views of midbrain (E, G) and brainstem (F, H). Nuclear-localized signal in (G, H) shows no interference from axon tracts and increases the number of visible cells (arrows). (I) Higher magnification of cerebral cortex neurons labeled with nuclear-localized mScarlet. (J) Yellow dots corresponding to the labeled nuclei in (I). (K) Merged (I) and (J) images. (L), Quantification of cells expressing the cytoplasmic and nuclear-localized mScarlet in cerebral cortex, red nucleus, and brainstem. Scale bar (A, B), 1000 μm; (C, D) 200 μm; (E, H), 500 μm. OB, olfactory bulb; PT, pyramidal tract; BP, basilar pons; SC, spinal cord; CST, corticospinal tract; RN, red nucleus; PNN/PB, pedunculopontine and parabrachial nuclei. **p<0.01, two-way ANOVA with post-hoc Sidak’s, N = 4 animals per group.
Figure 1—figure supplement 2

Comparison of supraspinal labeling by nuclear-localized mScarlet and mGreenLantern.
Whole brains were cleared using 3DISCO and imaged by light sheet fluorescence microscopy (LSFM) 2 weeks after lumbar co-injection of mixed AAV2-retro-H2B-mScarlet and H2B-mGreenLantern. (A) 3D lateral view of a mouse brain with the plane of image for (B) and (C) indicated. (B, C) Horizontal view of CST neurons labeled with H2B-mSc (B) or H2B-mGL (C). (D) Horizontal view of a mouse brain, with hypothalamic nuclei outlined by yellow inset. (E–H) Dorsal and coronal views of the hypothalamus with supraspinal neurons labeled by H2B-mSc (E, F) or H2B-mGL (G, H). (I) Laterodorsal view of the brain with midbrain and rostral pons outlined (yellow box). (J, K) Horizontal view of the midbrain and pons with supraspinal neurons labeled by H2B-mSc (J) or H2B-mGL (K) (L–N) Lateral view of the mouse brain with an inset outlining the brainstem and cerebellum and shown as higher magnification images in (M) for H2BmSc and (N) for H2BmGL. (O) Quantification of cells expressing nuclear-localized mSc and mGL in six identified brain regions. Detection of mGL was significantly higher in cortex, pons, and the medullary reticular formation (**p<0.01, two-wAY ANOVA with post-hoc Sidak’s). N = 7 animals. Scale bar (E, G) 700 μm; (J, K) 400 μm; (M, N) 400 μm. HYP, hypothalamus; PVH, paraventricular hyp. nucleus; PVHd, paraventricular hyp. descending; LH, lateral hypothalamus; VMH, ventromedial hyp. nucleus; RN, red nucleus; PR, pons reticular formation; PAG, periaqueductal gray; MRN, midbrain reticular nucleus; EW, Edinger–Westphal nucleus; INC, interstitial nucleus of Cajal; ND, nucleus of Darkschewitsch; IP, interposed nucleus; FG, fastigial nucleus; LAV, lateral vestibular nucleus; NST, nucleus of solitary tract; SC, spinal cord. Scale bars are 1 mm.
Figure 1—figure supplement 3
Detection of supraspinal neurons is similar across the midline and maximal by 2 weeks post-injection.
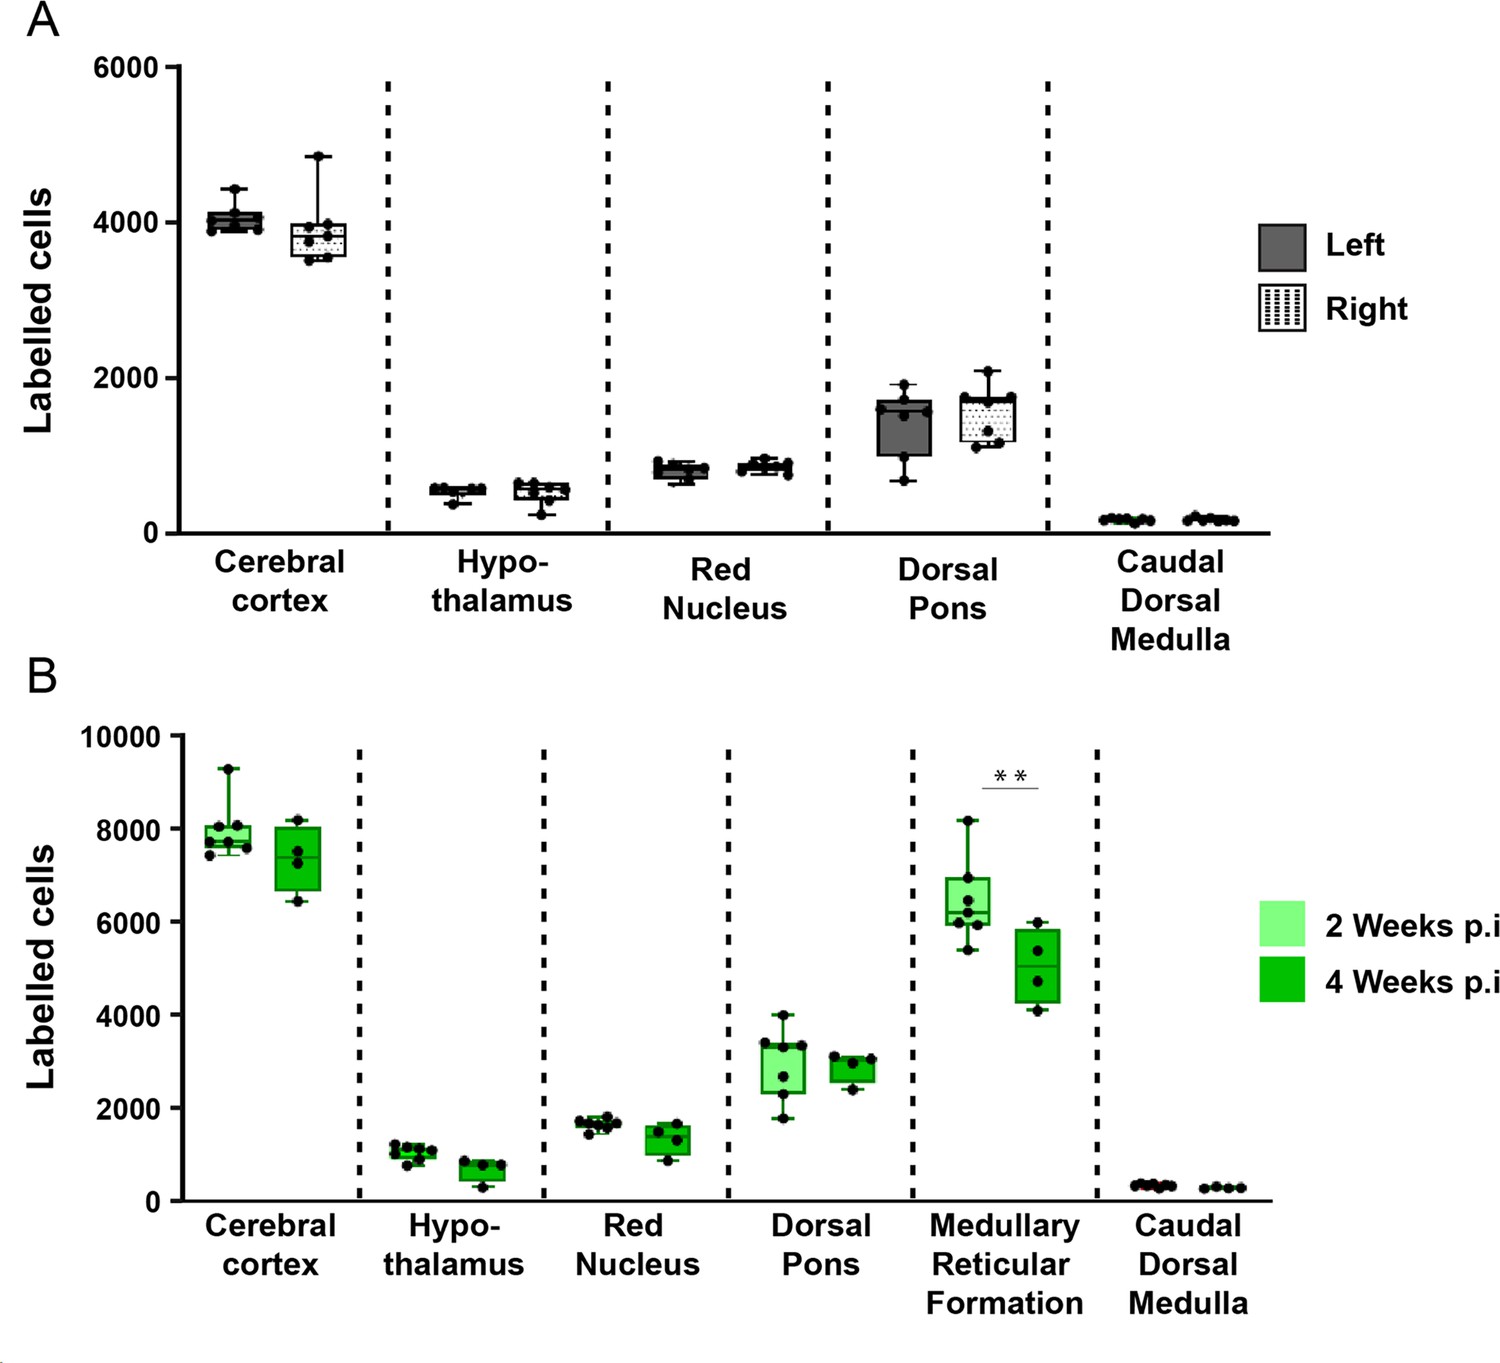
(A) Adult mice received lumbar injection of AAV2-Retro-H2B-mGL, followed 2 weeks later by brain tissue clearing, light sheet fluorescence microscopy (LSFM) imaging, and spot detection in Imaris software. The number of detected nuclei did not differ significantly on the right versus left side in any of the analyzed brain regions (p>0.05, paired t-test; N = 7 animals). (B) Adult mice received lumbar injection of AAV2-retro-H2B-mGL and survived either 2 or 4 weeks, followed by brain tissue clearing, LSFM imaging, and spot detection in Imaris software. The number of detected nuclei was not significantly elevated in any of the analyzed brain regions at 4 weeks compared to 2 weeks (p>0.05, one-tailed t-test; N = 7 at 2 weeks, 4 at 4 weeks).
Figure 1—figure supplement 4
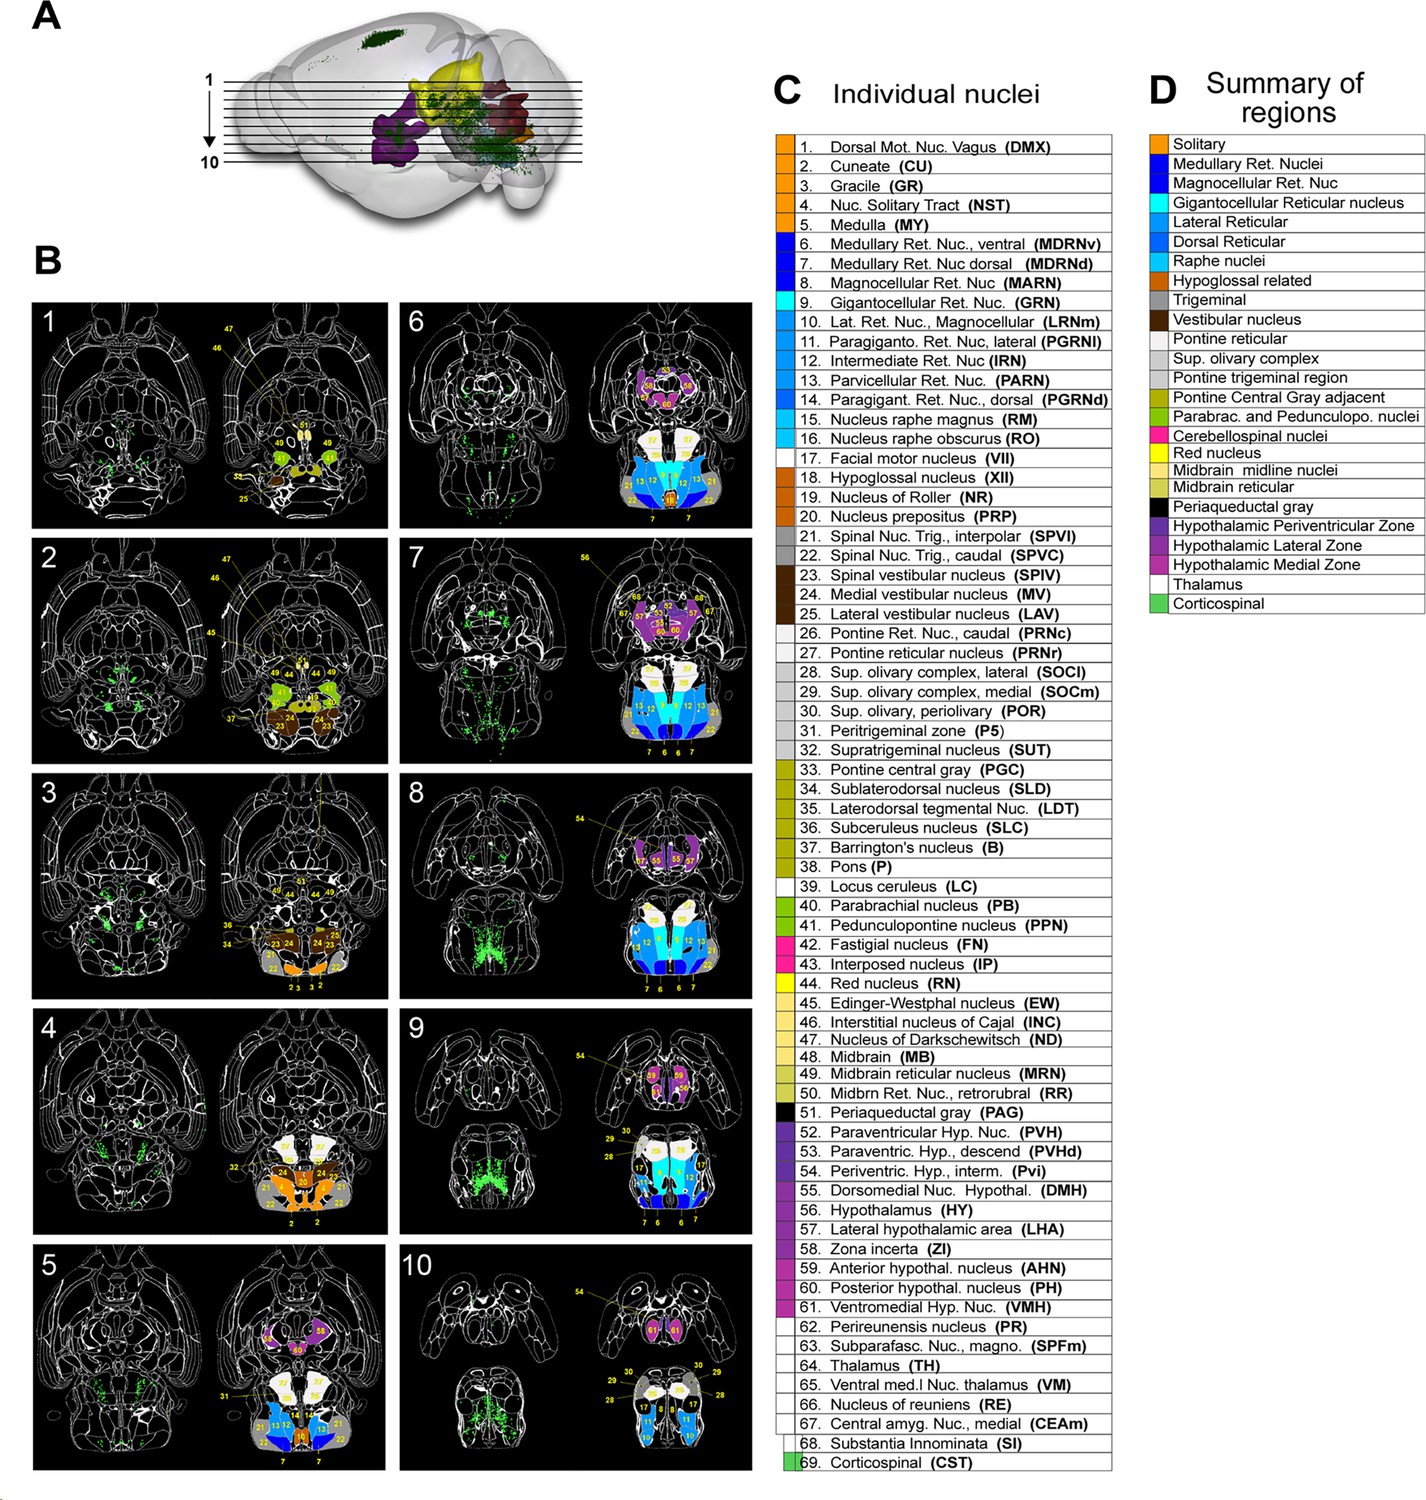
3D imaging followed by image registration and nuclei detection by cellfinder and brainreg identifies brain regions containing supraspinal projection neurons.
(A) Brainrender visualization of a mouse brain after lumbar injection of AAV2-retro-H2B-mGL, 3D imaging, registration, and nuclei detection. Detected nuclei are shown in green and selected brain regions indicated by color. Horizontal lines indicate the planes of images presented in (B). (B) Horizontal sections produced by cellfinder, with detected nuclei shown in green, identified brain regions outlined in white, and supraspinal regions coded by colors and numbers corresponding to the key shown in (C). Section 1 is most dorsal and section 10 most ventral. (C) A key that links color and number to the full name and abbreviation of 69 identified supraspinal brain regions. (D) A list of summary regions, in which adjacent supraspinal regions are combined for simplified analysis.
Figure 1—figure supplement 5
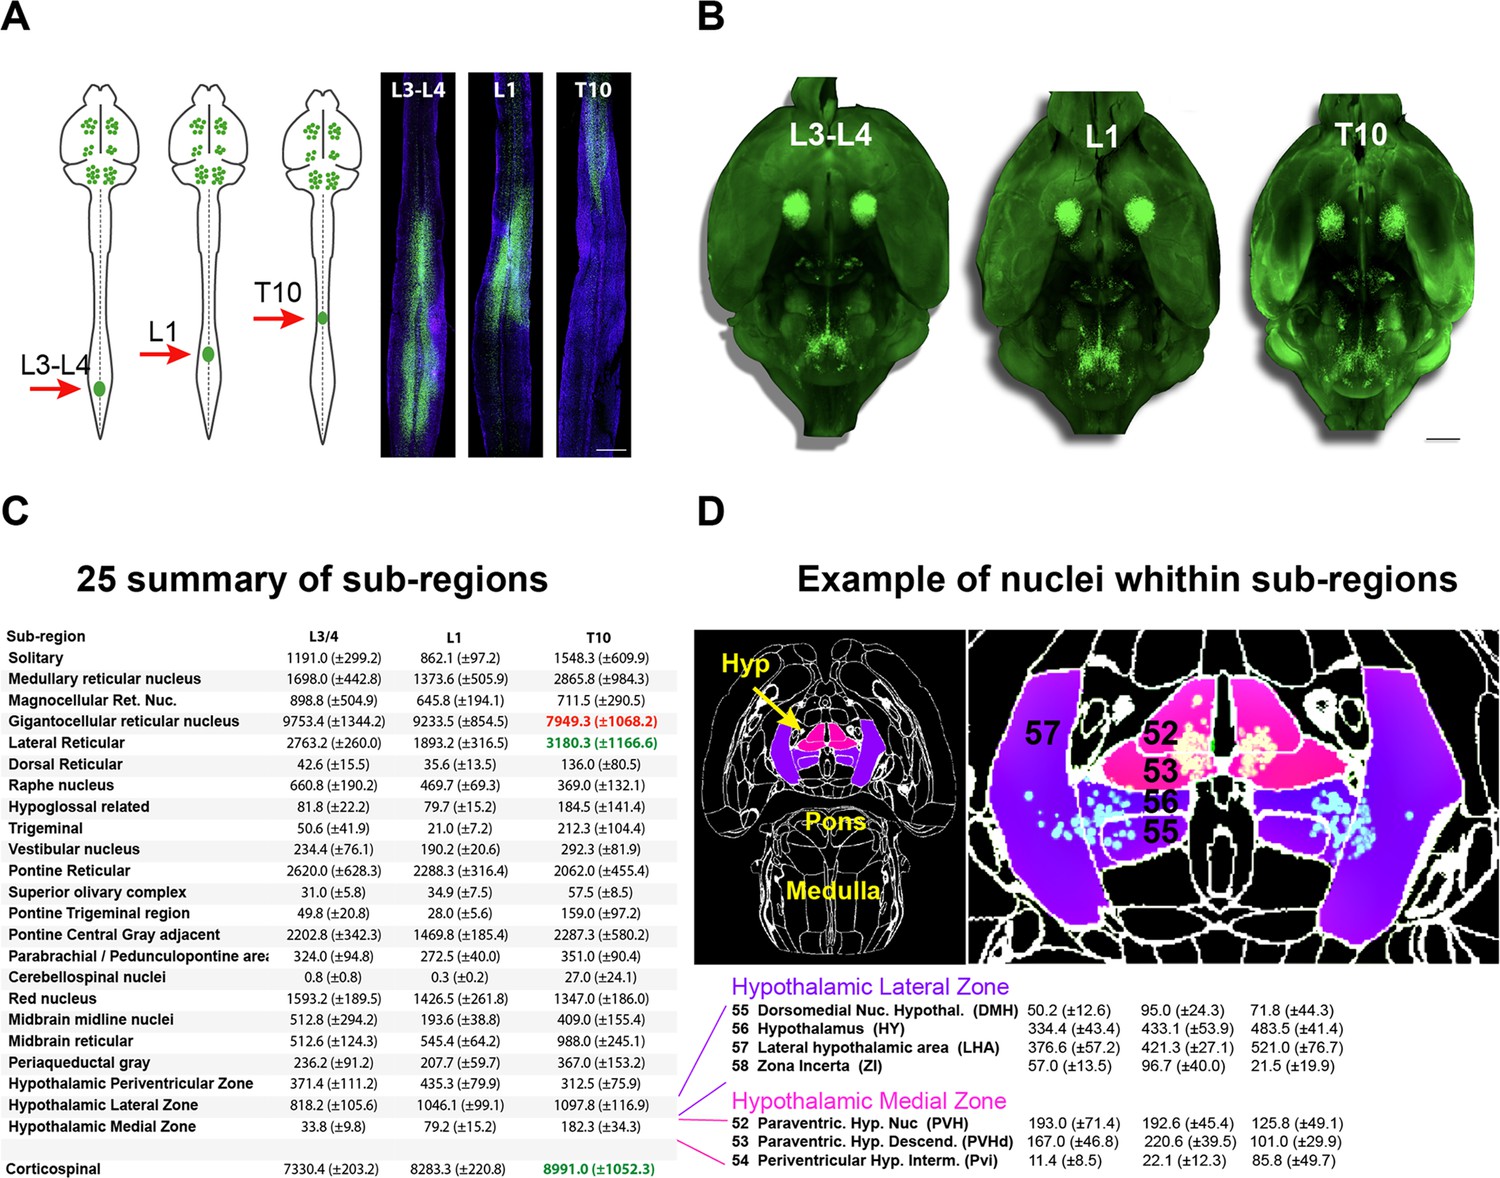
Registration of mouse brains injected at T10, L1, and L3-4 shows a similar pattern of labeled supraspinal neurons.
(A) AAV2-retro-H2B-mGL was injected into the SC at the indicated levels (red arrows). Two weeks later, animals were sacrificed and horizontal sections of spinal cord prepared, with green nuclear-localized label confirming appropriate targeting of injections. (B) 3D horizontal views of cleared and imaged brains of the same animals as in (A), showing qualitatively similar distribution of supraspinal neurons (green label). (C) Quantitative assessment of defined supraspinal regions using cellfinder shows similar counts in all but three regions. Green text marks significant elevation and red significant reduction (p<0.05, two-way ANOVA with Tukey’s multiple comparison, N = 4 animals). (D) An example of nuclei localization and counts within subregions of the brain using brainreg and cellfinder, highlighting the hypothalamic lateral zone and medial zone. Scale bars are 1 mm.
Figure 1—video 1
A video illustrating the improvement in the detection of supraspinal cells by retrograde labeling using nuclear-localized mGreenLantern versus cytoplasmic mScarlet.
Figure 2 with 1 supplement
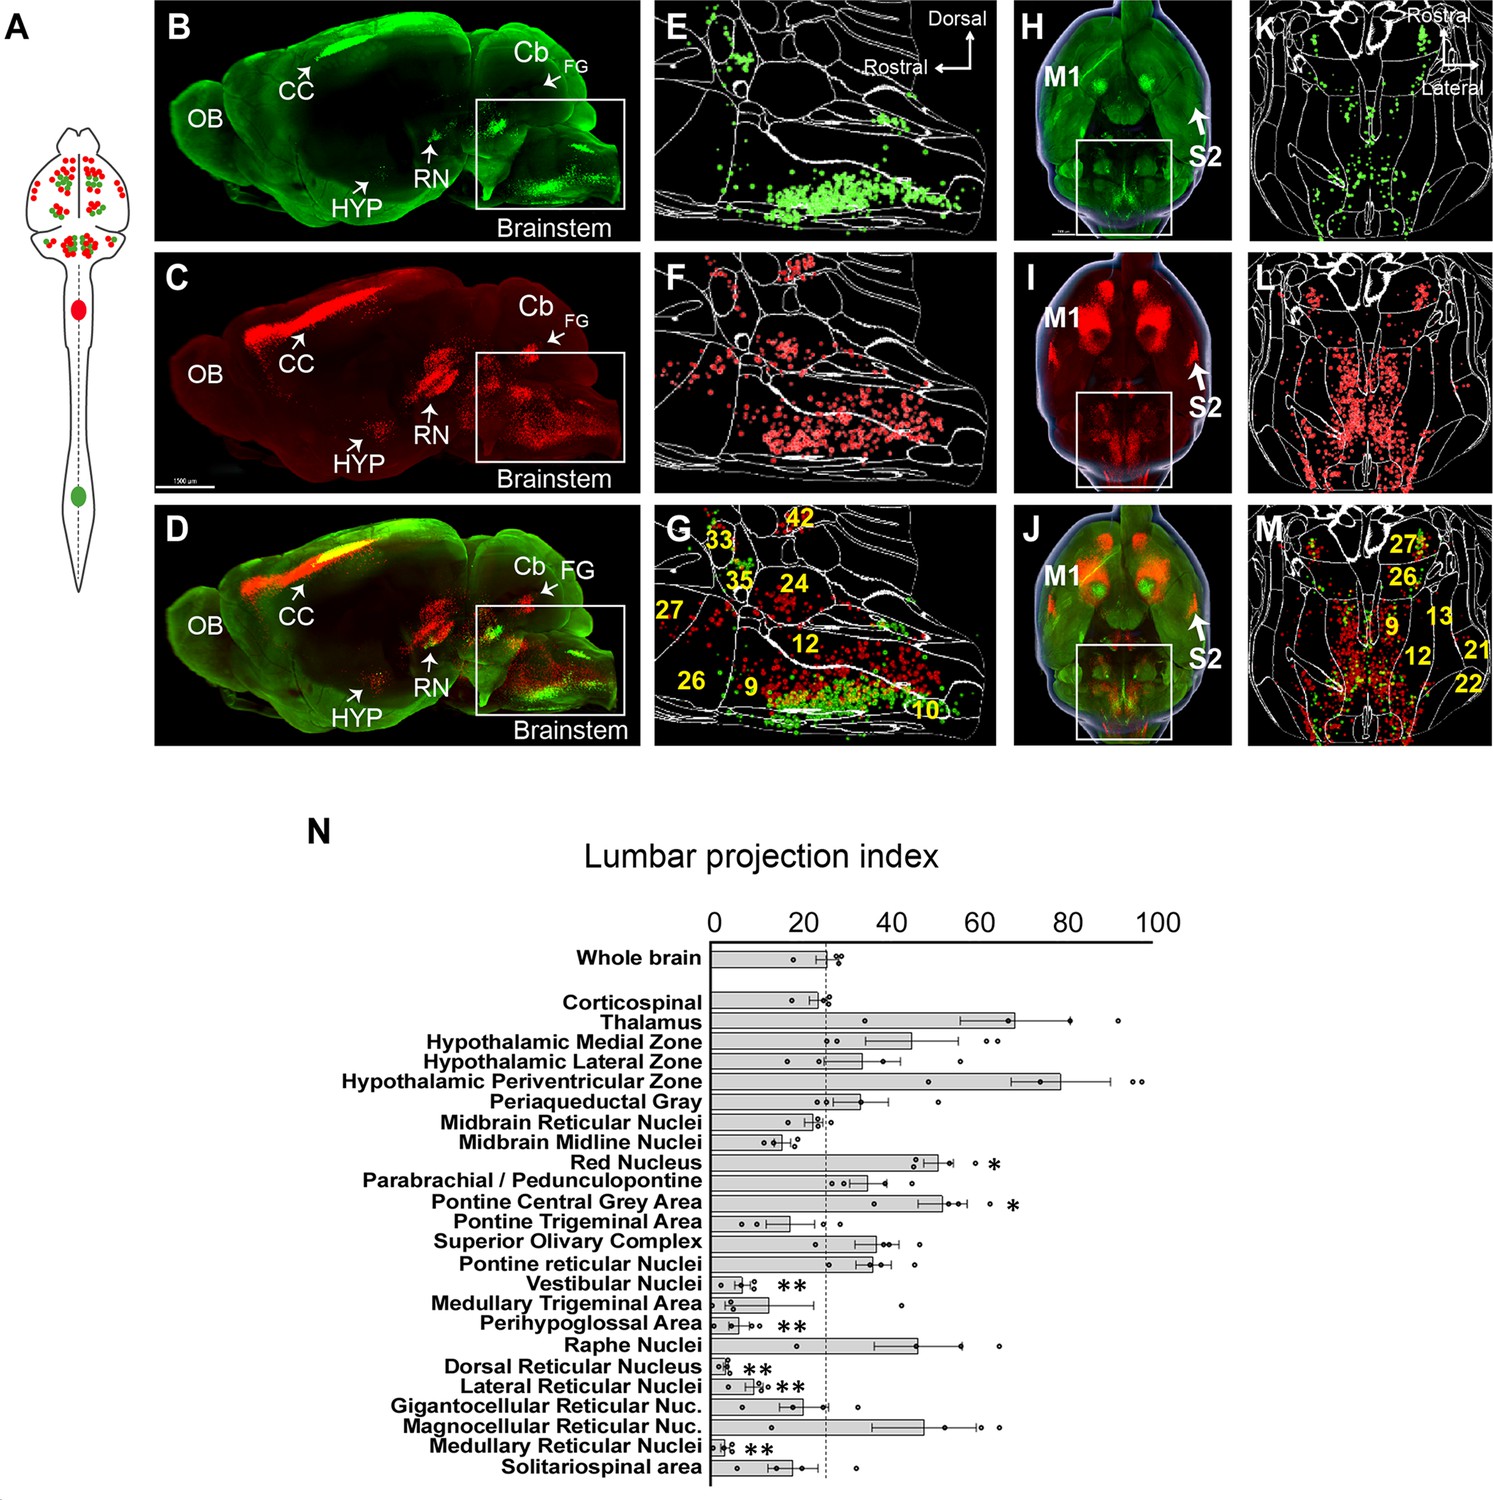
A brain-wide quantitative comparison of cervical and lumbar-projecting supraspinal neurons.
(A) Experimental approach. AAV2-retro-H2B-mSc and mGL were delivered to C4 and L1 SC, respectively, followed 4 weeks later by brain clearing, light sheet microscopy, registration, and quantification. (B–G) Lateral view of brain and cellfinder output from brainstem regions. (B, E) show H2B-mGL (lumbar), (C, F) show H2B-mSc (cervical), and (D, G) show the overlay. Note the greater abundance of cervical signal in dorsal brainstem. (H–M) Horizontal brain views and cellfinder output of the same animals as (B–G). (H, K) show H2B-mGL (lumbar), (I, L) show H2B-mSc (cervical), and (J, M) show the overlay. Note the relative abundance of cervical label in more lateral brainstem. (N) Quantification of the lumbar projections with the number of lumbar-projecting neurons in each brain region normalized to the total number of supraspinal nuclei detected in that region. Some regions differ significantly from the overall average of the brain. **p<0.01, one-way ANOVA with post-hoc Sidak’s. N = 4 animals. Scale bar (B–D) 1500 μm; (H–J) 1000 μm; (O) left pictures 1000 μm, middle 500 μm, right 30 μm. n = 4 biological replicates per group. OB, olfactory bulb; CC, cerebral cortex; M1, motor area 1; HYP, hypothalamus; RN, red nucleus; Cb, cerebellum; FG, fastigial nucleus; P, pons; M. medulla. Scale bars are 1 mm, except 100 µm in 0 panel 2.
Figure 2—figure supplement 1
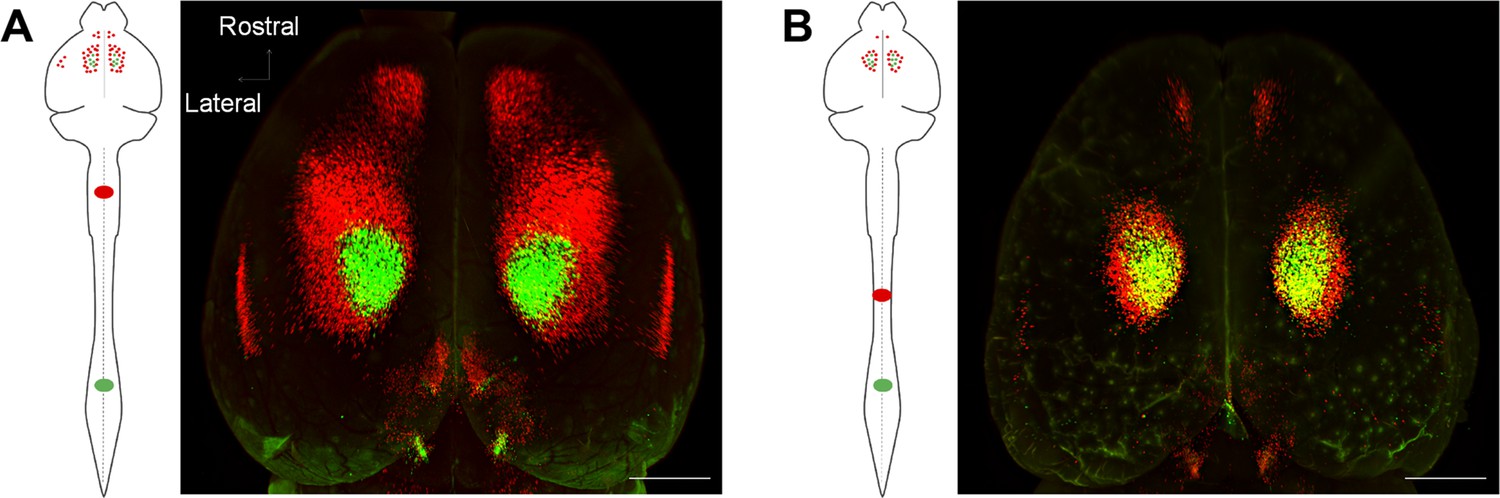
Topographic mapping of the corticospinal projection is arranged as concentric rings with caudal projections interior.
(A) Adult mice received lumbar (L1) injection of AAV2-retro-H2B-mGL and C4 injection of AAV2-retro-H2B-mSc, followed 2 weeks later by tissue clearing and imaging. A dorsal view of cortex shows lumbar label (green) completely surrounded by cervical (red). (B) Adult mice received lumbar (L1) injection of AAV2-retro-mGL and thoracic (T10) injection of AAV2-retro-mSc, followed 2 weeks later by tissue clearing and imaging. A dorsal view of cortex shows lumbar label (green) surrounded by a narrow rim of thoracic label. Comparing (A) to (B) indicates a pattern of concentric and overlapping zones of projection to progressively more caudal targets in the spinal cord. Scale bars are 1 mm.
Figure 3 with 5 supplements
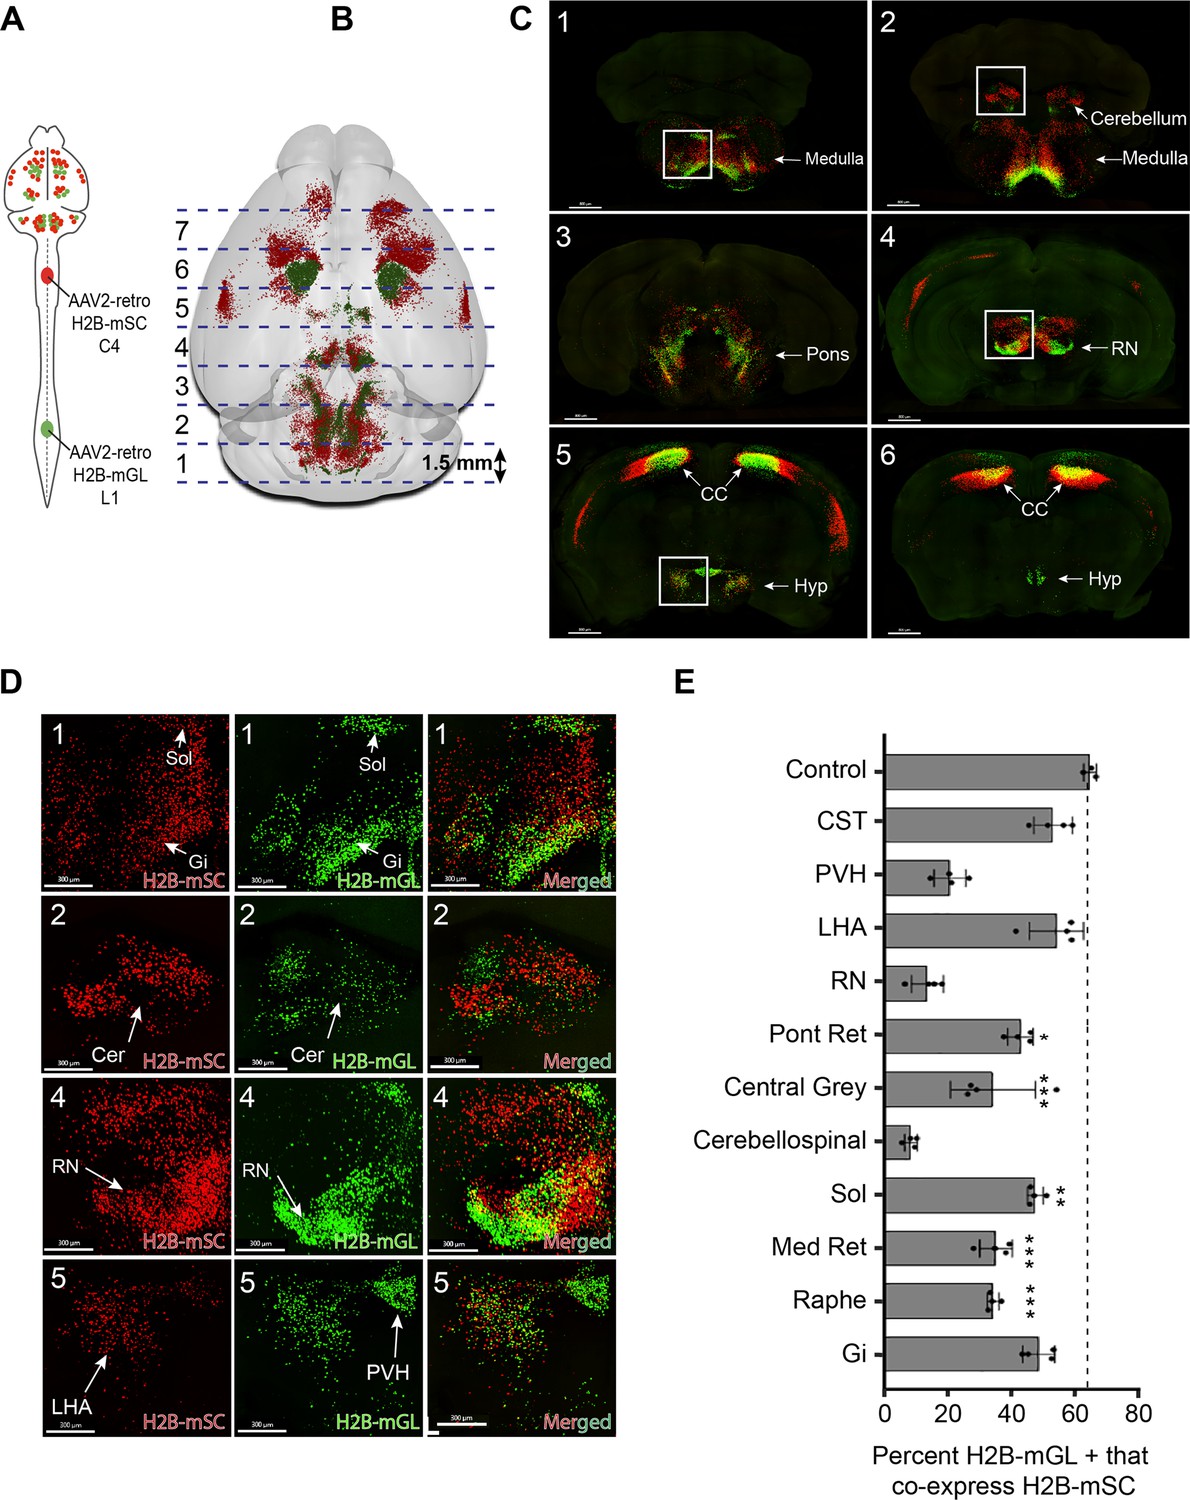
3D confocal microscopy reveals rates of dual cervical/lumbar targeting in various supraspinal regions.
(A, B) Experimental approach. AAV2-retro-H2B-mSc and mGL were delivered to C4 and L1 SC, respectively, followed 3 weeks later by preparation of 1.5 mm sections, tissue clearing, imaging by spinning disk confocal microscopy, spot detection, and quantification. Dotted lines show the approximate locations of slice preparation. (C) Coronal views of the corresponding sections imaged by confocal microscopy. Insets indicate higher magnifications in (D). (D) Higher magnification of specific regions from sections 1, 2, 4, and 5. Left panels show H2B-mSC-positive nuclei, middle panels show H2B-mGL nuclei, and the right panel shows merged images. (E) Quantification of the percent of lumbar projecting (H2B-mGL+) nuclei that co-express H2B-mSc in selected brain regions compared to control animals that receive co-injection of H2B-mSc and H2B-mGL to lumbar spinal cord. OB, olfactory bulb; CC, cerebral cortex; M1, motor area 1; HYP, hypothalamus; RN, red nucleus; Cb, cerebellum; Sol, solitary nucleus; Pons, pons; LHA, lateral hypothalamus; PVH, paraventricular hypothalamus. **** p<0.0001, one-way ANOVA with post-hoc Sidak’s. N = 4 biological replicates per group. Scale bars (C) 800 μm; (D) 300 μm.
Figure 3—figure supplement 1
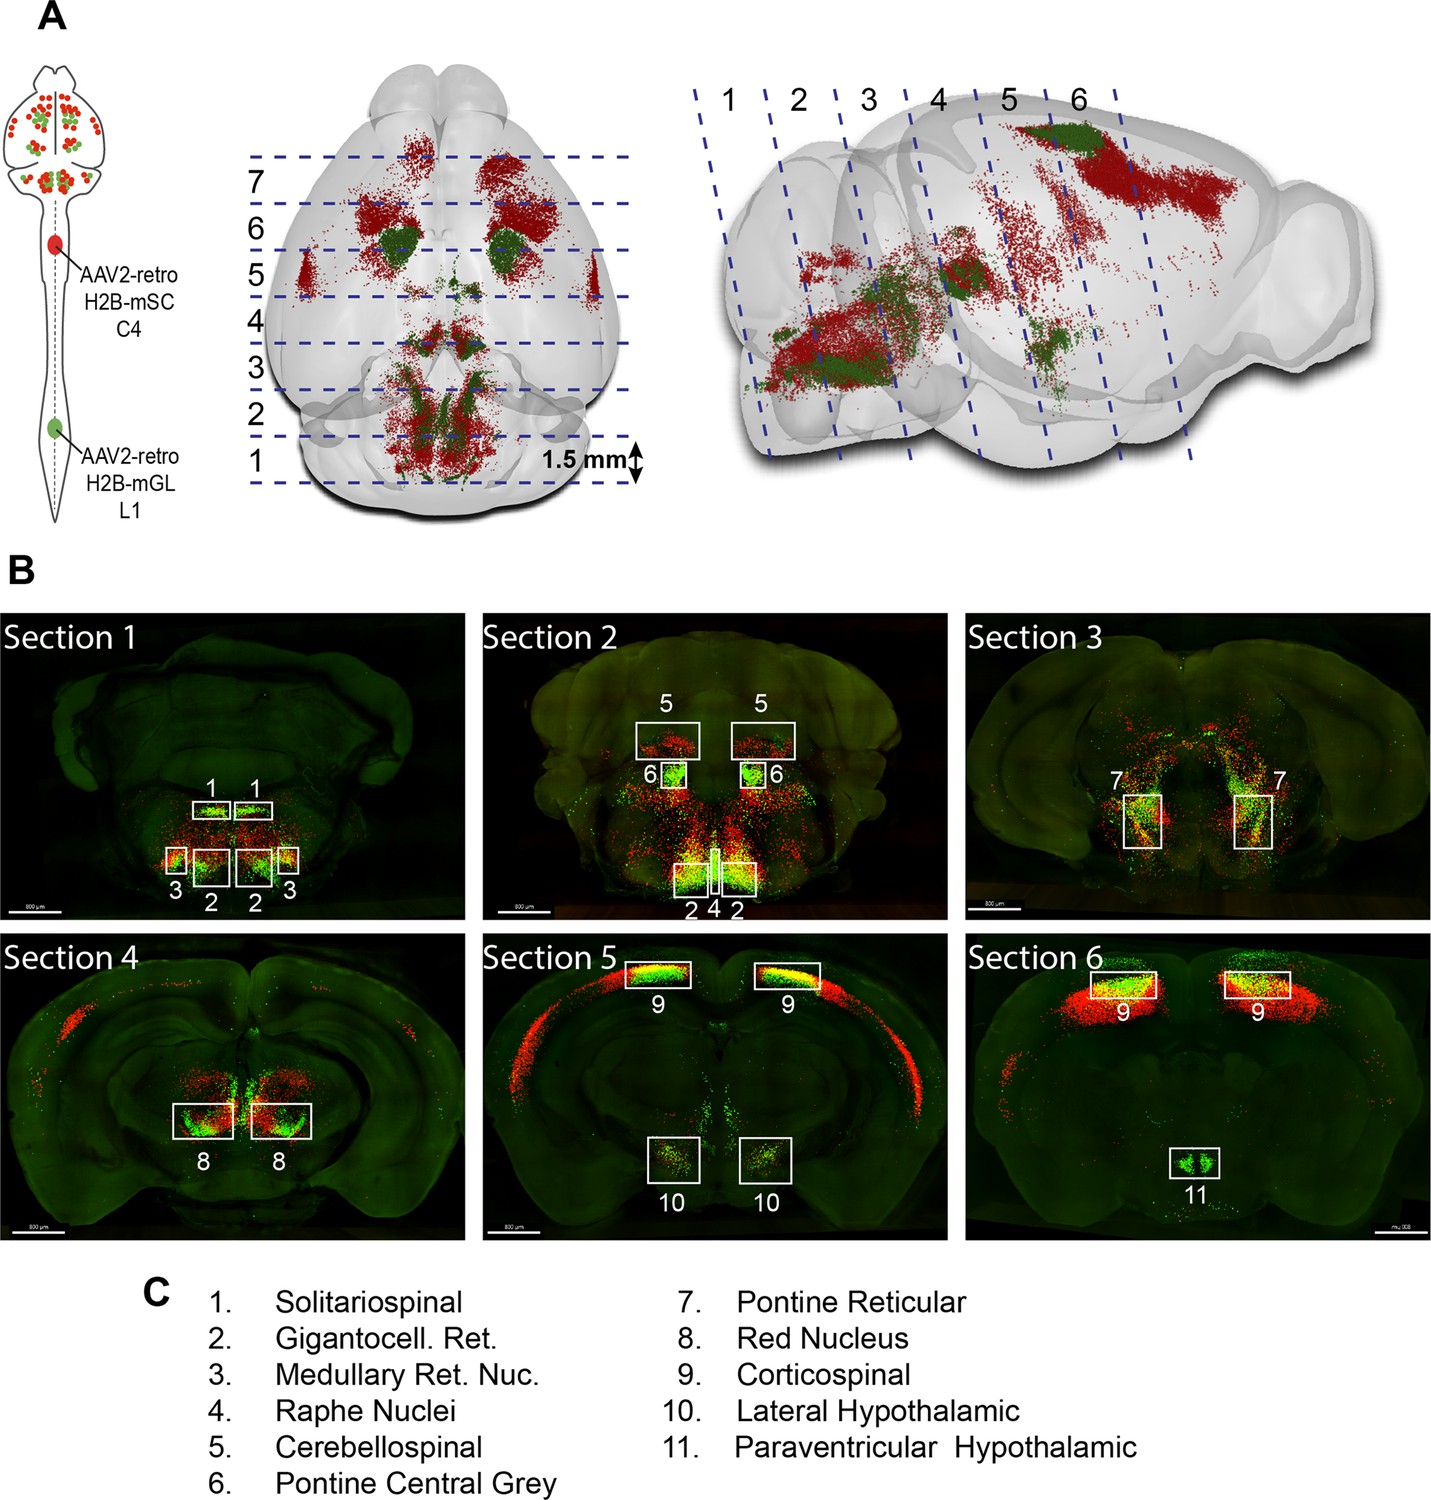
Selection of supralumbar regions for quantification of dual lumbar/cervical innervation.
Adult mice received lumbar (L1) injection of AAV2-retro-H2B-mGL and cervical (C4) injection of AAV2-retro-H2B-mSc, followed 3 weeks later by perfusion and preparation of 1.5-mm-thick brain sections in the transverse plane. (A) Horizontal and lateral brainrender mouse brains with dotted lines indicating the approximate cuts of sections 1–6. (B) The six brain sections were cleared with 3DISCO and imaged by confocal fluorescent microscopy. Boxes with numbers indicate the specific brain regions in (C) in which the numbers of cell nuclei that expressed H2B-mGL, H2B-mSc, or both were counted.
Figure 3—figure supplement 2
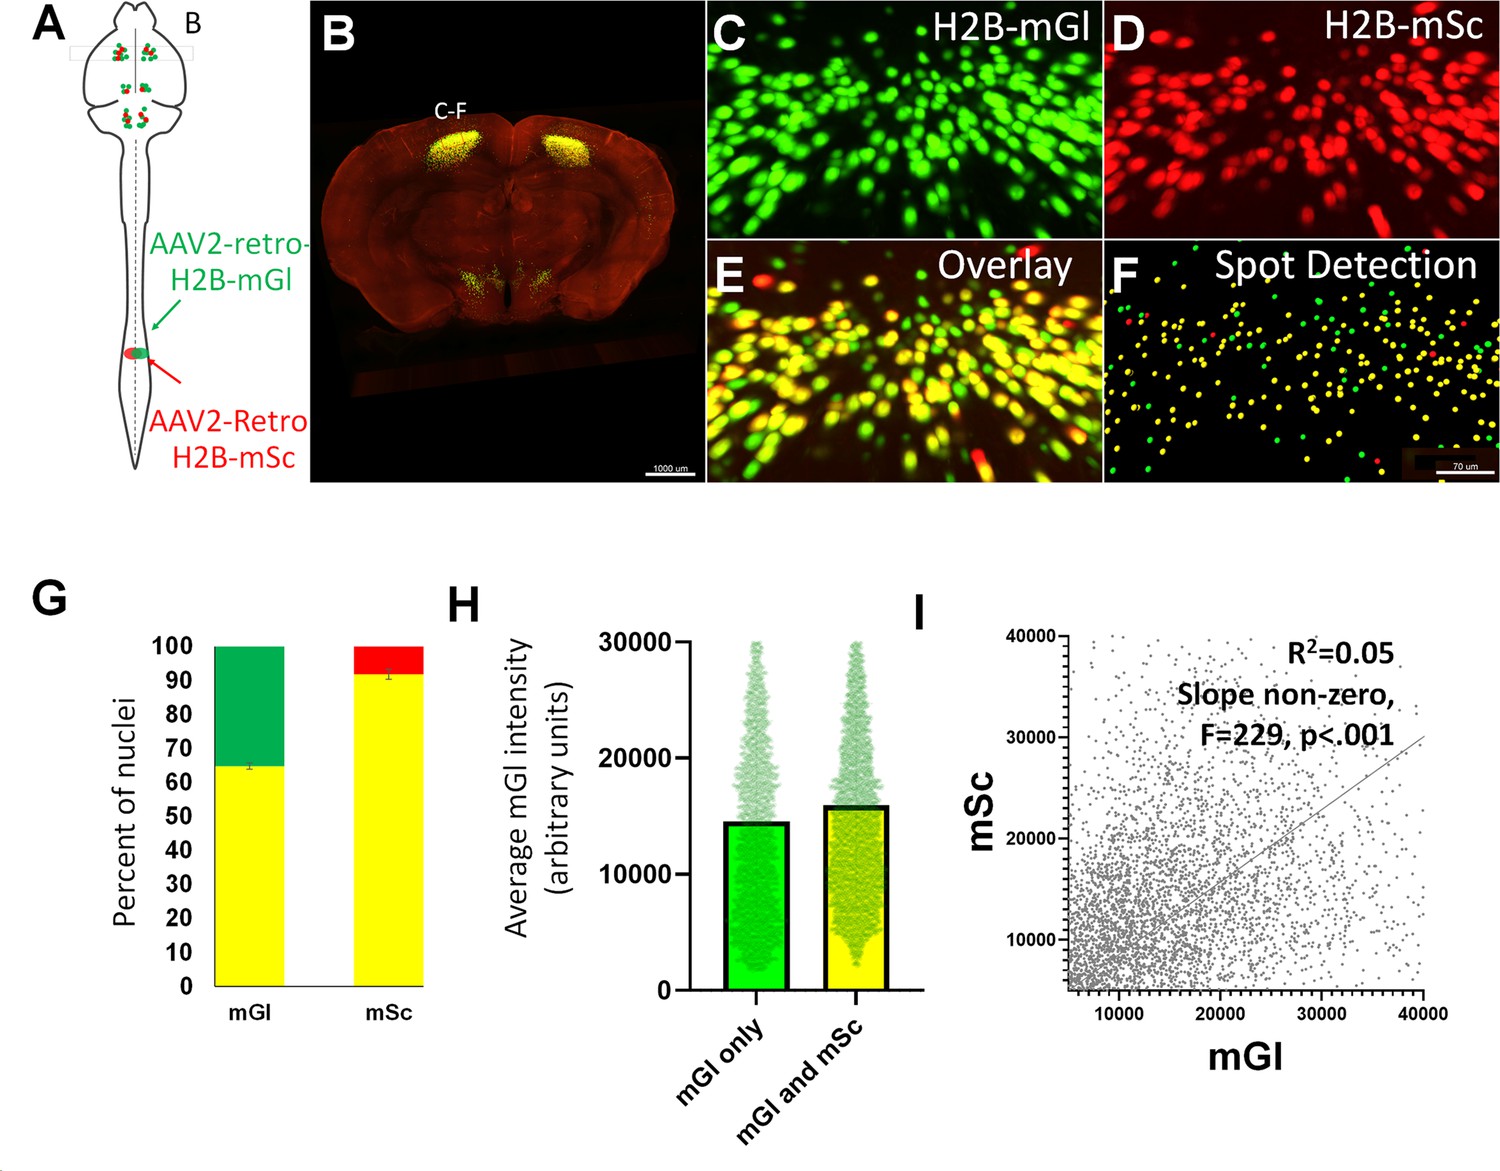
Quantification of retrograde co-expression of AAV2-Retro injected to the same spinal level.
(A) Adult mice received lumbar (L1) injection of both AAV2-retro-H2B-mGL and AAV2-retro-H2B-mSc, followed 2 weeks later by perfusion and 3D imaging of 2-mm-thick brain sections. (C–E) show individual CST nuclei retrogradely labeled with H2B-mGL, H2B-mSc, or both. (D) Spot detection and co-localization analyses in Imaris detect single-labeled (green or red) and double-labeled (yellow) nuclei. Note that H2B-mGL labels a greater number of nuclei than H2B-mSc. (G) Quantification of the percent of nuclei that express H2B-mGL that also express H2B-mSc (left bar) and the percent of H2B-mSc+ nuclei that also express H2B-mGL. (H) Quantification reveals similar average intensity in nuclei in which only H2B-mGL is detected compared to nuclei in which both H2B-mGL and H2B-mSc are detected. (I) Regression analysis reveals a significant positive correlation in the average signal intensity (linear regression, N = 3997 cells).
Figure 3—figure supplement 3
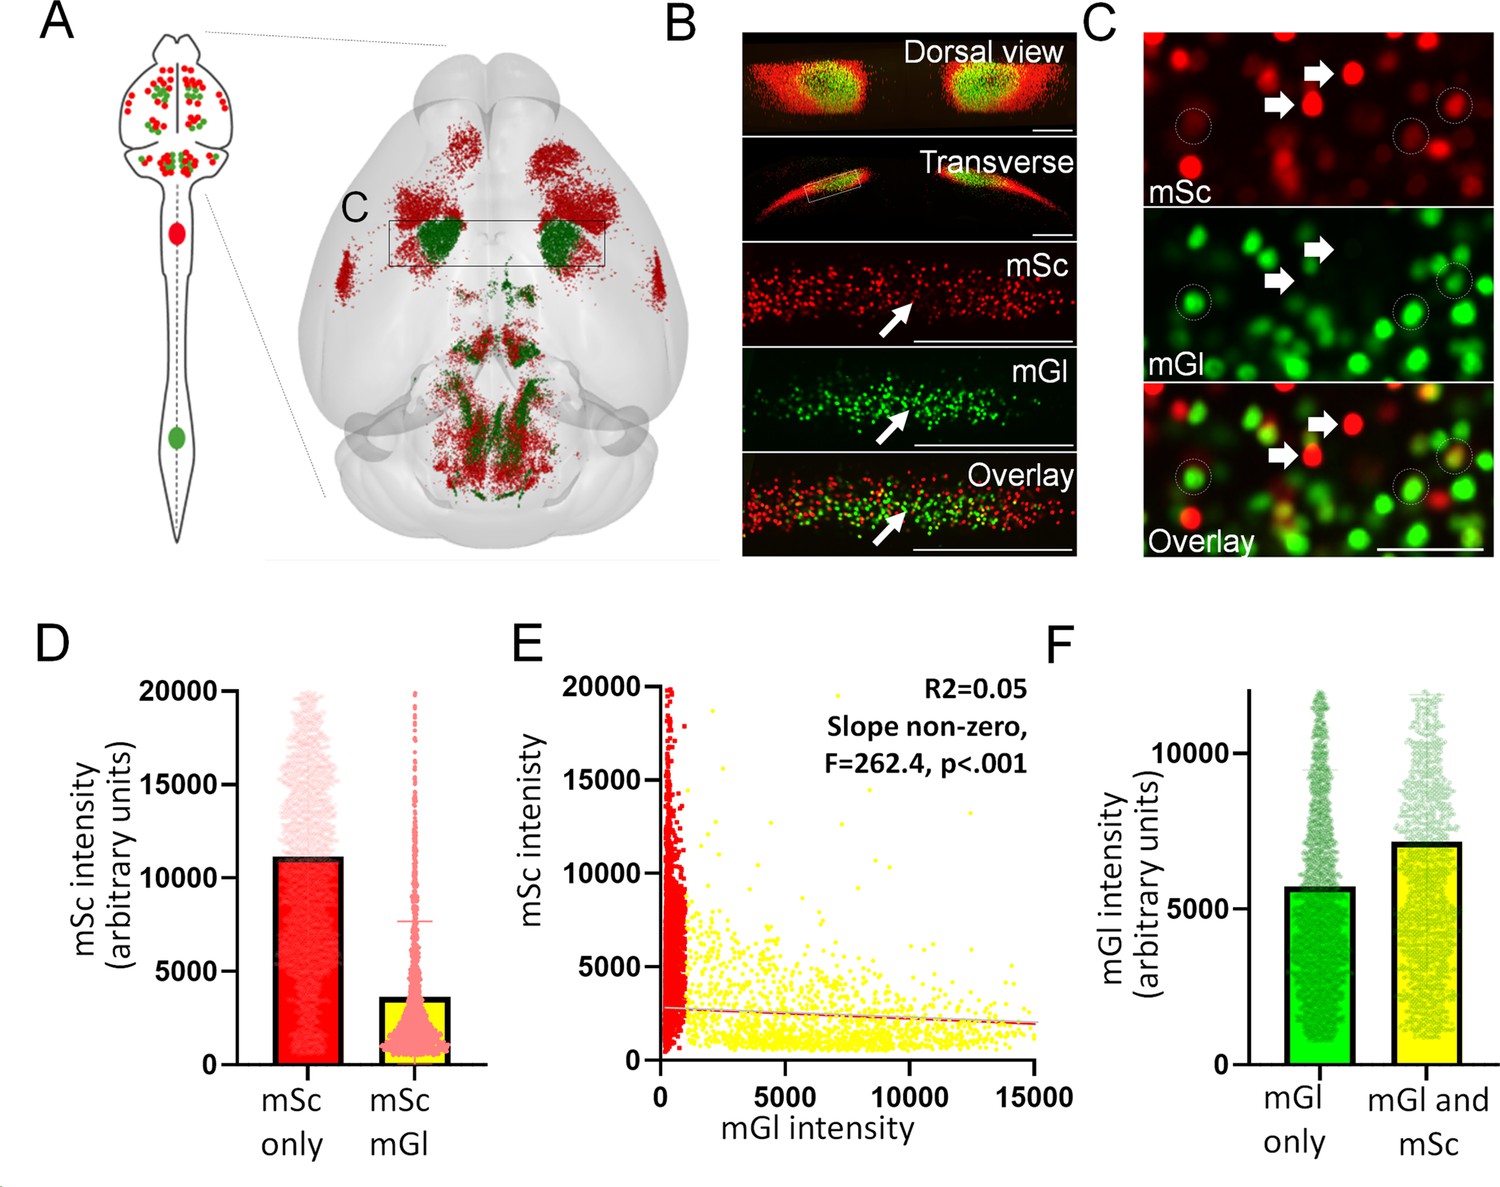
Retrograde signal from cervical spinal cord is dimmer in cells that are co-labeled from lumbar spinal cord.
(A) Adult mice received lumbar (L1) injection of AAV2-retro-mGL and cervical injection (C4) of AAV2-retro-mSc, followed 2 weeks later by perfusion and 3D imaging of 2-mm-thick brain sections. A black box indicates the approximate location shown in (C). (B) shows a region of cortex retrogradely labeled from lumbar spinal cord (green,H2B-mGL) with cervically derived H2B-mSc surrounding and also intermixed. (C) At higher magnification, cells that are labeled only with cervically injected H2B-mSc have bright label (arrows), whereas cells co-labeled with both fluorophores (dotted circles) show only dim H2B-mSc signal. (D) Starting from all cells in which H2B-mSc was detected by the Imaris Spot function, cells were divided according to detection of H2B-mGL and mSc signal intensity measured in each set. Dual-labeled cells showed significantly lower levels of H2B-mSc than single-labeled cells (N = 2664 single-labeled, 1710 dual-labeled, p<0.0001, paired t-test). (E) Signal intensity of H2B-mGL is modestly higher in cells with co-detected H2B-mSc than in cells in which only H2B-mGL is detected. (F) Cells with co-detected H2B-mSc and H2B-mGL show a significant negative correlation in signal intensity of the two fluorophores (linear regression, N = 7979 cells).
Figure 3—video 1
A video illustrating confocal whole-slice imaging, selection of supraspinal regions of interest, and detection of single- and double-labeled cell nuclei.
Figure 3—video 2
A video illustrating relatively dim retrograde label from cervical spinal cord in lumbar-projecting corticospinal neurons.
Figure 4
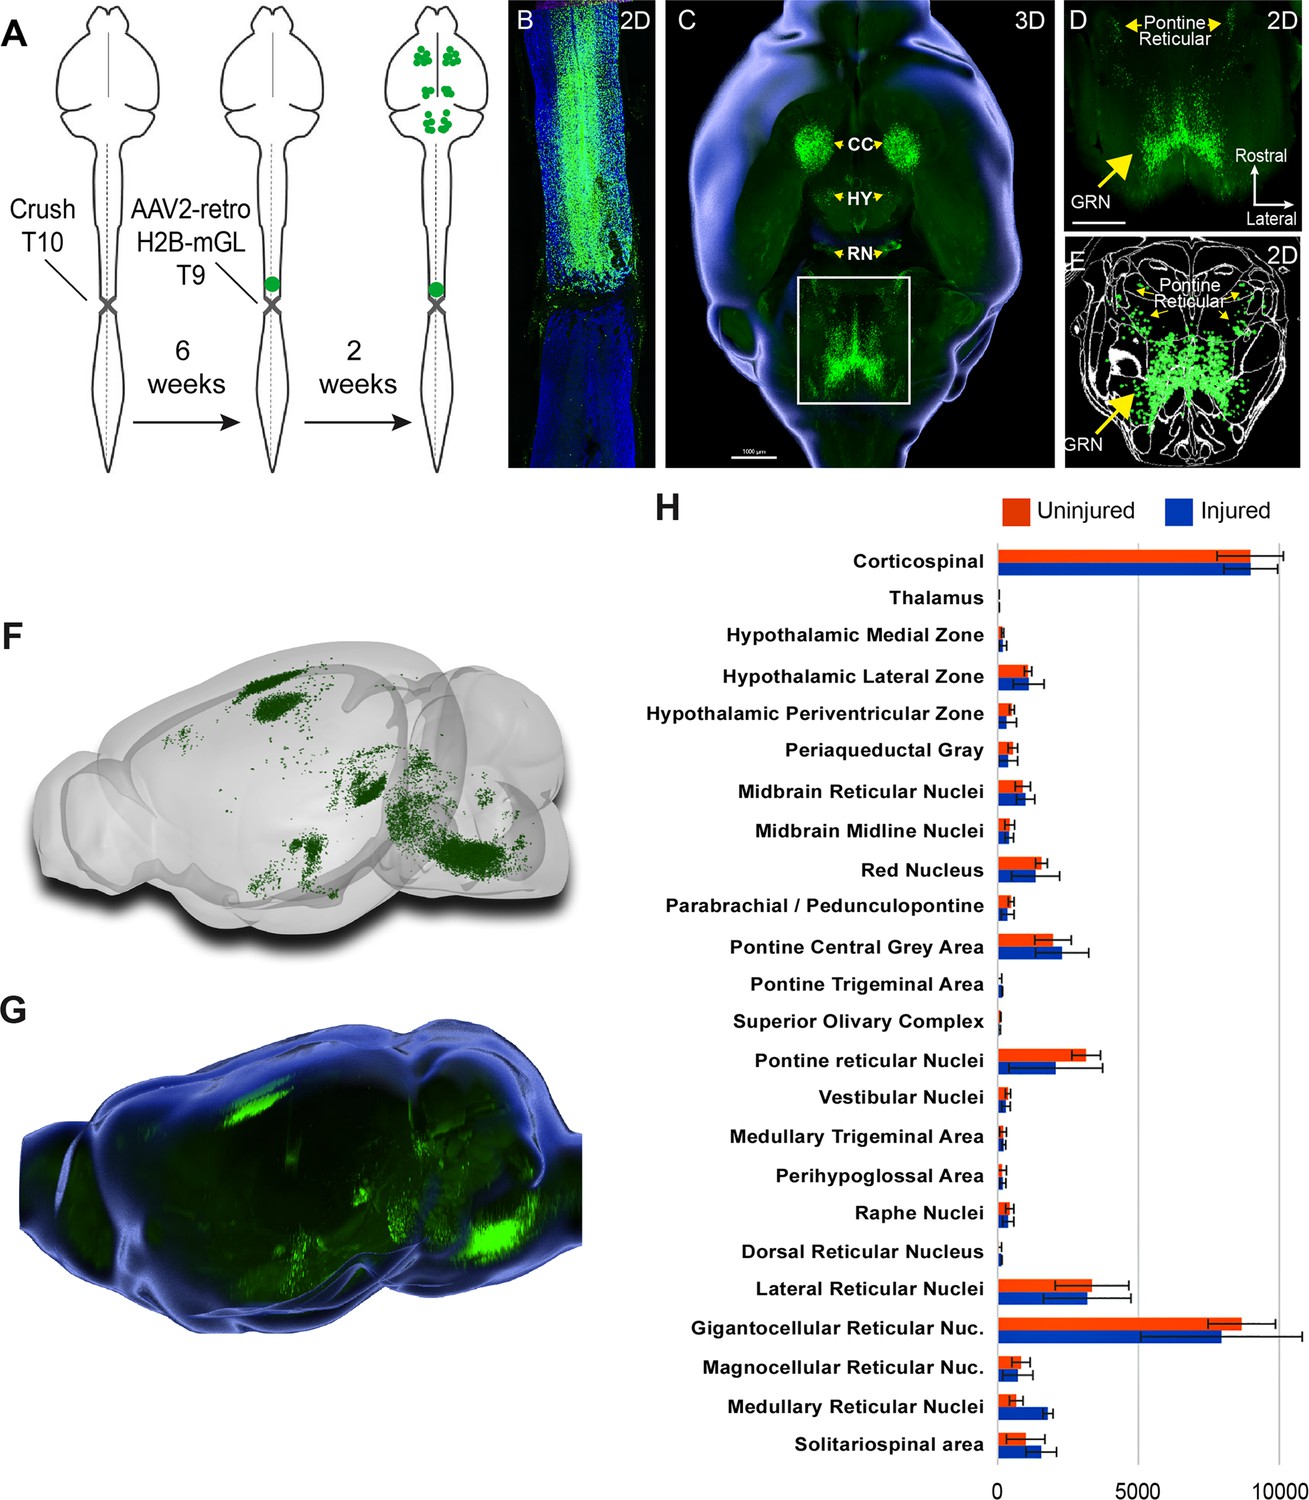
Retro-AAV2 effectively transduces neurons when delivered to the chronically injured spinal cord.
(A) Experimental design. A complete crush injury was delivered to lower thoracic spinal cord, followed 6 weeks later by injection of AAV2-retro-H2B-mGL rostral to the injury. Two weeks post-injection, animals were euthanized, brains were cleared and imaged with light sheet microscopy, and images were processed for registration and quantification by cellfinder and brainreg. (B) Horizontal spinal section stained for GFAP (blue), confirming the complete crush and verifying transduction (green) rostral but not caudal to the injury. (C–E) Horizontal views of the brain from the same animal of section in (B). (C) shows a 3D overview, (D) shows a higher magnification view of the brainstem, and (E) shows cellfinder output with retrograde mGL detection in green. (F) Brainrender output showing lateral views of the same brain in (C). (G) Imaris 3D-generated equivalent lateral view of the brain in (F). (H) Quantification of retrograde nuclei detected in 25 brain regions, comparing uninjured animals (orange) to chronically injured animals (green). No regions displayed statistical differences (p>0.05, two-way ANOVA with post-hoc Sidak’s). N = 4 animals per group. Scale bars are 1 mm.
Figure 5 with 2 supplements
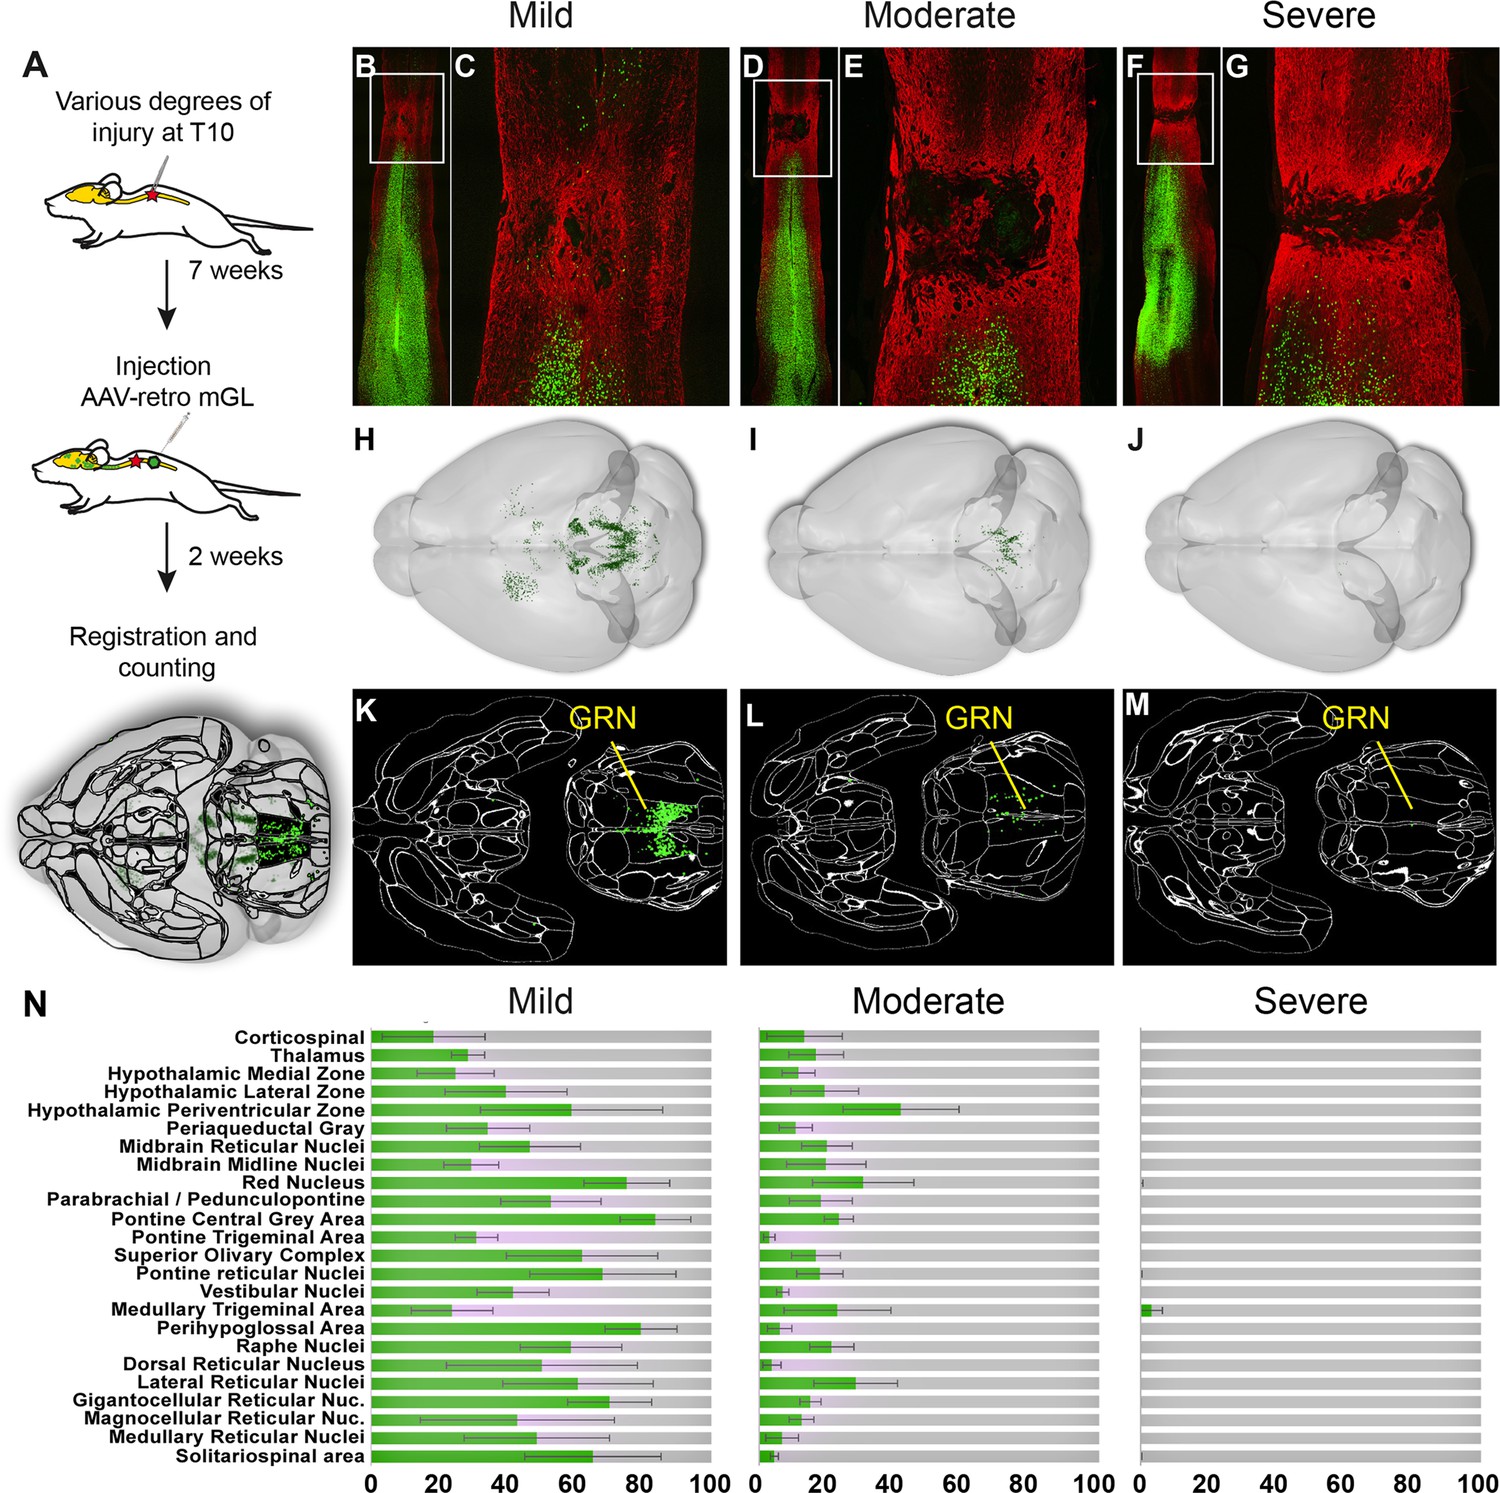
Brain clearing and registration quantifies region-specific sparing across a range of spinal injury severities.
(A–G) Animals received thoracic crush injuries of controlled widths, followed 8 weeks later by injection of AAV2-retro-H2B-mGL to L4 spinal cord. Horizontal spinal cord sections show mild (B, C), moderate (D, E), or severe (F, G) injury, with GFAP in red and viral transduction in green. (H–M) Horizontal views of the brains from the same animals of the spinal cord sections above, showing progressive reduction in the number of retrogradely labeled neurons as injury severity increases. (H–J) show brainrender depictions of whole brain, (K–M) show one 2D cellfinder plane output with brain regions outlined and detected mGL in green on the right panels. (N) Quantification of percent sparing in identified brain regions, with the average value from uninjured animals set as 100. N = 3 mild, 6 moderate, and 3 severely injured animals. GRN, gigantocellular reticular nucleus. Scale bars are 1 mm.
Figure 5—figure supplement 1
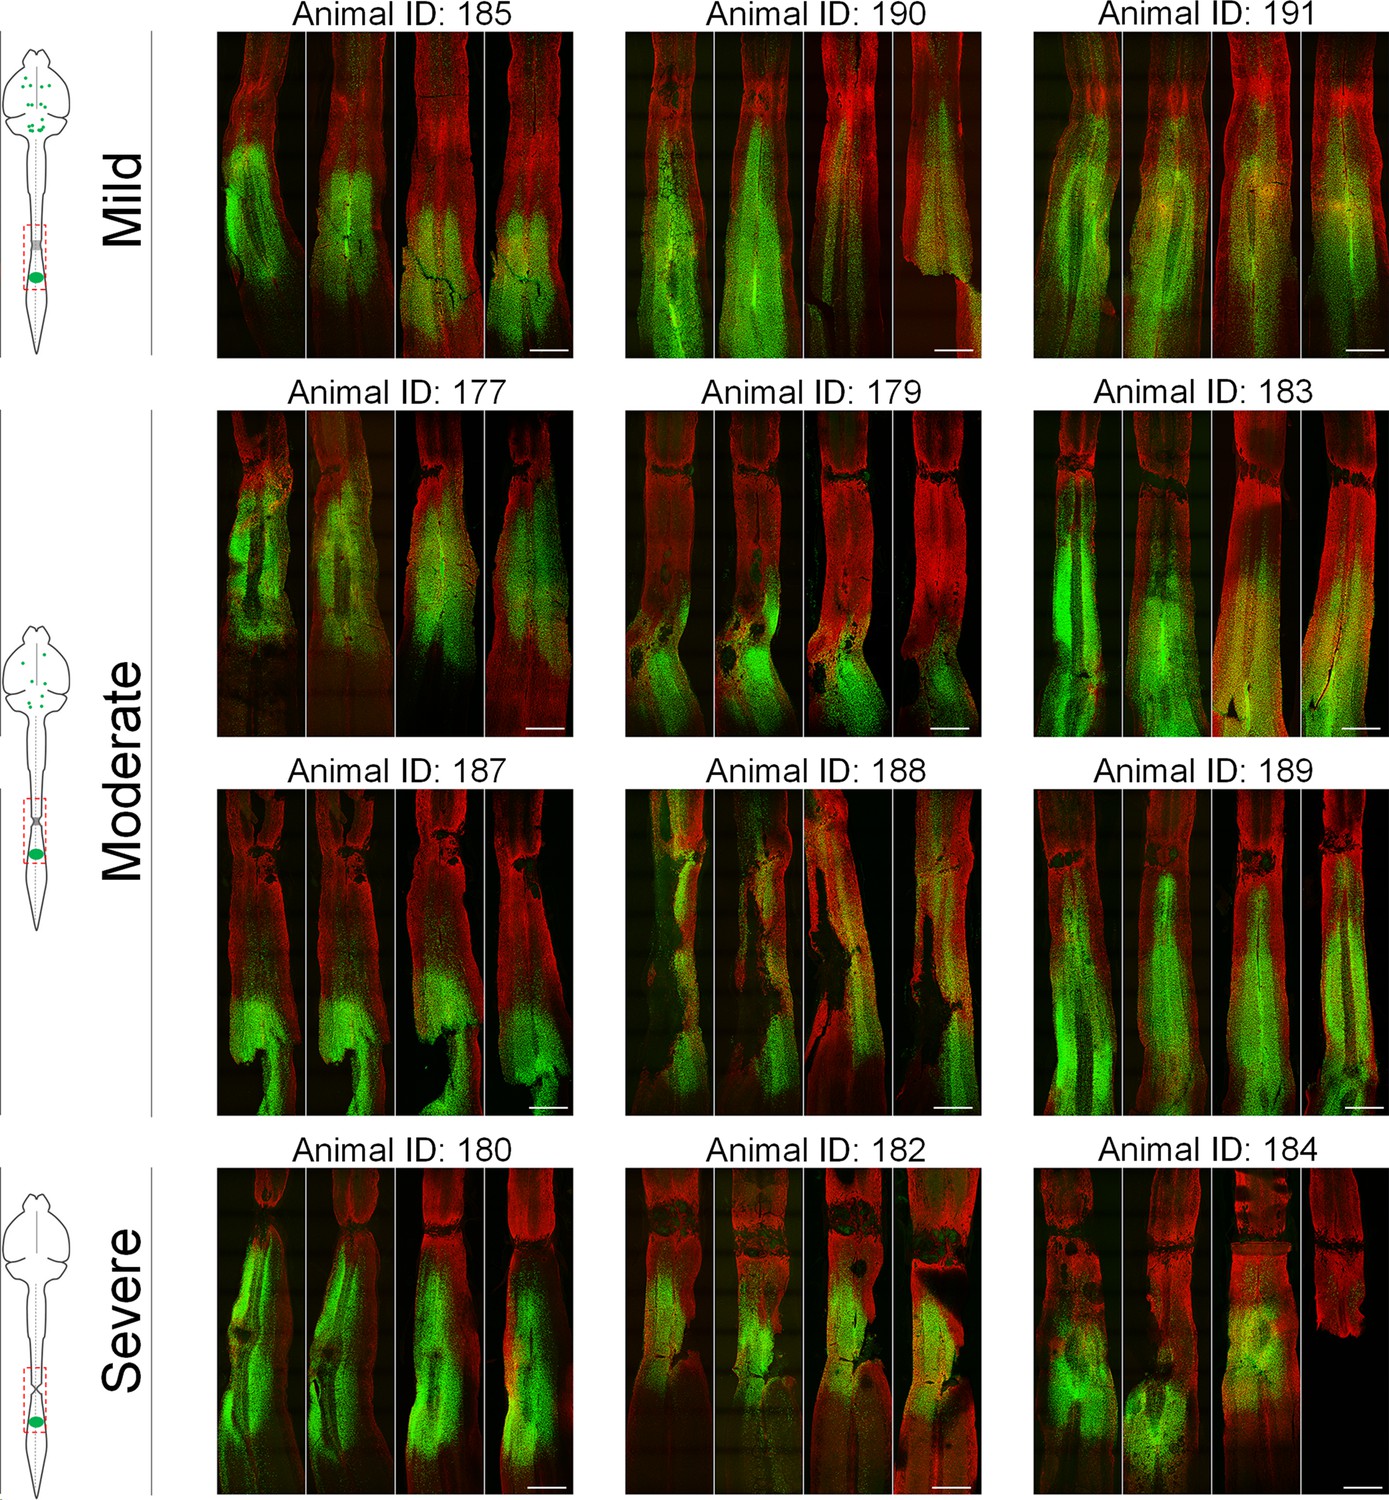
Horizontal spinal sections with GFAP labeling for all injured animals.
Adult mice received crush injuries to T11 spinal cord using forceps with stoppers of defined width to control the severity. Then, 7 weeks later, AAV2-retro-H2B-mGL was injected to L4 spinal cord, and 2 weeks post-injection animals were sacrificed and a complete series of 100 µm horizontal sections of spinal cord prepared. Immunohistochemistry for the astrocytic marker GFAP (red) defines the site of injury, and H2B-mGL signal (green) indicates neurons that took up the virus. Note that after mild injury the GFAP signal is largely continuous across the crush site, whereas after severe injuries a GFAP-negative region is evident, indicating the absence of astrocytic bridges. Scale bars are 1 mm.
Figure 5—figure supplement 2
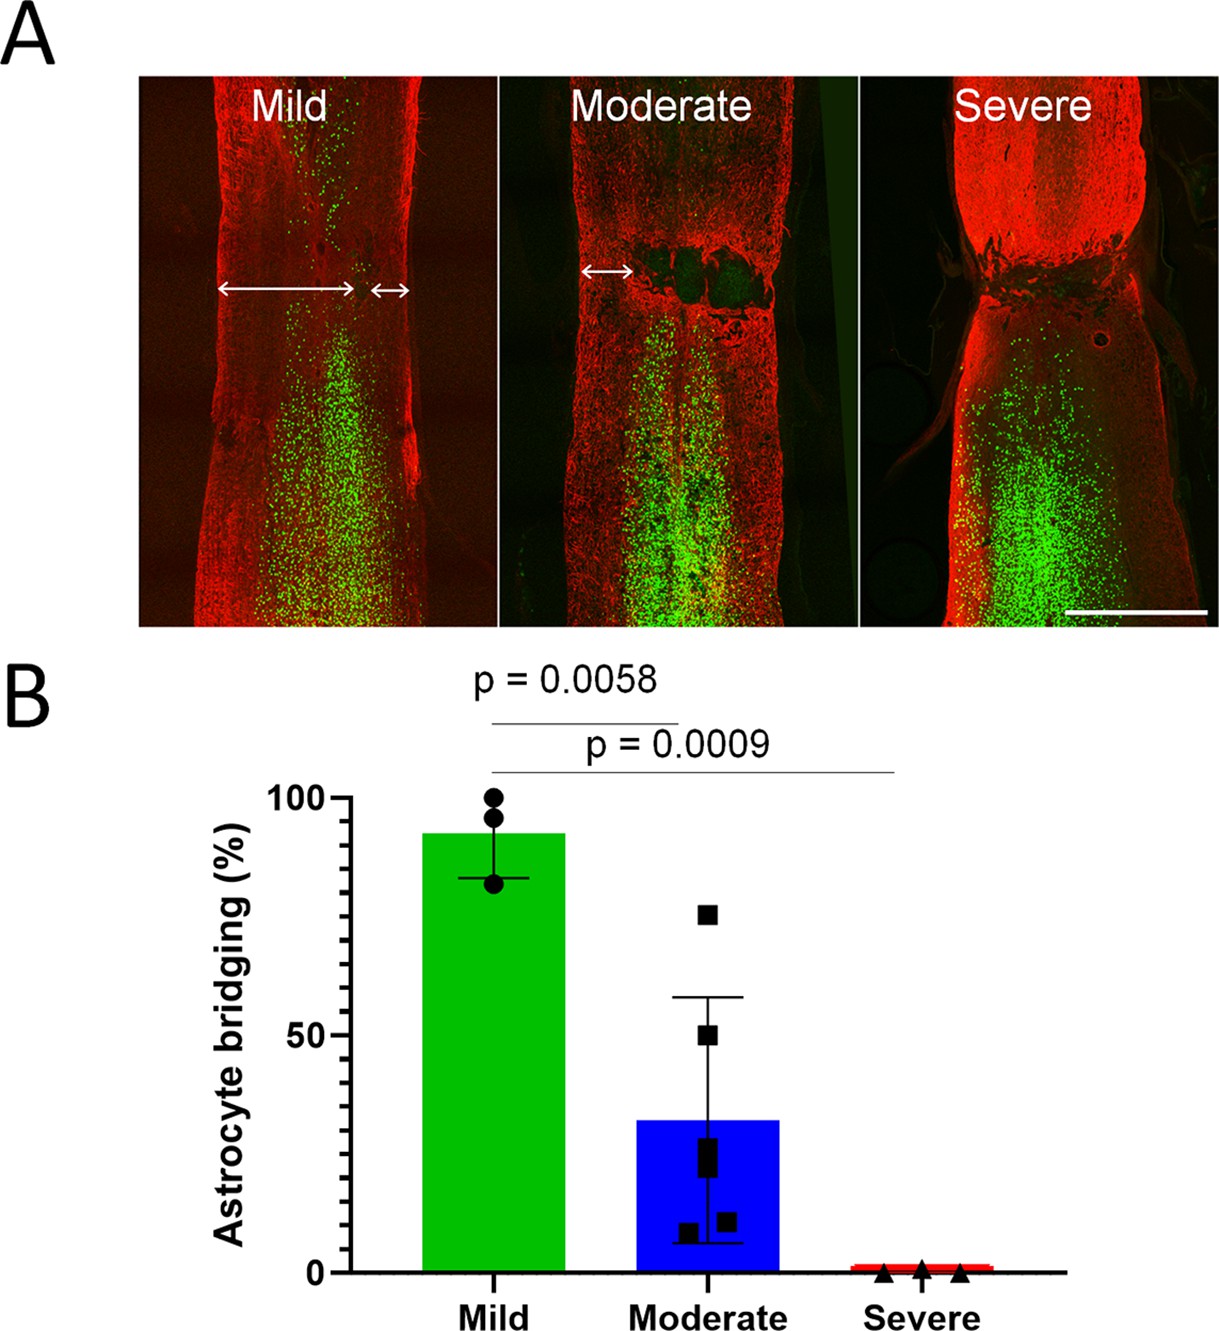
Graded spinal injuries reduce astrocytic continuity across the injury site.
Adult mice received crush injuries to T11 spinal cord using forceps with stoppers of defined width to control the severity. Then, 7 weeks later AAV2-retro-H2B-mGL was injected to L4 spinal cord, and 2 weeks post-injection animals were sacrificed and a complete series of 100 µm horizontal sections of spinal cord prepared. Immunohistochemistry for GFAP identifies astrocytes, and H2B-mGL signal (green) indicates neurons that took up the virus. (A) In four sections from each animal, the linear width of residual astrocyte connectivity was measured (arrow) (A) and then normalized to total spinal width. (B) Moderate and severe injuries resulted in a significant reduction in astrocyte bridging (p<0.001, one-way ANOVA with post-hoc Sidak’s). Scale bar is 1 mm.
Figure 6 with 2 supplements
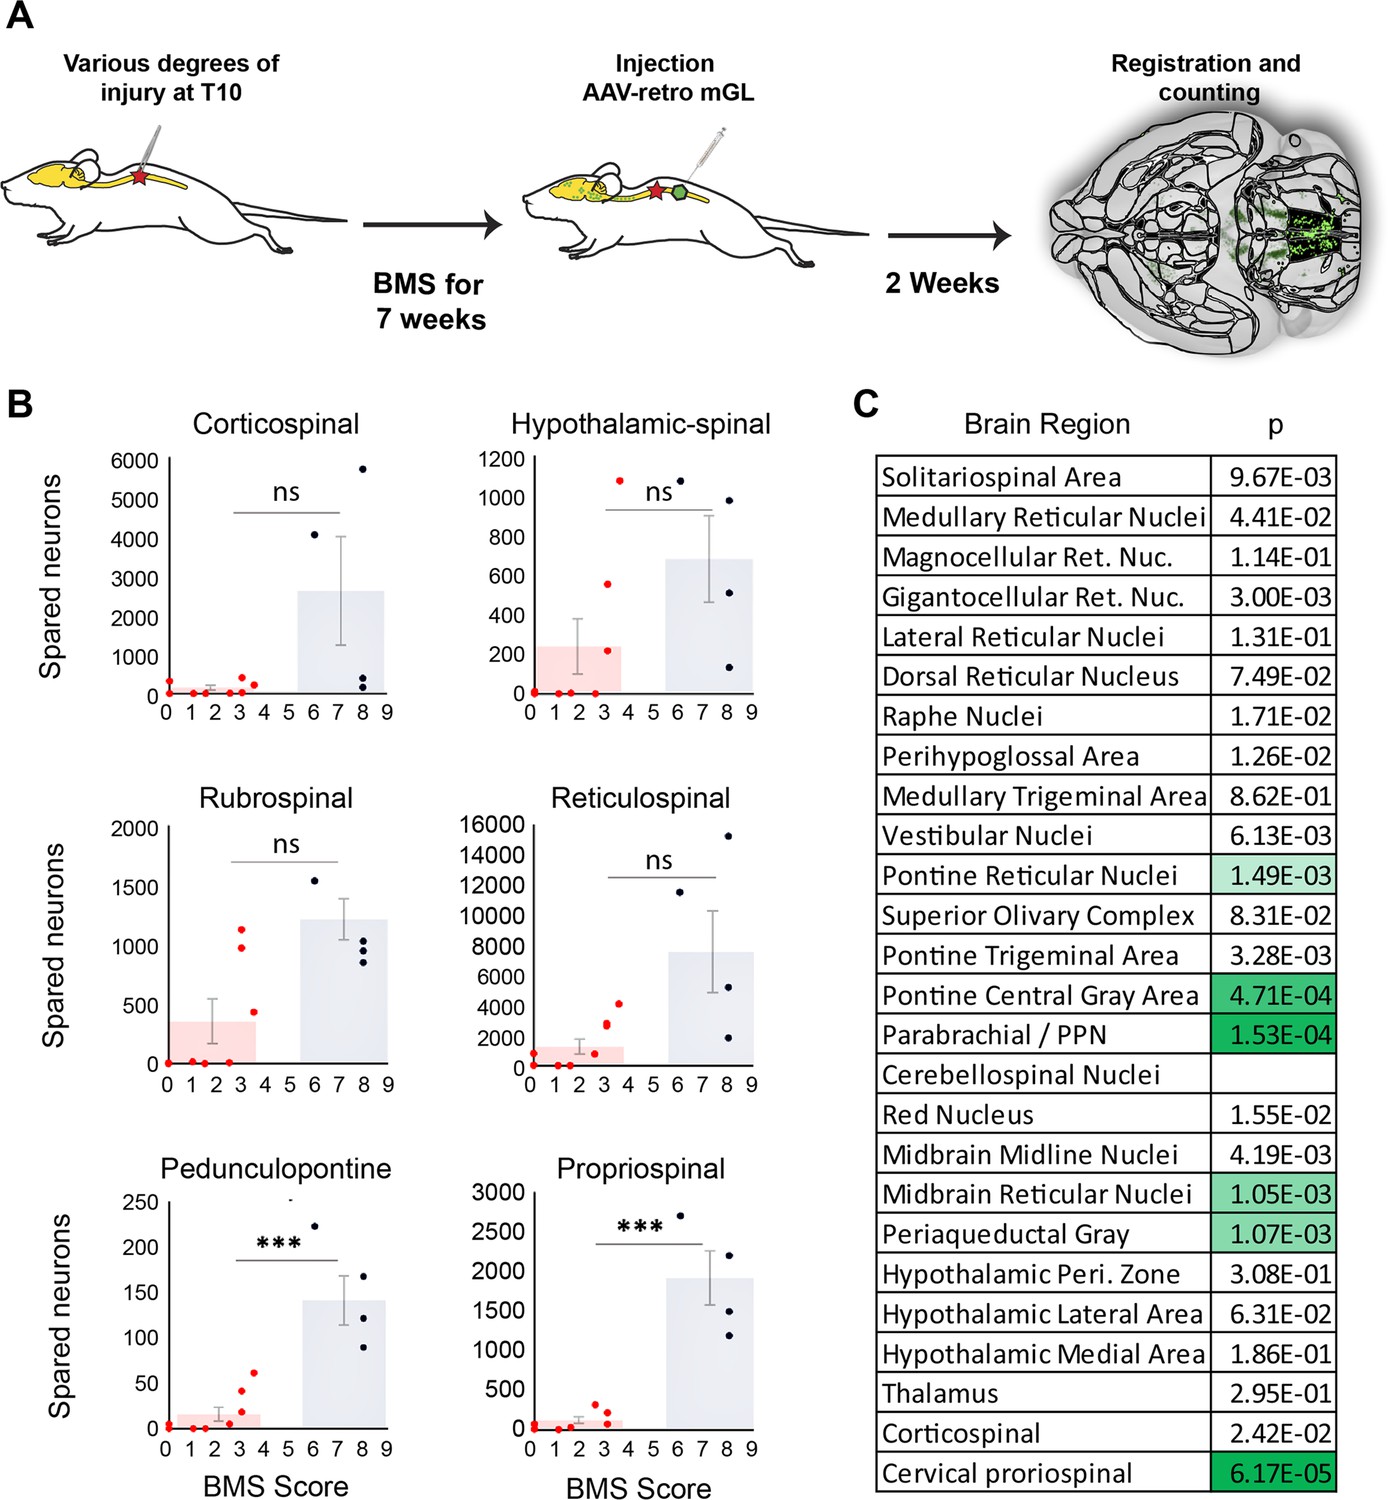
Mice that recover frequent plantar placement after injury differ significantly in neuronal sparing in selected brain regions.
(A) Experimental design. Adult mice received graded spinal cord injuries followed by weekly Basso Mouse Scale (BMS) testing. Then, 7 weeks post-injury animals received lumbar (L4) injection of retro-AAV2-H2B-mGL, followed 2 weeks later by perfusion, 3D imaging of brains, registration, and region-specific quantification of spared neurons. (B) Mice were divided into two groups according to whether they regained frequent plantar stepping motions (blue, BMS > 5) versus no or infrequent plantar steps (red, BMS < 4) and then tested for significant differences in spared neurons in each of the 26 brain and spinal regions. Example scatterplots with overlaid averages show overlap in spared counts in most brain regions, but group separation and significant differences in selected regions including the pedunculopontine nucleus (PPN) and cervical spinal cord. (C) The significance level of sparing differences between the two groups across all brain regions. N = 4 skilled steppers, 8 impaired. p determined by paired t-tests with significance threshold set by Bonferroni’s correction for multiple comparisons.
Figure 6—figure supplement 1
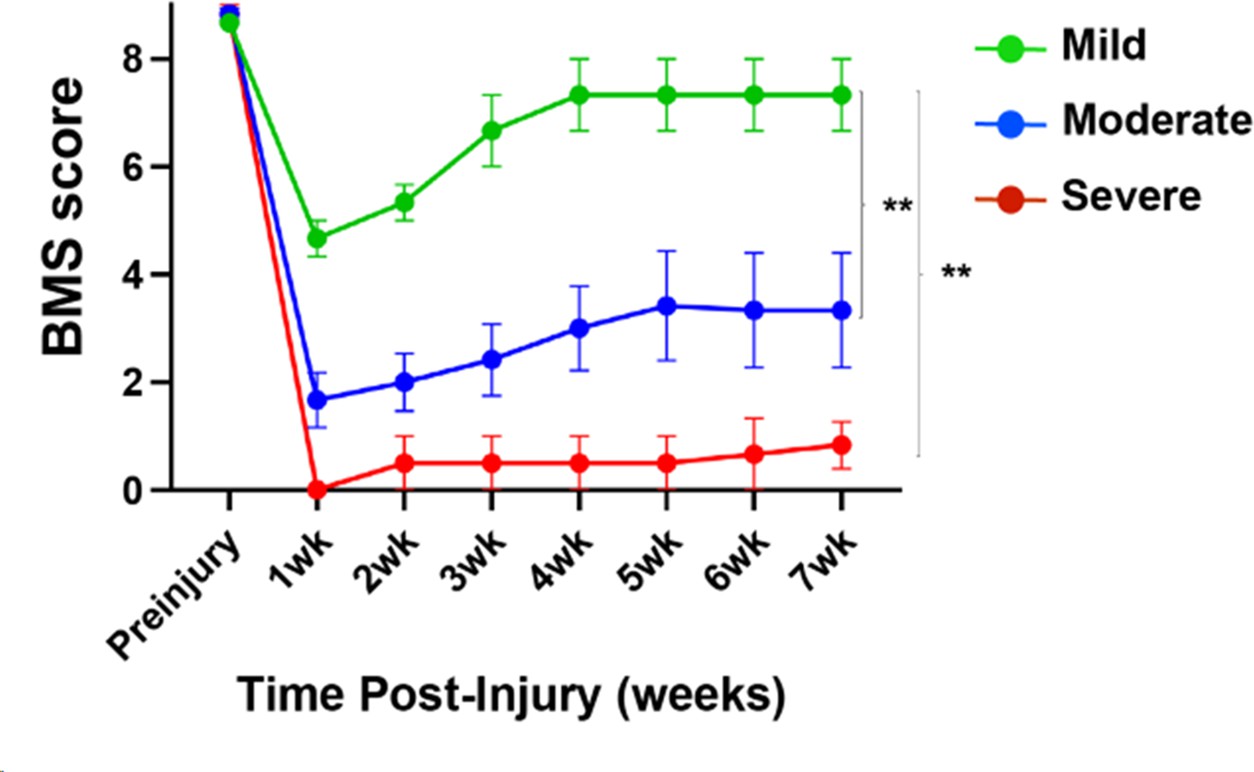
Spinal injuries of different severities result in different levels of locomotor recovery.
Adult mice received mild, moderate, or severe crush injuries followed by weekly Basso Mouse Scale (BMS) testing for 7 weeks. Compared to severely injured animals, mildly and moderately injured animals displayed significantly higher BMS scores. **p<0.01 repeated-measures ANOVA. N = 12 animals: 3 moderate, 6 moderate, and 3 severe.
Figure 6—figure supplement 2
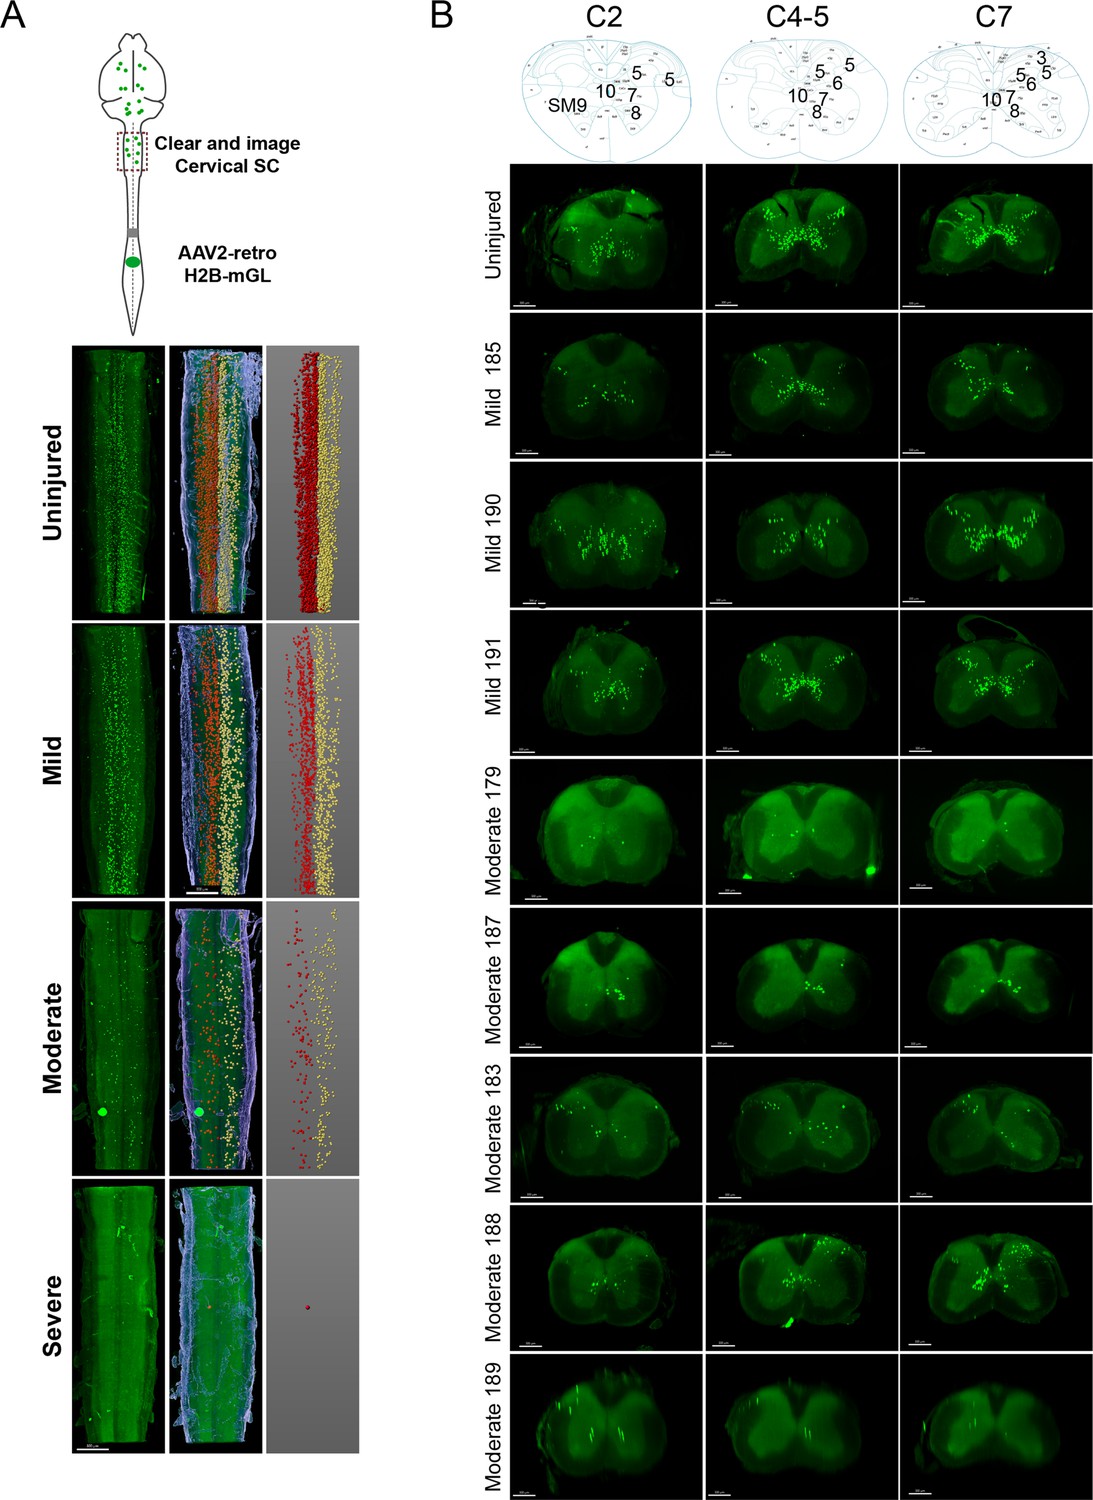
The number of spared propriospinal neurons in cervical spinal cord correlates with locomotor recovery after spinal injury.
(A) Experimental design. Animals received spinal crush injuries of controlled width, followed by weekly Basso Mouse Scale (BMS) testing for 7 weeks, then lumbar injection of AAV2-retro-H2B-mGL. Along with brain clearing and imaging described elsewhere, cervical spinal cord was also cleared and imaged. Example images of cervical spinal cord of animals with different injury severities. Left panels show raw images, right panels show the detection of labeled nuclei by Imaris with left propriospinal neurons in red and right propriospinal neurons in yellow, and the middle panels show the overlay. (B) The top schematics of the annotated mouse spinal cord atlas for the specific cervical segments are based on an adult male C57BL/6J mouse, postnatal day 56 (P56) (http://mousespinal.brain-map.org/imageseries/showref.html). Optical coronal sections at cervical levels C2, C4-5, and C7. Top panels show a schematic of the corresponding layers, and the fluorescent images below show the labeled propriospinal cell nuclei at the indicated levels.
Additional files
-
Transparent reporting form
- https://cdn.elifesciences.org/articles/76254/elife-76254-transrepform1-v2.docx
-
Source data 1
Raw cell counts for all animals.
- https://cdn.elifesciences.org/articles/76254/elife-76254-data1-v2.xlsx
-
Source data 2
Raw values for all figures.
- https://cdn.elifesciences.org/articles/76254/elife-76254-data2-v2.xlsx
Download links
A two-part list of links to download the article, or parts of the article, in various formats.
Downloads (link to download the article as PDF)
Open citations (links to open the citations from this article in various online reference manager services)
Cite this article (links to download the citations from this article in formats compatible with various reference manager tools)
Brain-wide analysis of the supraspinal connectome reveals anatomical correlates to functional recovery after spinal injury
eLife 11:e76254.
https://doi.org/10.7554/eLife.76254


