Local activation of focal adhesion kinase orchestrates the positioning of presynaptic scaffold proteins and Ca2+ signalling to control glucose-dependent insulin secretion
- Charles Perkins Centre, School of Medical Sciences, University of Sydney, Australia
- School of Physics, University of Sydney, Australia
- School of Aerospace, Mechanical and Mechatronic Engineering, University of Sydney, Australia
- Sydney Nanoscience Institute, University of Sydney, Australia
Figures
Figure 1 with 1 supplement
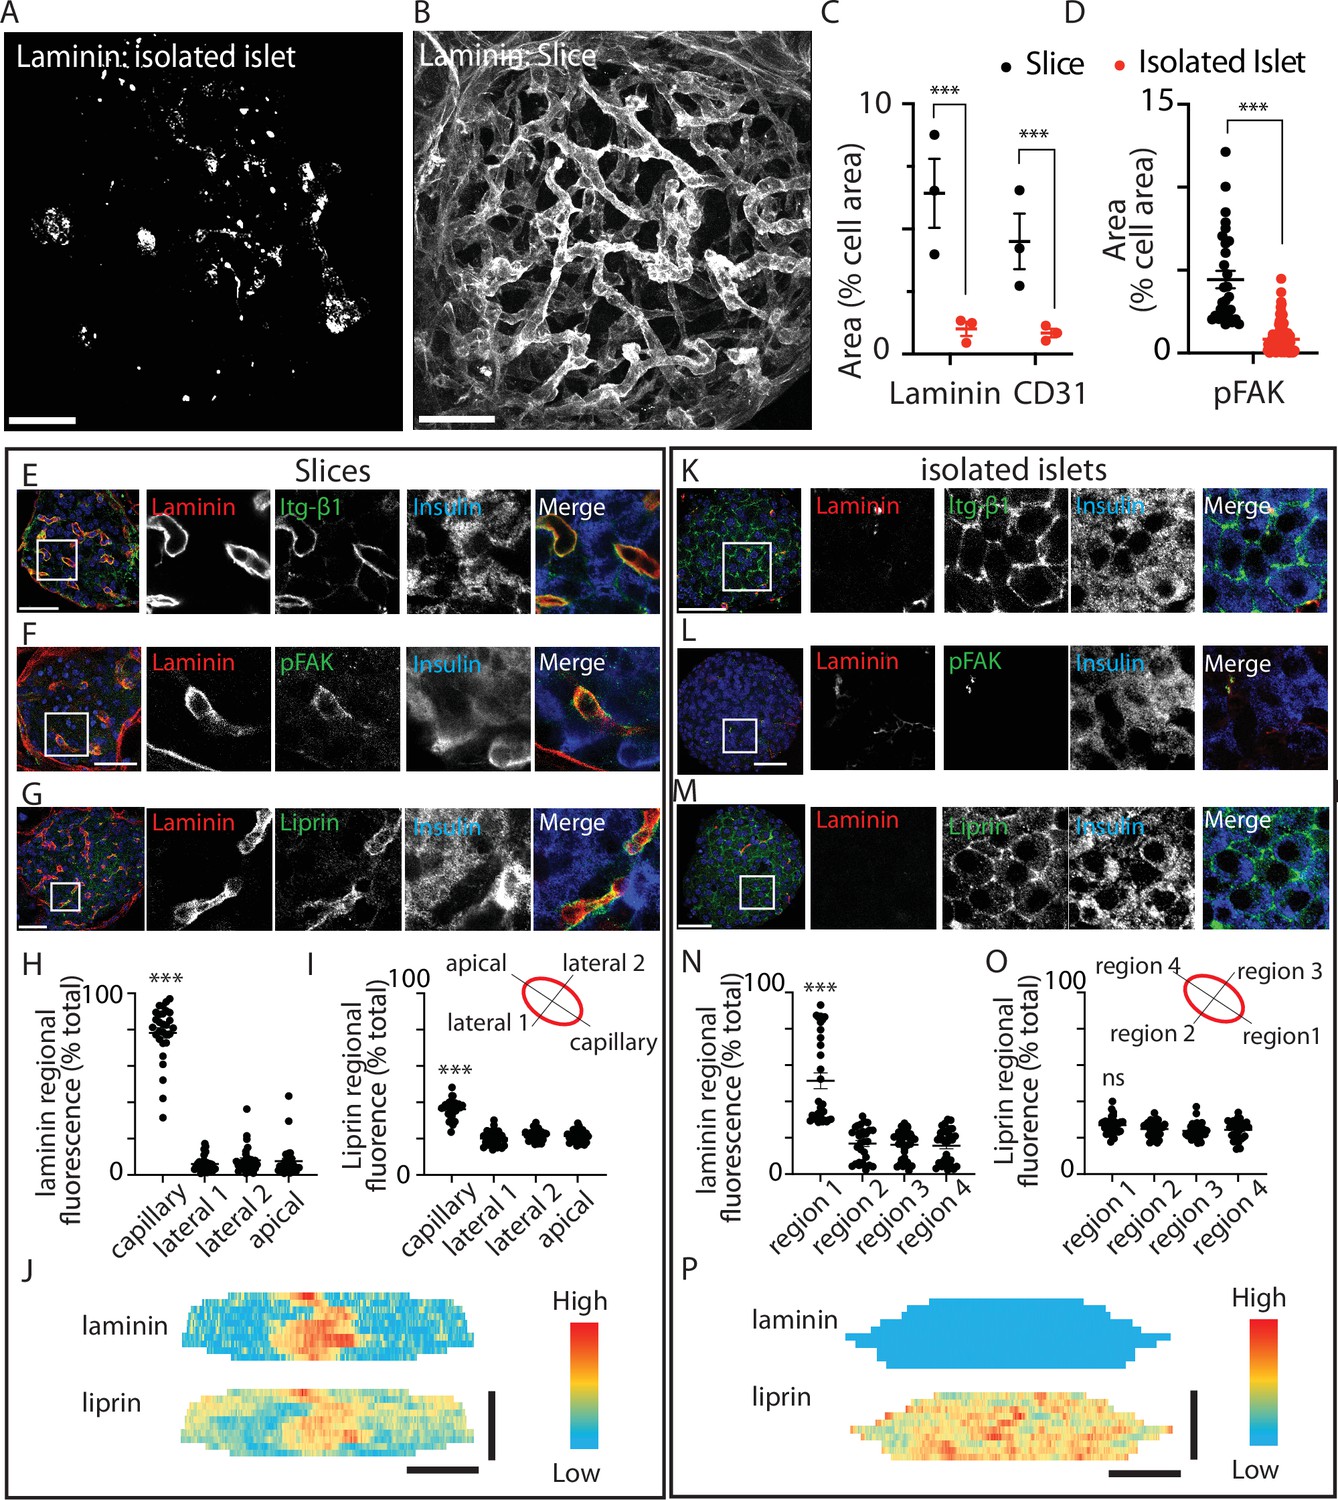
Pancreatic slices have an intact capillary bed.
Integrin-β1, phosphorylated focal adhesion kinase (FAK), and liprin are enriched at the β-cell capillary interface. Pancreas slices and isolated islets were cultured overnight prior to fixation and immunostaining. Representative 3D projection of the extracellular matrix (ECM) protein laminin through (A) an isolated islet and (B) an islet within a slice. (C) Quantification of laminin and CD31 immunofluorescence, normalised to cell area (insulin + 4′,6-diamidino-2-phenylindole (DAPI), see Materials and methods for details) in the corresponding Z-planes showed a significant loss of both proteins in isolated islets compared to slices (n = 3 and 2–3 islets analysed per mouse, mean ± standard error of the mean (SEM), Student’s t-test p < 0.001). Scale bar 40 µm. (D) Phospho-FAK immunostaining shows significantly reduced area (compared to total cell area, insulin + DAPI) in β cells in isolated islets (n = 29 cells in slices 112 cells in islets, Student’s t-test p < 0.01). Scale bar 40 µm. (E–G) Immunostaining in slices for integrin-β1, laminin, and liprin shows integrin and liprin are enriched at the capillary interface. Scale bar 40 µm. (H, I) Quantification of fluorescence in four regions of interest (~2 × 2 µm) places around individual β cells (see cartoon) showed significant liprin enrichment at the capillary interface region compared to the lateral and apical regions (one-way analysis of variance [ANOVA] showed significant differences across the regions (F(3,112) = 2.421; p < 0.0001, a Tukey post hoc comparison showed the capillary domain was brighter compared to each other domains (p < 0.0001), n = 29 cells, four slices, three mice). (J) Heatmaps of the total surface area of single β cells were prepared as previously described (Gan et al., 2018) by measuring fluorescence intensity (of liprin and laminin staining) along linescans drawn around the circumference of each cell, at each Z slice. Fluorescence intensity expressed on a pseudocolour scale (normalised to maximum fluorescence) shows the local enrichment of liprin coincident with laminin staining. Scale bar 5 µm. (K–M) In isolated islets, the capillaries are lost, as shown by lack of laminin staining, and liprin and integrin staining is now dispersed across the membrane. (N, O) In isolated islets, capillaries were absent and laminin staining weak, we therefore arbitrarily assigned region 1 as the region with maximal laminin staining. Even after this post-analysis alignment of the regions liprin staining was similar across all regions (one-way ANOVA no difference across the regions (F(3,120) = 0.57; p = 0.054, n = 31 cells, 4 islets, 3 mice). (P) Heatmaps with fluorescence intensity expressed on a pseudocolour scale shows weak laminin staining and relatively uniform liprin staining across the β-cell area. Scale bar 5 µm. * shows statistical significance at p<0.05; ** shows statistical significances at p<0.01; *** shows statistical significance at p<0.001.
-
Figure 1—source data 1
pFAK area analysis.
- https://cdn.elifesciences.org/articles/76262/elife-76262-fig1-data1-v2.xlsx
-
Figure 1—source data 2
CD31 area analysis.
- https://cdn.elifesciences.org/articles/76262/elife-76262-fig1-data2-v2.xlsx
-
Figure 1—source data 3
Liprin distribution analysis.
- https://cdn.elifesciences.org/articles/76262/elife-76262-fig1-data3-v2.xlsx
Figure 1—figure supplement 1
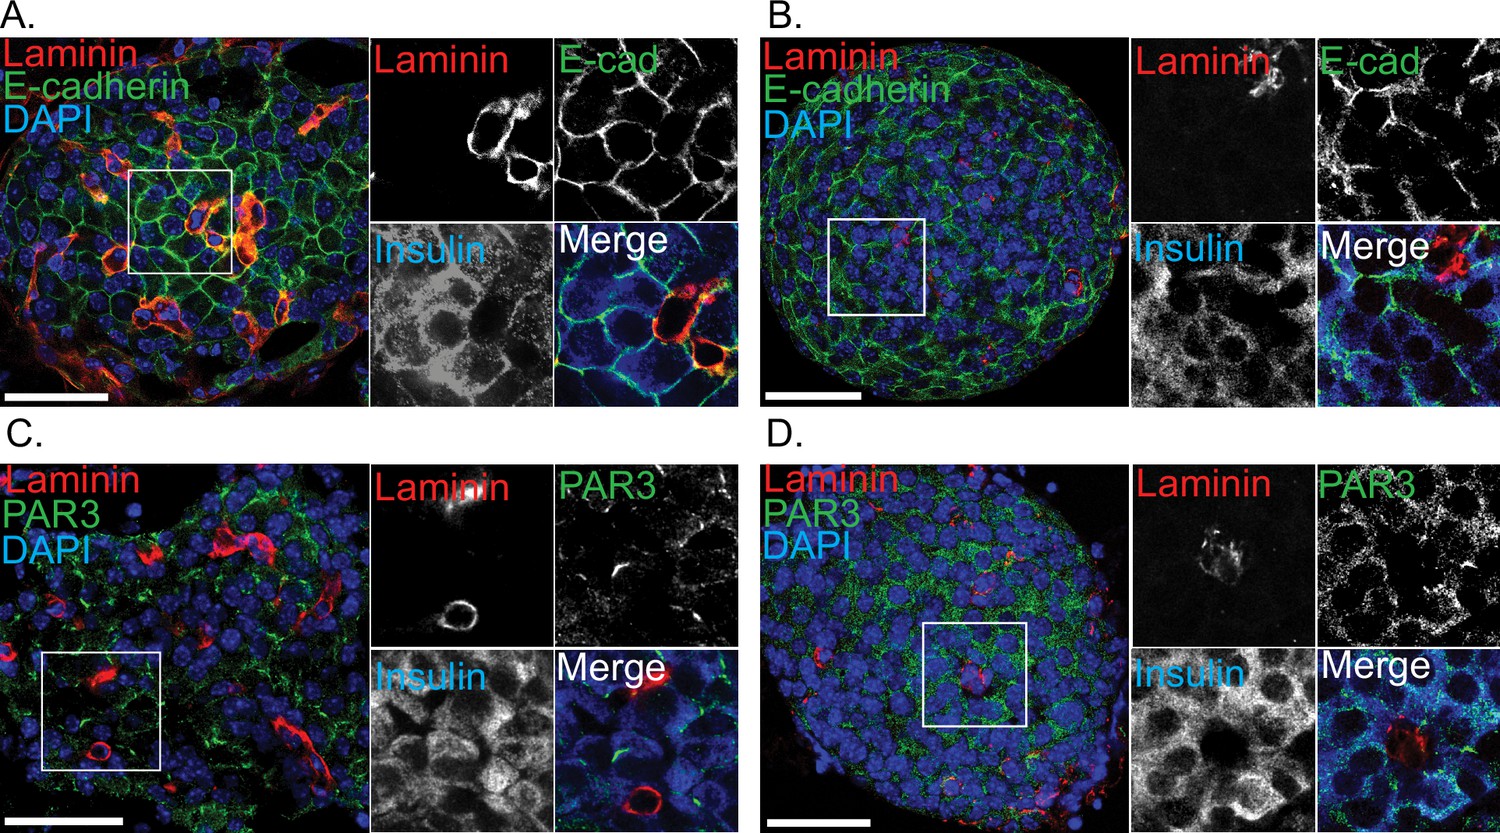
Immunostaining for E-cadherin and PAR3 in slices and isolated islets.
Immunostaining for E-cadherin and laminin in (A) slices and (B) isolated islets shows loss of laminin staining in isolated islets but enrichment of E-cadherin at cell–cell interfaces in both preparations. Immunostaining for PAR3, the apical polarity determinant shows in (C) slices an enrichment in discrete regions away from the capillaries (stained with laminin) that is lost in (D) isolated islets. Scale bar 50 µm.
Figure 2
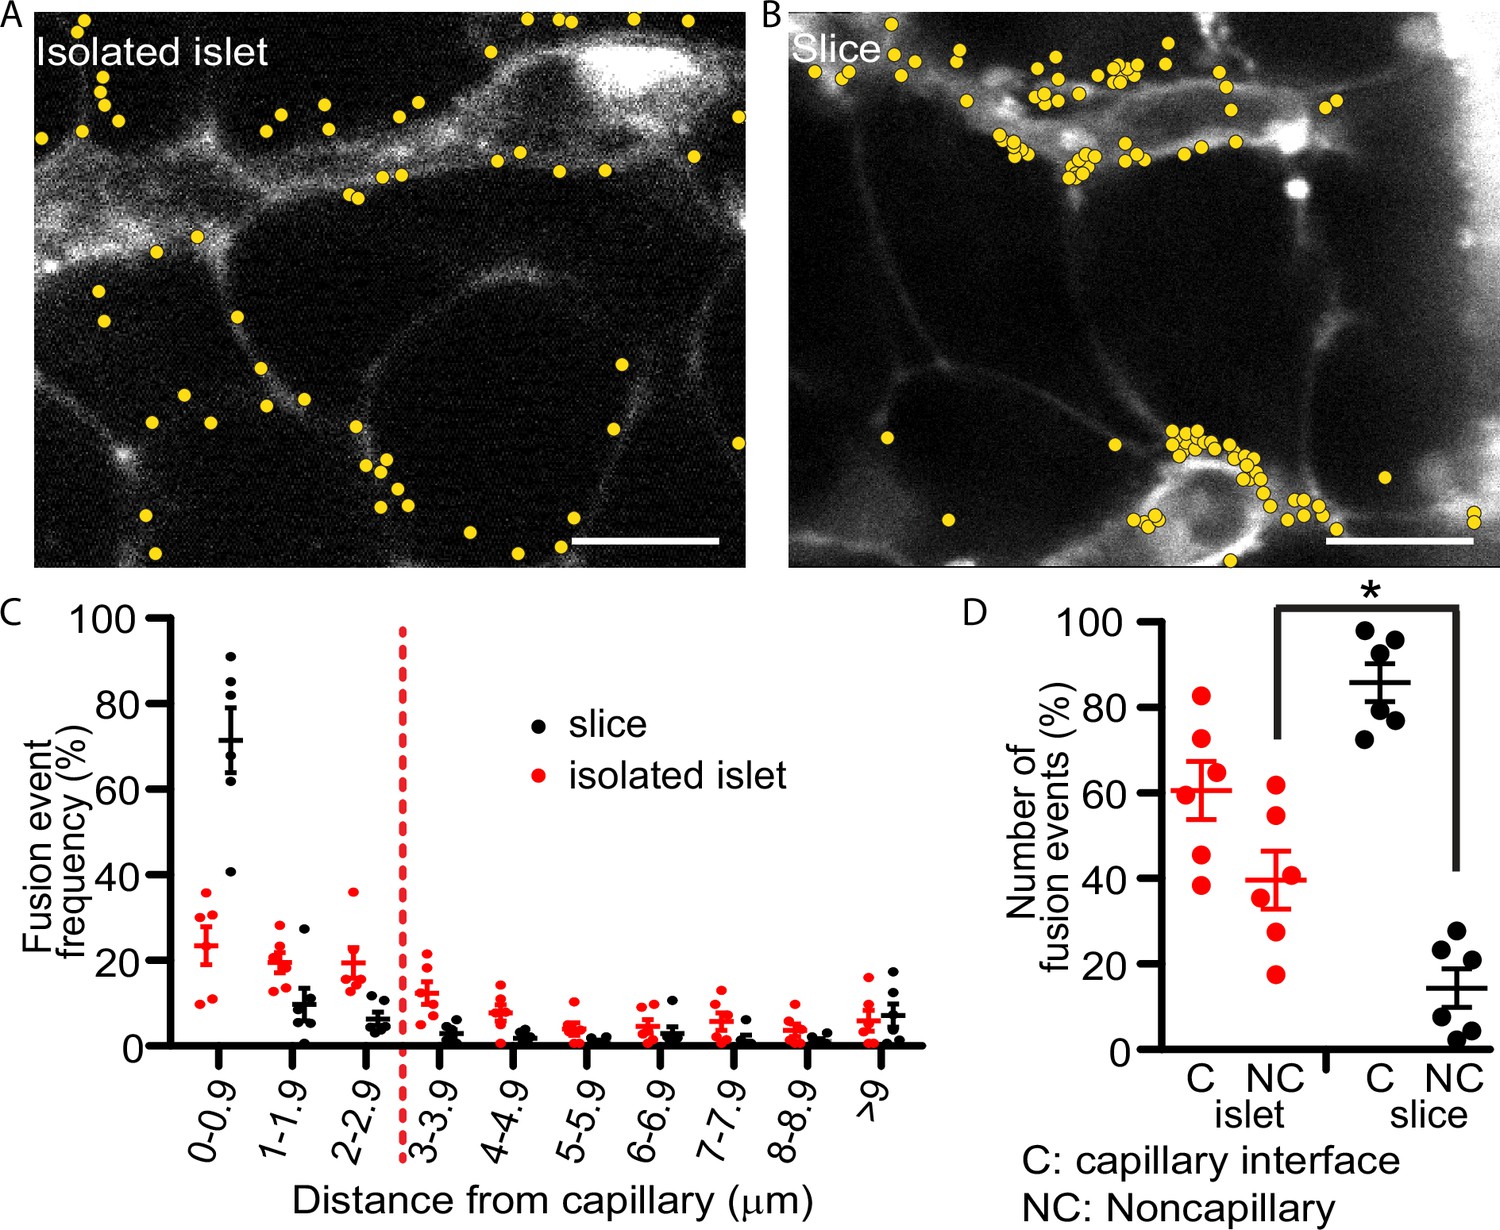
Glucose-stimulated insulin granule fusion in isolated islets and pancreas slices.
(A) Isolated islets and (B) pancreas slices, bathed in an extracellular dye (sulforhodamine B, SRB). This dye outlines each cell and is enriched in the islet capillaries (Low et al., 2013) which are observed as large, elongated fluorescence structures and are fragmented in isolated islets but extended and continuous in slices. When cells were stimulated with 16.7 mM glucose to induce insulin granule fusion, which is recorded as the sudden and transient appearance of bright spots of fluorescence (Low et al., 2014). Continuous recording of two-photon images over 20 min of glucose stimulation led to many exocytic events, which were identified and marked on the images with yellow dots. (C) Slices (n = 6 slices) had a strong bias of fusion events towards the vasculature, while fusion events in isolated islets (n = 6 islets) were more spread out. (D) Fusion events in isolated islets and slices were classified as either occurring at the capillary face (<2.9 μm, C) or elsewhere on the cell membrane (>2.9 μm, NC). All data are represented as the mean ± standard error of the mean (SEM) (n = 3), significance determined by Student’s t-tests, p < 0.05. * shows statistical significance at p<0.05.
Figure 3 with 1 supplement

Glucose-stimulated secretion in isolated islets and pancreas slices.
(A) Dose-dependent glucose-stimulated insulin secretion normalised to total cellular insulin content shows that isolated islets are less sensitive to low glucose concentration and secrete a lower proportion of their total content compared to islets in pancreas slices (n = 3–14 mice at each point). Two-way analysis of variance (ANOVA) showed significant main effects of islet preparation (F(1, 76) = 35.53; p < 0.0001) and glucose concentration (F(7, 76) = 8.657; p < 0.0001), but no significant interaction between the two factors (F(7, 76) = 1.314; p = 0.2553). The lines are non-linear best fit dose–response curves with a fitted EC50 of 10.2 mM for islets and 8.6 mM for slices. (B) Islets and slices were incubated either with glucose alone at 2.8 or 16.7 mM glucose or in the presence of 250 µM diazoxide where secretion was subsequently stimulated by raising extracellular potassium. The response in the presence of diazoxide and 16.7 mM glucose, which reflects glucose amplification was significantly greater in islets compared to slices (n = 6–13 islets or slices from n = 3 animals, Student’s t-test p < 0.001). (C) Pretreatment with the KATP channel blocker, glibenclamide (2 µM) significantly increased insulin secretion measured at 2.8 mM glucose in both isolated islets and slices (Student’s t-test p < 0.01, n = 3 mice for both conditions). In contrast, pretreatment with glibenclamide only increased insulin secretion measured at 8 mM in islets but not in slices (Student’s t-test p < 0.05 for islets, p = 0.36 for slices, n = 3 mice for both conditions). * shows statistical significance at p<0.05; *** shows statistical significance at p<0.001.
Figure 3—figure supplement 1
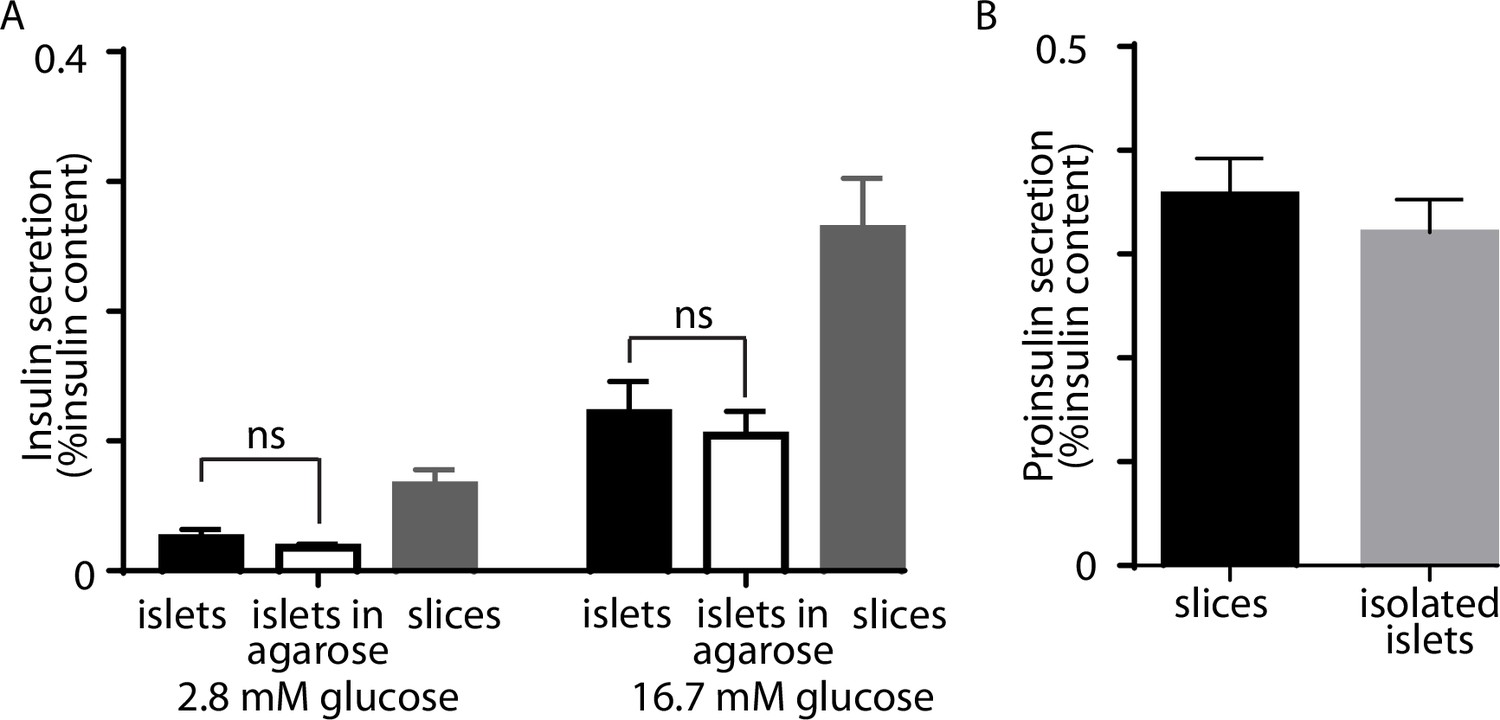
Insulin secretion in pancreatic slices and isolated islets.
(A) Isolated islets, embedded in agarose showed no difference (Student’s t-test) from isolated islets alone in terms of basal and glucose-stimulated insulin secretion. (B) Measures of proinsulin secretion showed no difference in glucose-stimulated slices versus isolated islets.
-
Figure 3—figure supplement 1—source data 1
Insulin secretion data.
- https://cdn.elifesciences.org/articles/76262/elife-76262-fig3-figsupp1-data1-v2.xlsx
Figure 4

GCaMP6 recording shows synchronous glucose-induced Ca2+ responses in slices and isolated islets.
GCaMP6 expressed in β cells shows rapid, synchronous Ca2+ responses in slices (A–D) and in isolated islets (E–H) in response to an increase of glucose concentration from 2.8 to 16.7 mM. Images (F) were ratioed against baseline fluorescence (F0) before stimulation and expressed on a pseudocolour scale. (C) shows an image of the SRB fluorescence that outlines the cells and capillaries and identifies regions of interest of 13 cells in this example slice. (D) shows the trace of fluorescence ratio (F/F0) plotted against time, from all 13 regions of interest. In addition, the first vertical red line shows the time point for the image (A) and the second line the time point for image (B). Glucose was added at time 0. (G) shows an image of the SRB fluorescence that outlines the cells and capillaries and identifies regions of interest of 14 cells in this example isolated islet. (H) shows the trace of fluorescence ratio (F/F0) plotted against time, from all 14 regions of interest. In addition, the first vertical red line shows the time point for the image (E) and the second line the time point for image (F). Glucose was added at time 0. Scale bar 10 µm.
Figure 5 with 1 supplement
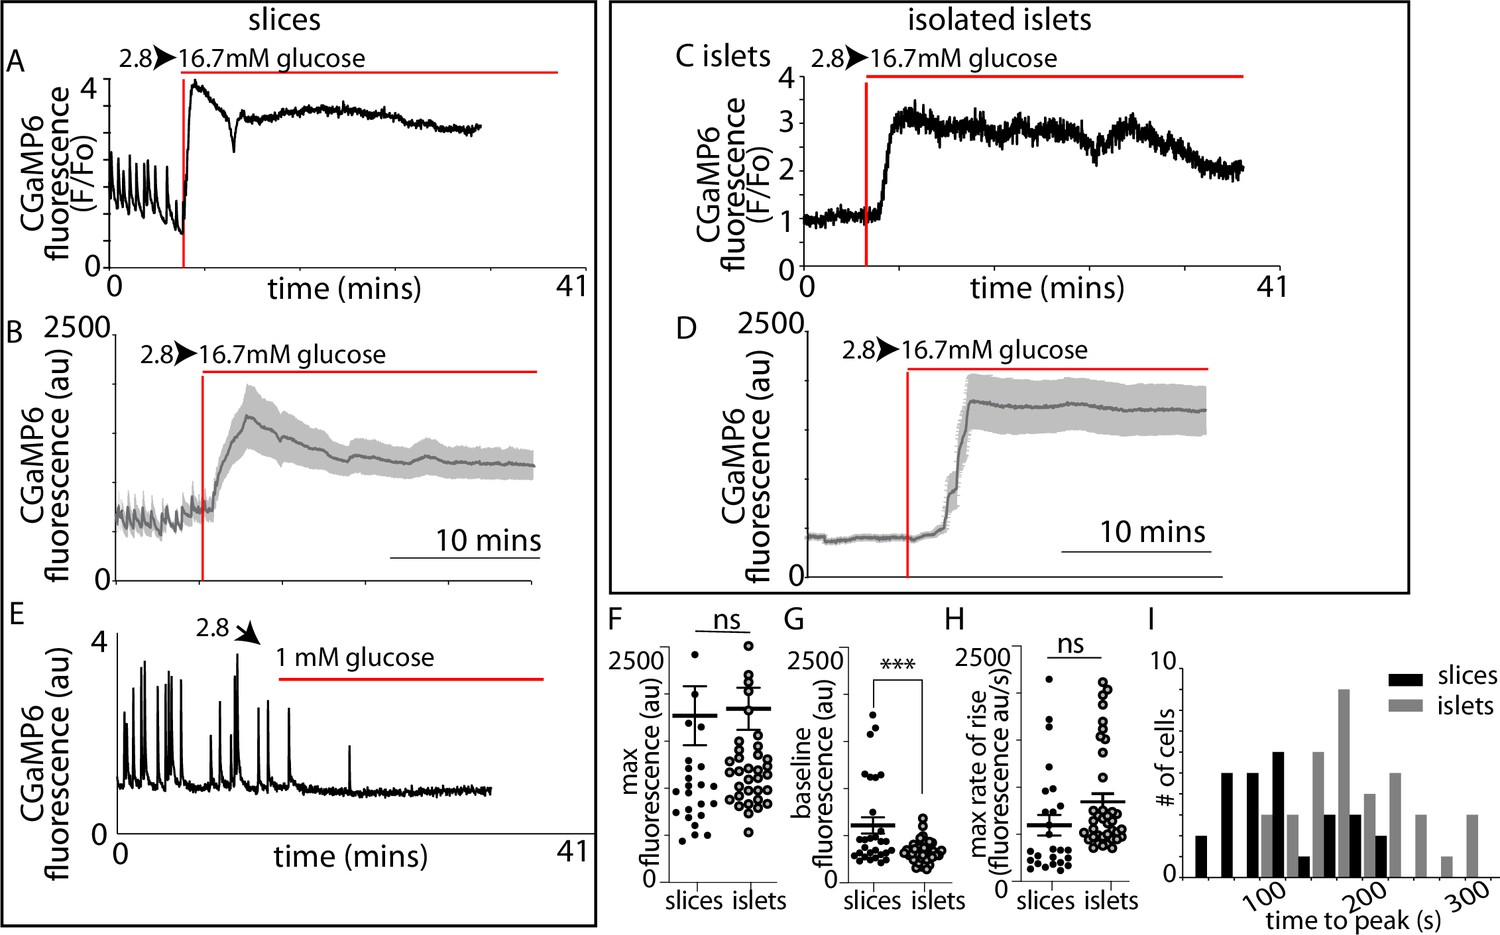
β-Cell Ca2+ responses in slices have short latencies to peak and higher glucose sensitivity compared to isolated islets.
In slices, (A) single example or (B) averaged responses of Ca2+ measured by changes in GCaMP6 fluorescence in β cells within slices showed large, sustained responses to an increase of glucose from 2.8 to 16.7 mM. In slices, we often observed fast Ca2+ spiking in β cells (5/7 slices) prior to the increase in glucose. In isolated islets, the magnitude of (C) single responses, or the (D) average responses were similar to those in slices. (E) The Ca2+ spiking observed at 2.8 mM glucose from β cells within slices was lost when glucose was lowered to 1 mM. (F) The maximum fluorescence and (H) overall maximum rate of rise (islets n = 42 cells, 3 animals, in slices, n = 26 cells, 3 animals, Student’s t-test p = 0.11) of the Ca2+ response was not different between slices and isolated islets. (G) In contrast, the baseline fluorescence was significantly higher in slices versus islets (in isolated islets, n = 43 cells, 6 islets, 3 animals and n = 18 cells, in slices, n = 18 cells, 4 slices, 3 animals, Student’s t-test, p < 0.001). (I) Furthermore, the time to the peak Ca2+ response, using the time of arrival of glucose (with the SRB marker) was significantly delayed in islets compared with slices (178 ± 9 vs. 89 ± 10 s mean ± standard error of the mean [SEM], Student’s t-test p < 0.01 n = 37 cells in islets and 27 cells in slices, n ≥ 3 mice) and the different preparations showed a distinct frequency time distributions. *** shows statistical significance at p<0.001.
-
Figure 5—source data 1
GCaMP signal analysis.
- https://cdn.elifesciences.org/articles/76262/elife-76262-fig5-data1-v2.xlsx
-
Figure 5—source data 2
Time to peak analysis.
- https://cdn.elifesciences.org/articles/76262/elife-76262-fig5-data2-v2.xlsx
-
Figure 5—source data 3
Calcium wave analysis.
- https://cdn.elifesciences.org/articles/76262/elife-76262-fig5-data3-v2.xlsx
Figure 5—figure supplement 1
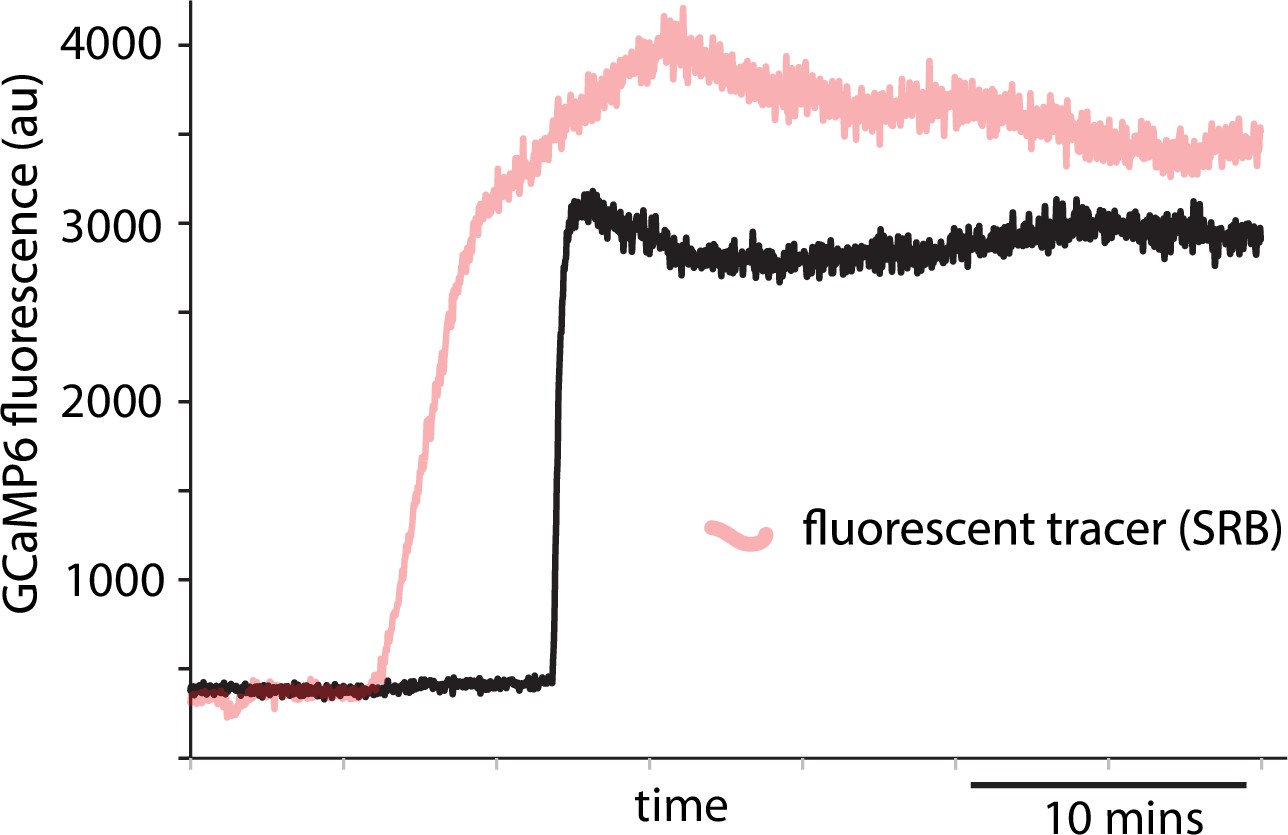
Example record showing use of fluorescent tracer to indicate addition of high glucose.
In experiments with isolated islets and with slices the high glucose solution contained sulforhodamine B as a fluorescent tracer which was recorded from a region of interest close to the responding cell. The example record shows a single-cell Ca2+ response recorded from an isolated islet. The time point where the SRB fluorescence increased identifies when the glucose concentration started to increase and was used to calculate the latency to the peak Ca2+ response in the data shown in Figure 4 for both islets and slices.
Figure 6
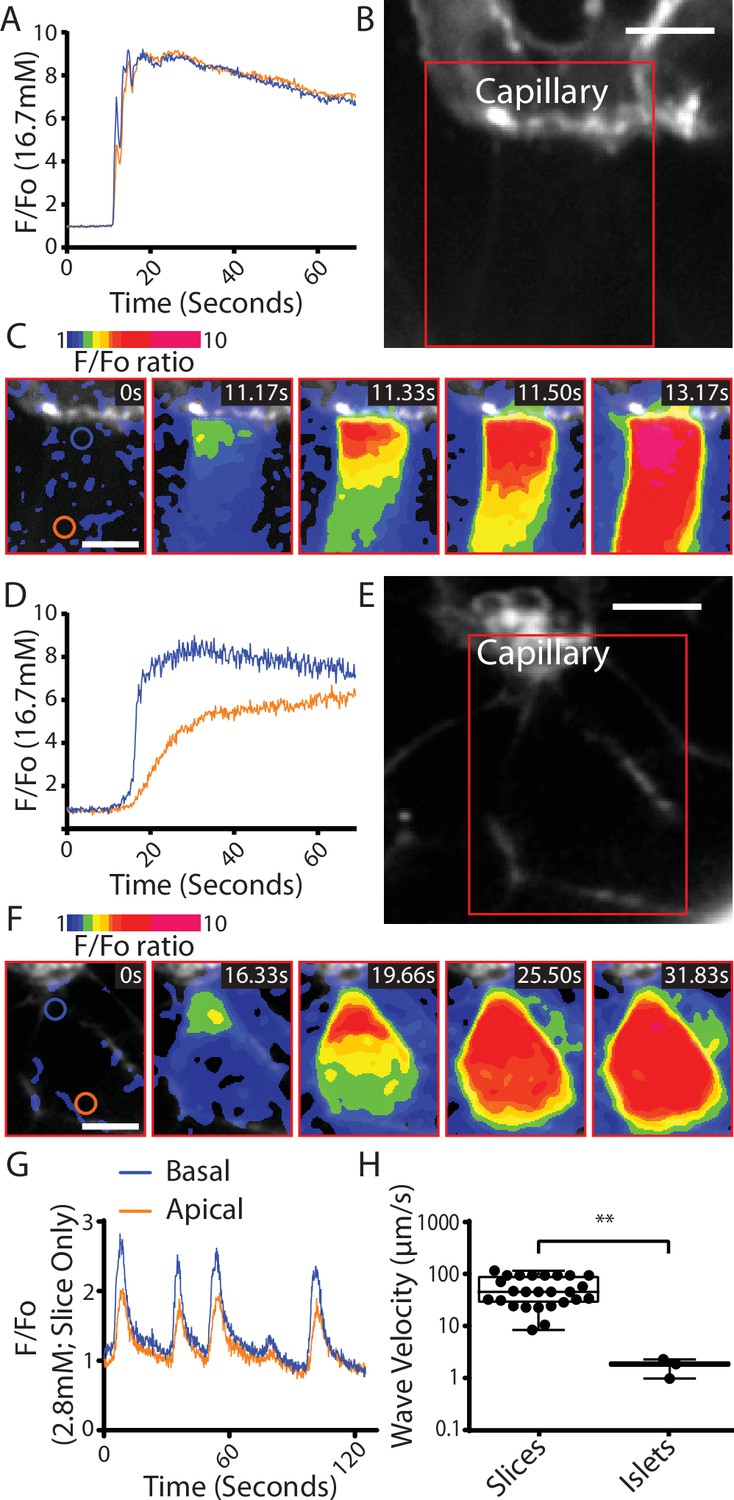
Fast Ca2+ waves originate at the capillary interface of β cells in slices.
(A–C) β cells within the slices that adjoin the capillaries often showed glucose (16.7 mM)-induced Ca2+ responses that originated at the capillary interface and spread rapidly across the cell (apparent velocity 50.6 ± 6.1 µm S−1, mean ± standard error of the mean [SEM], n = 7 slices from 6 animals) to the apical region. (B) shows the capillary (stained with the extracellular dye SRB) the boxed region is shown in (C) which is a pseudocolour map of the F/F0 ratio of GCaMP6 fluorescence at 5 time points over a Ca2+ response. (A) shows the ratio fluorescence trace from small regions of interest (blue and red circles show in C, time 0) close to the capillary (blue trace) or distance from the capillary, the apical region (red trace). (D–F) In isolated islets the capillaries were fragmented, and we rarely observed Ca2+ waves. The waves we did observe originated at the interface with capillary fragments and had a slow velocity. (1.8 ± 0.2 µm S−1, mean ± SEM, n = 3 islets from 3 animals, significantly slower compared with the velocity in slices, Student’s t-test p < 0.01). (E) shows the residual capillary fragment (stained with the extracellular dye SRB) the boxed region is shown in (F) which is a pseudocolour map of the F/F0 ratio of GCaMP6 fluorescence at five time points over a Ca2+ response. (D) shows the ratio fluorescence trace from small regions of interest (blue and red circles show in F, time 0) close to the capillary (blue trace) or distance from the capillary (red trace). (G) shows that during repetitive Ca2+ spiking, recorded using GCaMP6 in slices incubated in 2.8 mM glucose, each spike shows the evidence of a Ca2+ wave travelling from the capillary interface to the apical region. (H) Measurement of Ca2+ wave velocities shows a significant reduction in islets compared to slices (Student’s t-test p < 0.01, n = 24 waves in slices, n = 3 waves in isolated islets, from n = 3 mice) with the caveat of the scarcity of observed waves in isolated islets. Scale bar 5 µm. ** shows statistical significances at p<0.01.
Figure 7

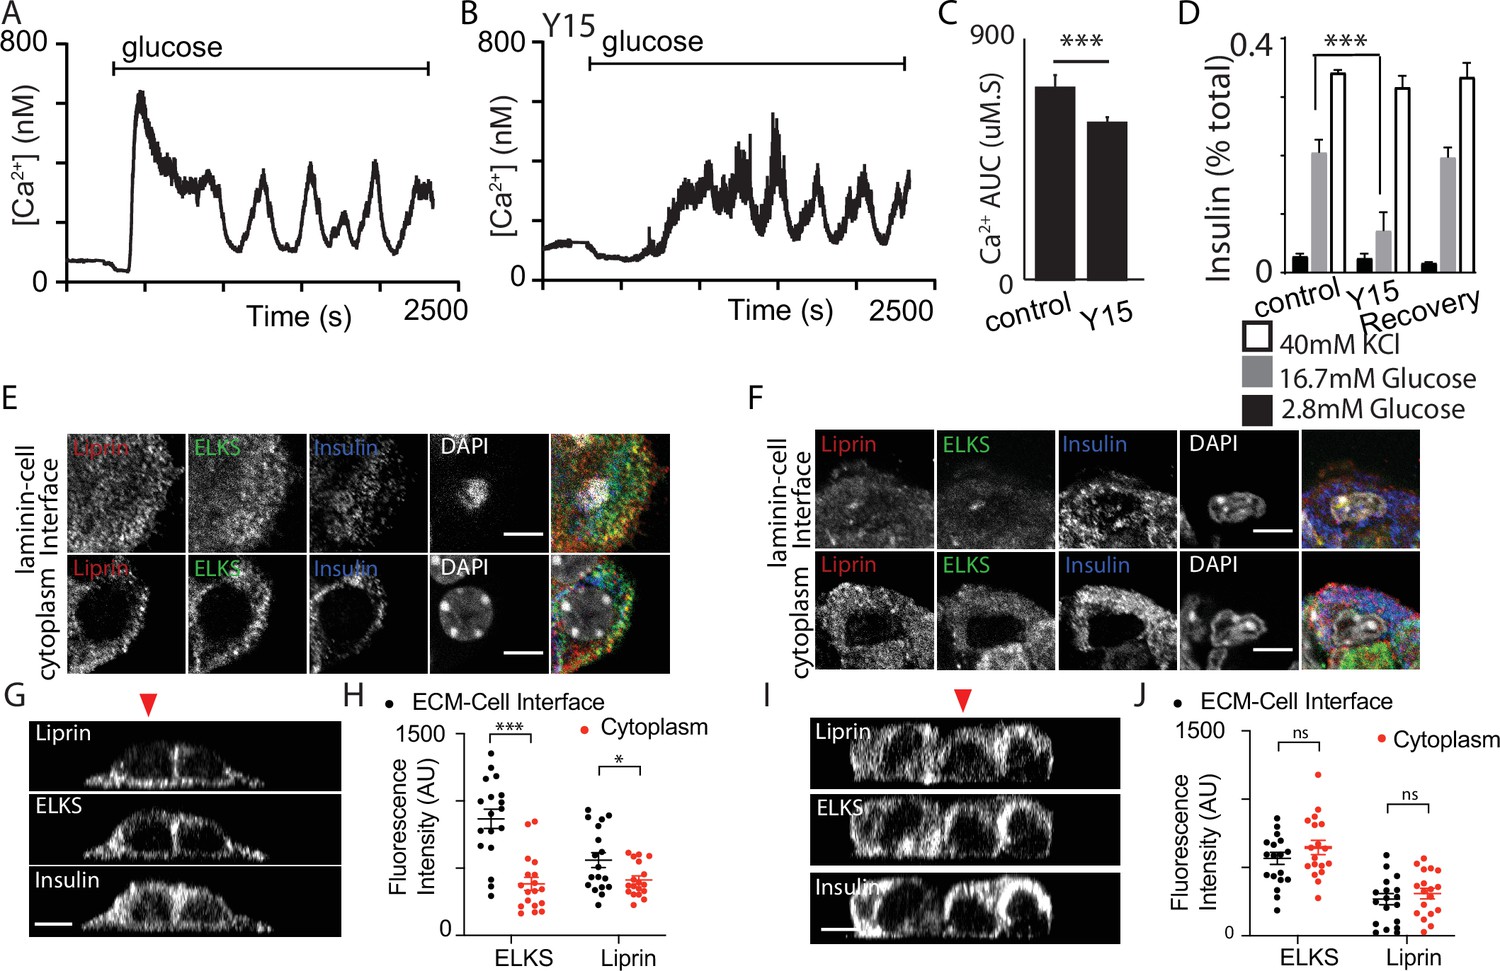
Focal adhesion kinase (FAK) activation regulates glucose-induced Ca2+ responses.
(A) As before, in the slice preparation, Ca2+ spikes were observed at 2.8 mM glucose, as measured with GCaMP6 fluorescence changes. (B) Pretreatment of slices with 2 µM Y15, an inhibitor of FAK, blocked these Ca2+ spikes (data from slices obtained from n = 3 separate animals). (C) To accurately measure the peak amplitude of Ca2+ responses we loaded cells with Fura-2, which has a lower Ca2+ affinity than GCaMP6 (Ca2+-induced fluorescence decreases are expressed as Fo − F/Fo to normalise for the initial fluorescence and to give positive deflections with increases in Ca2+). Ca2+ responses to 16.7 glucose were robust in control and inhibited after pretreatment with Y15, with a significant reduction in peak amplitude (D, n = 8 cells in slices from three separate animals, Student’s t-test p < 0.001). (E) Insulin secretion measured in slices, increased in response to 16.7 mM glucose and was significantly inhibited in the presence of Y15 (n = 4–8) slices from three mice, two-way analysis of variance (ANOVA) showed significant effects of Y15 (F(1, 20) = 6.120; p < 0.0224), glucose concentration (F(1, 20) = 43.82; p < 0.0001), and interaction (F(1, 20) = 10.36; p = 0.0043). A Tukey post hoc comparison showed Y15 significantly reduced the response at 16.7 mM glucose (p = 0.0115). Responses to high potassium (at 2.8 mM glucose) were not affected by the drug (Student’s t-test p = 0.89, n = 8 slices from three mice). (F) In the granule fusion assay (as described in Figure 2) control slices showed many exocytic events (mapped as yellow circles) in response the 16.7 mM glucose for 20 min, clustered close to the capillaries (identified as regions high in SRB). In contrast pretreatment with 2 µM Y15 decreased the number of exocytic events in response to the same glucose stimulus. (G) Quantification shows a reduced number of overall events after treatment with Y15 (Student’s t-test p < 0.05, n = 5 control and four slices in Y15) and (H) a reduced targeting of events to the capillary measured as the percentage of events within 2.5 µm of the capillary (Student’s t-test p < 0.05, n = 5 control and four slices in Y15). (I) Y15 applied to isolated islets had no effect on insulin secretion at either 2.8 or 16.7 mM glucose (n = 3 mice, two-way ANOVA, significant main effect of glucose concentration (F(1, 8) = 18.94; p = 0.0024); no significant effect of Y15 (F(1, 8) = 0.4296; p = 0.5306) nor interaction (F(1, 8) = 1.102; p = 0.3245)). Y15 had no effect on high potassium-induced secretion (Student’s t-test, p = 0.36, n = 3 preparations from three mice). Scale bar 10 µm. * shows statistical significance at p<0.05; *** shows statistical significance at p<0.001.
-
Figure 7—source data 1
Fura calcium responses and effect of Y15.
- https://cdn.elifesciences.org/articles/76262/elife-76262-fig7-data1-v2.xlsx
-
Figure 7—source data 2
Secretion and effect of Y15.
- https://cdn.elifesciences.org/articles/76262/elife-76262-fig7-data2-v2.xlsx
-
Figure 7—source data 3
Secretion and Y15.
- https://cdn.elifesciences.org/articles/76262/elife-76262-fig7-data3-v2.xlsx
Figure 8 with 1 supplement
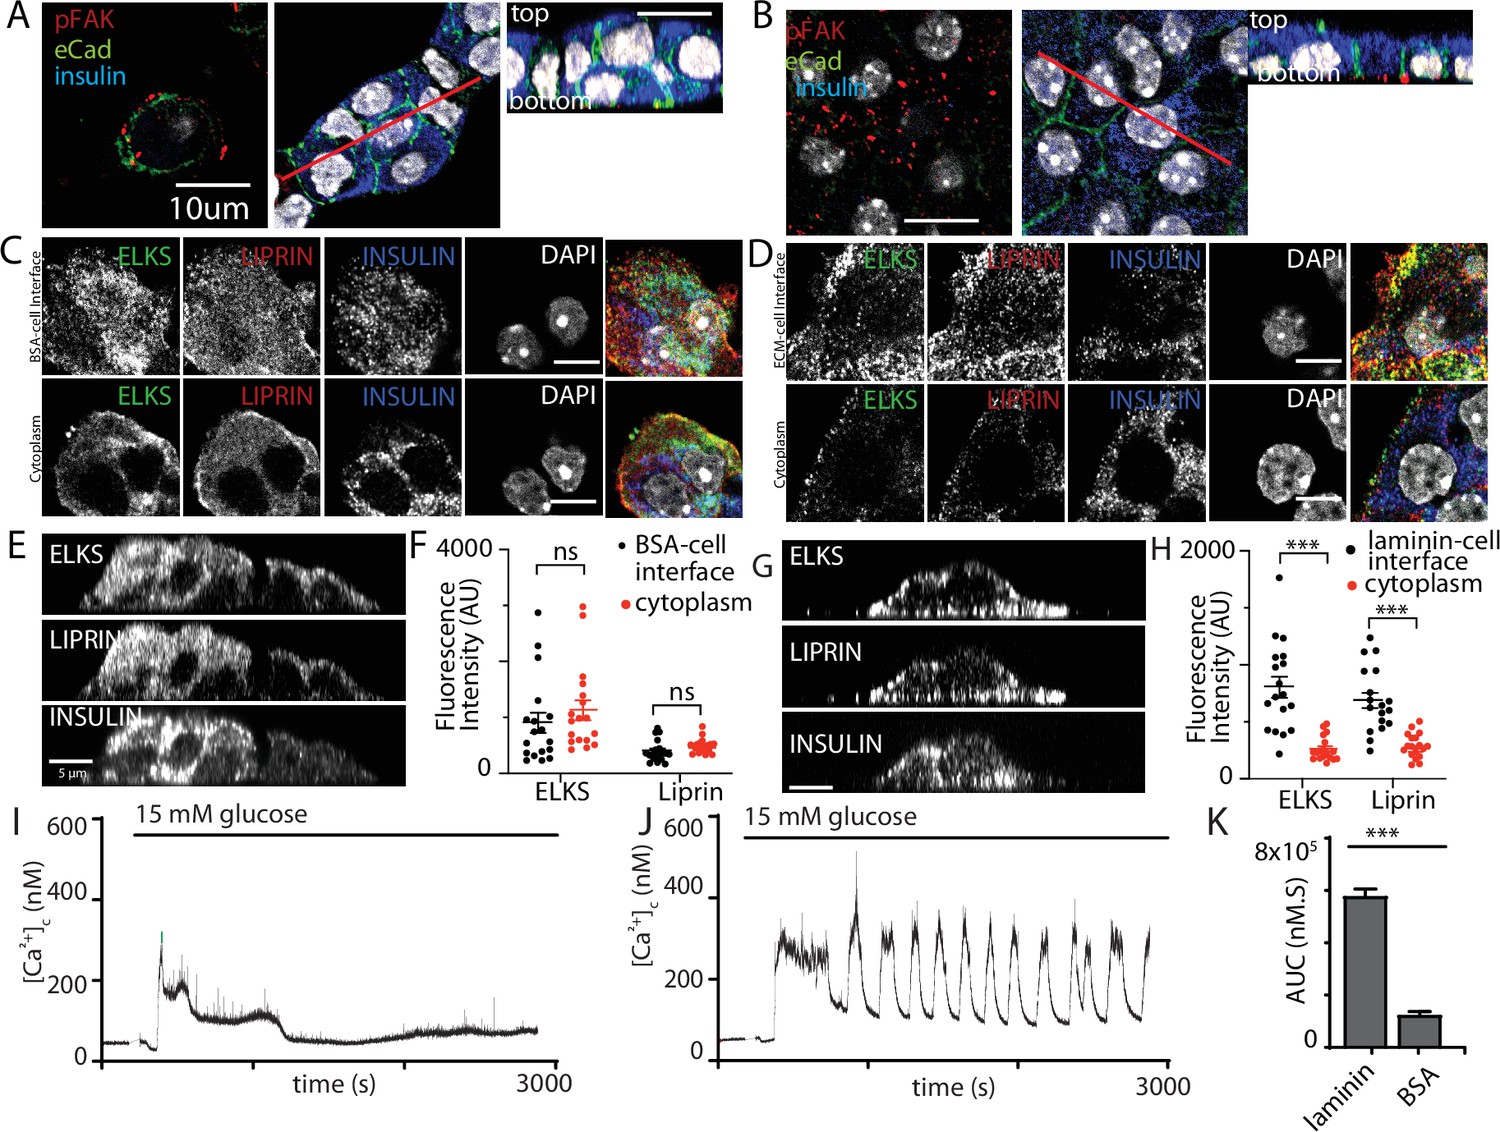
Integrin activation mediates β-cell orientation and glucose-dependent Ca2+ responses.
(A) Immunofluorescence staining of phospho-FAK, E-cadherin, and insulin showed that isolated β cells, cultured on bovine serum albumin (BSA)-coated coverslips, were disorganised. Cells were multilayered and the phospho-FAK staining scattered at the edges of the footprint of the cells, also see orthogonal sections. (B) In contrast cells cultured on laminin-coated coverslips showed extensive, punctate phospho-FAK located at the cell footprint (as shown in the orthogonal section) and organised E-cadherin staining at the cell junctions. Immunofluorescence staining of isolated β cells (insulin; blue), grown on BSA- (C) or laminin- (D) coated coverslips showed enriched ELKS (green) and liprin (red) staining at the laminin–cell, but not BSA–cell interface, compared with the cytoplasm, see orthogonal sections (XZ) for cells cultured on BSA (E) or laminin (G). (F) Average fluorescence intensity of both ELKS (Student’s t-test, p < 0.001) and liprin (Student’s t-test, p < 0.05) were significantly lower at the BSA–cell interface compared with the cytosol (36 regions of interest [ROIs], n = 6 cells from three animals). (H) In the cells cultured on laminin the average fluorescence intensity of ELKS and liprin were significantly higher at the laminin–cell interface compared with the cytosol (Student’s t-tests, p < 0.001) (36 ROIs, n = 6 cells from three animals). Using Fura-2-loaded, isolated β cells cultured on BSA, high glucose induced a modest, short-lasting response (I) that contrasted with the large response and sustained oscillations when the cells were cultured on laminin (J), with a significant reduction in area under the curve (AUC) of the response (K, Student’s t-test p < 0.001, n = 36 cells on laminin and n = 21 cells on BSA). Scale bars in (A, B) 10 µm, all others 5 µm. *** shows statistical significance at p<0.001.
-
Figure 8—source data 1
Scaffold protein distribution analysis.
- https://cdn.elifesciences.org/articles/76262/elife-76262-fig8-data1-v2.xlsx
Figure 8—figure supplement 1
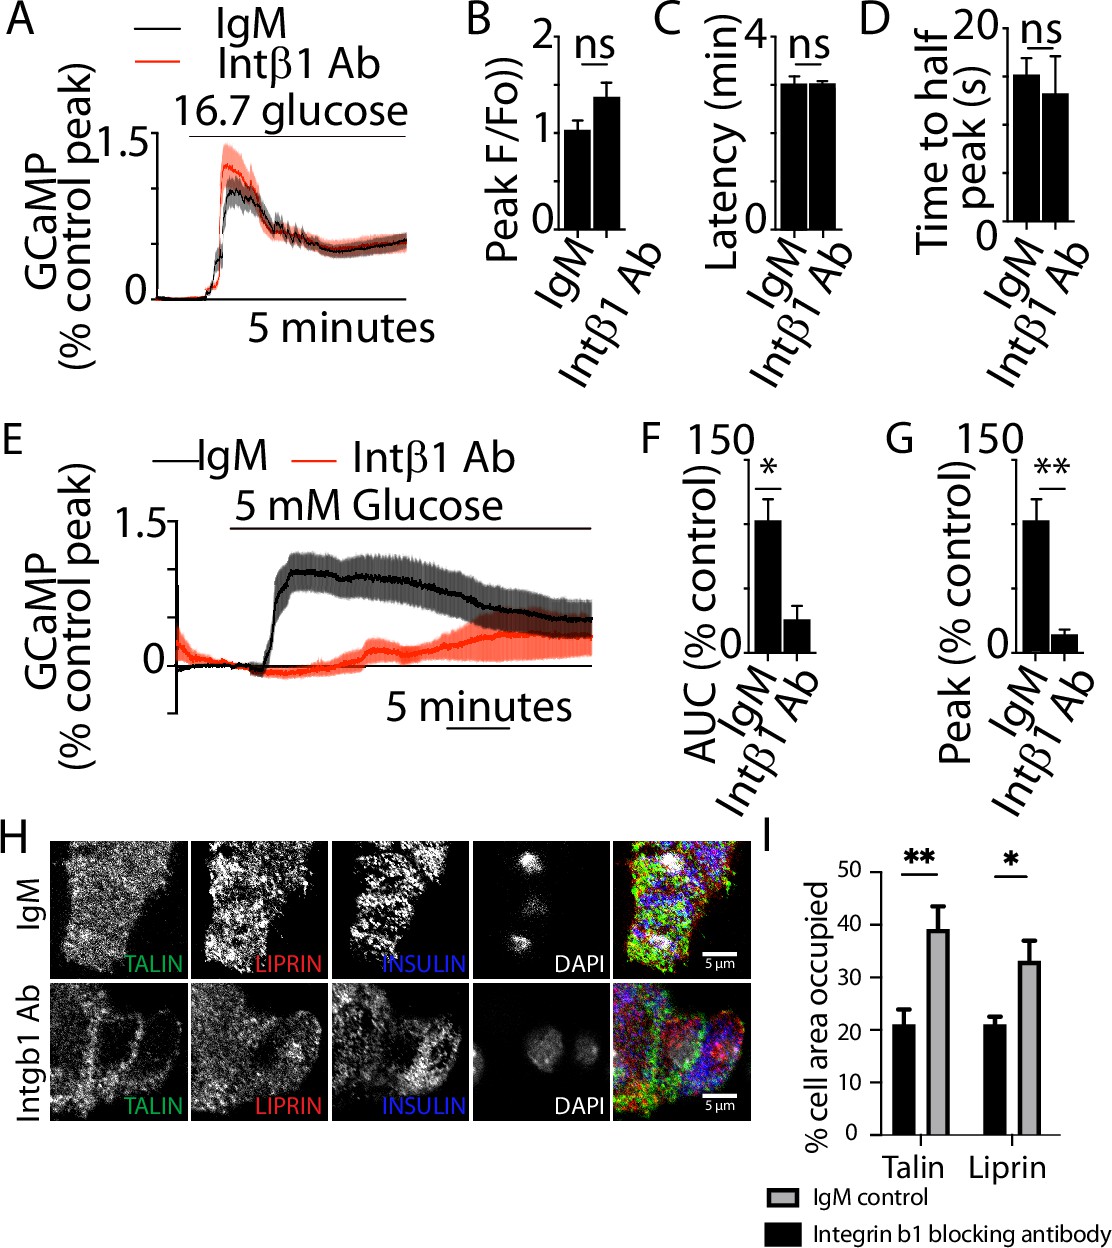
Blockade of integrin activation disrupts β-cell structure.
Glucose-induced Ca2+ responses were recorded using live-cell two-photon microscopy in β cells expressing the Ca2+ indicator GCaMP. GCaMP fluorescence was recorded over 30 min following high glucose (16.7 mM) stimulation in isolated β cells incubated with integrin-β1 function-blocking antibody (25 µg/ml) compared with IgM control (for each condition, n = 47–49 cells from three animals). (A–D) No significant differences in GCaMP peak amplitude (Student’s t-test, p = 0.09), latency (time between glucose addition and calcium response) (Student’s t-test, p = 0.93), and time to half peak (Student’s t-test, p = 0.66), were observed. (E–G) Representative Ca2+ traces within a single β cell, in the presence of IgM control or integrin-β1 function-blocking antibody, in response to 5 mM glucose (for each condition, n = 23–43 cells across three animals). (E) Average Ca2+ traces showed a robust response in the IgM condition, but a smaller and slower response in the Intβ1 block condition. (F, G) Incubation in Intβ1 blocking antibody decreased average AUC (Student’s t-test, p < 0.05) and GCaMP peak amplitude (Student’s t-test, p < 0.01). Scale bar 5 µm. (H) Immunostaining of β cells cultured on to laminin-coated coverslips, showed that the positioning of liprin and the focal adhesion protein talin, that are normally enriched at the footprint, as shown by percentage of area occupied (I), are lost after preincubation with integrin-β1 blocking antibody (Student’s t-test, for talin p < 0.01 and liprin p < 0.05, six cell clusters from three mice). Scale bar 5 µm. * shows statistical significance at p<0.05; ** shows statistical significances at p<0.01.
Figure 9
Focal adhesion kinase (FAK) regulates both Ca2+ responses and positioning of presynaptic scaffold proteins.
In Fura-2-loaded cells (cultured on laminin), we observed the typical robust response to high glucose followed by sustained oscillations in control (A). A smaller, delayed response was observed in the presence of 2 µM Y15 (B) with a significant reduction in AUC (C, using regions of interest [ROIs] from n = 218 cells in DMSO and 208 cells in Y15, measured over the total time of 2500 s, from three mice, Student’s t-test p < 0.001). (D) Insulin secretion, measured in dispersed cells cultured on laminin, was reversibly (after a 6 hr wash) reduced in the presence of Y15 (n = 3 animals in each condition, Student’s t-test p < 0.001). No significant difference in insulin secretion was observed following potassium stimulation between cells incubated with Y15 compared with DMSO control (n = 3 animals, Student’s t-test p = 0.25). (E, G, H) As before, immunostaining showed enrichment of liprin and ELKS at the laminin–cell interface which was blocked after pretreatment with Y15 (F, I, J, ELKS Student’s t-test, p = 0.15 and liprin, Student’s t-test, p = 0.28, 36 ROIs, n = 6 cells from three animals). Scale bar 5 µm. * shows statistical significance at p<0.05; *** shows statistical significance at p<0.001.
-
Figure 9—source data 1
Effect of Y15 on calcium responses.
- https://cdn.elifesciences.org/articles/76262/elife-76262-fig9-data1-v2.xlsx
-
Figure 9—source data 2
Insulin secretion and effect of Y15.
- https://cdn.elifesciences.org/articles/76262/elife-76262-fig9-data2-v2.xlsx
-
Figure 9—source data 3
Scaffold protein distribution and Y15.
- https://cdn.elifesciences.org/articles/76262/elife-76262-fig9-data3-v2.xlsx
Additional files
Download links
A two-part list of links to download the article, or parts of the article, in various formats.
Downloads (link to download the article as PDF)
Open citations (links to open the citations from this article in various online reference manager services)
Cite this article (links to download the citations from this article in formats compatible with various reference manager tools)
Local activation of focal adhesion kinase orchestrates the positioning of presynaptic scaffold proteins and Ca2+ signalling to control glucose-dependent insulin secretion
eLife 11:e76262.
https://doi.org/10.7554/eLife.76262


