Proteostasis is differentially modulated by inhibition of translation initiation or elongation
- Department of Molecular Medicine, Department of Neuroscience, Scripps Research Institute, United States
Figures
Figure 1 with 1 supplement
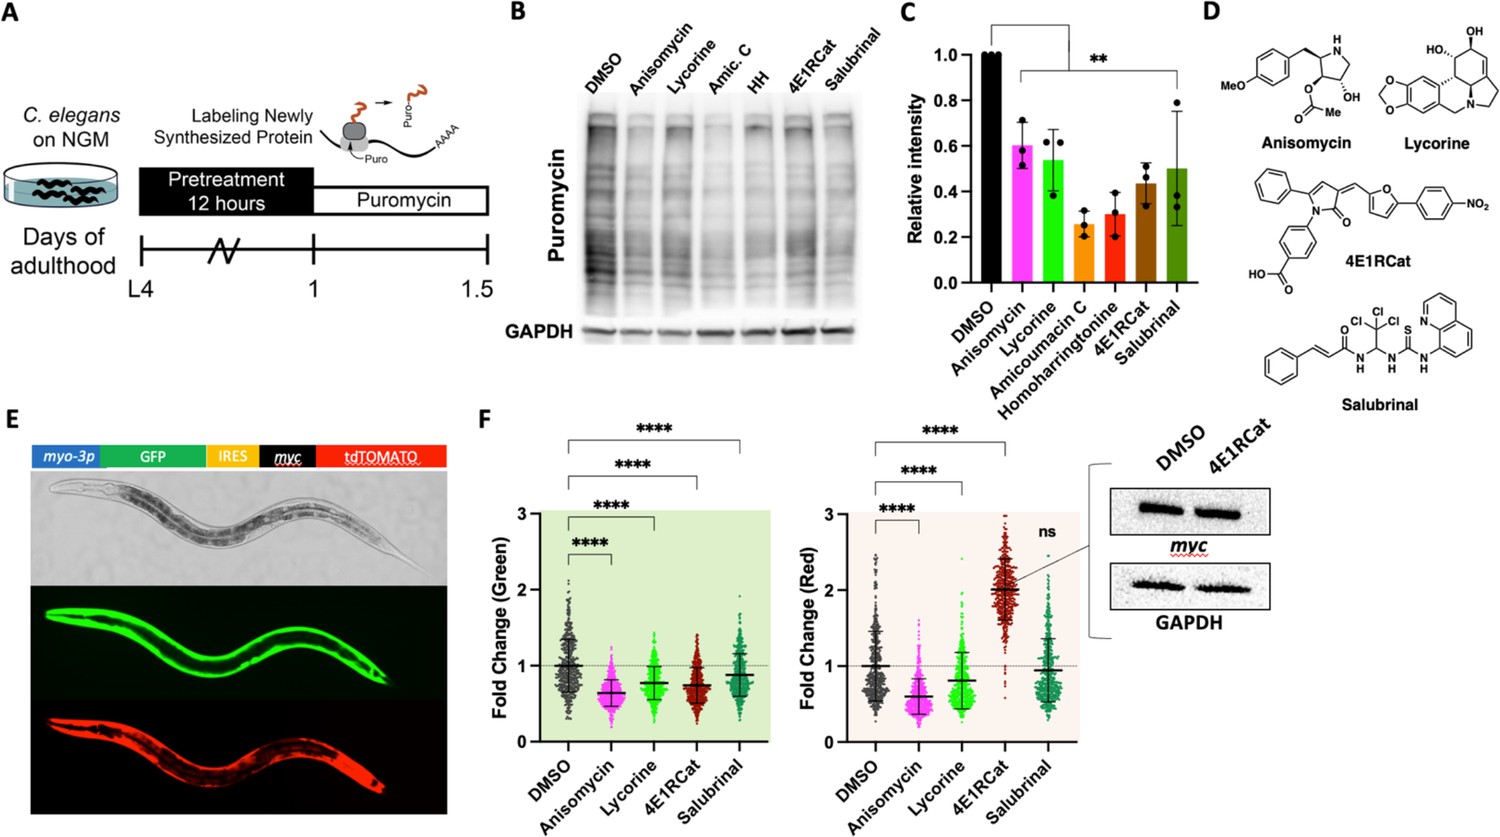
Identifying mechanistic inhibitors of protein synthesis in C. elegans.
(A) Monitoring changes in protein synthesis using the SUrface SEnsing of Translation (SUnSET) method. C. elegans were treated with solvent (DMSO) or the indicated inhibitors (100 μM) for 12 hr, followed by a 4 hr puromycin incorporation. Worms were lysed, and protein extracts were run on SDS-PAGE gels, followed by staining with a puromycin-specific antibody. (B) Six translation inhibitors reduce puromycin incorporation relative to DMSO control. GAPDH was used as a loading control. (C) Quantification of three independent SUnSET experiments, as shown in (B). Significance was determined by one-way ANOVA with Dunnett’s multiple comparisons tests where **=p ≤ 0.01 for all treatments. Error bars indicate mean ± SD from three independent trials. (D) Chemical structures of anisomycin, lycorine, 4E1RCat, and salubrinal. Note each is structurally distinct. (E) Representative pictures showing the expression pattern of the bi-cistronic reporter in L4 stage animals. The image in the brightfield channel shows an L4 stage animal. Images in green and red channels show that GFP and tdtomato are expressed in body wall muscle. (F) Fluorescence of 500 transgenic animals treated with anisomycin, lycorine, 4E1RCat, and salubrinal. Each treatment reduced the GFP signal (green shading), but only anisomycin and lycorine reduced the dtTomato signal (red shading). Significance was determined by one-way ANOVA with Dunnett’s multiple comparisons tests where ****=p ≤ 0.0001 for all treatments. Error bars indicate mean ± SD. The experiment was repeated four times with similar results. Inset: 4E1RCat emits red fluorescence; therefore, the expression of tdTomato needed to be tested by western blot. 4E1Rcat does not change myc expression on the protein level, GAPDH is used as a loading control, a representative image of three independent experiments.
-
Figure 1—source data 1
Unedited SUrface SEnsing of Translation (SUnSET) western blots.
- https://cdn.elifesciences.org/articles/76465/elife-76465-fig1-data1-v2.zip
-
Figure 1—source data 2
Quantifications of western blots.
- https://cdn.elifesciences.org/articles/76465/elife-76465-fig1-data2-v2.zip
-
Figure 1—source data 3
ChemDraw files for structures.
- https://cdn.elifesciences.org/articles/76465/elife-76465-fig1-data3-v2.zip
-
Figure 1—source data 4
Summary of green/red integrated fluorescence and unedited myc/GAPDH blots.
- https://cdn.elifesciences.org/articles/76465/elife-76465-fig1-data4-v2.zip
Figure 1—figure supplement 1
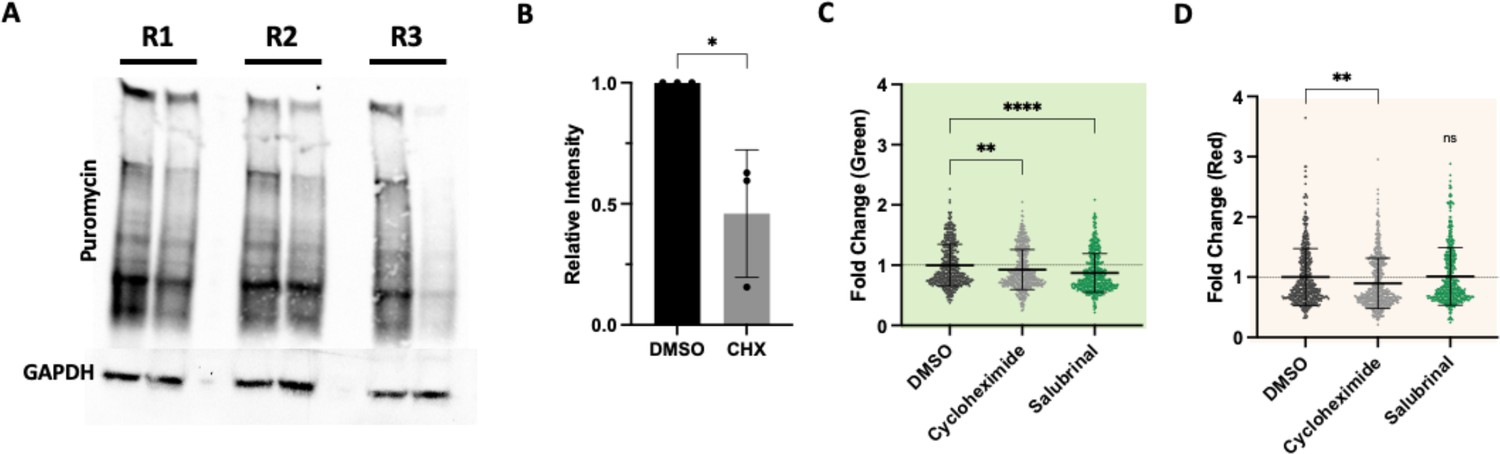
Cycloheximide, a ubiquitously used eukaryotic translation inhibitor, inhibits translation elongation (TE) in C. elegans.
(A) Cycloheximide (100 μΜ) unreliably reduces puromycin incorporation relative to DMSO control in N2 animals. All three experiments were conducted under identical conditions and run on the same blot to reduce technical batch effects but resulted in unreliable reductions of newly synthesized proteins. (B) Quantification of three independent SUrface SEnsing of Translation (SUnSET) experiments. Data are displayed as mean ± SEM and *=p ≤ 0.05 by two-tailed Student’s t-test. Note the large error bars for cycloheximide treatment that led us to exclude it from the study, as cycloheximide does not allow precise control over the concentration of newly synthesized proteins. We note the p-value is higher than when anisomycin or lycorine are used. (C) Replicate experiment as in Figure 1F with cycloheximide and salubrinal. Each treatment reduced the GFP signal. Significance was determined by one-way ANOVA with Dunnett’s multiple comparisons tests where **=p ≤ 0.01 and ****=p ≤ 0.0001. Error bars indicate mean ± SD. The experiment was repeated three times with similar results. We note the p-value was less significant for cycloheximide than for the same experiment using anisomycin or lycorine instead. (D) Replicate experiment as in Figure 1F with cycloheximide and salubrinal. Only the TE inhibitor cycloheximide reduced tdTomato signal while the initiation inhibitor salubrinal did not. Significance was determined by one-way ANOVA with Dunnett’s multiple comparisons tests where **=p ≤ 0.01. Error bars indicate mean ± SD. The experiment was repeated three times with similar results. We note the p-value was less significant for cycloheximide than for the same experiment using anisomycin or lycorine instead.
-
Figure 1—figure supplement 1—source data 1
Unedited SUrface SEnsing of Translation (SUnSET) western blots.
- https://cdn.elifesciences.org/articles/76465/elife-76465-fig1-figsupp1-data1-v2.zip
-
Figure 1—figure supplement 1—source data 2
Quantifications of western blots.
- https://cdn.elifesciences.org/articles/76465/elife-76465-fig1-figsupp1-data2-v2.zip
-
Figure 1—figure supplement 1—source data 3
Summary of green integrated fluorescence.
- https://cdn.elifesciences.org/articles/76465/elife-76465-fig1-figsupp1-data3-v2.zip
-
Figure 1—figure supplement 1—source data 4
Summary of red integrated fluorescence.
- https://cdn.elifesciences.org/articles/76465/elife-76465-fig1-figsupp1-data4-v2.zip
Figure 2
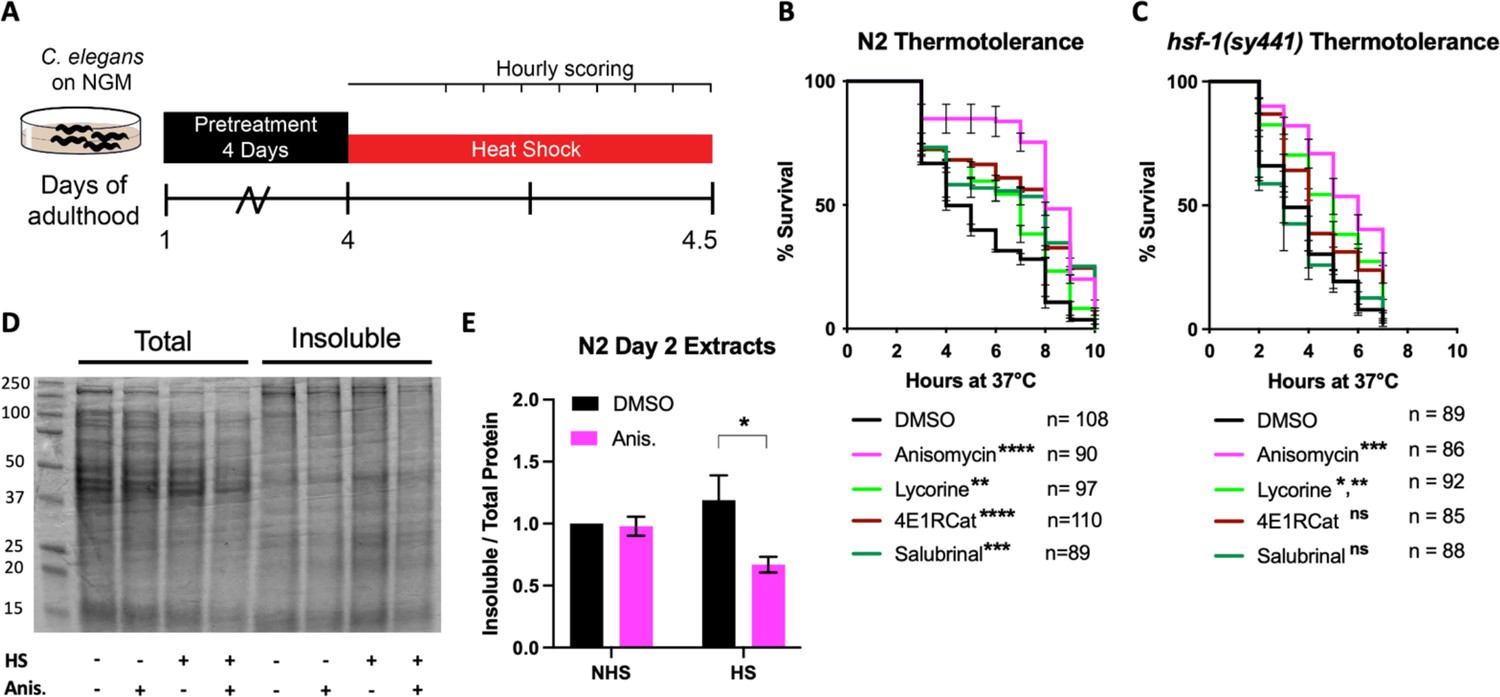
Initiation but not elongation inhibitors depend on HSF-1 to protect C. elegans from thermal stress.
(A) Day 1 adult wild-type (N2) and hsf-1(sy441) animals were treated for 3 days, then transferred to NGM plates. They were then subjected to a constant, non-permissive temperature of 36°C (heat shock [HS]) and scored alive/dead every hour by movement. (B) Graph shows survival as a function of hours at 36°C of day 4 adult N2 animals pre-treated with 100 μM translation inhibitor. Data show the mean ± SEM from three independent trials where each measurement is at least: **=p ≤ 0.01, ***p≤0.001, and ****p≤0.0001 by row-matched two-way ANOVA with Šídák multiple comparisons test. (C) Graph shows survival as a function of hours at 36°C of day 4 adult hsf-1(sy441) animals pre-treated with 100 μM translation inhibitor. Data show the mean ± SEM from three independent trials where each measurement is at least: *=p ≤ 0.05, **=p ≤ 0.01, and ***p≤0.001 by row-matched two-way ANOVA with Šídák multiple comparisons test. (D) Representative SDS-PAGE gel stained with the protein stain Coomassie blue for visualization. Anisomycin (Anis.) reduces the proportion of detergent-insoluble protein following a 2 hr HS of N2 animals. Proteins were detergent extracted, ultracentrifuged, and the insoluble pellet was resuspended in 8 M urea before running on the gel. (E) Quantification of four separate extractions shows anisomycin significantly reduces HS-induced aggregation in wild-type N2 animals. Gels were stained with Sypro Ruby. Data are displayed as mean ± SEM and *=p ≤ 0.05 by two-tailed Student’s t-test.
-
Figure 2—source data 1
Summary of thermotolerance survival numbers (N2).
- https://cdn.elifesciences.org/articles/76465/elife-76465-fig2-data1-v2.zip
-
Figure 2—source data 2
Summary of thermotolerance survival numbers (hsf-1(sy441)).
- https://cdn.elifesciences.org/articles/76465/elife-76465-fig2-data2-v2.zip
-
Figure 2—source data 3
Unedited SDS-PAGE gel.
- https://cdn.elifesciences.org/articles/76465/elife-76465-fig2-data3-v2.zip
-
Figure 2—source data 4
Quantifications of insoluble gels.
- https://cdn.elifesciences.org/articles/76465/elife-76465-fig2-data4-v2.zip
Figure 3 with 1 supplement
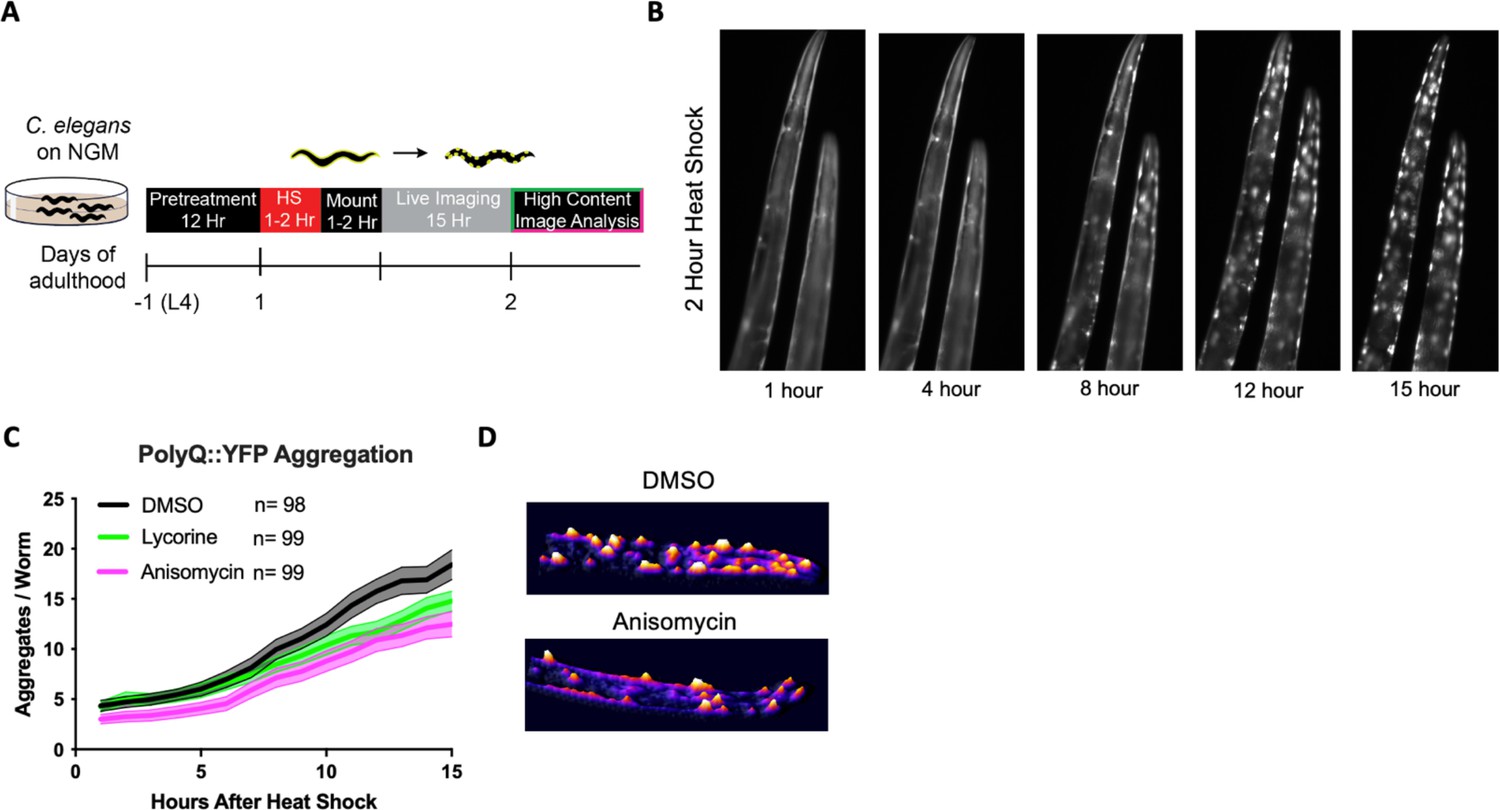
Elongation inhibitors reduce the number of heat shock-induced protein aggregates.
(A) Day 1 AM140 adult worms expressing the polyglutamine-YFP fusion protein (PolyQ::YFP) in their muscle were subjected to heat stress (HS) on NGM plates for 2 hr at 36°C followed by a 1–2 hr mounting/immobilization procedure in 384-well plates and subsequent live imaging for 15 hr. (B) Fluorescent time-lapse images of two animals expressing the PolyQ::YFP fusion protein in the body wall muscle. The animals were embedded in the hydrogel for immobilization. Following a 2 hr HS, animals were imaged over 15 hr; by 8 hr, the YFP signal began to localize into discrete puncta that persisted through the observation time. (C) Graph shows the mean number of PolyQ aggregates per worm as a function of time following heat shock. C. elegans (PolyQ::YFP) were pre-treated with lycorine, anisomycin (100 μΜ), or DMSO. Lines indicate mean, and shading indicates 95% CI. (D) Representative images of control (top) and 100 μΜ anisomycin-treated (bottom) PolyQ animals 15 hr after HS. The representative images shown have been uniformly modified using the ‘3D Surface Plot’ plugin in ImageJ to visualize aggregates.
-
Figure 3—source data 1
Uncropped time-lapse fluorescence micrographs.
- https://cdn.elifesciences.org/articles/76465/elife-76465-fig3-data1-v2.zip
-
Figure 3—source data 2
Summary of aggregation numbers.
- https://cdn.elifesciences.org/articles/76465/elife-76465-fig3-data2-v2.zip
-
Figure 3—source data 3
Video of aggregation process with ‘3D Surface Plot’ plugin.
- https://cdn.elifesciences.org/articles/76465/elife-76465-fig3-data3-v2.zip
Figure 3—figure supplement 1
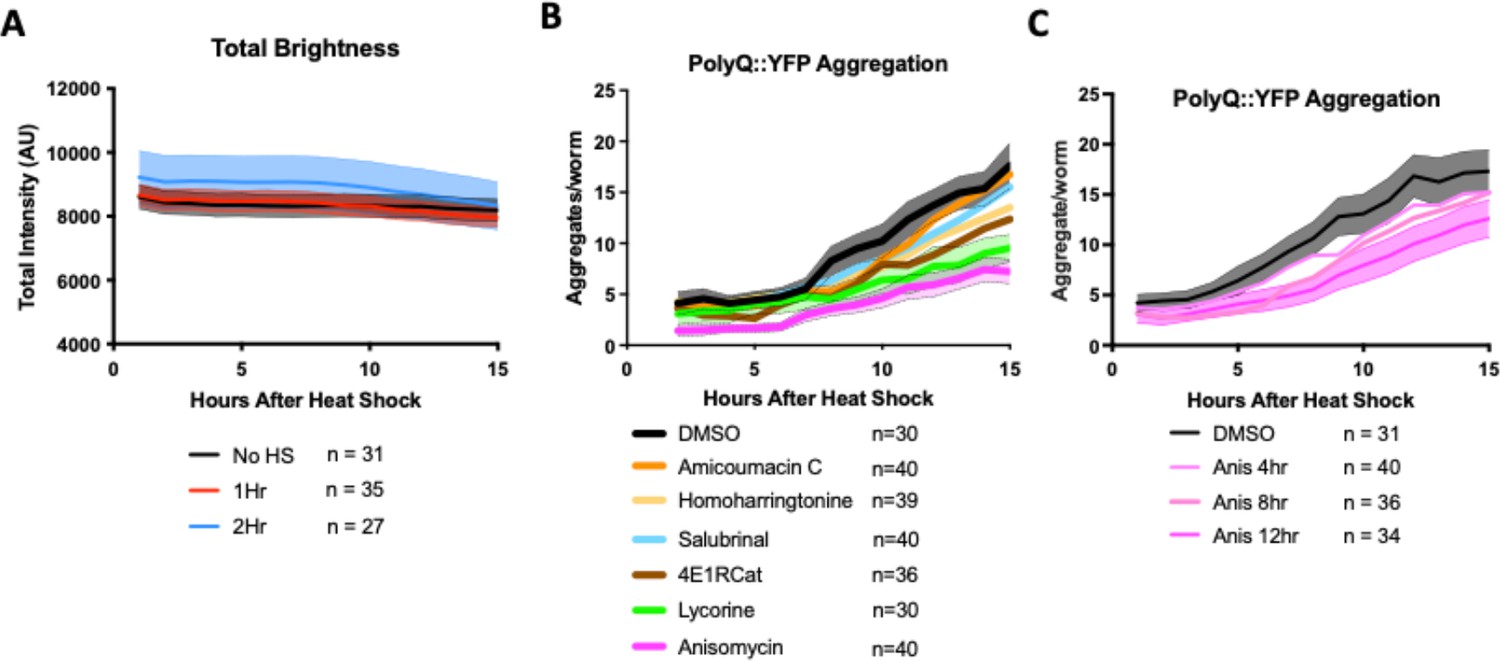
Requirements for protection from heat shock-induced polyglutamine (PolyQ) aggregation.
(A) Total fluorescent YFP intensity in PolyQ transgenic animals does not change significantly within the 15 hr of imaging of the animals after the heat stress (HS), showing that the aggregate formation is a redistribution of soluble PolyQ::YFP into aggregation foci. Lines indicate mean, and shading indicates 95% CI. (B) Transgenic AM140 worms treated with indicated chemicals for 12 hr at the late L4 stage, then subjected to 36°C for 2 hr on day 1 of adulthood. Anisomycin and lycorine had suppressed aggregate formation as measured in our live imaging protocol. In addition, there was a non-significant tendency for 4ER1Cat. Lines indicate mean, and shading indicates 95% CI for DMSO, anisomycin, and lycorine. (C) 12 hr pre-treatment of anisomycin in PolyQ C. elegans was necessary to inhibit aggregation significantly. Lines indicate means, while DMSO and 12 hr treatment with anisomycin (100 μΜ) includes 95% CI as indicated by shading.
-
Figure 3—figure supplement 1—source data 1
Quantification of heat shock time dependency.
- https://cdn.elifesciences.org/articles/76465/elife-76465-fig3-figsupp1-data1-v2.zip
-
Figure 3—figure supplement 1—source data 2
Quantification of translation inhibitor screen HS-induced aggregation.
- https://cdn.elifesciences.org/articles/76465/elife-76465-fig3-figsupp1-data2-v2.zip
-
Figure 3—figure supplement 1—source data 3
Quantification of time dependency for inhibitor treatment.
- https://cdn.elifesciences.org/articles/76465/elife-76465-fig3-figsupp1-data3-v2.zip
Figure 4 with 1 supplement
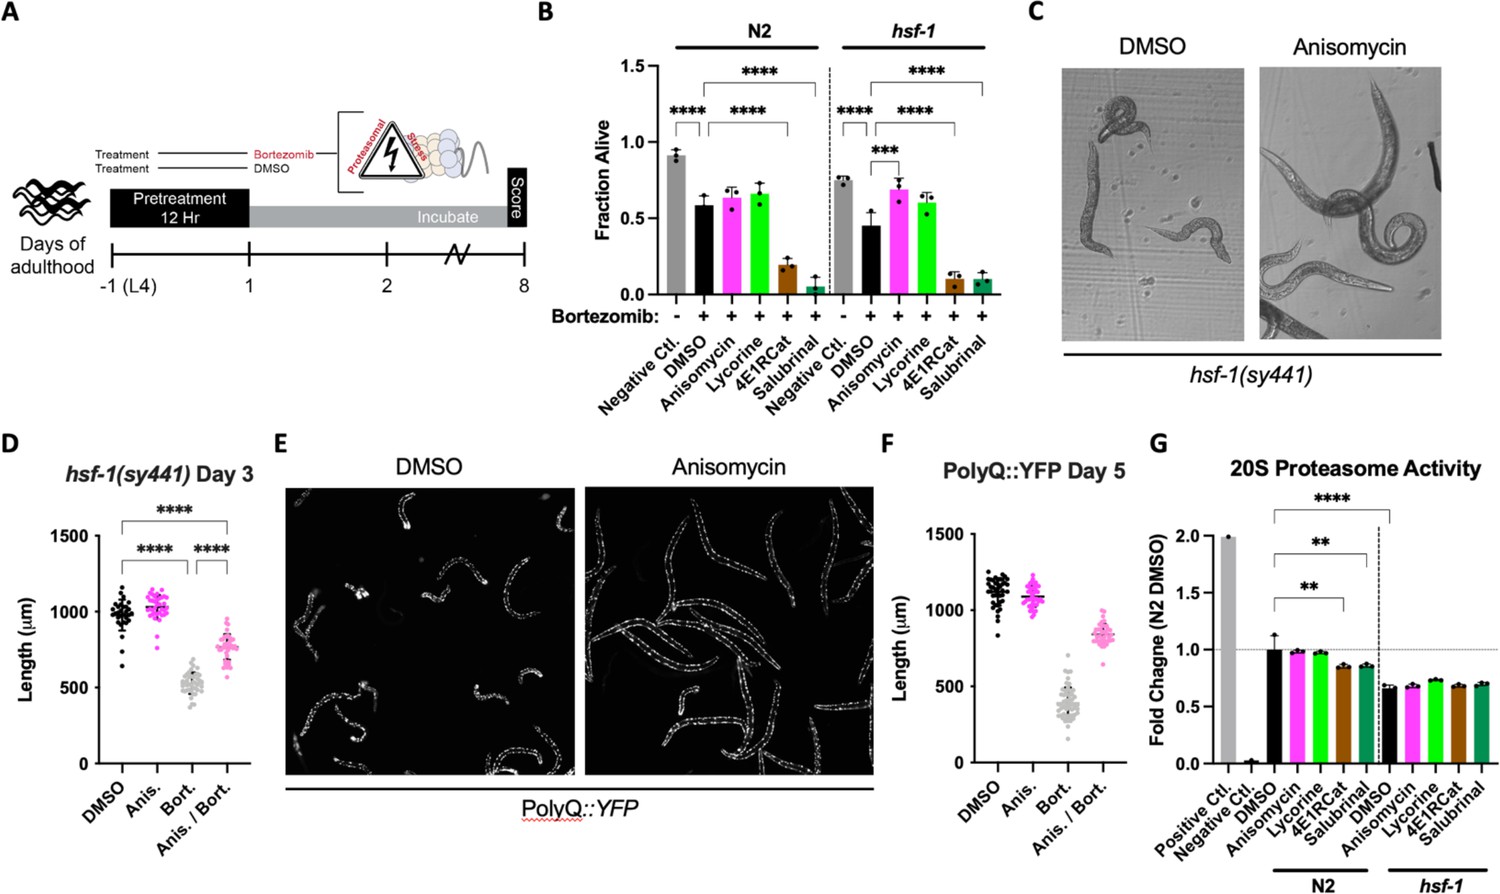
Elongation inhibitors protect C. elegans from proteasomal stress independent of hsf-1.
(A) Worms were pre-treated for 12 hr with DMSO or indicated inhibitors, followed by bortezomib (75 μM) treatment. The animals were then incubated with the combined treatment for 8 days and scored as alive/dead based on movement. (B) TE inhibitor treatment improved morphological features (not shown) and provided limited protection from bortezomib-induced proteotoxicity in N2 animals. TI inhibitor treatment enhanced toxicity. In hsf-1(sy441) animals, TE inhibitors protected from bortezomib-induced proteotoxicity, while TI inhibitors continued to sensitize worms to proteotoxicity. Data are displayed as mean ± SD and ****=p < 0.0001 by one-way ANOVA with Dunnet’s multiple comparisons test. Total of three independent experiments. (C) Representative brightfield images of day 3 hsf-1(sy441) animals show anisomycin pre-treatment prevented the sma phenotype observed to be caused by proteasomal inhibition. (D) Measured length of hsf-1(sy441) worms at day 3 of adulthood. Anisomycin treatment almost completely rescued the sma phenotype induced by bortezomib. Data are displayed as mean ± SD and ****=p < 0.0001 by a one-way ANOVA with Šídák multiple comparisons test. 30–42 animals per condition. Total of three independent experiments. (E) Representative fluorescent images of PolyQ worms treated with anisomycin at day 5. Bortezomib treatment caused morphological defects in animals (left panel), and anisomycin pre-treatment prevented these pathological defects (right panel). (F) Measured length of PolyQ worms at day 5 of adulthood. Anisomycin treatment almost entirely rescued the small (sma) phenotype induced by bortezomib. Data are displayed as mean ± SD and ****=p < 0.0001 by one-way ANOVA with Dunnet’s multiple comparisons test. 42–57 animals per condition. Total of three independent experiments. (G) TI inhibitor treatment significantly reduced 20S proteasomal activity in N2 lysate. Compared to the wild-type, the proteasomal activity was lower in hsf-1(sy441) mutants, but TI inhibitors did not further reduce it. Positive control: 5 µL of 20S proteasome positive control (Chemicon Part No. 90205). Negative control: N2 lysate treated with 25 μM lactacystin, a 20S proteasome inhibitor (Chemicon Part No. 90208). Data are displayed as mean ± SD where **=p < 0.01 and ****=p < 0.0001 by one-way ANOVA with Šídák multiple comparisons test. Three biological replicates.
-
Figure 4—source data 1
Quantification of survival of N2 and hsf-1(sy441) treated with bortezomib.
- https://cdn.elifesciences.org/articles/76465/elife-76465-fig4-data1-v2.zip
-
Figure 4—source data 2
Uncropped brightfield micrographs.
- https://cdn.elifesciences.org/articles/76465/elife-76465-fig4-data2-v2.zip
-
Figure 4—source data 3
Quantification of hsf-1(sy441) length.
- https://cdn.elifesciences.org/articles/76465/elife-76465-fig4-data3-v2.zip
-
Figure 4—source data 4
Uncropped fluorescence micrographs.
- https://cdn.elifesciences.org/articles/76465/elife-76465-fig4-data4-v2.zip
-
Figure 4—source data 5
Quantification of polyglutamine (PolyQ) length.
- https://cdn.elifesciences.org/articles/76465/elife-76465-fig4-data5-v2.zip
-
Figure 4—source data 6
Quantification of 20S proteasome assay.
- https://cdn.elifesciences.org/articles/76465/elife-76465-fig4-data6-v2.zip
Figure 4—figure supplement 1

Survival of N2 and hsf-1(sy441) animals treated with translation inhibitors.
Non-bortezomib-treated controls for Figure 4B. Treatment with inhibitor alone did not affect the lifespan of N2 worms when survival was measured at day 8. Interestingly, in hsf-1(sy441) animals, anisomycin alone significantly improves survival without bortezomib treatment, and similarly, lycorine trends toward significance (p=0.06). Data are displayed as mean ± SD and **=p < 0.01 and *=p < 0.05 by one-way ANOVA with Dunnet’s multiple comparisons test. Total of three independent experiments.
-
Figure 4—figure supplement 1—source data 1
Quantification of survival of N2 and hsf-1(sy441) not treated with bortezomib.
- https://cdn.elifesciences.org/articles/76465/elife-76465-fig4-figsupp1-data1-v2.zip
Figure 5 with 1 supplement
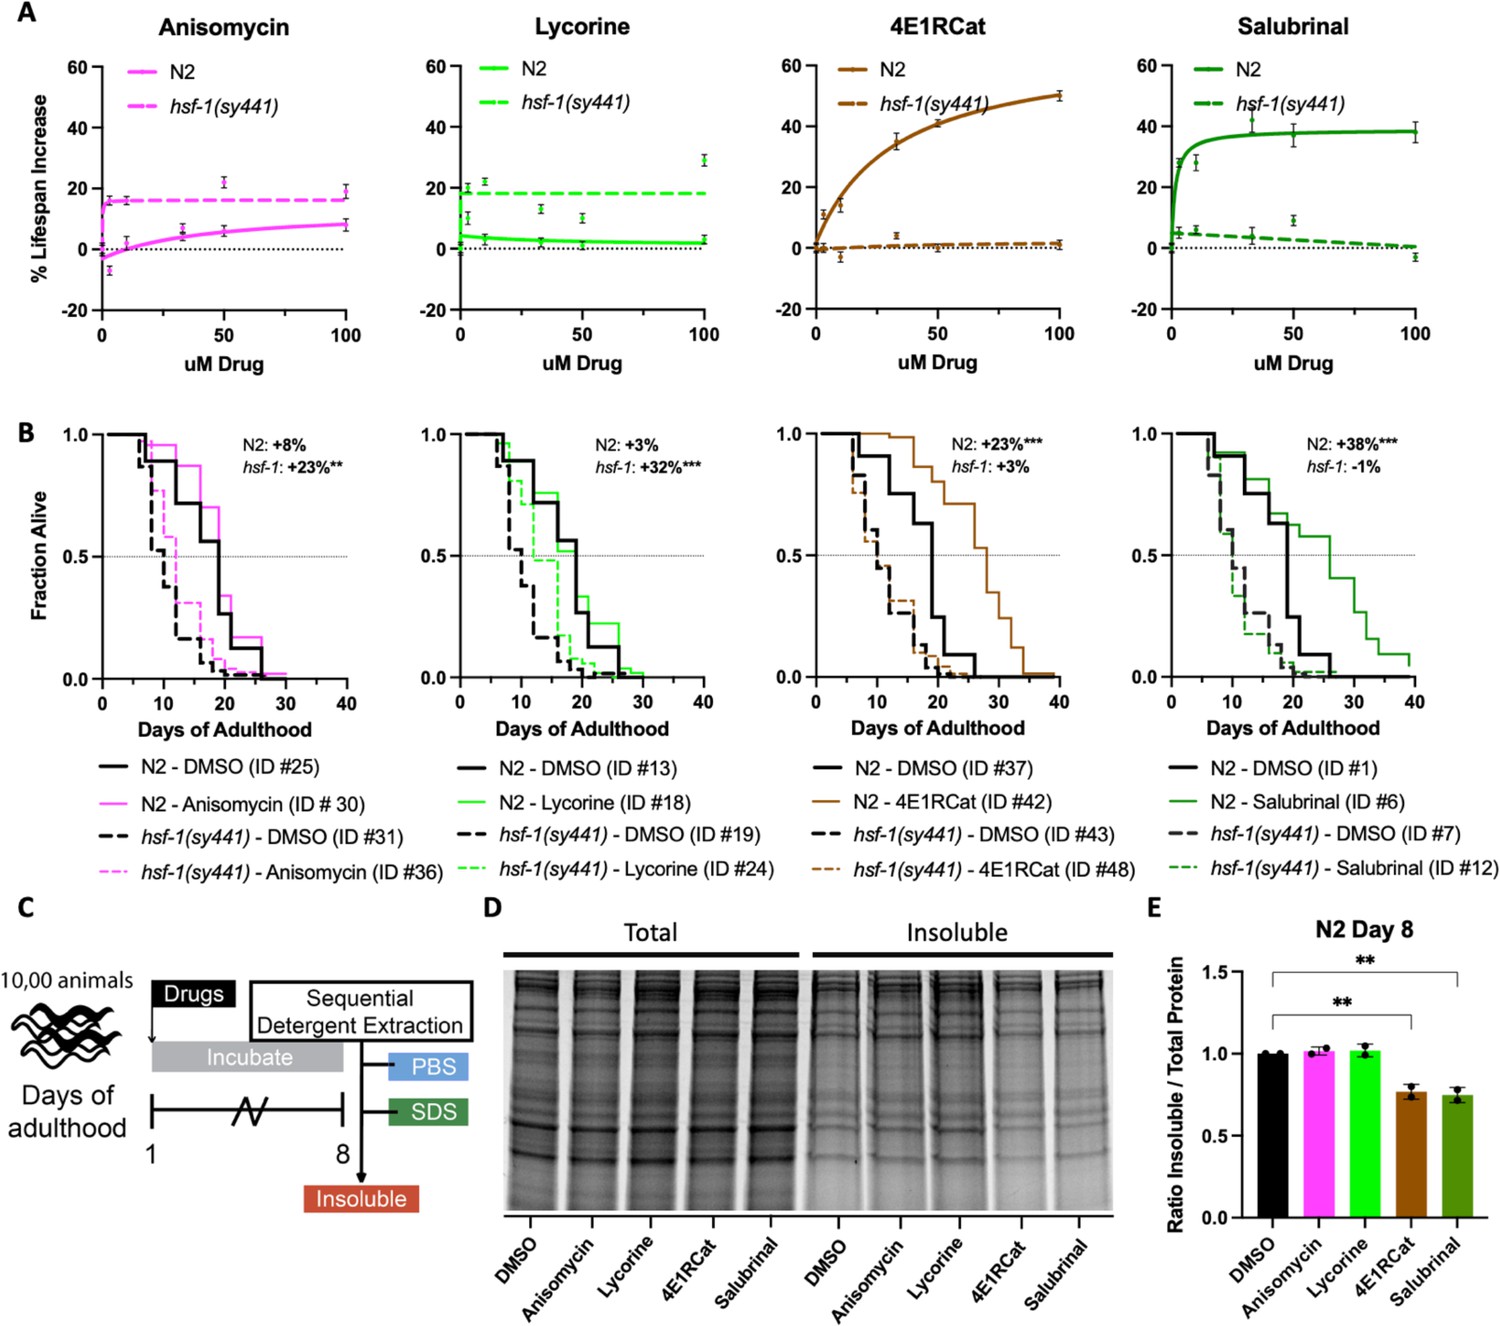
Reciprocal lifespan extension by translation inhibitors in N2 and hsf-1(sy441) animals.
(A) Graphs show mean lifespan as a function of translation inhibitor concentration. TI inhibitors increase the lifespan of N2 but not hsf-1(sy441) animals, with a maximum effect at 100 μM. TE inhibitors increase the lifespan of hsf-1(sy441) but not N2 animals. Error bars indicate ± SEM. See Supplementary file 1 for the number of animals and repeats. (B) Survival curves from representative experiments show the fraction of wild-type (N2, solid line) or hsf-1 mutant (dashed line) animals when treated with 100 μM of the indicated compound. Black lines indicate DMSO treatment, and colored lines indicate inhibitor treatment. Data are displayed as a Kaplan-Meier survival curve, and significance was determined by the log-rank test. ID # refers to the unique entry within Supplementary file 1. (C) Experimental strategy for treating animals and isolating detergent-insoluble fractions. 10,000 animals were treated and allowed to age for 8 days before being washed with M9, frozen in liquid nitrogen, and mechanically lysed. Then proteins were extracted from the total lysate based on solubility, and an aliquot from each fraction was run on an SDS-PAGE gel. (D) Representative SDS-PAGE gel stained with Sypro Ruby. 4E1RCat and salubrinal reduce insoluble protein at day 8. (E) Quantification of two separate experiments shows 4E1RCat and salubrinal significantly reduce insoluble protein in wild-type (N2) animals. Data are displayed as mean ± SEM and **=p < 0.01 by two-tailed Student’s t-test.
-
Figure 5—source data 1
Summary of lifespan data used to construct dose-response graphs.
- https://cdn.elifesciences.org/articles/76465/elife-76465-fig5-data1-v2.zip
-
Figure 5—source data 2
Lifespan data used to construct graphs.
- https://cdn.elifesciences.org/articles/76465/elife-76465-fig5-data2-v2.zip
-
Figure 5—source data 3
Unedited gels.
- https://cdn.elifesciences.org/articles/76465/elife-76465-fig5-data3-v2.zip
-
Figure 5—source data 4
Quantification of insoluble extractions.
- https://cdn.elifesciences.org/articles/76465/elife-76465-fig5-data4-v2.zip
Figure 5—figure supplement 1

Cycloheximide, an elongation inhibitor, extends lifespan in hsf-1(sy441) but not N2.
Cycloheximide phenocopies other translation elongation (TE) inhibitors where it does not extend lifespan in N2 at 100 μΜ while increasing lifespan in hsf-1(sy441) mutant animals. We note the p-value is less significant than when anisomycin or lycorine are used. See Supplementary File IDs: #95, #98, #103, #108.
-
Figure 5—figure supplement 1—source data 1
Lifespan data used to construct graphs.
- https://cdn.elifesciences.org/articles/76465/elife-76465-fig5-figsupp1-data1-v2.zip
Figure 6
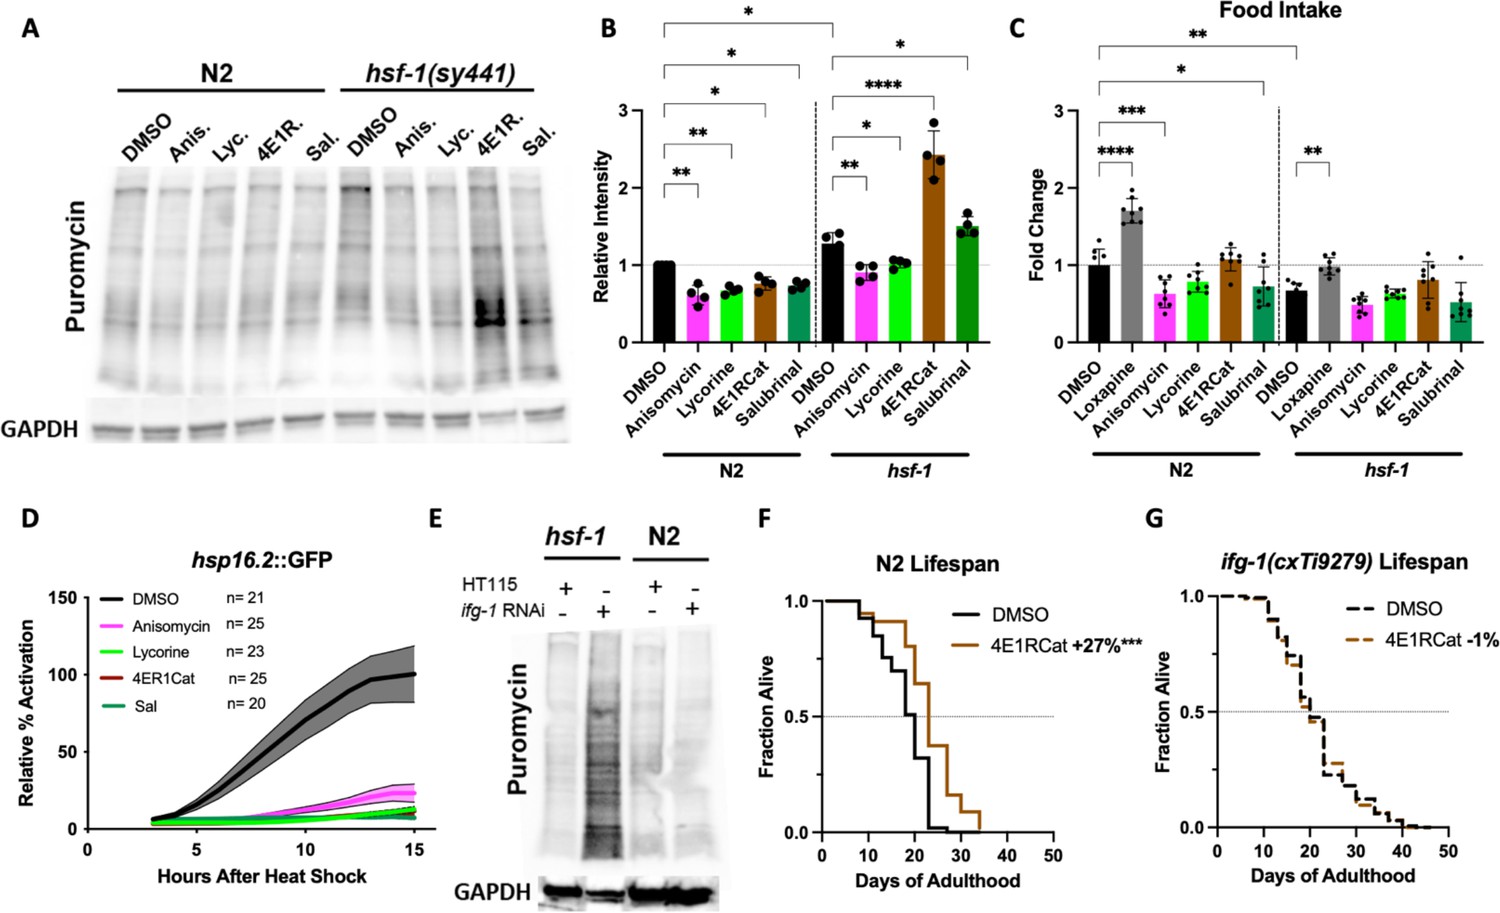
Inhibition of eIF4G/IFG-1 requires HSF-1 to lower the concentration of newly synthesized proteins.
(A) C. elegans were treated with solvent (DMSO) or the indicated inhibitors (100 μM) for 12 hr, followed by a 4 hr puromycin incorporation in both N2 and hsf-1(sy441) background, which was immunoblotted against using an anti-puromycin antibody. hsf-1(sy441) mutant animals exhibited increased puromycin incorporation compared to N2 animals, which was further increased by both TI inhibitors 4E1RCat and salubrinal. (B) Quantification of four independent SUrface SEnsing of Translation (SUnSET) experiments in (A). Significance was determined by one-way ANOVA with Šídák multiple comparisons test where *=p ≤ 0.05, **=p ≤ 0.01, and **** p≤0.0001. Error bars indicate mean ± SD from four independent trials. (C) Food intake was quantified relative to DMSO-treated N2 controls measuring bacterial clearance from day 1 to day 4 of adulthood. Anisomycin and salubrinal significantly decrease food intake in wild-type N2. In hsf-1(sy441), no inhibitor statistically changes food intake. Loxapine was used as a positive control in both genotypes. Significance was determined by one-way ANOVA with Šídák multiple comparisons test where *=p ≤ 0.05, **=p ≤ 0.01, and ****p≤0.0001. Error bars indicate mean ± SD from four independent trials. Total of eight independent experiments. (D) Translation inhibitors suppressed the heat shock response (HSR) as measured by hsp-16.2::GFP fluorescence assay. After incubation with the inhibitors for 4 days, followed by a 1 hr heat shock (HS) at 36°C, little to no increase in GFP expression was observed for each inhibitor, indicating that all inhibitors block HSR activation at the tested concentration (100 μM). Lines indicate mean, and shading indicates 95% CI. Representative of three independent experiments. (E) N2 and hsf-1(sy441) C. elegans were fed HT115 empty vector or RNAi against ifg-1. ifg-1 depletion increased puromycin incorporation in hsf-1 mutants but decreased incorporation in N2 animals, similar to 4E1RCat treatment. GAPDH was used as a loading control. Immunoblot is representative of three independent experiments. (F) 4E1RCat significantly increases lifespan in N2 animals. Data are displayed as a Kaplan-Meier survival curve, and significance is determined by the log-rank test. See ID #111 and #112 for details in Supplementary file 1. (G) 4E1RCat does not increase lifespan in ifg-1(cxTi9279) animals. See ID #93 and #94 for details in Supplementary file 1. Data are displayed as a Kaplan-Meier survival curve, and significance is determined by the log-rank test.
-
Figure 6—source data 1
Unedited western blots.
- https://cdn.elifesciences.org/articles/76465/elife-76465-fig6-data1-v2.zip
-
Figure 6—source data 2
Quantification of western blots.
- https://cdn.elifesciences.org/articles/76465/elife-76465-fig6-data2-v2.zip
-
Figure 6—source data 3
Quantification of food intake.
- https://cdn.elifesciences.org/articles/76465/elife-76465-fig6-data3-v2.zip
-
Figure 6—source data 4
Quantification of hsp-16.2::GFP reporter activation.
- https://cdn.elifesciences.org/articles/76465/elife-76465-fig6-data4-v2.zip
-
Figure 6—source data 5
Unedited western blots with Coomassie staining of the membrane.
- https://cdn.elifesciences.org/articles/76465/elife-76465-fig6-data5-v2.zip
-
Figure 6—source data 6
Lifespan data used to construct graphs.
- https://cdn.elifesciences.org/articles/76465/elife-76465-fig6-data6-v2.zip
-
Figure 6—source data 7
Lifespan data used to construct graphs.
- https://cdn.elifesciences.org/articles/76465/elife-76465-fig6-data7-v2.zip
Videos
Video 1
Anisomycin prevents heat shock-induced polyglutamine (PolyQ) aggregation.
AM130 C. elegans expressing 35 glutamine residues fused to YFP (PolyQ::YFP) were treated with DMSO or anisomycin for 12 hr before subjecting the animals to a 2 hr heat shock at 36°C. The animals were embedded into a hydrogel physically immobilizing the worm and imaged over 15 hr. The representative images shown have been uniformly modified using the ‘3D Surface Plot’ plugin in ImageJ to visualize aggregates.
Tables
Key resources table
| Reagent type (species) or resource | Designation | Source or reference | Identifiers | Additional information |
|---|---|---|---|---|
| Strain, strain background (Caenorhabditis elegans) | N2 | Caenorhabditis Genetics Center (CGC) | RRID:WB-STRAIN:WBStrain00000003 | Wild-type (Bristol) |
| Strain, strain background (Caenorhabditis elegans) | CL2070 | CGC | RRID:WB-STRAIN:WBStrain00005096 | dvIs70 [hsp-16.2p::GFP+rol-6(su1006)] |
| Strain, strain background (Caenorhabditis elegans) | AM140 | CGC | RRID:WB-STRAIN:WBStrain00000182 | rmIs132Punc-54::q35::yfp |
| Strain, strain background (Caenorhabditis elegans) | KX54 | CGC | RRID:WB-STRAIN:WBStrain00024080 | ifg-1(cxTi9279) |
| Strain, strain background (Caenorhabditis elegans) | PS3551 | CGC | RRID:WB-STRAIN:WBStrain00007673 | hsf-1(sy441) |
| Genetic reagent (Caenorhabditis elegans) | myo3p::GFP-IRES-tdTomato | This paper | Adapted from: DOI: 10.2144/000113821 See Materials and methods, Method for making bi-cistronic vector | |
| Antibody | Anti-puromycin (Mouse monoclonal) | MilliporeSigma | Cat#: MABE343 RRID:AB_2566826 | 1:5000 |
| Antibody | Anti-GAPDH (Rabbit polyclonal) | Proteintech | Cat#: 1094-1-AP RRID:AB_2263076 | 1:5000 |
| Antibody | Anti-myc (Mouse Monoclonal) | Cell Signaling | Cat#: 2276S RRID:AB_331783 | 1:2000 |
| Antibody | Anti-mouse—HRP (secondary) | Cell Signaling | Cat#: 7076S, RRID:AB_330924 | 1:5000 |
| Antibody | Anti-rabbit—HRP (secondary) | Cell Signaling | Cat#: 7074S, RRID:AB_2099233 | 1:5000 |
| Commercial Assay or kit | 20S Proteasome Activity Assay Kit | Sigma-Aldrich | Cat#: APT280 | |
| Commercial Assay or kit | SYPRO Ruby Protein Gel Stain 1× | Bio-Rad | Cat#: 1703125 | |
| Chemical compound, drug | Anisomycin | MedChemExpress | Cat#: HY-18982 | |
| Chemical compound, drug | Lycorine hydrochloride | Combi-Blocks | Cat#: QW-2476 | |
| Chemical compound, drug | 4E1RCat | MedChemExpress | Cat#: HY-14427 | |
| Chemical compound, drug | Puromycin | Sigma-Aldrich | Cat#: P8833 | |
| Chemical compound, drug | Salubrinal | MedChemExpress | Cat#: HY-15486 | |
| Chemical compound, drug | Bortezomib, free base | LC Laboratories | Cat#: B-1408 |
Additional files
-
Supplementary file 1
Summary of lifespan studies.
All experiments were conducted with dead, γ-irradiated bacteria (OP50) and conducted in a 96-well liquid culture.
- https://cdn.elifesciences.org/articles/76465/elife-76465-supp1-v2.xlsx
-
Transparent reporting form
- https://cdn.elifesciences.org/articles/76465/elife-76465-transrepform1-v2.docx
Download links
A two-part list of links to download the article, or parts of the article, in various formats.
Downloads (link to download the article as PDF)
Open citations (links to open the citations from this article in various online reference manager services)
Cite this article (links to download the citations from this article in formats compatible with various reference manager tools)
Proteostasis is differentially modulated by inhibition of translation initiation or elongation
eLife 12:e76465.
https://doi.org/10.7554/eLife.76465


