Transversal functional connectivity and scene-specific processing in the human entorhinal-hippocampal circuitry
- Institute of Cognitive Neurology and Dementia Research, Otto von Guericke University Magdeburg, Germany
- German Center for Neurodegenerative Diseases, Germany
- Functional Architecture of Memory Department, Leibniz-Institute for Neurobiology, Germany
- Functional Neuroplasticity Department, Otto-von-Guericke University Magdeburg, Germany
- Center for Behavioral Brain Sciences, Otto-von-Guericke University Magdeburg, Germany
- Institute of Cognitive Neuroscience, University College London, United Kingdom
- Clinical Memory Research Unit, Department of Clinical Sciences Malmö, Lund University, Sweden
Figures
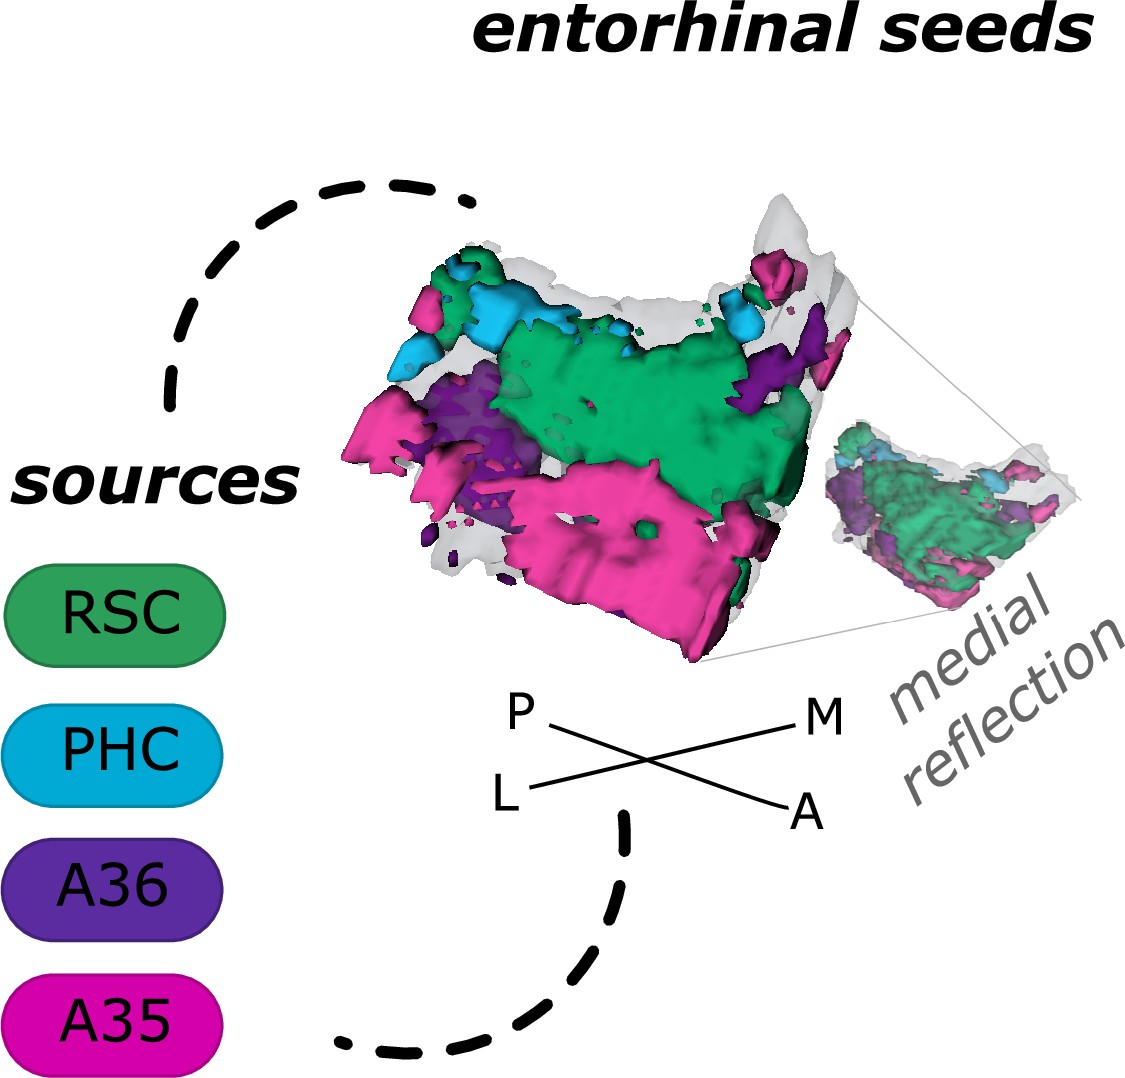
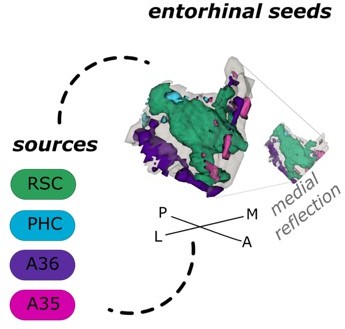
Figure 1
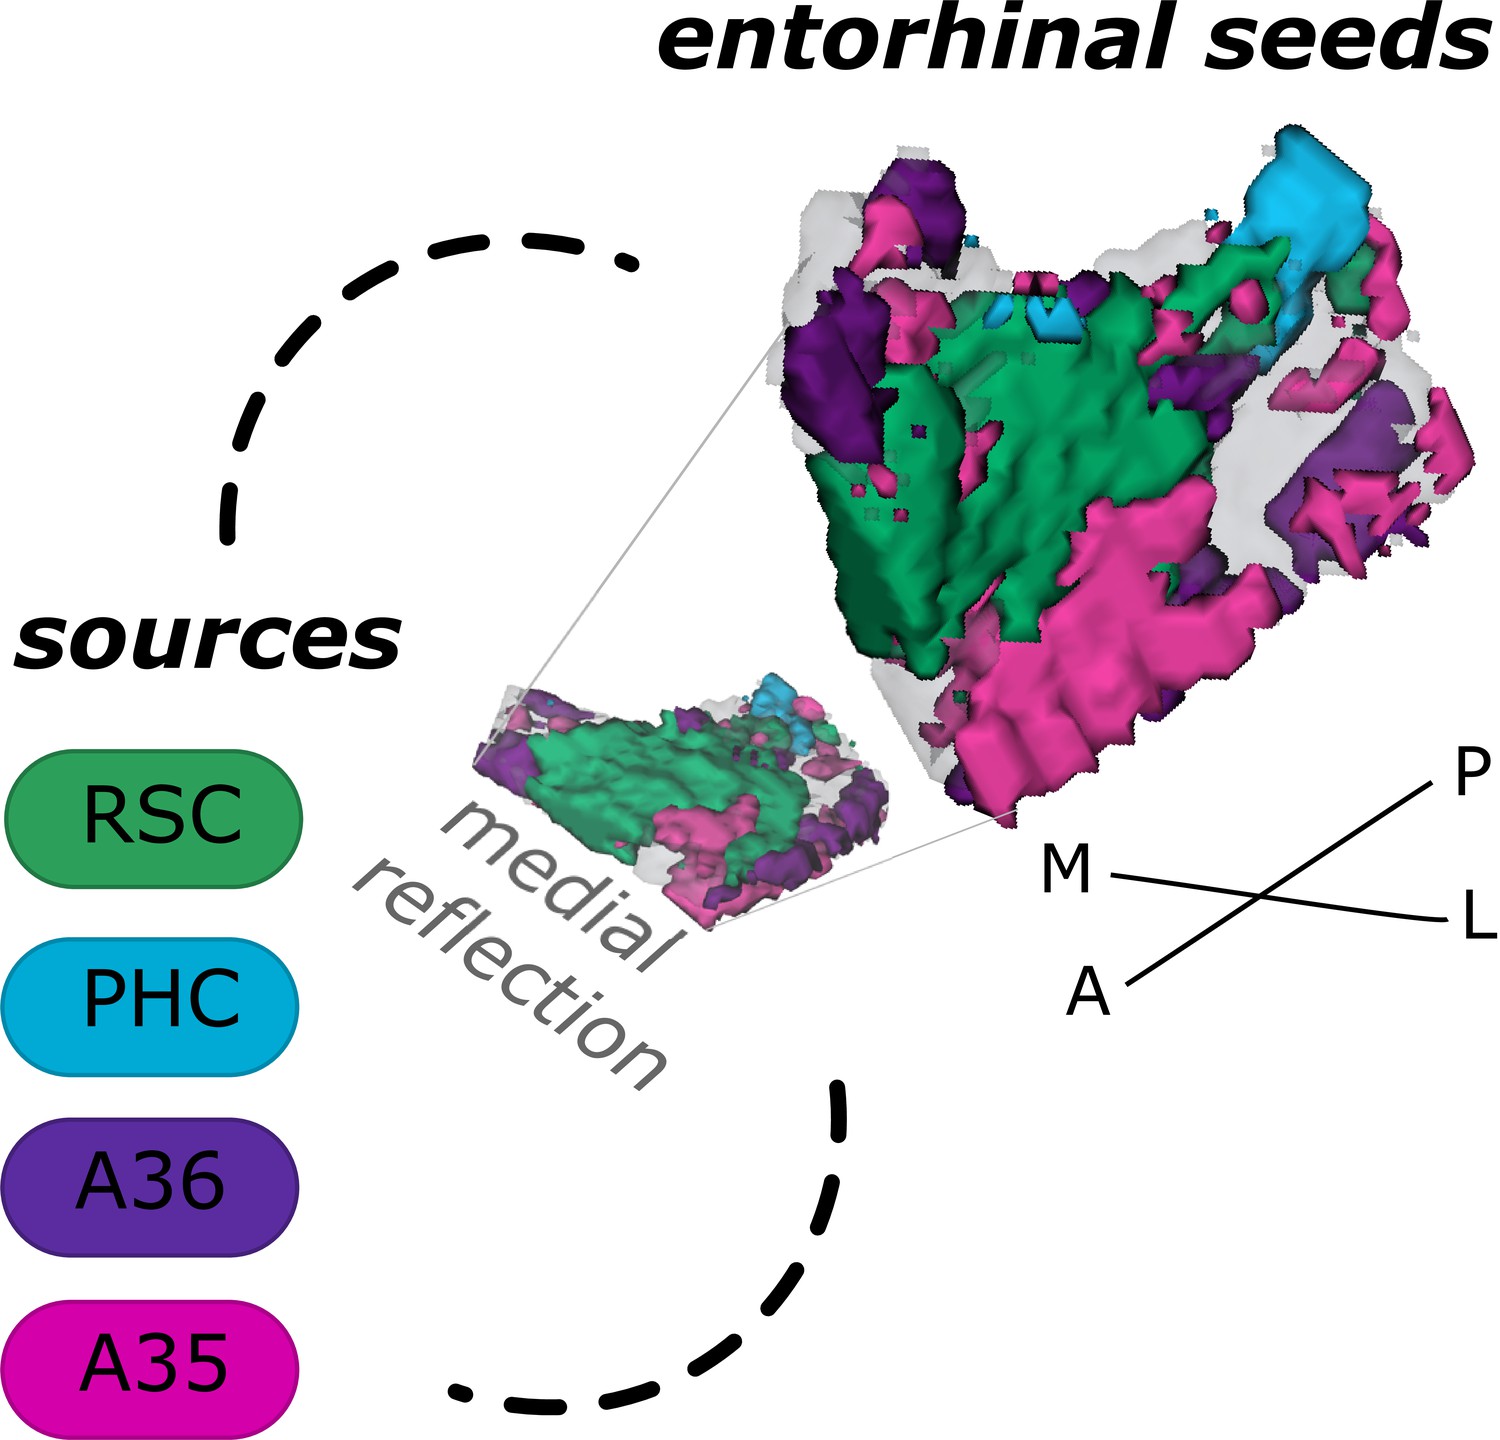
Entorhinal seed regions based on connectivity preferences to cortical regions.
Displayed is the right EC as a 3D image with colored seed regions. The seed regions have been identified based on a source-to-voxel functional connectivity analysis and resulting connectivity preference to either the right retrosplenial cortex (RSC, green), parahippocampal cortex (PHC, blue), Area 36 (A36, purple), or Area 35 (A35, pink) sources. Note that preferences to Area 36 are best visible from a medial perspective on the EC as depicted in the medial reflection. Seed regions have been determined based on the thresholded (T>3.1) maximum voxels across four one-sample T-tests at group level, one per source, sample size n = 32. M – medial; L – lateral; A – anterior; P – posterior.
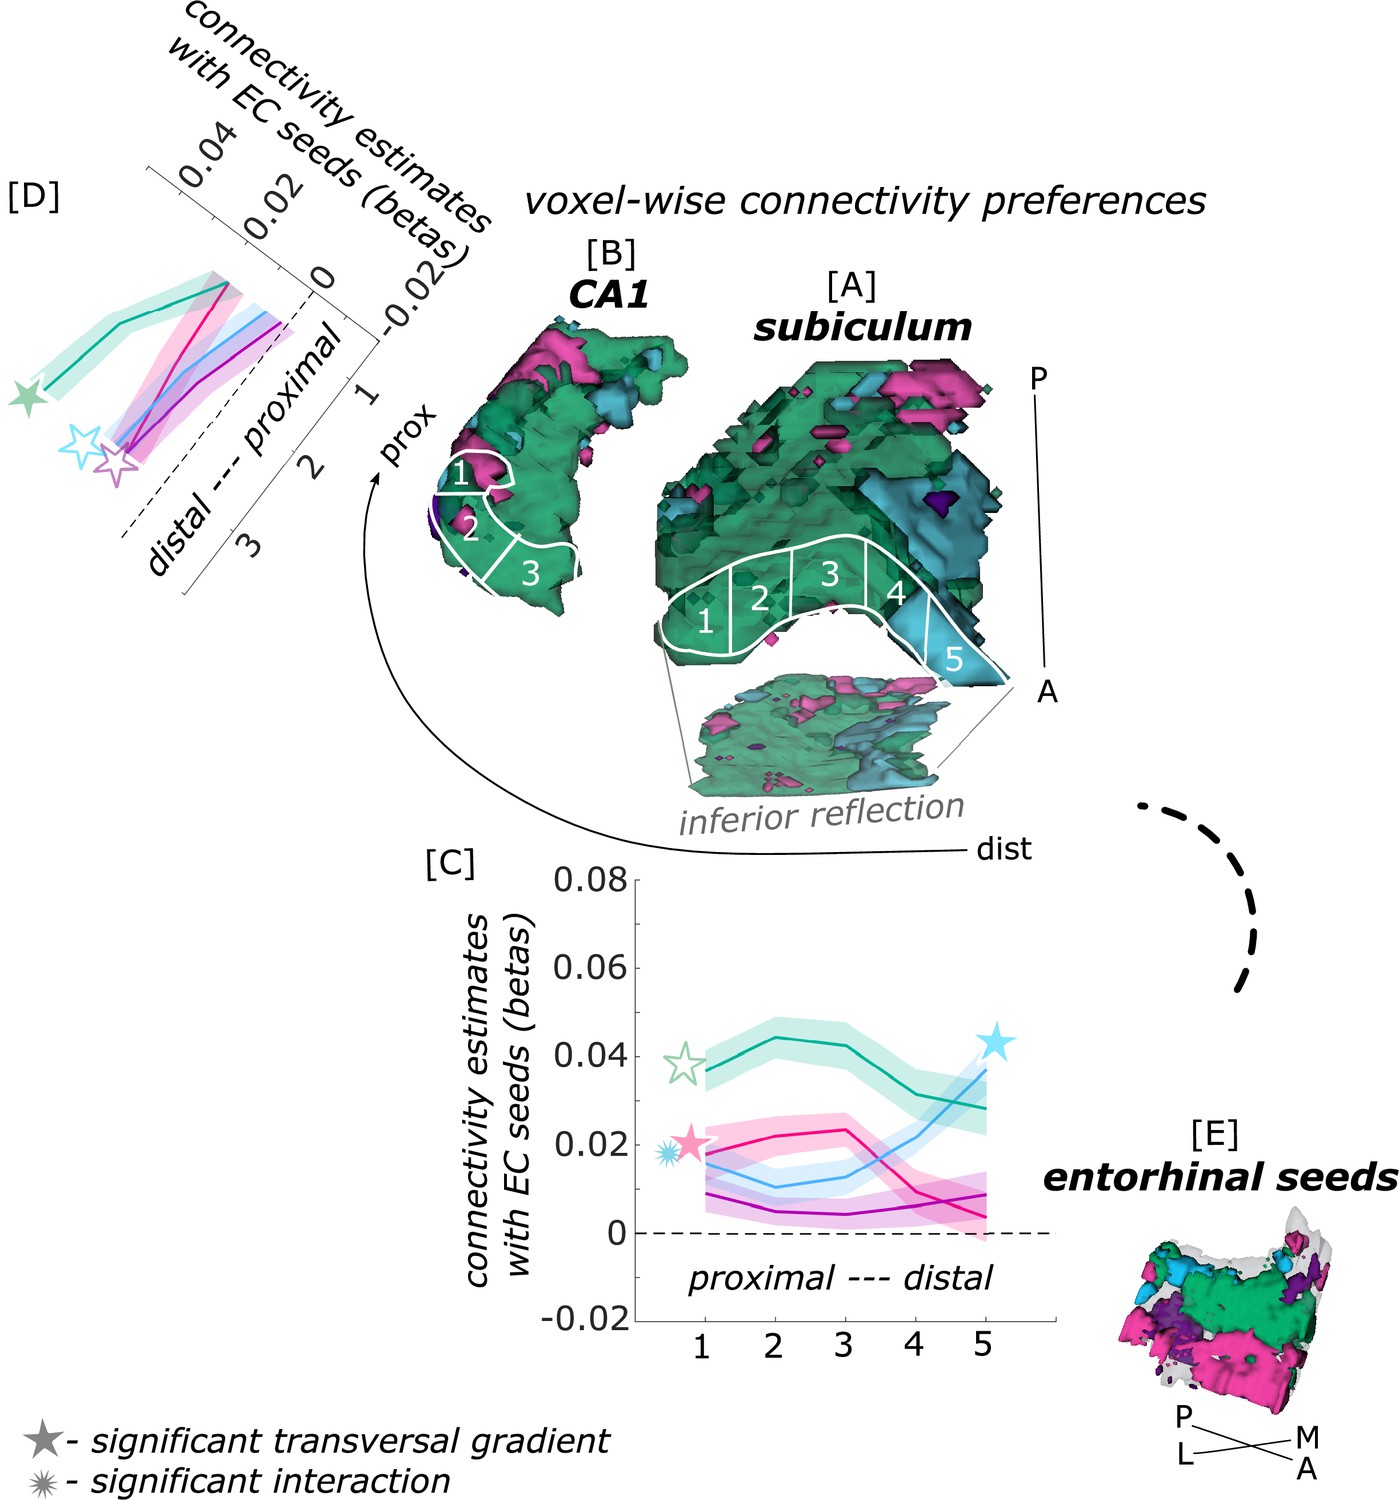
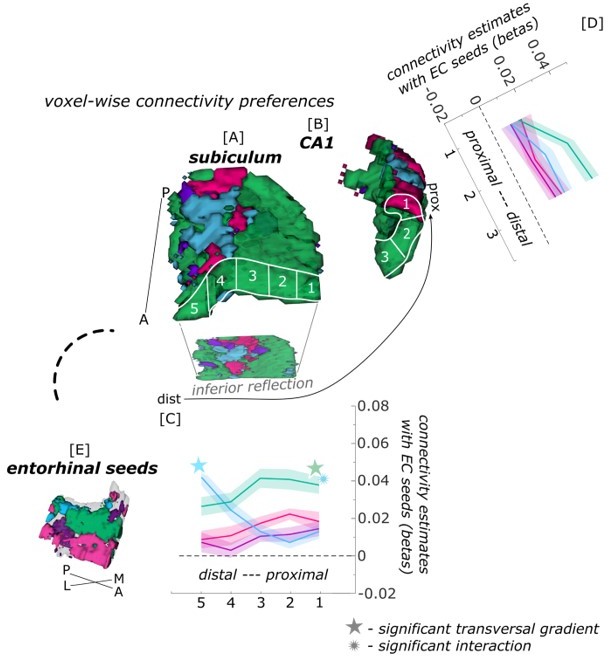
Figure 2
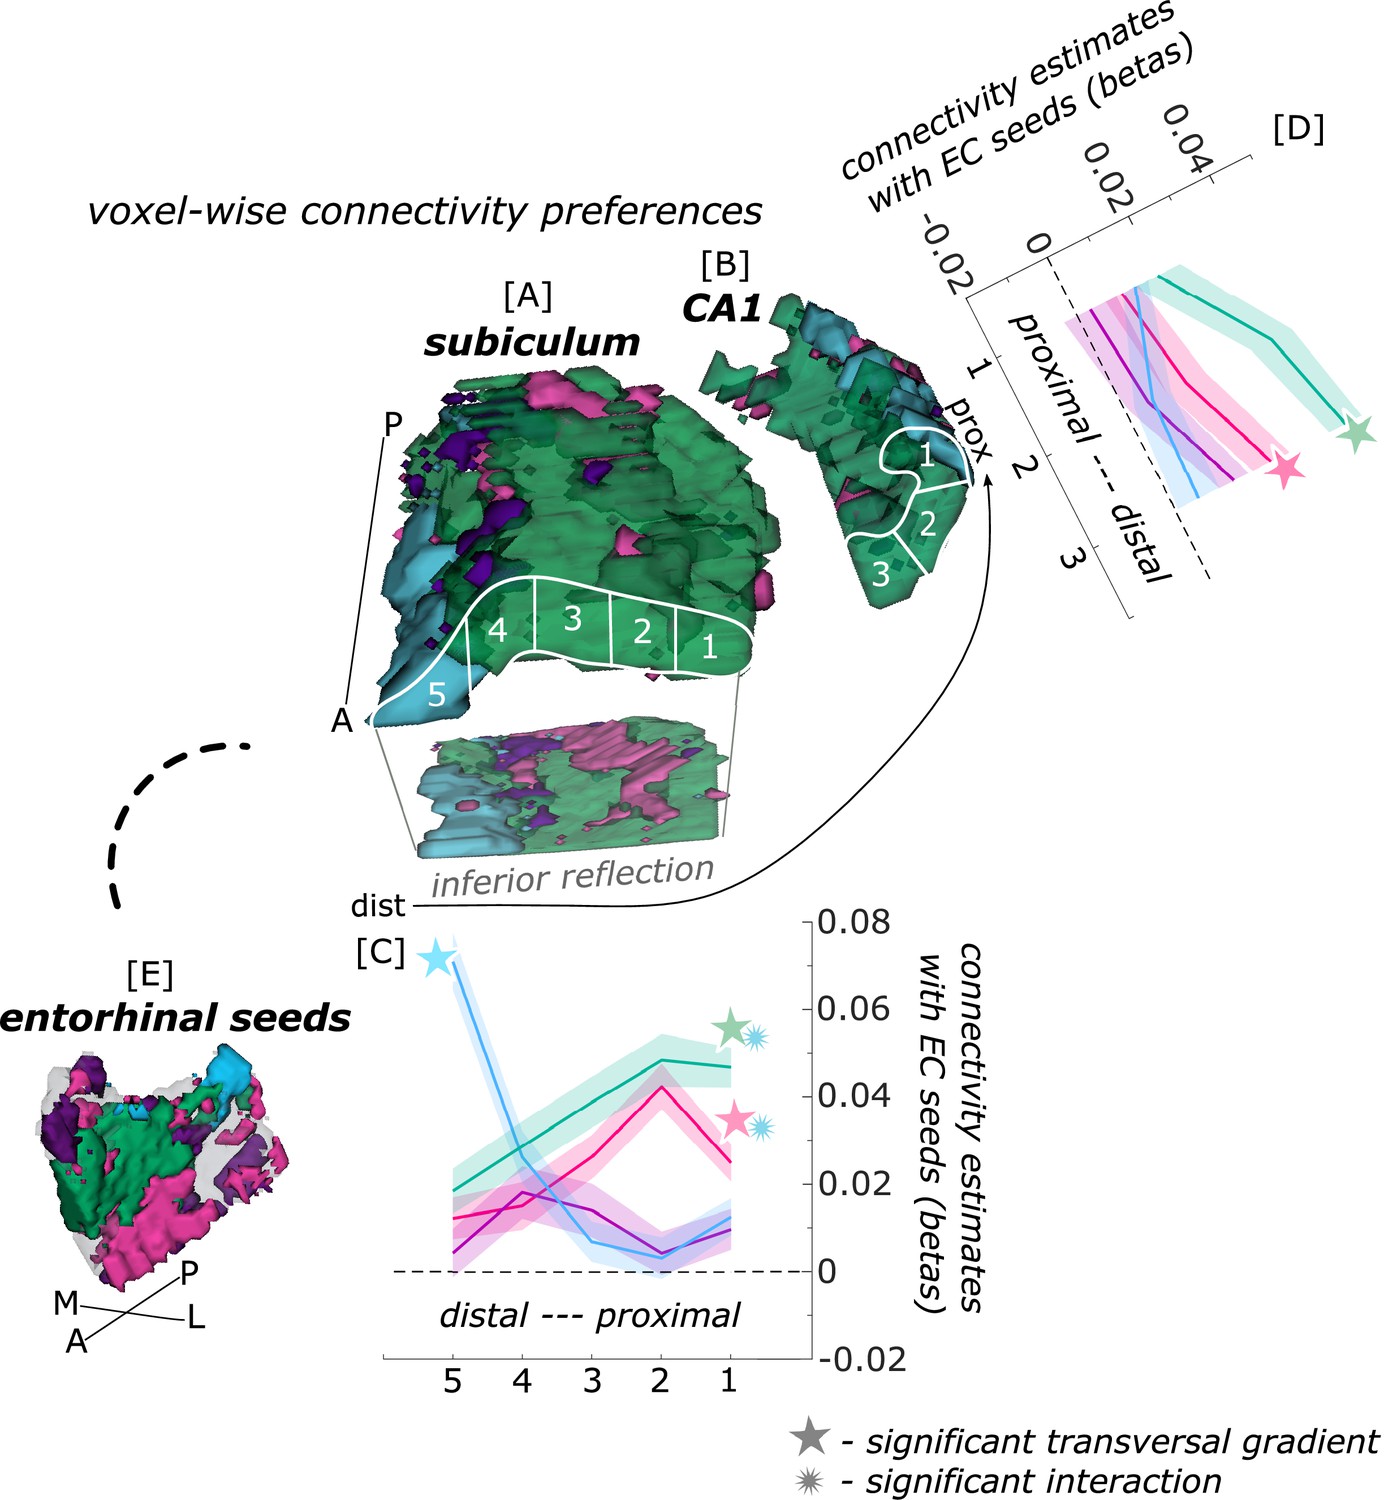
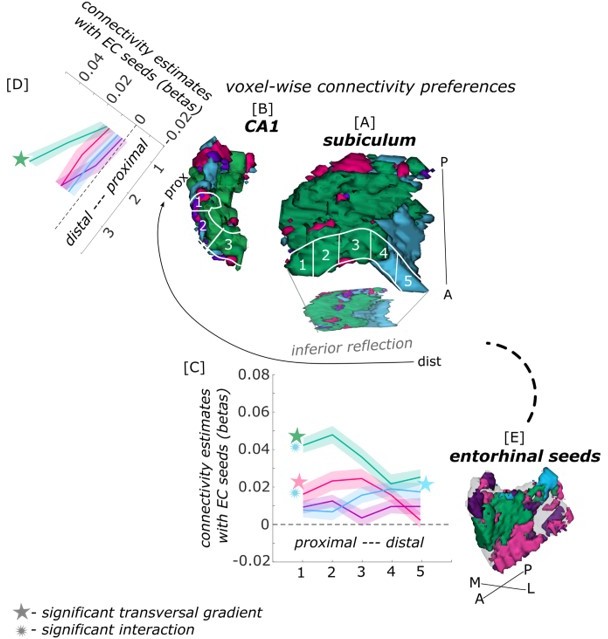
Functional connectivity preferences to entorhinal seeds along the transversal axis of subiculum and CA1.
Displayed are the results of a seed-to-voxel functional connectivity analysis between the displayed right entorhinal seeds and the right subiculum and CA1 subregion. The 3D figure displays voxel-wise connectivity preferences to the entorhinal seeds (color coded to refer to the respective entorhinal seed [E]) on group level ([A] - subiculum; [B] - CA1; maps for connectivity preferences: Source code 13 - ECArea35-based, pink; Source code 14 - ECArea36-based, purple; Source code 16 - ECPHC-based, blue; Source code 15 - ECRSC-based seed, green). Note that preferences to the ECArea35-based seed (pink) are located mainly in the inferior subiculum and CA1 and are therefore best visible in the inferior reflection. To display mean connectivity preferences across participants along the transversal sub/CA1 axis, beta estimates were extracted and averaged from equally sized segments from proximal to distal ends (five segments in subiculum [A], three segments in CA1 [B]; schematized in white on the 3D figures) on each coronal slice and averaged along the longitudinal axis. Repeated measures ANOVAs revealed significant differences in connectivity estimates along the transversal axis of CA1 [D] and subiculum [C] with interaction effects in the subiculum. Displayed significances were obtained by FDR-corrected post-hoc tests and refer to p<0.05. Shaded areas in the graphs refer to standard errors of the mean, sample size n = 32. EC – entorhinal; M – medial; L – lateral; A – anterior; P – posterior; prox – proximal; dist – distal. Figure 2—source data 1 contains individual connectivity estimates per subregion (Sub – subiculum and CA1, respectively) and seed (ECRSC-based – RSCECseed, ECArea35-based – A35ECseed, ECPHC-based – PHCECseed, ECArea36-based – A36ECseed) for each transversal segment (1–5 or 1–3, respectively from proximal to distal).
-
Figure 2—source data 1
Individual functional connectivity estimates to right entorhinal seeds, extracted from right subiculum and CA1 transversal segments.
- https://cdn.elifesciences.org/articles/76479/elife-76479-fig2-data1-v3.zip
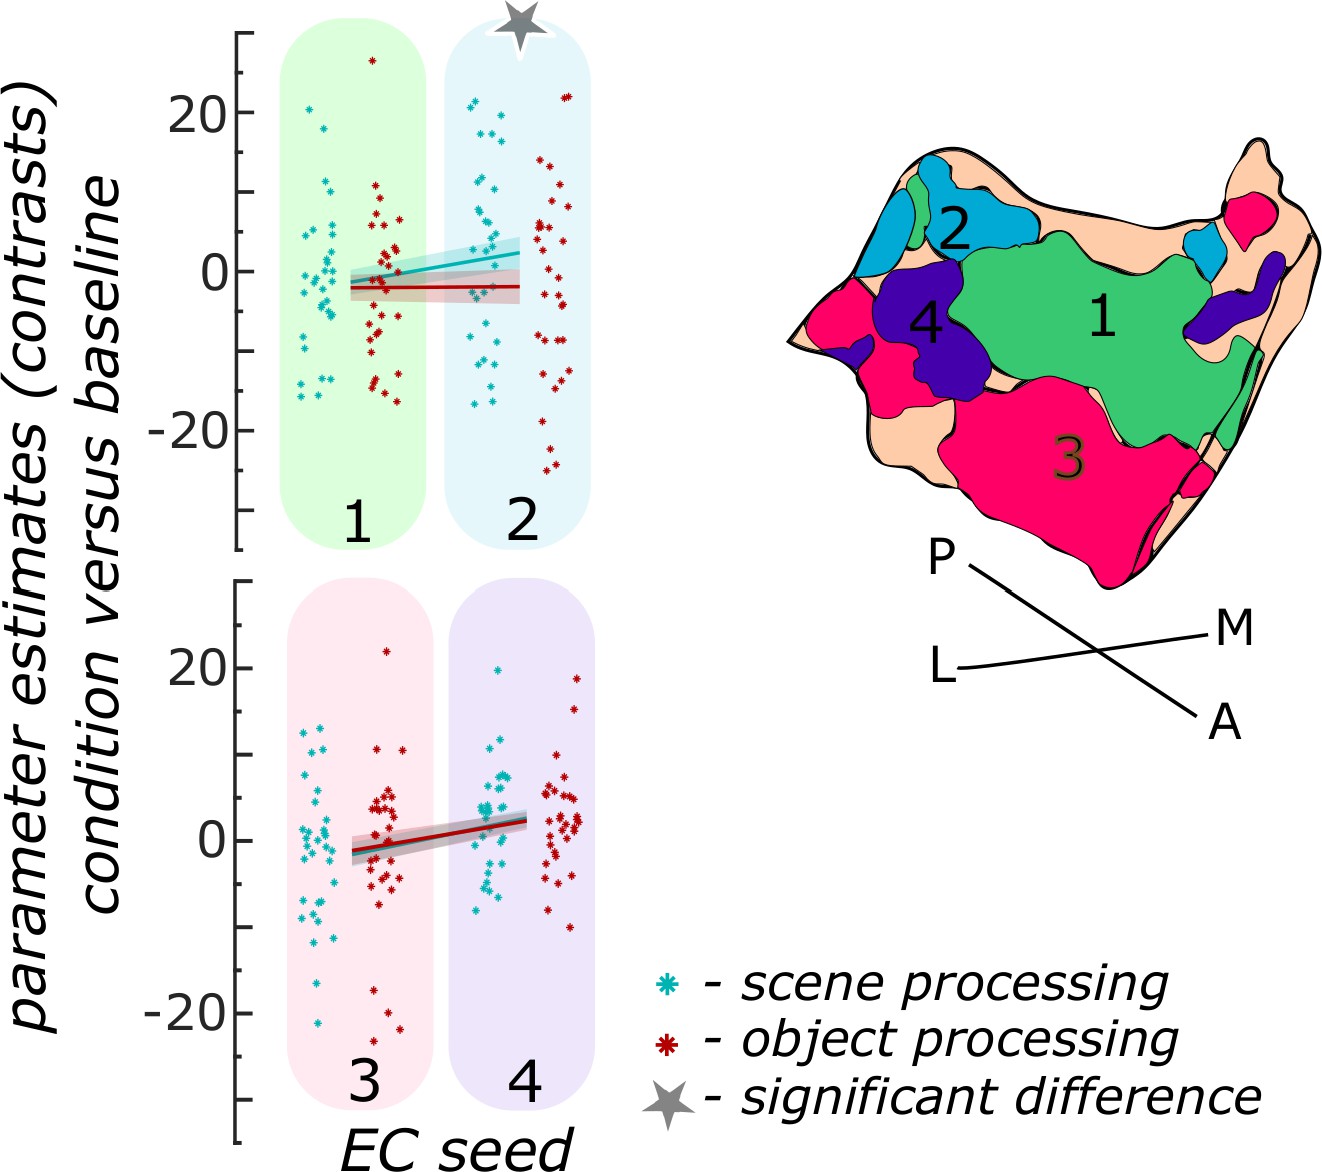
Figure 3
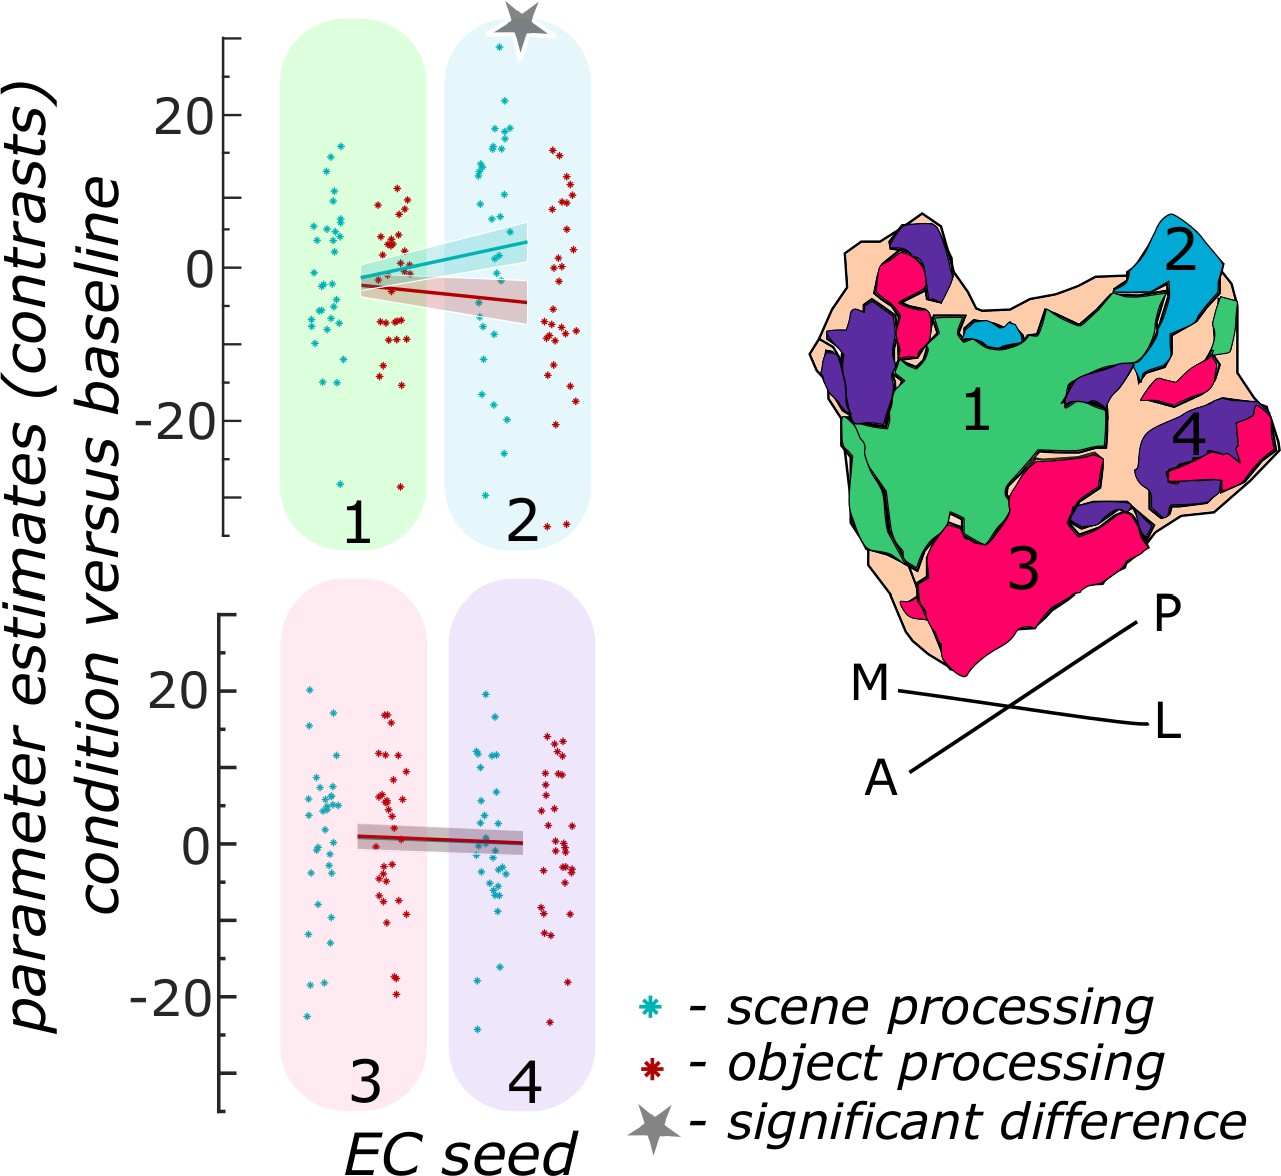
Functional activity during scene and object conditions in entorhinal seed regions.
Displayed are the extracted parameter estimates for the object condition versus baseline contrast (‘object information processing’, red) and the scene condition versus baseline contrast (‘scene information processing’, cyan) from each entorhinal seed region per individual (dots) and summarized across individuals (lines). A schematic depiction of the respective entorhinal seed regions is displayed by a 3D drawing of the right EC. A repeated measures ANOVA revealed a significant interaction between condition and seed region. The displayed significant difference is obtained with FDR-corrected post-hoc tests and refers to p<0.05. During the object condition, participants were presented with 3D rendered objects on screen, during the scene condition with 3D rendered indoor rooms and during the baseline condition they saw scrambled pictures. The shaded area around the lines refers to standard errors of the mean, sample size n = 32. EC – entorhinal cortex; M – medial; L – lateral; A – anterior; P – posterior. Figure 3—source data 1 contains extracted parameter values per individual and EC seed (isthmuscingulate – ECRSC-based, Area 35 – ECArea35-based, Area 36 – ECArea36-based, PHC – ECPHC-based seed) for the object versus baseline and scene versus baseline contrasts.
-
Figure 3—source data 1
Individual paramenter estimates for scene and object processing in right entorhinal seed regions.
- https://cdn.elifesciences.org/articles/76479/elife-76479-fig3-data1-v3.zip
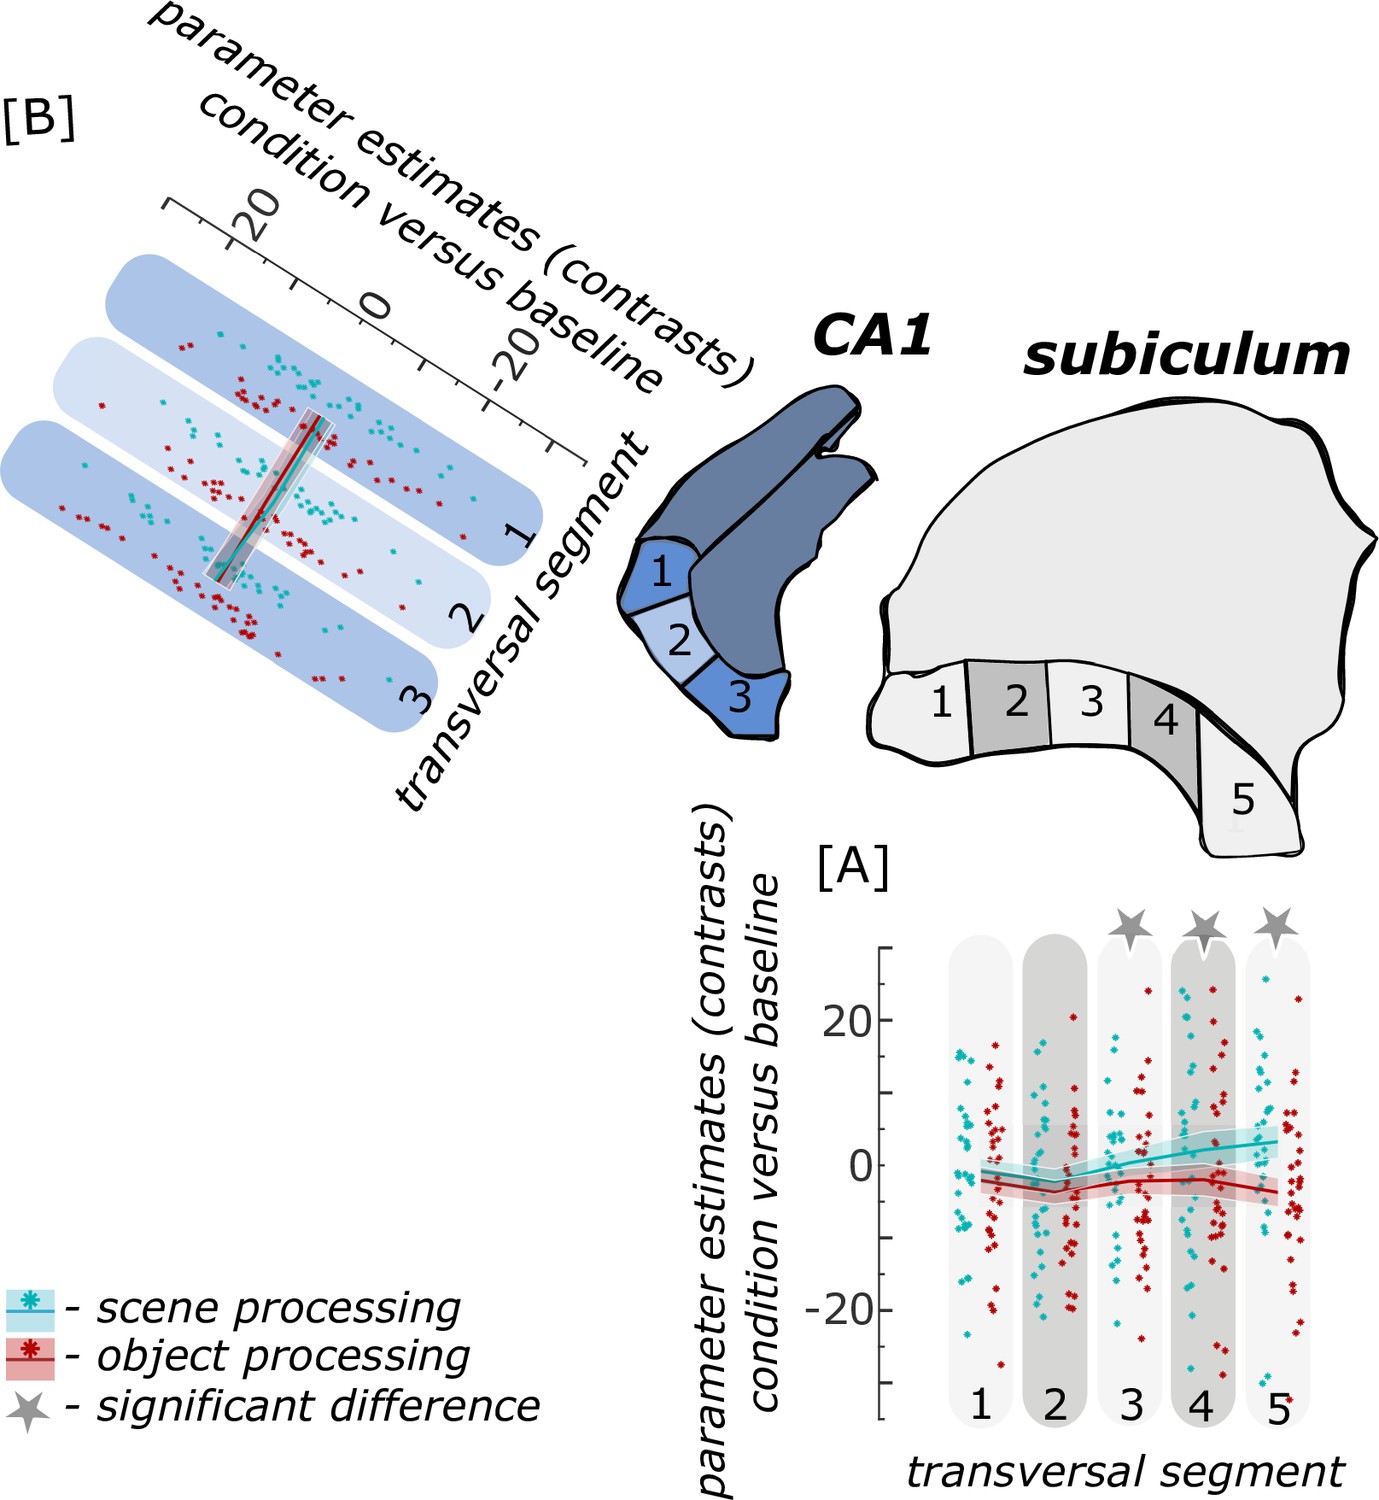
Figure 4

Functional activity during scene and object conditions along the transversal axis of subiculum and CA1.
Displayed are the extracted parameter estimates for the object condition versus baseline contrast (‘object information processing’, red) and the scene condition versus baseline contrast (‘scene information processing’, cyan) from the respective transversal segments in the subiculum ([A] grey) and CA1 ([B] blue) per individual (dots) and summarized across individuals (lines). A schematic depiction of the respective transversal segment is displayed by a 3D drawing of the right subiculum and CA1 subregion. Repeated measures ANOVAs revealed a significant interaction between condition and seed region in the subiculum only. The displayed significant difference is obtained with FDR-corrected post-hoc tests and refers to p<0.05. During the object condition, participants were presented with 3D rendered objects on screen, during the scene condition with 3D rendered indoor rooms and during the baseline condition they saw scrambled pictures. The shaded area around the lines refers to standard errors of the mean, sample size n = 32. Figure 4—source data 1 contains extracted parameter values for each subregion (Sub – subiculum and CA1, respectively) per individual and transversal segment (1–5 and 1–3, respectively from proximal to distal) for the object versus baseline and scene versus baseline contrasts.
-
Figure 4—source data 1
Individual parameter estimates for scene and object processing in right transversal subiculum and CA1 segments.
- https://cdn.elifesciences.org/articles/76479/elife-76479-fig4-data1-v3.zip
Figure 5
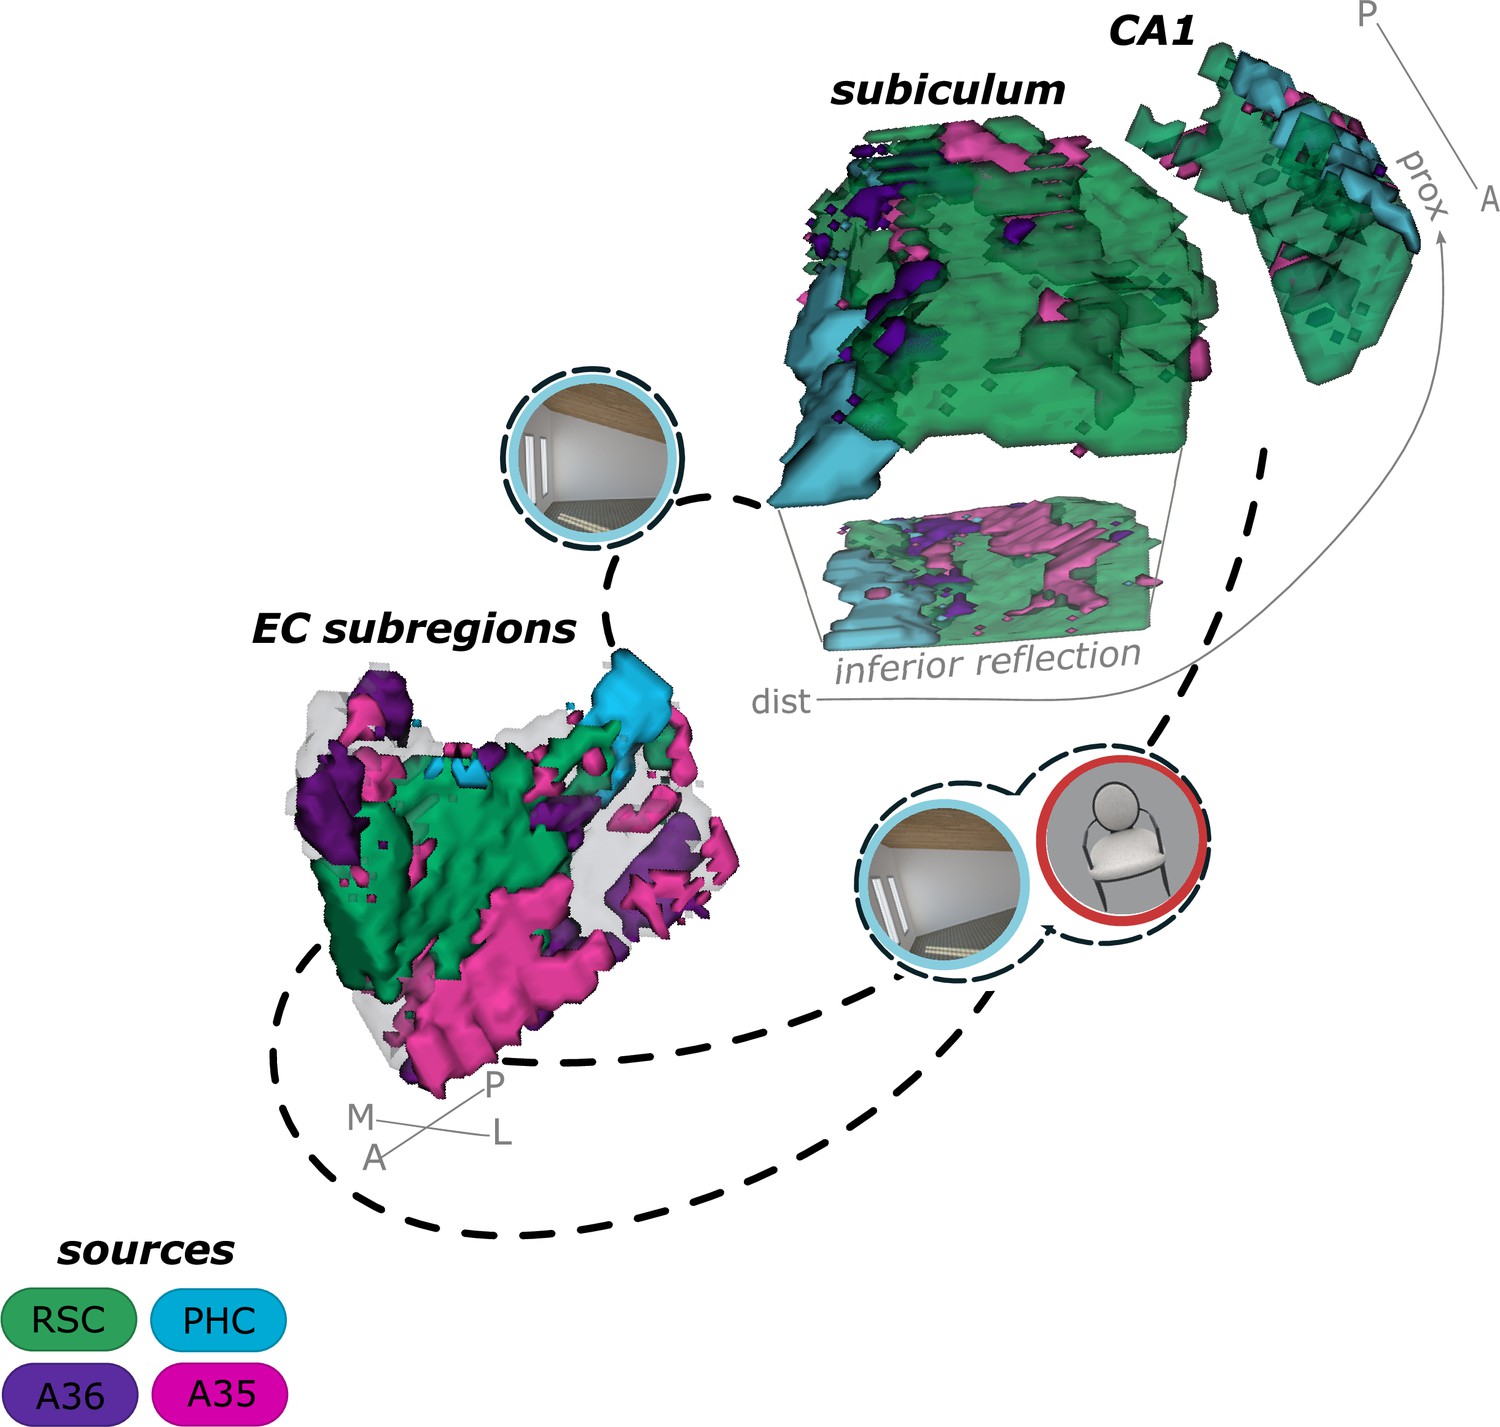
Summary of current results on the functional connectivity and information processing within the entorhinal-hippocampal circuitry.
Displayed is a schematic overview of our results on the functional connectivity and information processing within the entorhinal-hippocampal circuitry with four entorhinal seed regions and a focus on the transversal axis of hippocampal subiculum and CA1. The four entorhinal seed regions are derived from preferential functional connectivity to retrosplenial (RSC, green), parahippocampal (PHC, blue) and perirhinal Area 36 (A36, purple) and Area 35 (A35, pink) sources. Routes of preferred functional connectivity are depicted with dashed lines and the preferred information processed in the connected areas is depicted with symbolizing icons (scene – blue and object – red; stimuli from the task performed by the participants). M – medial; L – lateral; A – anterior; P – posterior; prox – proximal; dist – distal.
Appendix 1—figure 1
Left entorhinal seed regions based on connectivity preferences to cortical regions.
Displayed is the left entorhinal cortex as a 3D image with colored seed regions. The seed regions have been identified based on a source-to-voxel functional connectivity analysis and resulting connectivity preference to either the left retrosplenial cortex (RSC, green), parahippocampal cortex (PHC, blue), Area 36 (A36, purple) or Area 35 (A35, pink) sources. Note that preferences to Area 36 are best visible from a medial perspective on the entorhinal cortex as depicted in the medial reflection. Seed regions have been determined based on the maximum voxels across four one-sample T-tests at group level, one per source, sample size n = 32. M – medial; L – lateral; A – anterior; P – posterior.
Appendix 1—figure 2
Functional connectivity preferences to entorhinal seeds along the subiculum and CA1 transversal axis, left hemisphere.
Displayed are the results of a seed-to-voxel functional connectivity analysis between the displayed left entorhinal seeds and the left subiculum and CA1 subregion. The 3D figure shows voxel-wise connectivity preferences to the entorhinal seeds (color coded to refer to the respective entorhinal seed [E]) on group level ([A] - subiculum; [B] - CA1; maps for connectivity preferences: Source code 9 - ECArea35-based, pink; Source code 10 - ECArea36-based, purple; Source code 12 - ECPHC-based, blue; Source code 11 - ECRSC-based seed, green). Note that preferences to the ECArea35-based seed (pink) are located mainly in the inferior subiculum and CA1 and are therefore visible in the inferior reflection. To display mean connectivity preferences across participants along the transversal axis, beta estimates were extracted and averaged from equally sized segments from proximal to distal ends (five segments in subiculum [A], three segments in CA1 [B]; schematized in white on the 3D figures) on each coronal slice and averaged along the longitudinal axis. Repeated measures ANOVAs revealed significant differences in connectivity estimates along the transversal axis in CA1 [D] and subiculum [C] with interaction effects in the subiculum. Displayed significances obtained by FDR-corrected post-hoc tests and refer to p<0.05. Empty asterisks refer to effects that did not reach significance under FDR-correction. Shaded areas in the graphs refer to standard errors of the mean, sample size n = 32. EC – entorhinal; M – medial; L – lateral; A – anterior; P – posterior; prox – proximal; dist – distal. Appendix 1—figure 2—source data 1 contains individual connectivity estimates per subregion (Sub – subiculum and CA1, respectively) and seed (ECRSC-based – RSCECseed, ECArea35-based – A35ECseed, ECPHC-based – PHCECseed, ECArea36-based – A36ECseed) for each transversal segment (1–5 or 1–3, respectively from proximal to distal).
-
Appendix 1—figure 2—source data 1
Individual functional connectivity estimates to left entorhinal seeds, extracted from left subiculum and CA1 transversal segments.
- https://cdn.elifesciences.org/articles/76479/elife-76479-app1-fig2-data1-v3.zip
Appendix 1—figure 3
Functional activity during scene and object conditions in entorhinal seed regions, left hemisphere.
Displayed are the extracted parameter estimates for the object versus baseline contrast (‘object information processing’, red) and the scene versus baseline contrast (‘scene information processing’, cyan) from each left entorhinal seed region per individual (dots) and summarized across individuals (lines). A schematic depiction of the respective entorhinal seed regions is displayed by a 3D drawing of the left EC. A repeated measures ANOVA revealed a significant interaction between condition and seed region. The displayed significant difference is obtained with FDR-corrected post-hoc tests and refers to p<0.05. During the object condition, participants were presented with 3D rendered objects on screen, during the scene condition with 3D rendered rooms and during the baseline condition they saw scrambled pictures. The shaded area around the lines refers to standard errors of the mean, sample size n = 32. EC – entorhinal; M – medial; L – lateral; A – anterior; P – posterior. Appendix 1—figure 3—source data 1 contains extracted parameter values per individual and EC seed (isthmuscingulate – ECRSC-based, Area 35 – ECArea35-based, Area 36 – ECArea36-based, PHC – ECPHC-based seed) for the object versus baseline and scene versus baseline contrasts.
-
Appendix 1—figure 3—source data 1
Individual parameter estimates for scene and object processing in left entorhinal seed regions.
- https://cdn.elifesciences.org/articles/76479/elife-76479-app1-fig3-data1-v3.zip
Appendix 1—figure 4
Functional activity during scene and object conditions along the transversal axis of subiculum and CA1, left hemisphere.
Displayed are the extracted parameter estimates for the object versus baseline contrast (red) and the scene versus baseline contrast (cyan) from the respective transversal segments in the subiculum ([A] grey) and CA1 ([B] blue) per individual (dots) and summarized across individuals (lines). A schematic depiction of the respective transversal segment is displayed by a 3D drawing of the left subiculum and CA1 subregions. Repeated measures ANOVAs revealed a significant interaction between condition and transversal segment in the subiculum only. The displayed significant difference was obtained with FDR-corrected post-hoc tests and refers to p<0.05. During the object condition, participants were presented with 3D rendered objects on screen, during the scene condition with 3D rendered rooms and during the baseline condition they saw scrambled pictures. The shaded area around the lines refers to standard errors of the mean, sample size n = 32. Appendix 1—figure 4—source data 1 contains extracted parameter values for each subregion (Sub – subiculum and CA1, respectively) per individual and transversal segment (1–5 and 1–3, respectively from proximal to distal).
-
Appendix 1—figure 4—source data 1
Individual parameter estimates for scene and object processing in left transversal subiculum and CA1 segments.
- https://cdn.elifesciences.org/articles/76479/elife-76479-app1-fig4-data1-v3.zip
Appendix 2—figure 1
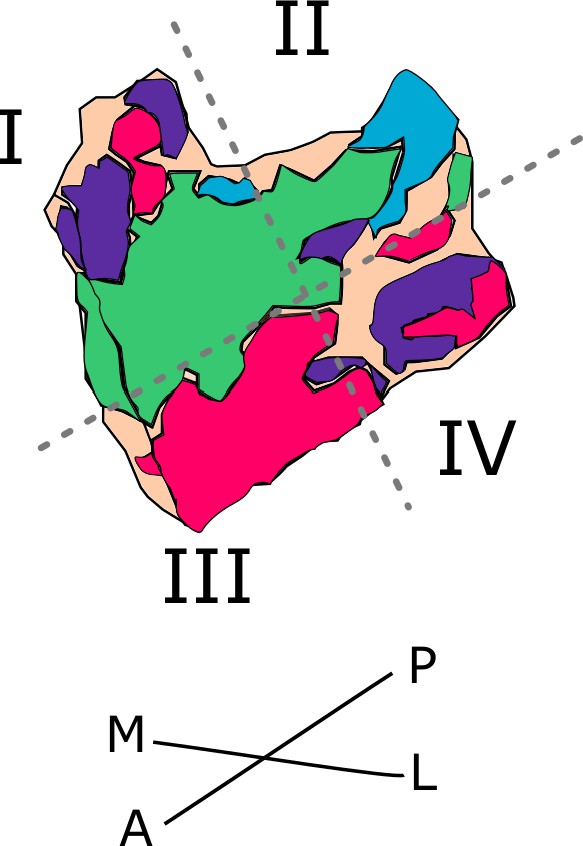
Entorhinal cortex cut in four quadrants.
Illustrated is the schematic entorhinal cutting in four quadrants (I, II, III and IV) in the right hemisphere. Stippled lines illustrate approximate cuts. M – medial, L – lateral, A – anterior, P – posterior.
Appendix 3—figure 1
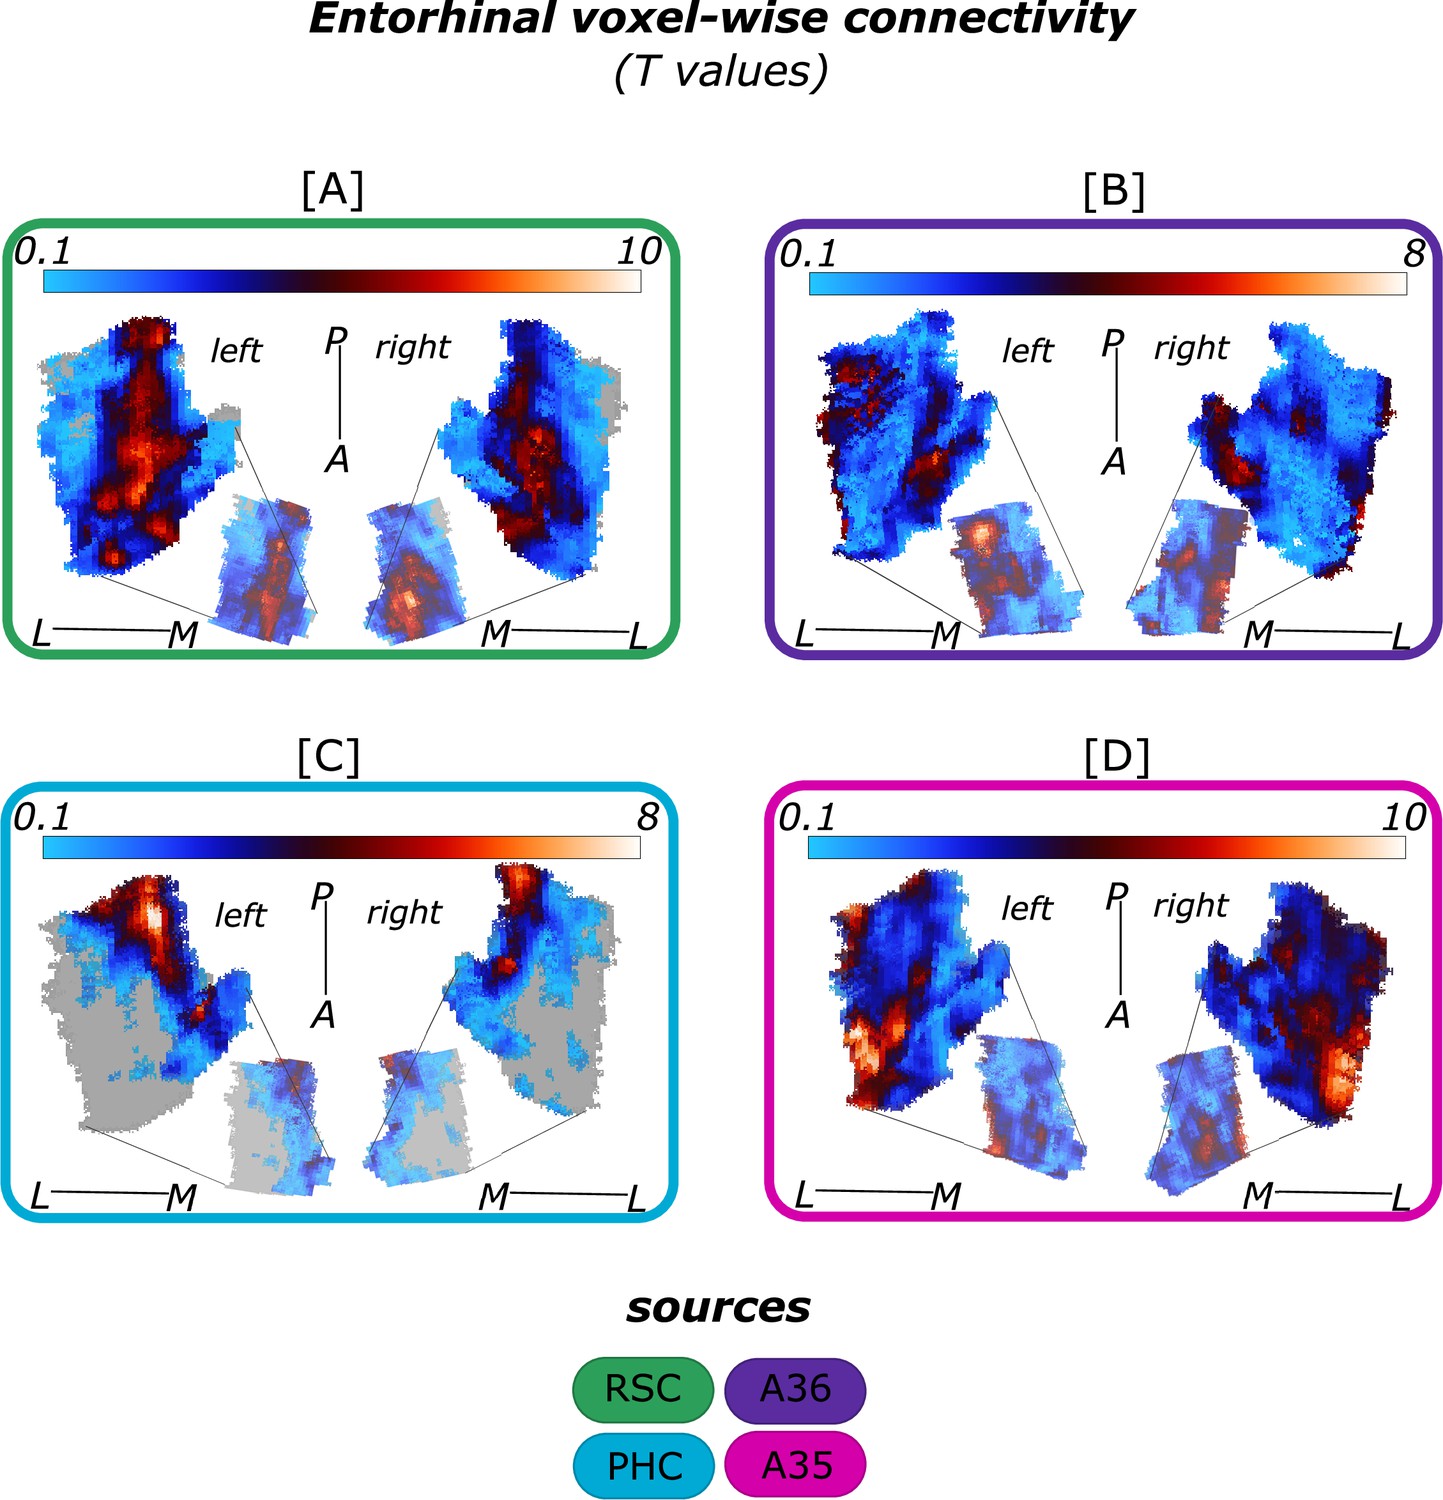
Entorhinal functional connectivity with isolated cortical sources.
Displayed are the voxel-wise functional connectivity values (T values) of the EC with the respective cortical sources [A] retrosplenial cortex (RSC, green, left: Source code 3, right: Source code 7), [B] perirhinal Area 36 (A36, purple, left: Source code 2, right: Source code 6), [C] parahippocampal cortex (PHC, blue, left: Source code 4, right: Source code 8) and [D] perirhinal Area 35 (A35, pink, left: Source code 1, right: Source code 5). Results from left and right hemisphere one-sample T-tests for the functional connectivity with the respective source are displayed alongside each other for each cortical source, sample size n = 32. The smaller entorhinal cortex maps in the middle of each rectangle are medial reflections of the respective results. Colorbars reflect the range of T values. Grey areas refer to T values of T<0.1. L – lateral; M – medial; A – anterior; P – posterior.
Appendix 3—figure 2
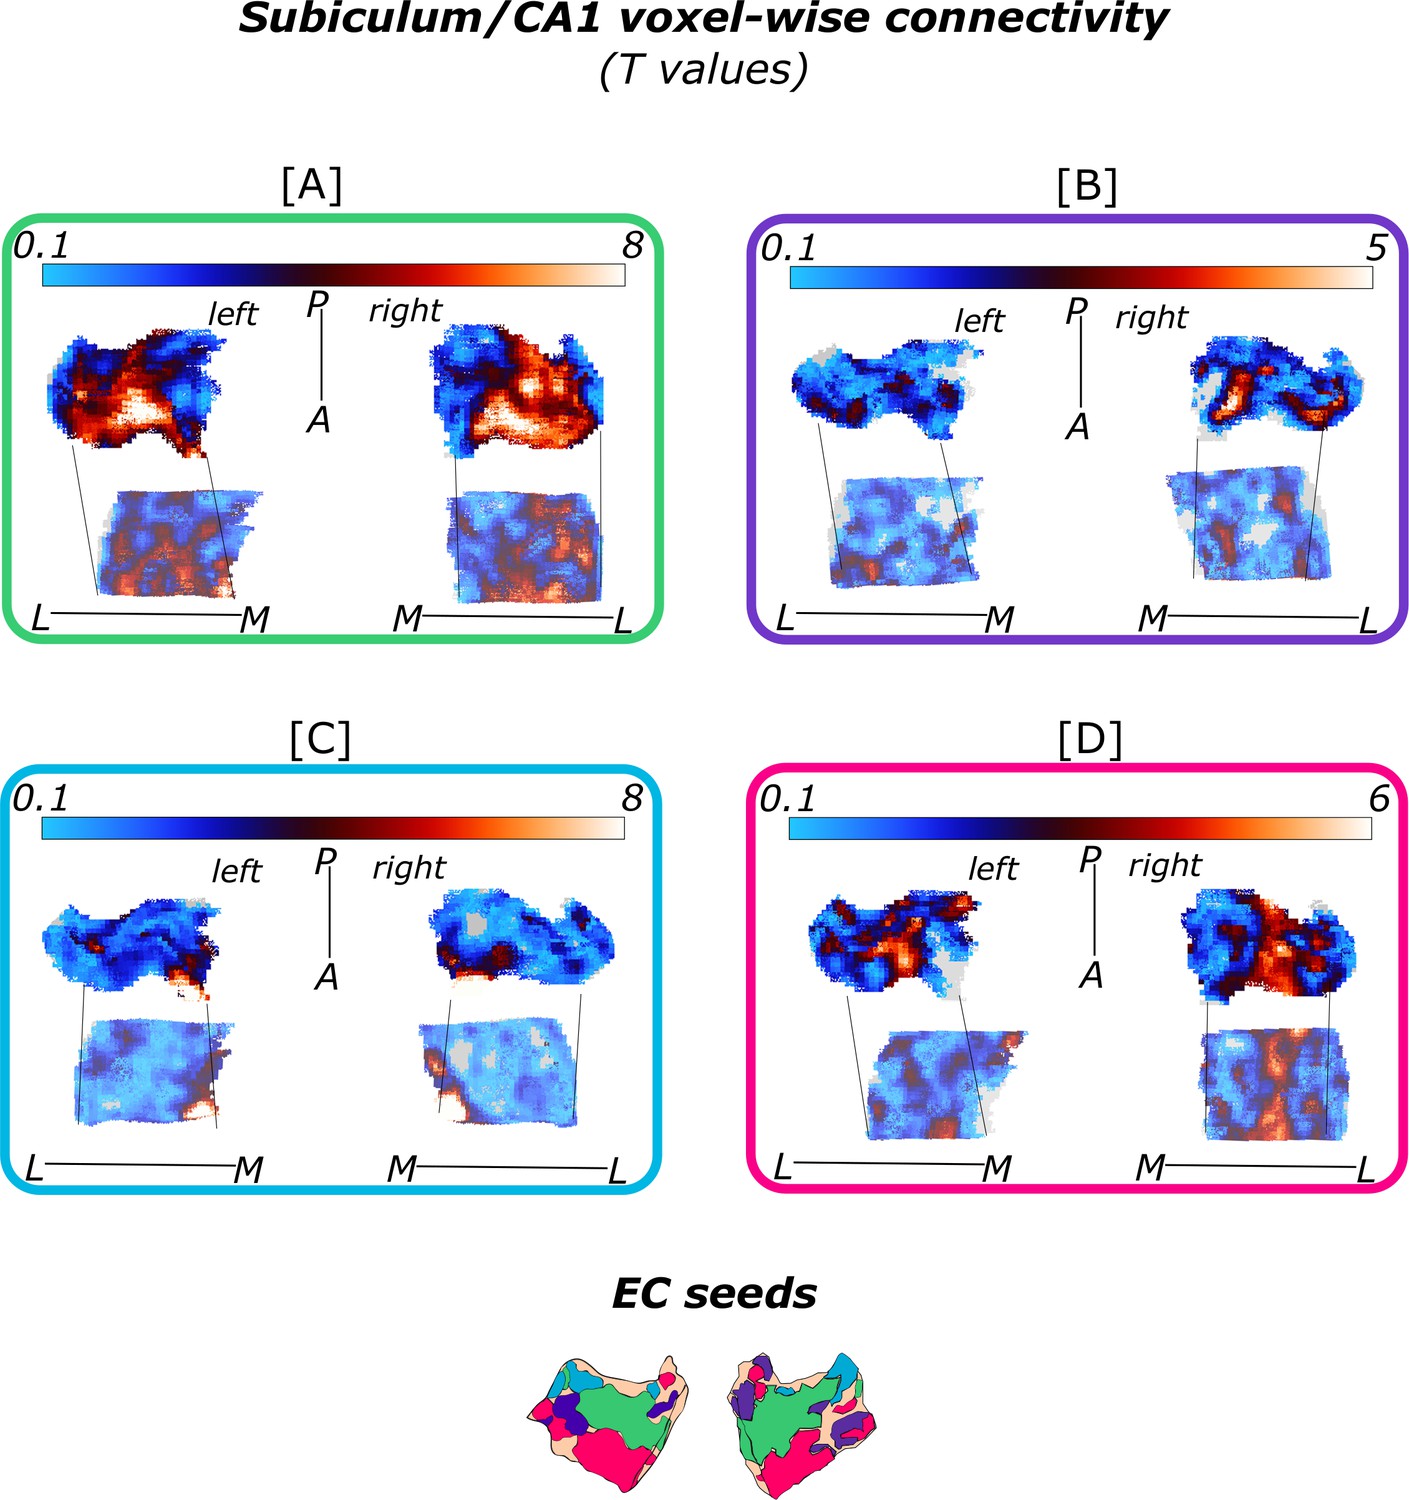
Subiculum/CA1 functional connectivity with isolated entorhinal (EC) seeds.
Displayed are the voxel-wise functional connectivity values (T values) of the subiculum and CA1 to the respective [A] green (ECRSC-based, left: Source code 11, right: Source code 15) [B] purple (ECArea36-based, left: Source code 10, right: Source code 14), [C] blue (ECPHC-based, left: Source code 12, right: SourceSource code 16) and [D] pink (ECArea35-based, left: Source code 9, right: Source code 13) EC seeds. The respective seeds are illustrated in the lower panel. Results from left and right hemisphere one-sample T-test for the functional connectivity with the respective seed are displayed alongside each other, sample size n = 32. The lower subiculum/CA1 maps within each rectangle are inferior reflections of the respective results. Colorbars reflect the range of T values. Grey areas refer to T values of T<0.1. L – lateral; M – medial; A – anterior; P – posterior.
Appendix 4—figure 1
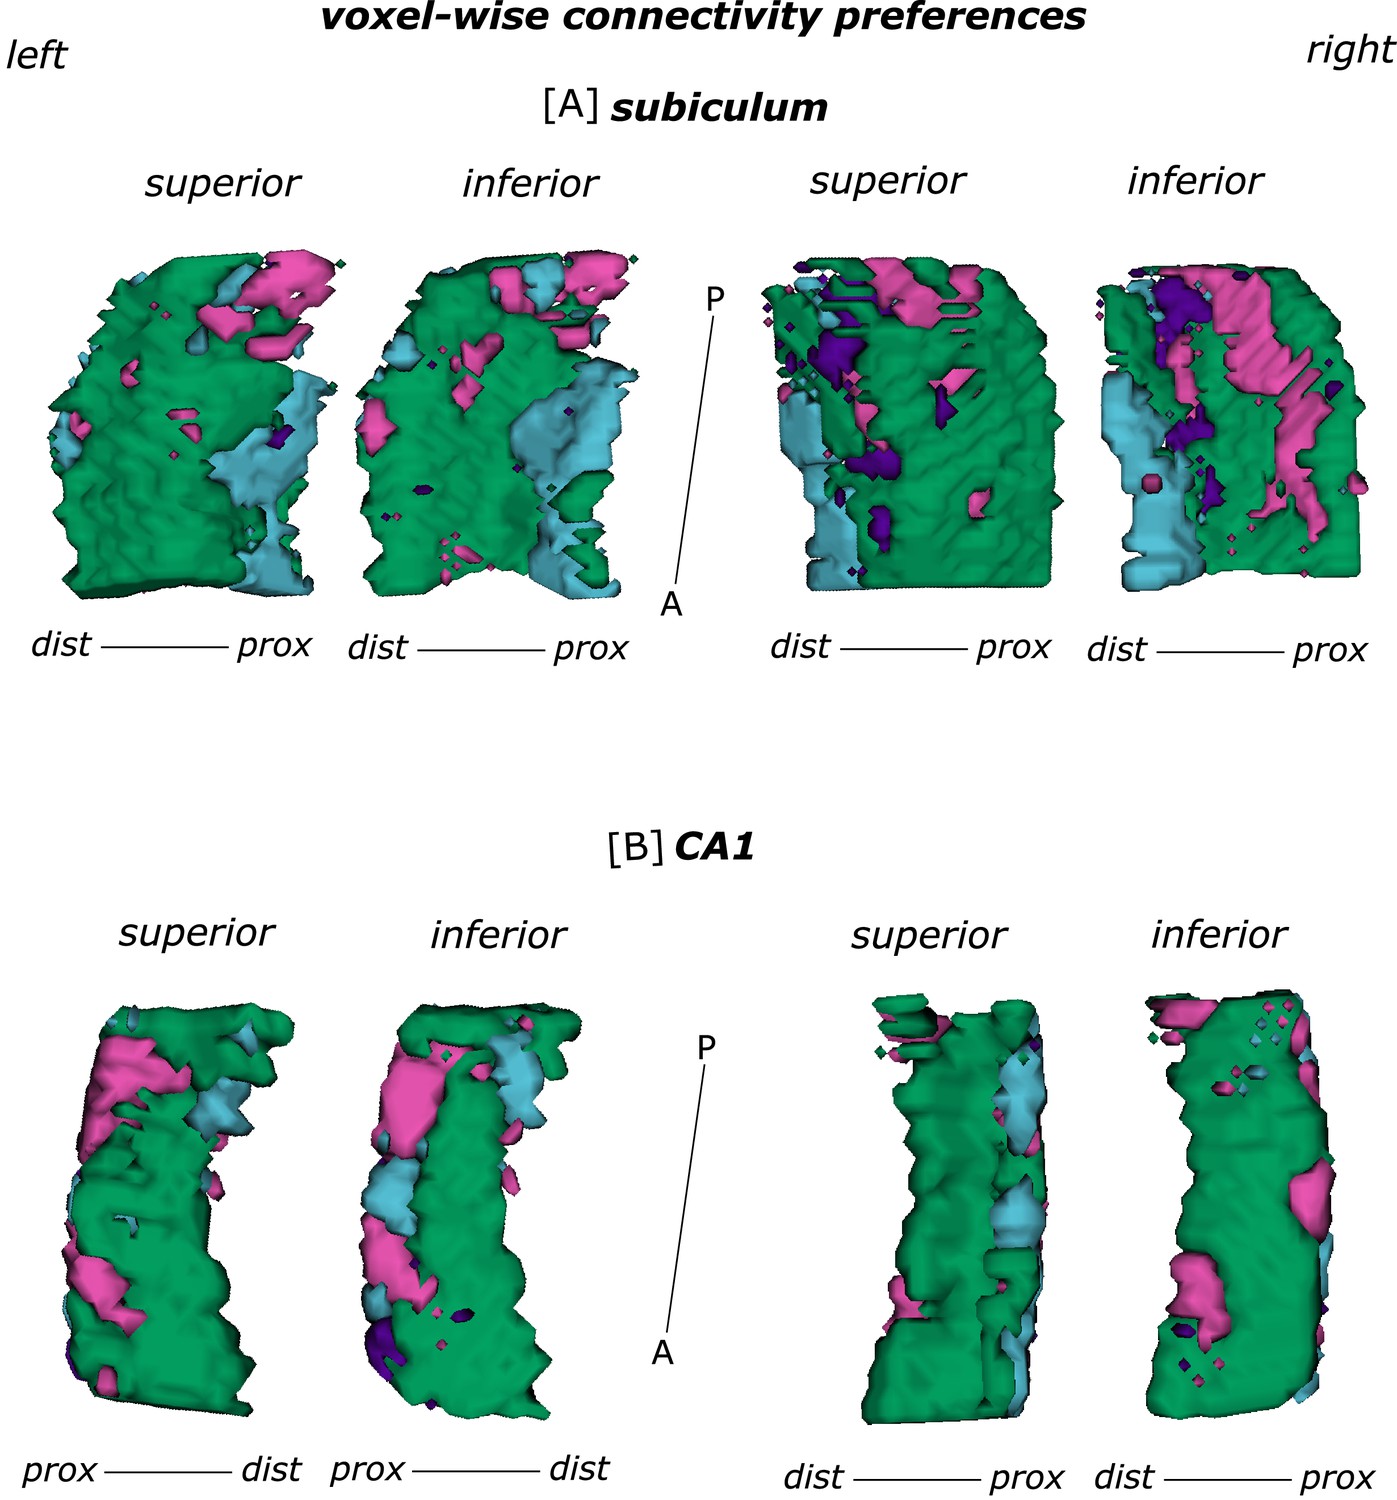
Functional connectivity preferences to entorhinal seeds along the subiculum and CA1 transversal axis.
Displayed are the results of a seed-to-voxel functional connectivity analysis between entorhinal seeds and the left and right subiculum [A] and CA1 [B] subregion. Voxel-wise connectivity preferences to the entorhinal seeds on group level are shown from a superior and an inferior perspective on the respective subregion. The figure displays the same data as in Appendix 1—figure 2 and Figure 2 and is based on Source code 9–16. The color coding refers to the respective entorhinal seed: green - ECRSC-based; purple - ECArea36-based; blue - ECPHC-based and pink - ECArea35-based seed. M – medial; L – lateral; A – anterior; P – posterior; prox – proximal; dist – distal.
Appendix 5—figure 1
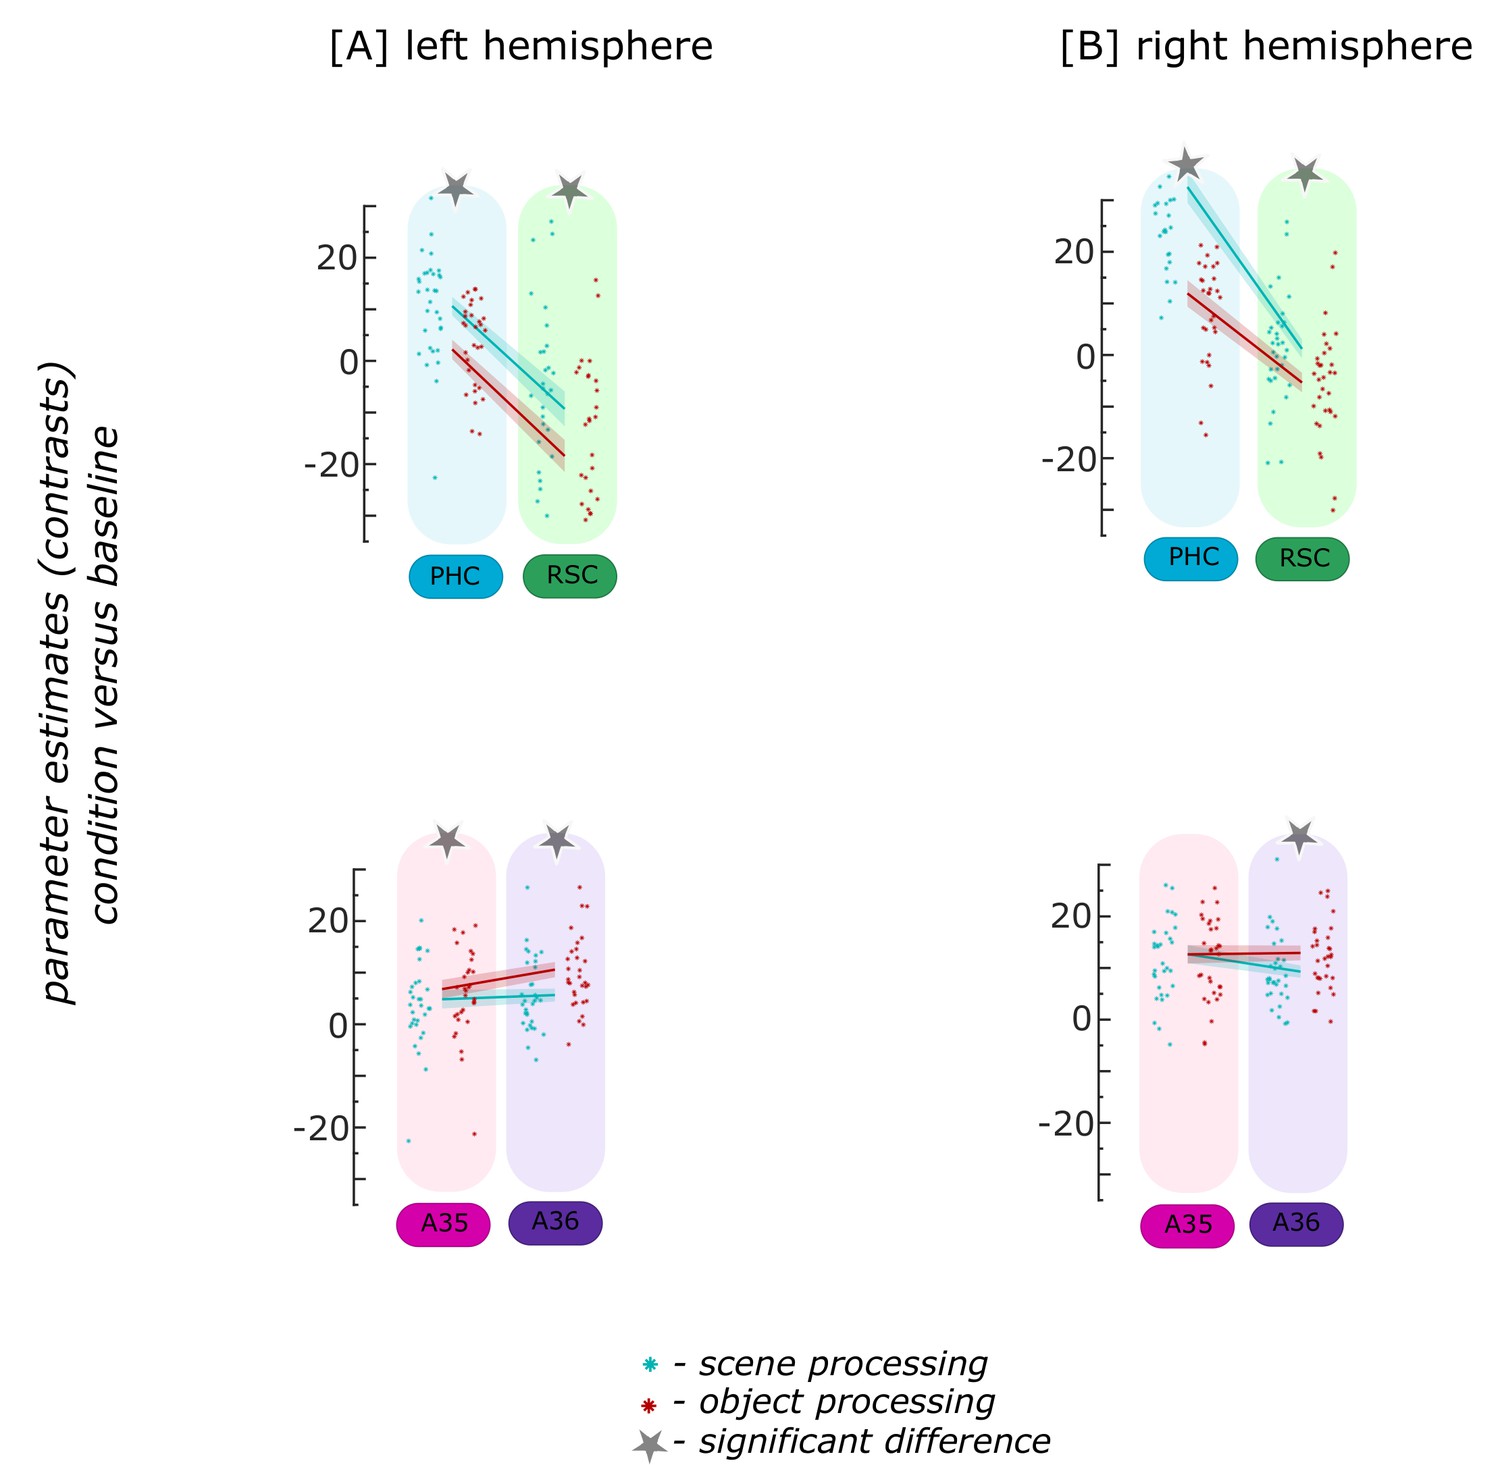
Functional activity during scene and object conditions in cortical source regions.
Displayed are the extracted parameter estimates for the object versus baseline contrast (red) and the scene versus baseline contrast (cyan) from four cortical source regions in the [A] left and [B] right hemisphere, per individual (dots) and summarized across individuals (lines). Repeated measures ANOVAs revealed a significant interaction between condition and cortical source region in both hemispheres. The displayed significant differences (asterisks) were obtained with FDR-corrected post-hoc tests and refer to p<0.05, sample size n = 32. During the object condition, participants were presented with 3D rendered objects on screen, during the scene condition with 3D rendered rooms and during the baseline condition they saw scrambled pictures. The shaded area around the lines refer to standard errors of the mean. PHC – parahippocampal cortex (blue), RSC – retrosplenial cortex (green), A35 – perirhinal Area 35 (pink), A36 – perirhinal Area 36 (purple). Appendix 5—figure 1—source data 1 contains extracted parameter values from cortical source regions (left – lSources, right – rSources, isthmuscingulate – retrosplenial) for the object versus baseline and scene versus baseline conditions per individual.
-
Appendix 5—figure 1—source data 1
Individual parameter estimates for scene and object processing in cortical source regions.
- https://cdn.elifesciences.org/articles/76479/elife-76479-app5-fig1-data1-v3.zip
Appendix 7—figure 1
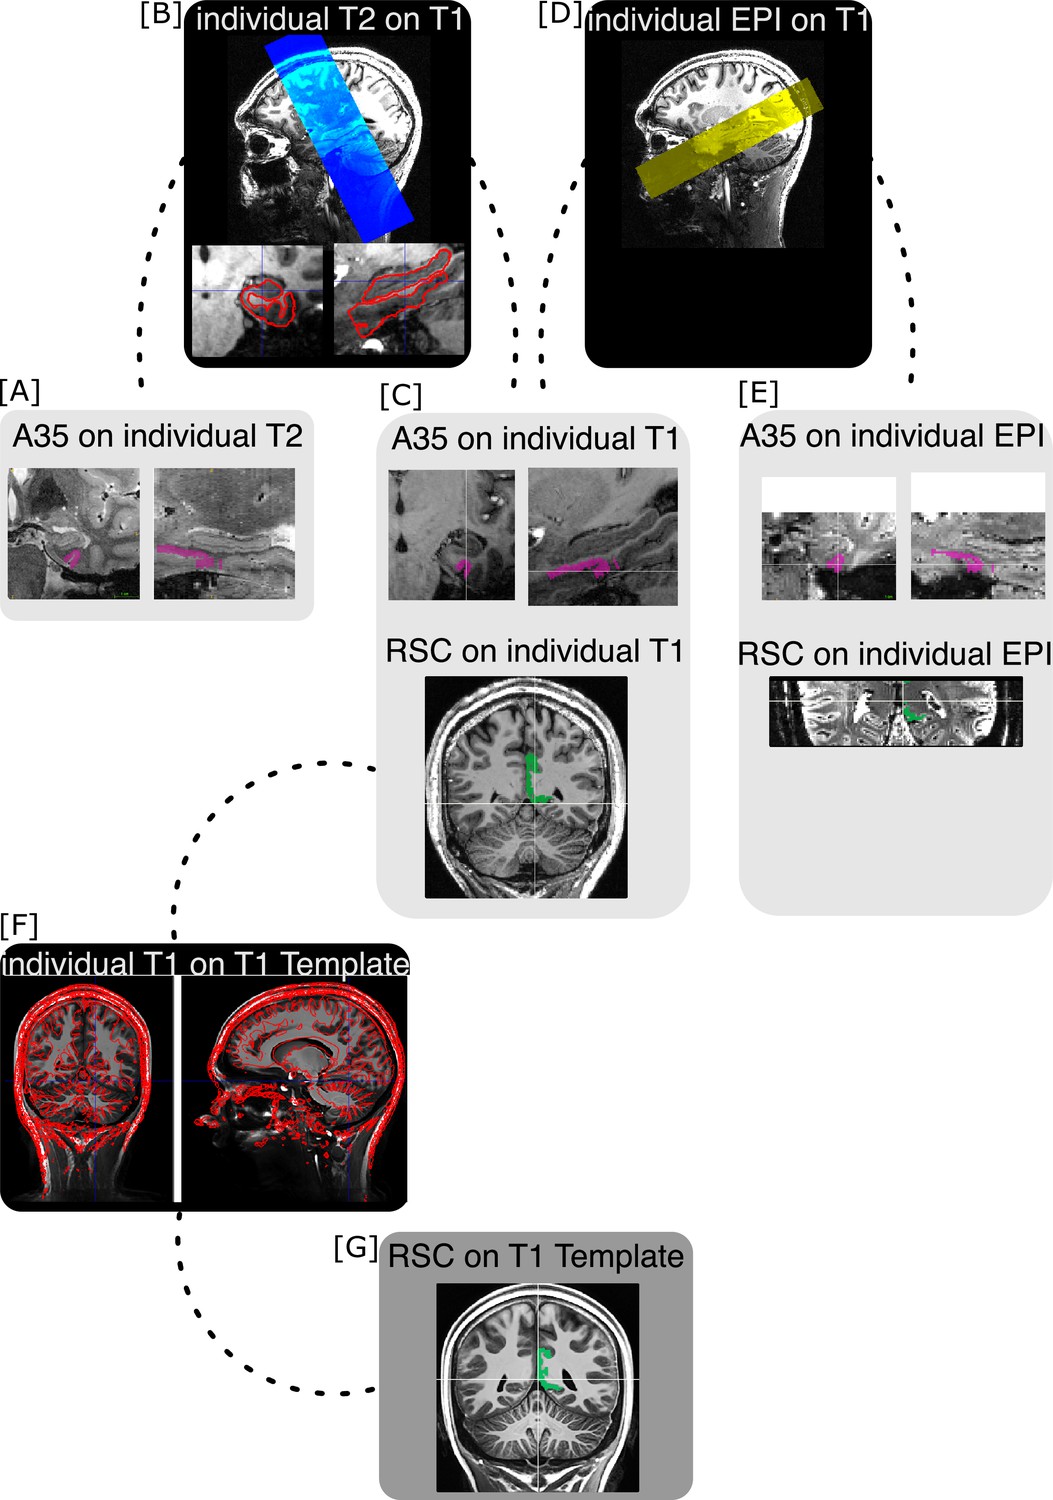
Co-registration procedure.
[A] Medial temporal lobe regions of interest (ROIs) were segmented on individual T2 images. Displayed is an example region (perirhinal Area 35, A35, pink) on a representative example individual T2 image. [B] Individual T2 images (blue overlay) were co-registered to whole-brain individual T1 images (upper image). The resulting warping matrices were applied to transfer the segmented ROIs from individual T2 space to individual T1 space. The co-registration procedure was manually evaluated based on landmarks (lower two images and [C]). [C] Displayed is the same example region Area 35 of the same example individual on corresponding coronal (left) and sagittal (right) slices on the individual’s T1 image (upper two images). [D] Individual echo-planar images (EPI, yellow overlay) have been co-registered to the whole-brain individual T1 images as well. [E] The inverse warping matrices were applied to warp segmented ROIs from individual T1 space to the individual EPI space. Displayed is the same example region Area 35 of the same example individual on corresponding coronal (left) and sagittal (right) slices on the individual’s EPI image (upper two images). The warping result was manually evaluated based on landmarks. [F] To evaluate results on group level, all individual T1 images were averaged to create a sample-specific T1 template. Displayed is the overlay (red boundaries) of an individual T1 image on the sample-specific T1 template. The resulting warping matrices were applied to move segmented ROIs from the individual T1 space to the sample-specific T1 template. [G] The retrosplenial cortex (RSC, green) ROI was originally segmented on the sample-specific T1 template. Respective (inverse) warping matrices were applied to move the retrosplenial ROI from the sample-specific T1 template to the individual T1 ([C], lower image) and EPI ([E], lower image) spaces. Landmark-based manual evaluation was applied to all co-registration steps. Displayed is the retrosplenial ROI (green) of an example individual on corresponding coronal slices on the individual T1 image ([C], lower image) and EPI ([E], lower image).
Appendix 9—figure 1
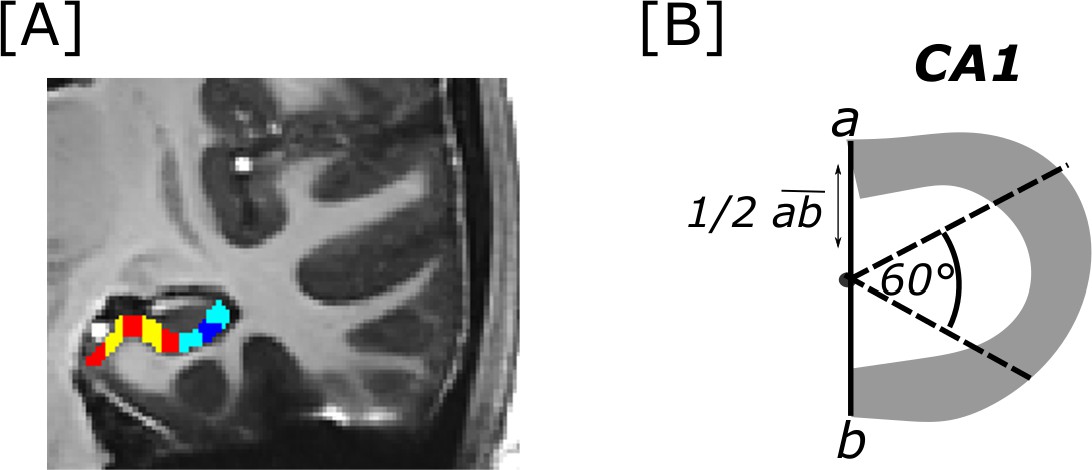
Transversal subiculum and CA1 segments.
[A] Displayed are segments cut along the transversal subiculum (red and yellow) and CA1 (cyan and dark blue) axis in the right hemisphere. Segments were cut on coronal images (as displayed in the example image) on the study-specific T1 template. [B] To cut CA1 segments, the endpoints of the transversal CA1 axis (a and b) were connected. From the middle point of that line CA1 was cut into three segments by two lines oriented in 60° angles from the line that connected a and b.
Author response image 1
Functional connectivity preferences to contralateral entorhinal seeds along the transversal axis of subiculum and CA1.
Displayed are the results of a seed-to-voxel functional connectivity analysis between the displayed right entorhinal seeds and the left subiculum and CA1 subregion. The 3D figure displays voxel-wise connectivity preferences to the entorhinal seeds (color coded to refer to the respective entorhinal seed [E]) on group level ([A] – subiculum; [B] – CA1). To display mean connectivity preferences across participants along the transversal sub/CA1 axis, β estimates were extracted and averaged from equally sized segments from proximal to distal ends (five segments in subiculum [A], three segments in CA1 [B]; schematized in white on the 3D figures) on each coronal slice and averaged along the longitudinal axis. Repeated measures ANOVAs revealed significant differences in connectivity estimates along the transversal axis of the subiculum ([C]; overall effect of seed by transversal segment: F(12,372) = 4.554; p <.001; main transversal effect of seed ECArea35-based: F(4,124) = 5.856, pFDR = .0012; ECPHC-based: F(4,124) = 3.147; pFDR = .037; ECRSC-based: F(4,124) = 7.828, pFDR <.001; ECArea36-based: F(4,124) = 0.856, pFDR = 0.493) with interaction effects (between ECPHC-based and ECRSC-based: F(4,124) = 9.249, pFDR <.001; between ECArea35-based and ECPHC-based: F(4,124) = 5.923, pFDR <.001; between ECArea35-based and ECRSC-based: p = 0.051 (uncorrected)) and in CA1 ([D] main seed by transversal effect: F(6,186) = 2.722, p = .034; main transversal effect of seed ECRSC-based: F(2,62) = 13.782; pFDR <.001; ECArea35-based: F(2,62) = .221; pFDR = .821; ECArea36-based: F(2,62) = 3.598, pFDR = .069; ECPHC-based: F(2,62) = .198, pFDR = .821). Displayed significances obtained by FDR-corrected post-hoc tests and refer to p <.05. Shaded areas in the graphs refer to standard errors of the mean. EC – entorhinal; M – medial; L – lateral; A – anterior; P – posterior; prox – proximal; dist – distal.
Author response image 2
Functional connectivity preferences to contralateral entorhinal seeds along the transversal axis of subiculum and CA1.
Displayed are the results of a seed-to-voxel functional connectivity analysis between the displayed left entorhinal seeds and the right subiculum and CA1 subregion. The 3D figure displays voxel-wise connectivity preferences to the entorhinal seeds (color coded to refer to the respective entorhinal seed [E]) on group level ([A] – subiculum; [B] – CA1). To display mean connectivity preferences across participants along the transversal sub/CA1 axis, β estimates were extracted and averaged from equally sized segments from proximal to distal ends (five segments in subiculum [A], three segments in CA1 [B]; schematized in white on the 3D figures) on each coronal slice and averaged along the longitudinal axis. Repeated measures ANOVAs revealed significant differences in connectivity estimates along the transversal axis of the subiculum ([C]; overall effect of seed by transversal segment: F(12,372) = 6.273; p <.001; main transversal effect of seed ECPHC-based: F(4,124) = 16.660; pFDR <.001; ECRSC-based: F(4,124) = 3.543, pFDR = .018; ECArea35-based: F(4,124) = 2.374, pFDR = .086; ECArea36-based: F(4,124) = 1.436, pFDR = .226) but not in CA1 ([D] main seed by transversal effect: F(6,186) = 1.812, p = .145). Displayed significances obtained by FDR-corrected post-hoc tests and refer to p <.05. Shaded areas in the graphs refer to standard errors of the mean. EC – entorhinal; M – medial; L – lateral; A – anterior; P – posterior; prox – proximal; dist – distal.
Author response image 3
Entorhinal seed regions based on connectivity preferences to contralateral cortical regions.
Displayed is the left EC as a 3D image with colored subregions. The subregions have been identified based on a source-to-voxel functional connectivity analysis and resulting connectivity preference to either the right retrosplenial (RSC, green) cortex, parahippocampal cortex (PHC, blue), Area 36 (A36, purple) or Area 35 (A35, pink) sources. Subregions have been determined based on the thresholded (T > 3.1) maximum voxels across four one-sample t-tests at group level, one per source. M – medial; L – lateral; A – anterior; P – posterior.
Author response image 4
Entorhinal seed regions based on connectivity preferences to contralateral cortical regions.
Displayed is the right EC as a 3D image with colored subregions. The subregions have been identified based on a source-to-voxel functional connectivity analysis and resulting connectivity preference to either the left retrosplenial (RSC, green) cortex, parahippocampal cortex (PHC, blue), Area 36 (A36, purple) or Area 35 (A35, pink) sources. Subregions have been determined based on the thresholded (T > 3.1) maximum voxels across four one-sample t-tests at group level, one per source. M – medial; L – lateral; A – anterior; P – posterior.
Tables
Appendix 2—table 1
Number of voxels attributed to have a preferred functional connectivity to either cortical source (RSC, PHC, A35, A36) within each EC quadrant (I.-IV.).
Bold voxel numbers refer to the highest number across EC quadrants. EC – entorhinal cortex, RSC – retrosplenial cortex, PHC – parahippocampal cortex, A35 – perirhinal Area 35, A36 – perirhinal Area 36.
| EC quadrant | I. | II. | III. | IV. |
|---|---|---|---|---|
| RSC-source | 599 | 421 | 337 | 173 |
| PHC-source | 13 | 132 | 0 | 0 |
| A35-source | 71 | 80 | 433 | 167 |
| A36-source | 103 | 51 | 39 | 201 |
Appendix 9—table 1
Number of voxels in transversal subiculum and CA1 segments for each hemisphere.
| left hemisphere (distal to proximal segments) | right hemisphere (distal to proximal segments) | |||||||||
|---|---|---|---|---|---|---|---|---|---|---|
| subiculum | 340 | 419 | 511 | 396 | 638 | 338 | 465 | 451 | 460 | 575 |
| CA1 | 399 | 341 | 340 | 337 | 330 | 338 | ||||
Additional files
-
Transparent reporting form
- https://cdn.elifesciences.org/articles/76479/elife-76479-transrepform1-v3.pdf
-
Source code 1
Group-level statistical map (T-statistics, one-sample T-test) for left Area 35 to left entorhinal voxels functional connectivity.
- https://cdn.elifesciences.org/articles/76479/elife-76479-code1-v3.zip
-
Source code 2
Group-level statistical map (T-statistics, one-sample T-test) for left Area 36 to left entorhinal voxels functional connectivity.
- https://cdn.elifesciences.org/articles/76479/elife-76479-code2-v3.zip
-
Source code 3
Group-level statistical map (T-statistics, one-sample T-test) for left retrosplenial to left entorhinal voxels functional connectivity.
- https://cdn.elifesciences.org/articles/76479/elife-76479-code3-v3.zip
-
Source code 4
Group-level statistical map (T-statistics, one-sample T-test) for left parahippocampal to entorhinal voxels functional connectivity.
- https://cdn.elifesciences.org/articles/76479/elife-76479-code4-v3.zip
-
Source code 5
Group-level statistical map (T-statistics, one-sample T-test) for right Area 35 to entorhinal voxels functional connectivity.
- https://cdn.elifesciences.org/articles/76479/elife-76479-code5-v3.zip
-
Source code 6
Group-level statistical map (T-statistics, one-sample T-test) for right Area 36 to entorhinal voxels functional connectivity.
- https://cdn.elifesciences.org/articles/76479/elife-76479-code6-v3.zip
-
Source code 7
Group-level statistical map (T-statistics, one-sample T-test) for right retrosplenial to entorhinal voxels functional connectivity.
- https://cdn.elifesciences.org/articles/76479/elife-76479-code7-v3.zip
-
Source code 8
Group-level statistical map (T-statistics, one-sample T-test) for right parahippocampal to entorhinal voxels functional connectivity.
- https://cdn.elifesciences.org/articles/76479/elife-76479-code8-v3.zip
-
Source code 9
Group-level statistical map (T-statistics, one-sample T-test) for left Area35-based entorhinal seed to hippocampal Subiculum/CA1 voxels functional connectivity.
- https://cdn.elifesciences.org/articles/76479/elife-76479-code9-v3.zip
-
Source code 10
Group-level statistical map (T-statistics, one-sample T-test) for left Area36-based entorhinal seed to hippocampal Subiculum/CA1 voxels functional connectivity.
- https://cdn.elifesciences.org/articles/76479/elife-76479-code10-v3.zip
-
Source code 11
Group-level statistical map (T-statistics, one-sample T-test) for left RSC-based entorhinal seed to hippocampal Subiculum/CA1 voxels functional connectivity.
- https://cdn.elifesciences.org/articles/76479/elife-76479-code11-v3.zip
-
Source code 12
Group-level statistical map (T-statistics, one-sample T-test) for left PHC-based entorhinal seed to hippocampal Subiculum/CA1 voxels functional connectivity.
- https://cdn.elifesciences.org/articles/76479/elife-76479-code12-v3.zip
-
Source code 13
Group-level statistical map (T-statistics, one-sample T-test) for right Area35-based entorhinal seed to hippocampal Subiculum/CA1 voxels functional connectivity.
- https://cdn.elifesciences.org/articles/76479/elife-76479-code13-v3.zip
-
Source code 14
Group-level statistical map (T-statistics, one-sample T-test) for right Area36-based entorhinal seed to hippocampal Subiculum/CA1 voxels functional connectivity.
- https://cdn.elifesciences.org/articles/76479/elife-76479-code14-v3.zip
-
Source code 15
Group-level statistical map (T-statistics, one-sample T-test) for right RSC-based entorhinal seed to hippocampal Subiculum/CA1 voxels functional connectivity.
- https://cdn.elifesciences.org/articles/76479/elife-76479-code15-v3.zip
-
Source code 16
Group-level statistical map (T-statistics, one-sample T-test) for right PHC-based entorhinal seed to hippocampal Subiculum/CA1 voxels functional connectivity.
- https://cdn.elifesciences.org/articles/76479/elife-76479-code16-v3.zip
-
Appendix 1—figure 2—source data 1
Individual functional connectivity estimates to left entorhinal seeds, extracted from left subiculum and CA1 transversal segments.
- https://cdn.elifesciences.org/articles/76479/elife-76479-app1-fig2-data1-v3.zip
-
Appendix 1—figure 3—source data 1
Individual parameter estimates for scene and object processing in left entorhinal seed regions.
- https://cdn.elifesciences.org/articles/76479/elife-76479-app1-fig3-data1-v3.zip
-
Appendix 1—figure 4—source data 1
Individual parameter estimates for scene and object processing in left transversal subiculum and CA1 segments.
- https://cdn.elifesciences.org/articles/76479/elife-76479-app1-fig4-data1-v3.zip
-
Appendix 5—figure 1—source data 1
Individual parameter estimates for scene and object processing in cortical source regions.
- https://cdn.elifesciences.org/articles/76479/elife-76479-app5-fig1-data1-v3.zip
Download links
A two-part list of links to download the article, or parts of the article, in various formats.
Downloads (link to download the article as PDF)
Open citations (links to open the citations from this article in various online reference manager services)
Cite this article (links to download the citations from this article in formats compatible with various reference manager tools)
Transversal functional connectivity and scene-specific processing in the human entorhinal-hippocampal circuitry
eLife 11:e76479.
https://doi.org/10.7554/eLife.76479


