Nanoscale resolution of microbial fiber degradation in action
- Department of Biochemistry, University of Zurich, Switzerland
- Faculty of Natural Sciences, Ben-Gurion University of the Negev, Israel
- Biosciences Center, National Renewable Energy Laboratory, United States
- Department of Biomolecular Sciences, The Weizmann Institute of Science, Israel
Figures
Figure 1 with 2 supplements

Cellulosome organization around C. thermocellum bacterial cells.
(A) An image of C. thermocellum cells with surrounding cellulosomes on a cryo-EM grid at low magnification. The black arrowhead indicates the gray hue that forms a layer of extracellular cellulosome complexes surrounding the bacterium. At this magnification, the layer seems homogeneously thick. (B, C) Cellulosome complexes of two different bacteria at different magnifications. In (B), cellulosomes form a condensed layer which varies in thickness (arrowhead). At higher magnification in (C), the tomographic slice reveals the cellulosomes in greater detail (arrowhead). The density of the cellulosome layer reflects the protein occupancy within the layer. (D) Immunofluorescence confocal microscopy image of C. thermocellum bacteria reveals the position of the cellulose-binding module 3a (CBM3a) component of the CipA (ScaA) scaffoldin around the cells, using primary anti-CBM3a antibodies, detected with secondary goat anti-rabbit antibodies, conjugated with Alexa 594. (E) The extracellular density (arrowhead) detected by cryo-EM was verified to be cellulosomes. Immunogold labelling of cellulosomes, applied to localize the CipA scaffoldin using anti-CBM3a antibodies, indicates that the density detected around the bacteria corresponds to cellulosome complexes (Video 1, red arrowheads). The colloidal gold appears as black dots (arrowhead), while control experiments showed no gold nanoparticle signal around the bacteria (Figure 1—figure supplement 2).
Figure 1—figure supplement 1
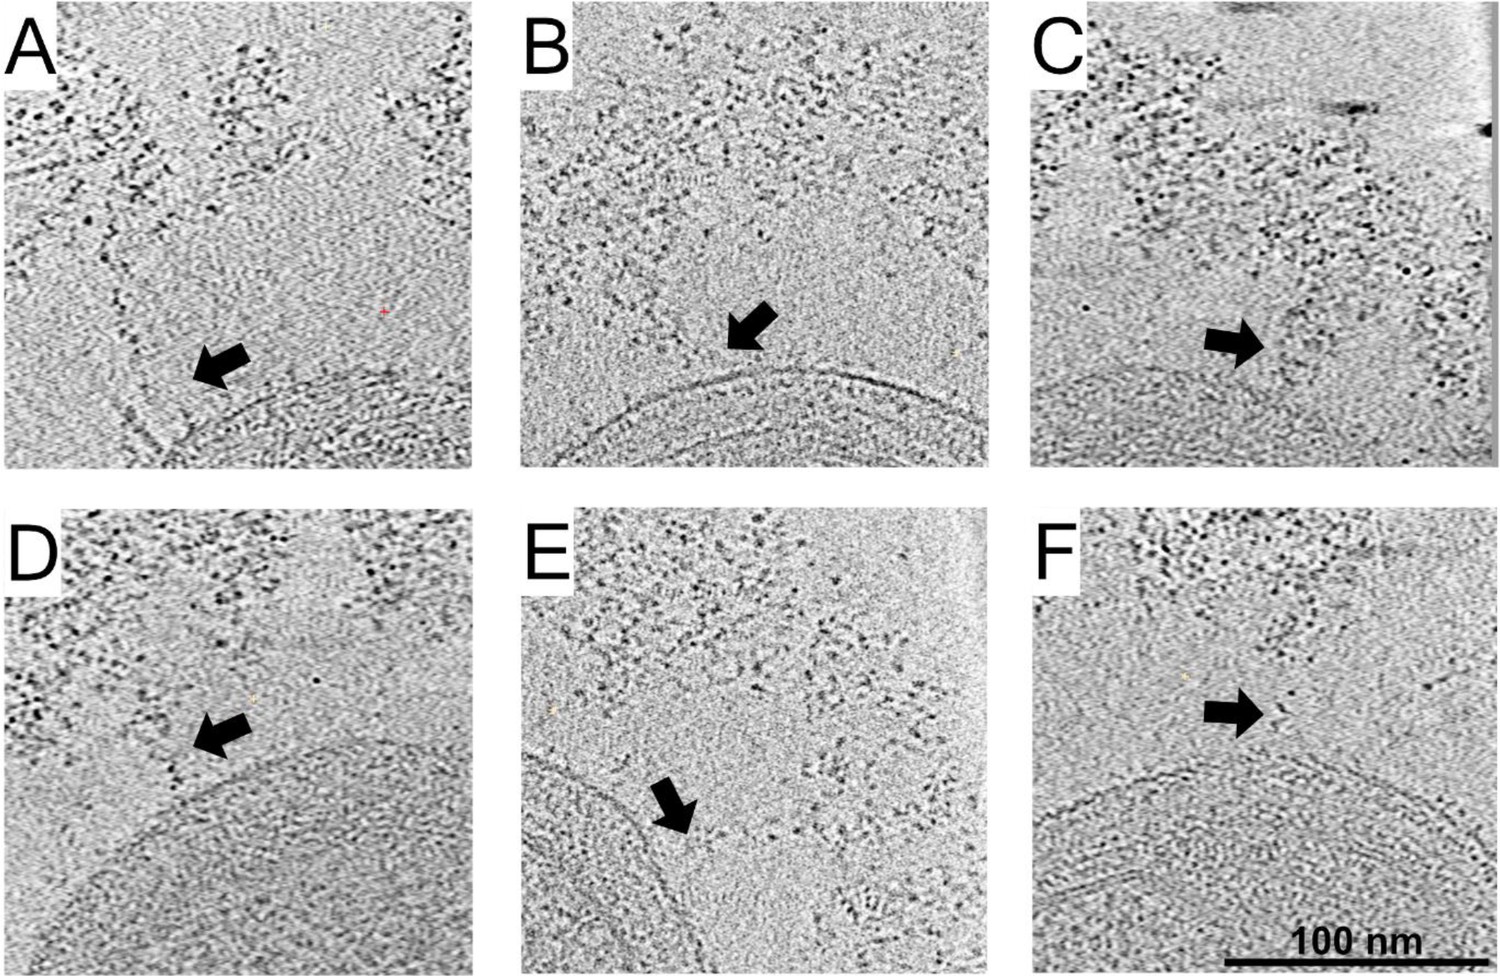
Cellulosomes emanate from the cell wall toward the densely packed cellulosome layer.
(A-F) Density spans between the bacterium and the cellulosome layer (arrows) was detected. x–y slices through six bacteria, representing 5.4 nm in thickness.
Figure 1—figure supplement 2
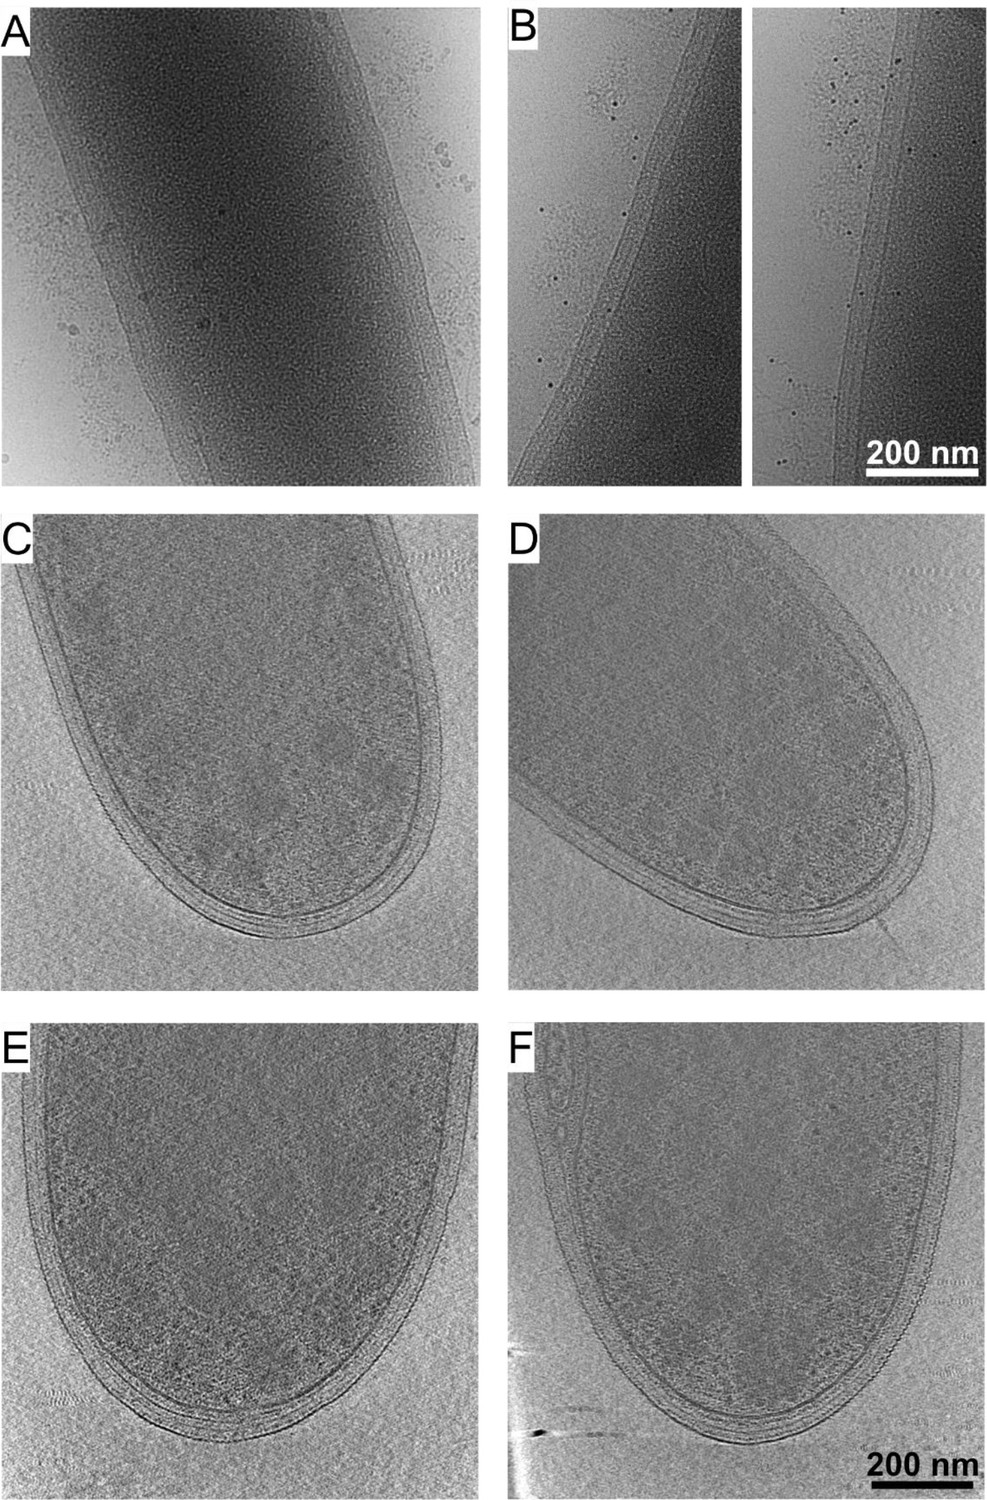
Cellulosomal protein layers around C. thermocellum cells.
Immunogold labeling using protein A coupled with colloidal gold alone showed no observed signals (A), while prior addition of the anti-CBM3a antibody directed the localization of the gold-conjugated protein A to the proteinaceous layer around the bacterium (B). Cryo-ET analysis of mutant strains: (C, D) Strain CTN7 expresses none of the major scaffoldins (i.e., CipA, OlpB, Orf2p, SdbA, OlpA, and OlpC). (E, F) Strain DS11 lacks the major enzyme-integrating scaffoldin (CipA). Neither strain produces cellulosomal structures outside the cells. These experiments indicate that the observed exogenous layer corresponds to cellulosome-related proteins.
Figure 2 with 4 supplements
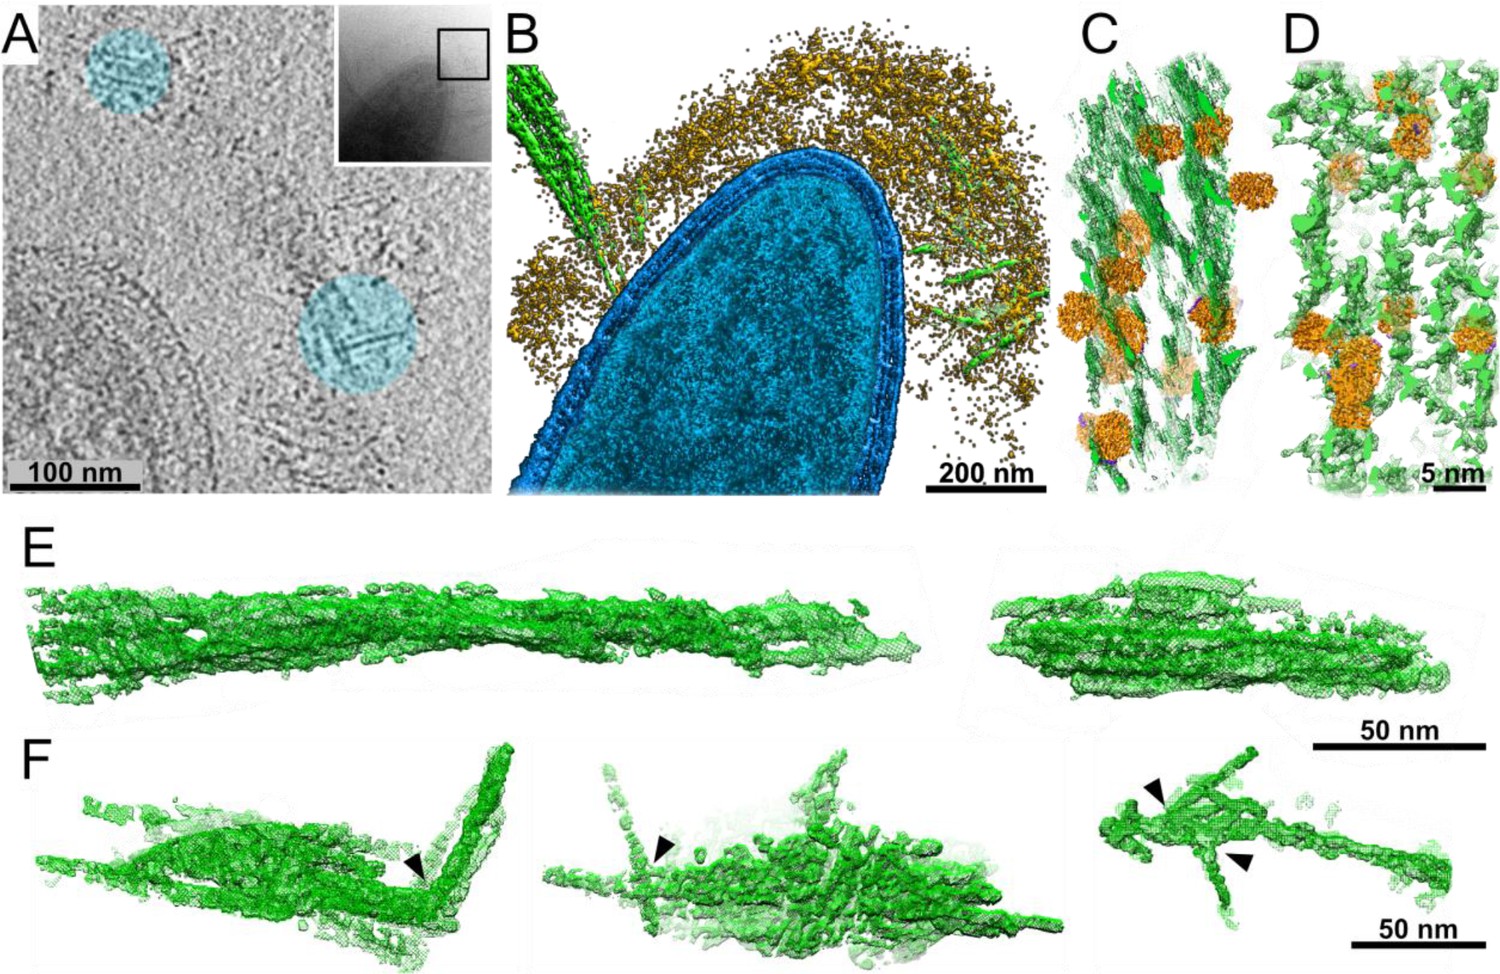
Interactions of cellulosomes with the cellulosic substrate.
(A) An x–y projection through a tomogram of a bacterium grown on microcrystalline cellulose (MCC; cyan), ~1 nm in thickness, shows the MCC densities and globular protein densities. The area that was investigated is indicated in the inset, and individual projections of the region can be seen in the video (Video 3). (B) A surface-rendered view of C. thermocellum (blue) depicts the interactions of cellulosomes (yellow) with cellulose (green). Several cellulose fibers were deconstructed into their component microfibrils within the cellulosome layer. (C) A rendered model indicating the position of cellulosomal enzymes around a cellulose fiber, enzymes (orange) and cellulose (green) in situ. (D) A rendered model of purified Cel48S, in complex with a divalent truncated scaffoldin, bound to a cellulose fiber, enzymes (orange) and cellulose (green). Positions of enzymes (orange) in (C, D) were determined by template matching and resemble each other (Figure 2—figure supplement 4). (E) Surface rendering of purified MCC indicates a compact filamentous assembly. (F) The parallel packing of cellulose fibrils is altered (arrowheads) upon the interaction with cellulosomes. These surface-rendering views of cellulose fibers were isolated in silico from in situ tomograms where interactions with cellulosomes were observed.
Figure 2—figure supplement 1
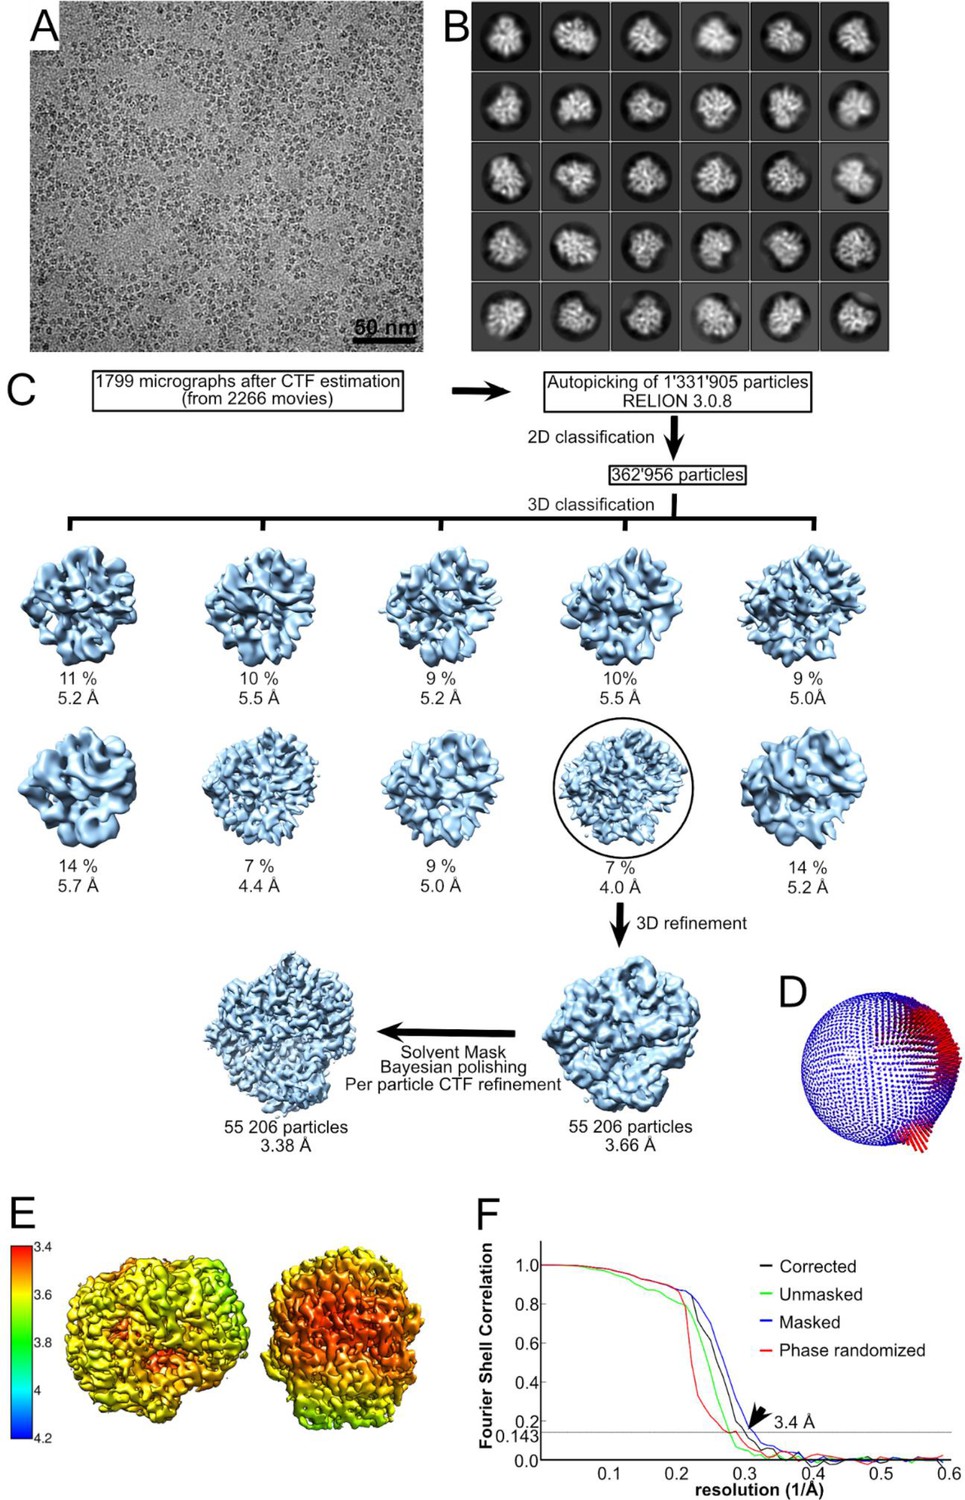
Structural determination of the Cel48S enzyme.
(A) A typical micrograph depicting the major cellulosomal exoglucanase, Cel48S. (B) The final 2D classification showing different orientations of this asymmetric protein. (C) The workflow of image processing for Cel48S. After several rounds of 2D classifications removing false positives, 362,956 particles were selected for initial 3D model building. The particles were subjected to a couple rounds of 3D classifications and refinement. The percentage of particles within the resultant 3D classes and the respective resolution of the 3D classes are visualized. Further refinement with 55,206 particles is shown in the black circle. After final refinement with B-factor of −110 Å2, a map of 3.66 Å was resolved. The map was postprocessed with a solvent mask, and the particles were subjected to Bayesian polishing and CTF refinement. These operations improved the map to 3.38 Å. (D) The angular distribution of all 55,206 particles that contributed to the final Cel48S map is depicted. The height of the cylinder bars (from blue to red) is correlated with the number of particles in this view. (E) Local resolution variations in the cryo-EM map. The resolution ranges from 3.4 to 3.8 Å as calculated by the Relion local resolution option. (F) Fourier-shell correlation (FSC) plots of the final Cel48S density map. The plot shows the unmasked (green), masked (blue), phase randomized (red), and masking-effect-corrected (black) FSC curves. The resolution at which the gold-standard FSC curve drops below the 0.143 threshold is indicated (arrow).
Figure 2—figure supplement 2
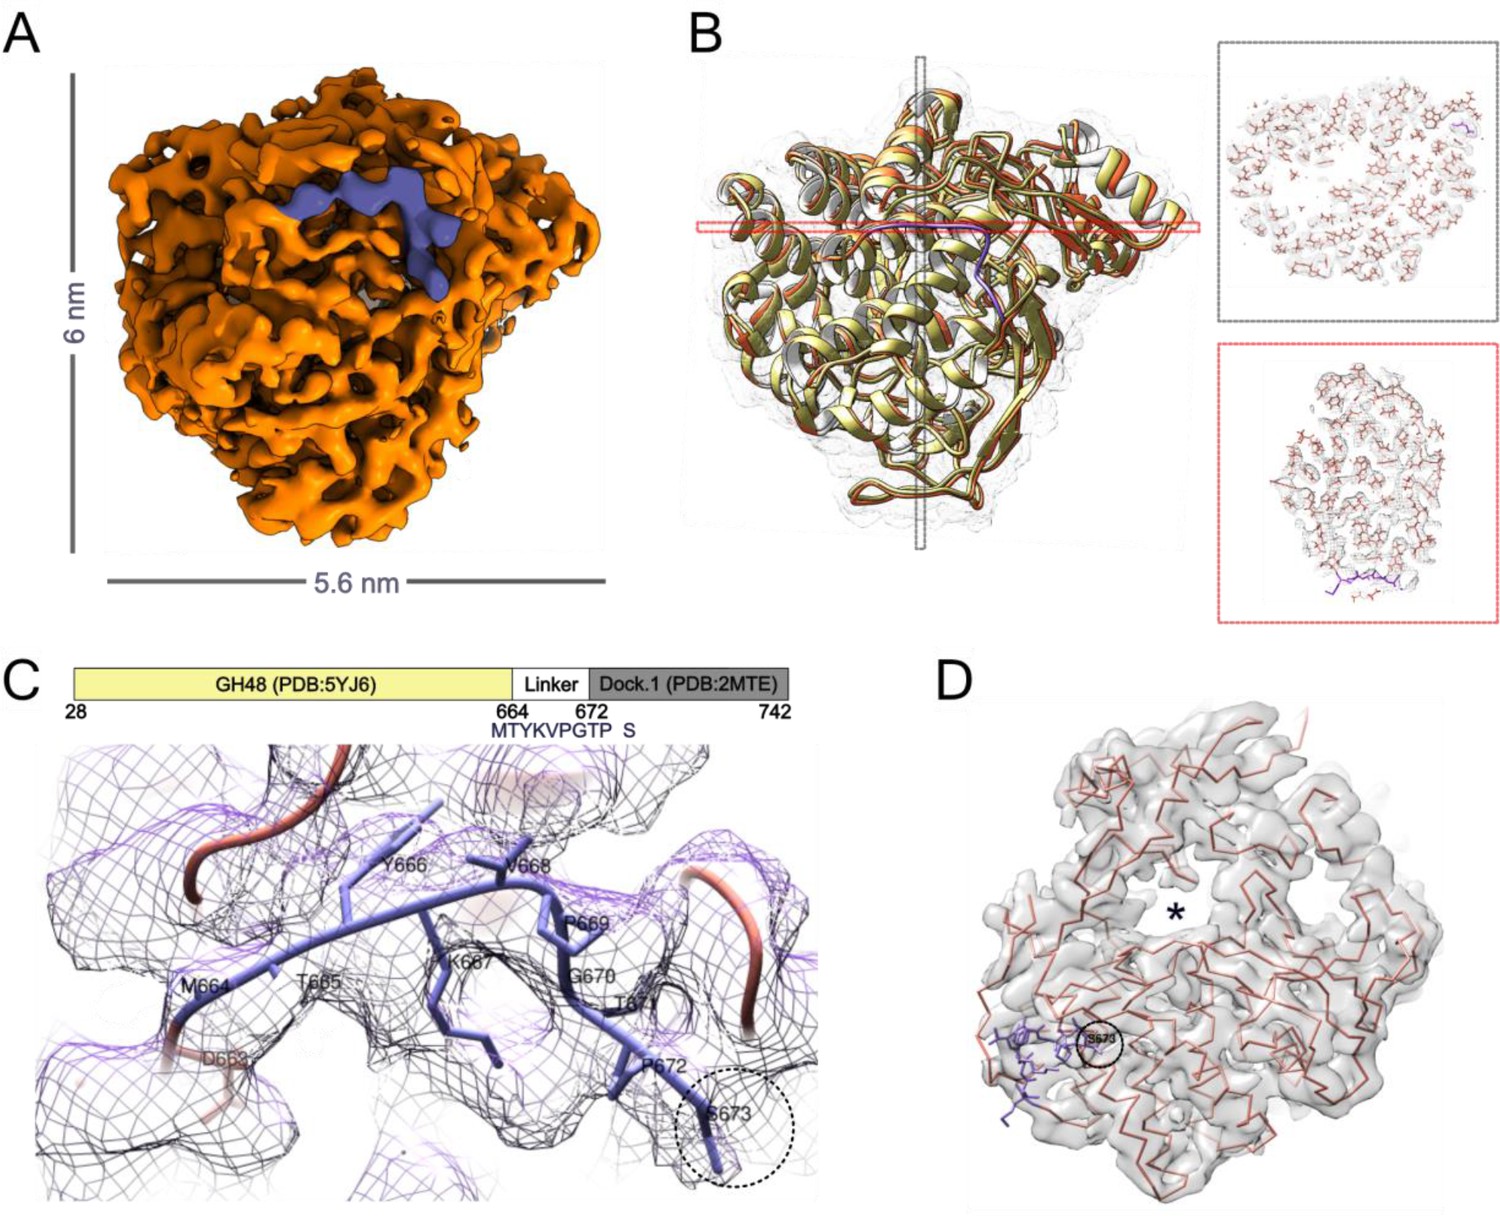
Structure of Cel48S depicts the linker region.
(A) The structure of the full-length Cel48S was determined by cryo-EM to a resolution of 3.4 Å (Figure 2—figure supplement 3). The purple region is part of the linker that was structurally determined between the enzyme and the dockerin. (B) Ribbon representation of the cryo-EM structure (orange) overlayed with PDB:5YJ6 (yellow) (Liu et al., 2018). Slices through the structure (right, black, and red indicated in B) show the quality of our reconstruction and the position of the random coil linker (purple) that follows the catalytic domain. (C) Zooming into the random coil linker, overlayed with the density map, allows us to resolve the protein sequence (MTYKVPGTP) that bridges the catalytic domain to the dockerin (Dock). Tyr666 and Pro669 were used as anchors for modeling. (D) Backbone fit to the cryo-EM density map and the catalytic tunnel (asterisk). The black circle marks the position of Ser673 which immediately precedes the dockerin module, positioned ~1 nm away from the tunnel.
-
Figure 2—figure supplement 2—source data 1
Data collection and processing statistics of the cryo-EM structure.
- https://cdn.elifesciences.org/articles/76523/elife-76523-fig2-figsupp2-data1-v3.zip
Figure 2—figure supplement 3
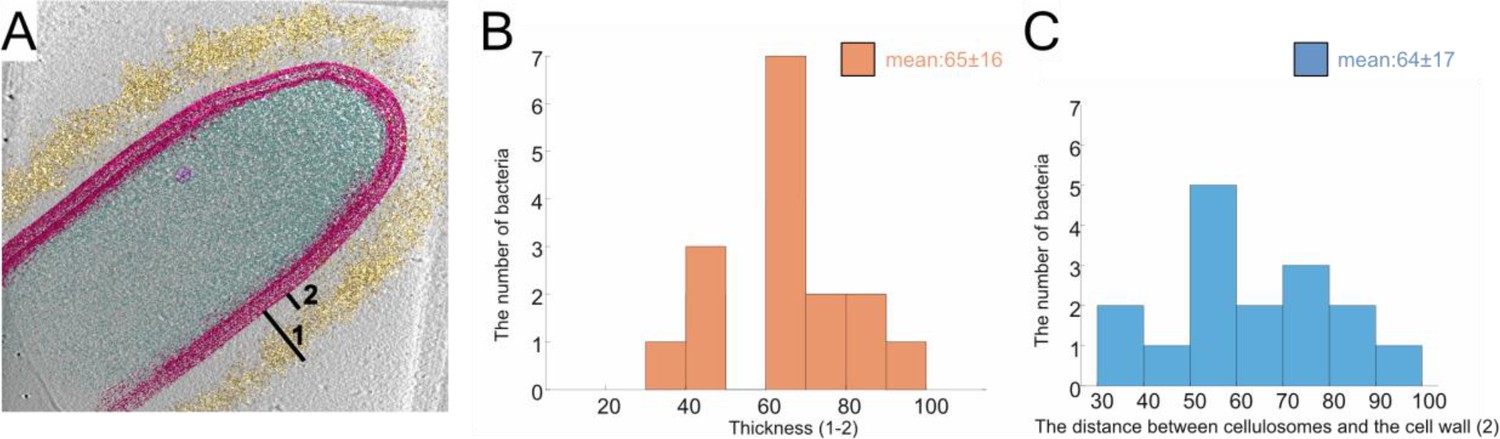
Position and thickness of the cellulosome layer.
The thickness of the high-density cellulosome layer (A: 1–2) and the distance between the S-layer and cellulosomes (B: 2) were measured around the bacteria (B, C), respectively, see Materials and methods. Analysis of 16 tomograms was used for the histograms (B, C).
Figure 2—figure supplement 4
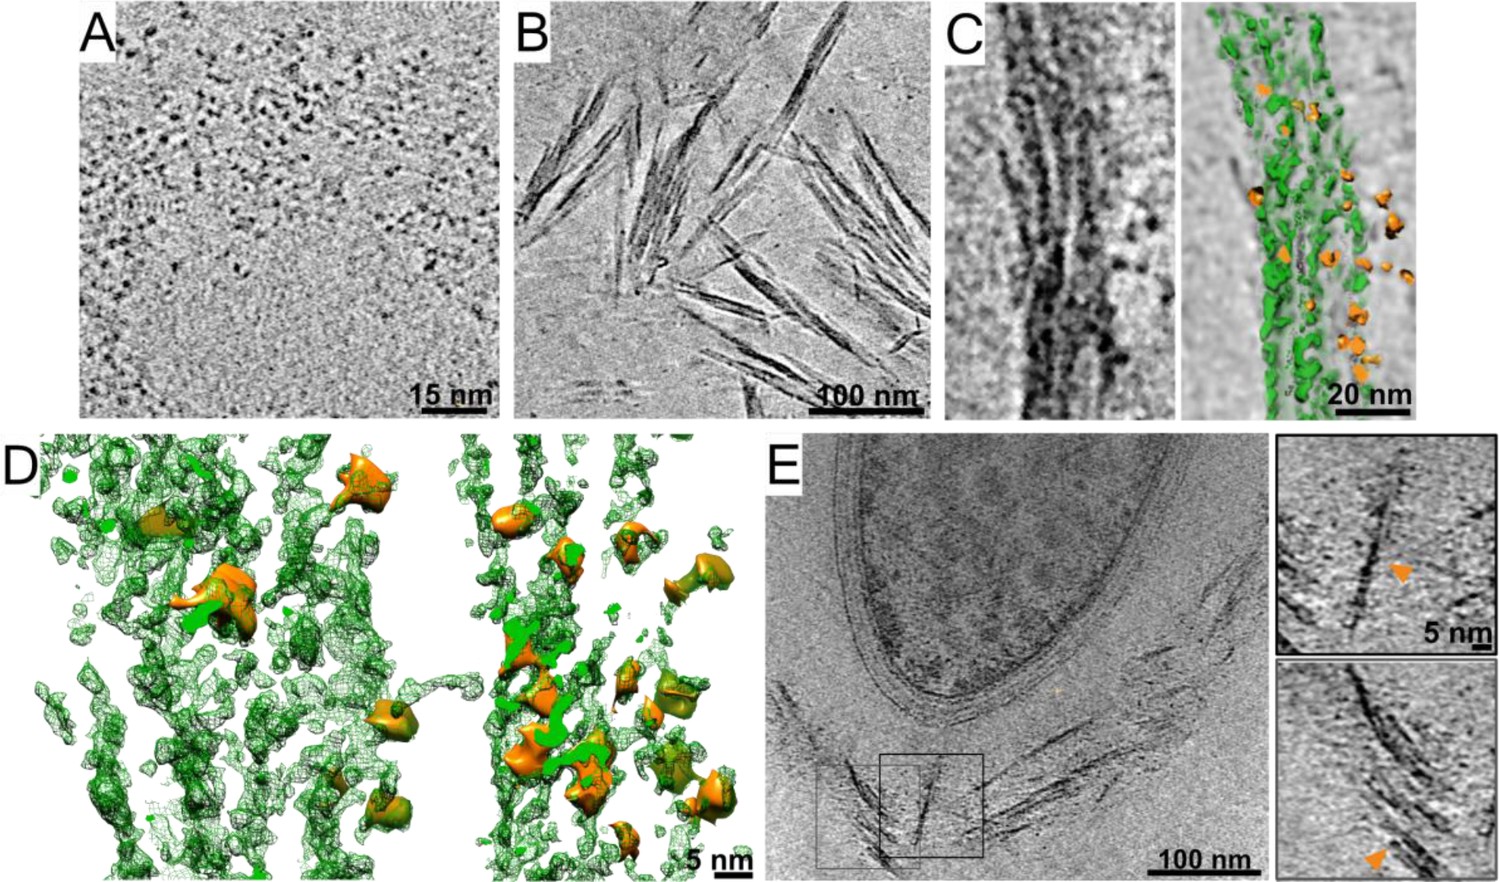
Representative cryo-ET projection slices of microcrystalline cellulose (MCC)–cellulosome interactions.
(A) A closeup projection of the in situ cellulosome layer of a tomogram depicts globular enzymes. (B) Due to the crystalline nature of MCC, straight cellulose fibrils in solution were running parallel to each other. (C) Purified recombinant cellulosome complexes, similar to the globular enzymatic densities in situ (A), interact with crystalline cellulose. A colored rendering depicts enzymes in orange and MCC in green. Enzymes appear in the outer surface of MCC as well as in between fibers. (D) Closeup rendered views are shown of interactions between MCC (green) and Cel48S in complex with the divalent truncated scaffoldin (orange). (E) A projection slice of a bacterium grown for 15 hr provides a view of the MCC–cellulosome interaction in situ. Orange arrows point to globular cellulosomal enzymes sitting on a crystalline array which is remarkably similar to MCC with Cel48S in complex with the truncated scaffoldin in vitro (C).
Figure 3 with 2 supplements
Dynamic isogenic phenotypic heterogeneity of cellulosome organization.
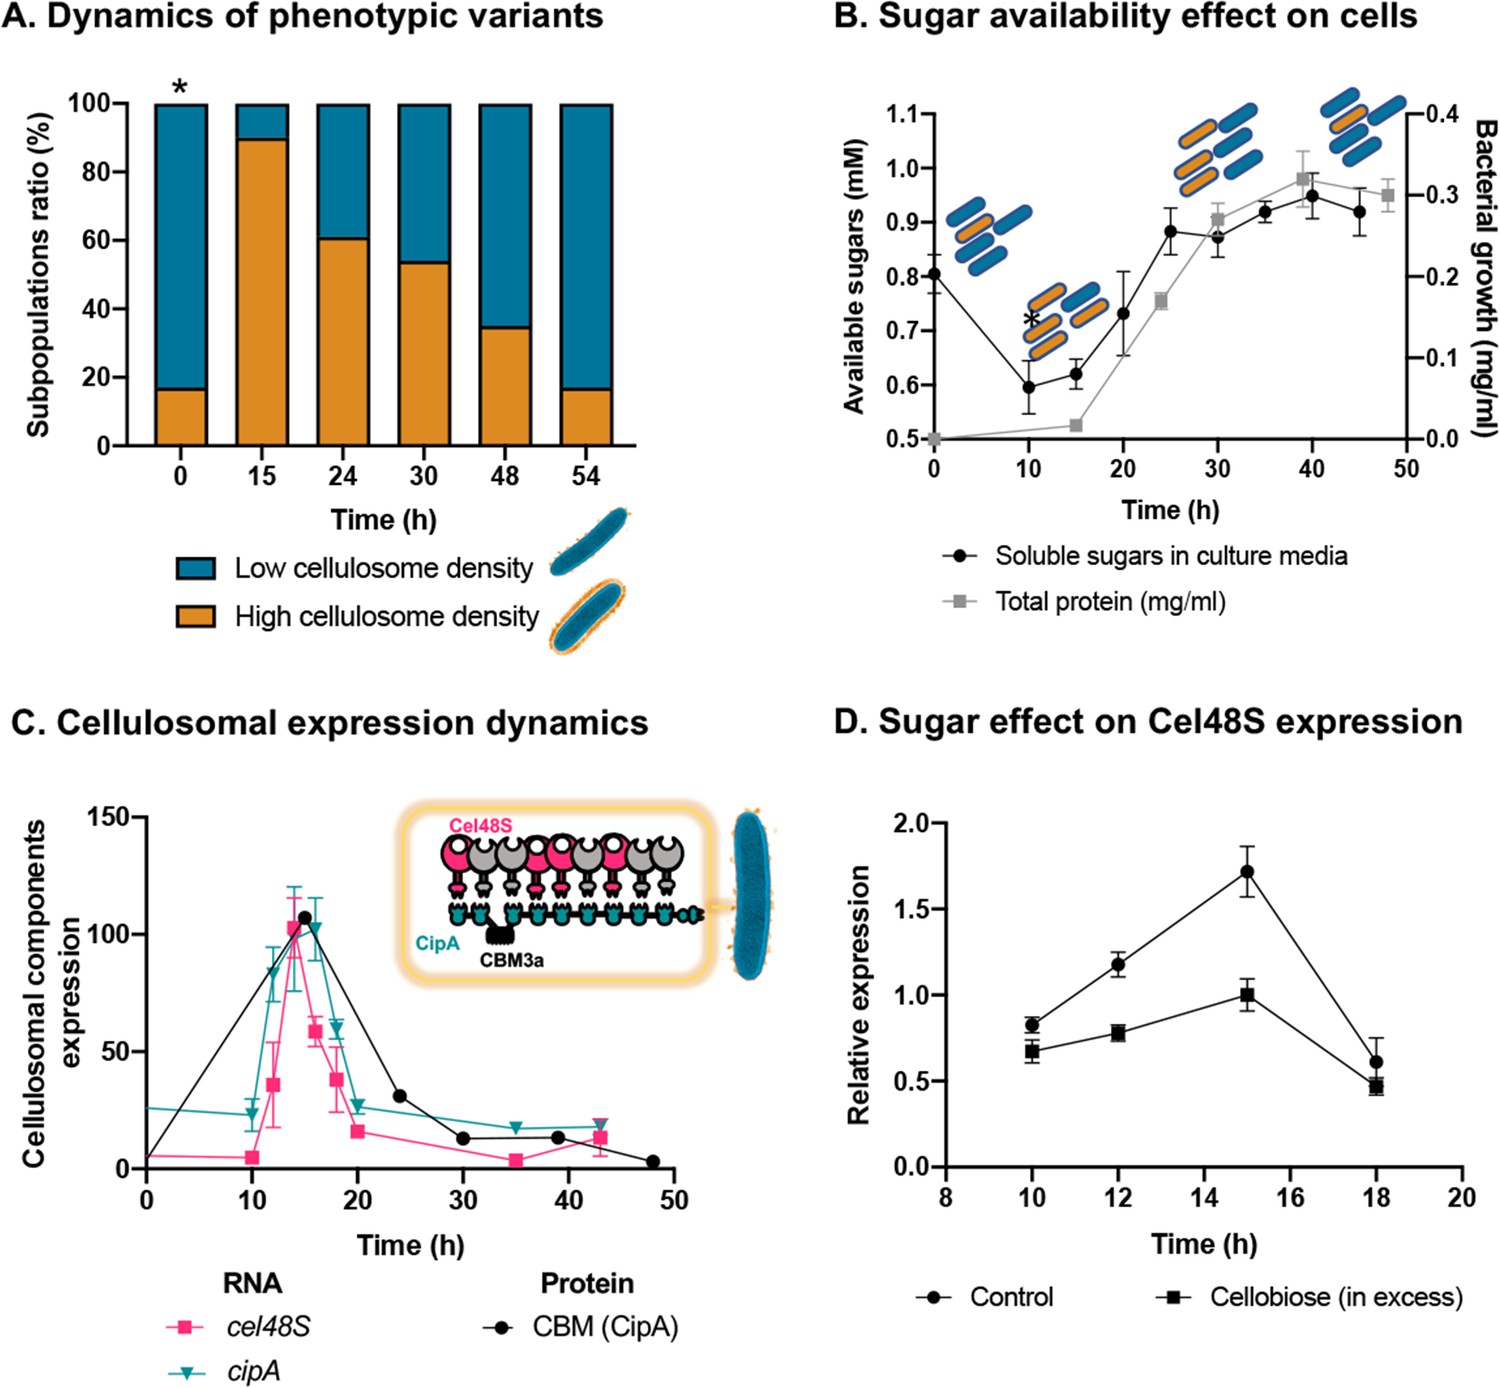
(A) Dynamics of phenotypic variants in C. thermocellum subpopulations. A proportion of 5:1 (low density:high density) is observed during lag and stationary phases, while the high-density subpopulation is transiently dominant at 15 hr, gradually decreasing in time to the initial proportion. Time 0 hr was not measured, as it corresponds to the proportion of cells from the inoculum of time 54 hr. (B) Available reducing sugars detected in C. thermocellum cultures grown on cellulose over time (black line, in mg/ml for total protein). A decrease in soluble sugars (10–15 hr) is followed by a rise in their concentration, which is maintained stable until 50 hr. Blue and orange rod-like shapes represent the low- and high-density subpopulations, respectively, and provide a schematic view of the relative changes in their distribution across the different growth phases and the levels of available sugars. (C) Expression dynamics of cellulosomal components at the level of transcript (RNA) and protein expression (units represent normalized copies/cells divided by 20,000 or band intensity, respectively). Per-cell RNA transcript copy number of cel48S (pink line) and cipA genes (blue line) from a culture of C. thermocellum growing on microcrystalline cellulose. At the protein level, CBM expression per cell was evaluated by using anti-CBM3a antibodies detecting the CBM present in the CipA scaffoldin. Cellulosomal gene expression is observed as a single peak after 15 hr of growth of C. thermocellum in a medium containing microcrystalline cellulose. The schematic representation of the C. thermocellum cellulosome, highlighting the major components tracked in this study, is given as an inset. (D) Cellulosomal gene expression is controlled by sugar availability. Addition of high concentration of cellobiose (10 g/l) into a 10-hr culture of C. thermocellum negatively affects the expression of the main cellulosomal enzyme Cel48S (squares), compared to control (circles) as reported previously (Morag et al., 1991). In (B–D), error bars represent the standard deviation between three biological replicates.
Figure 3—figure supplement 1
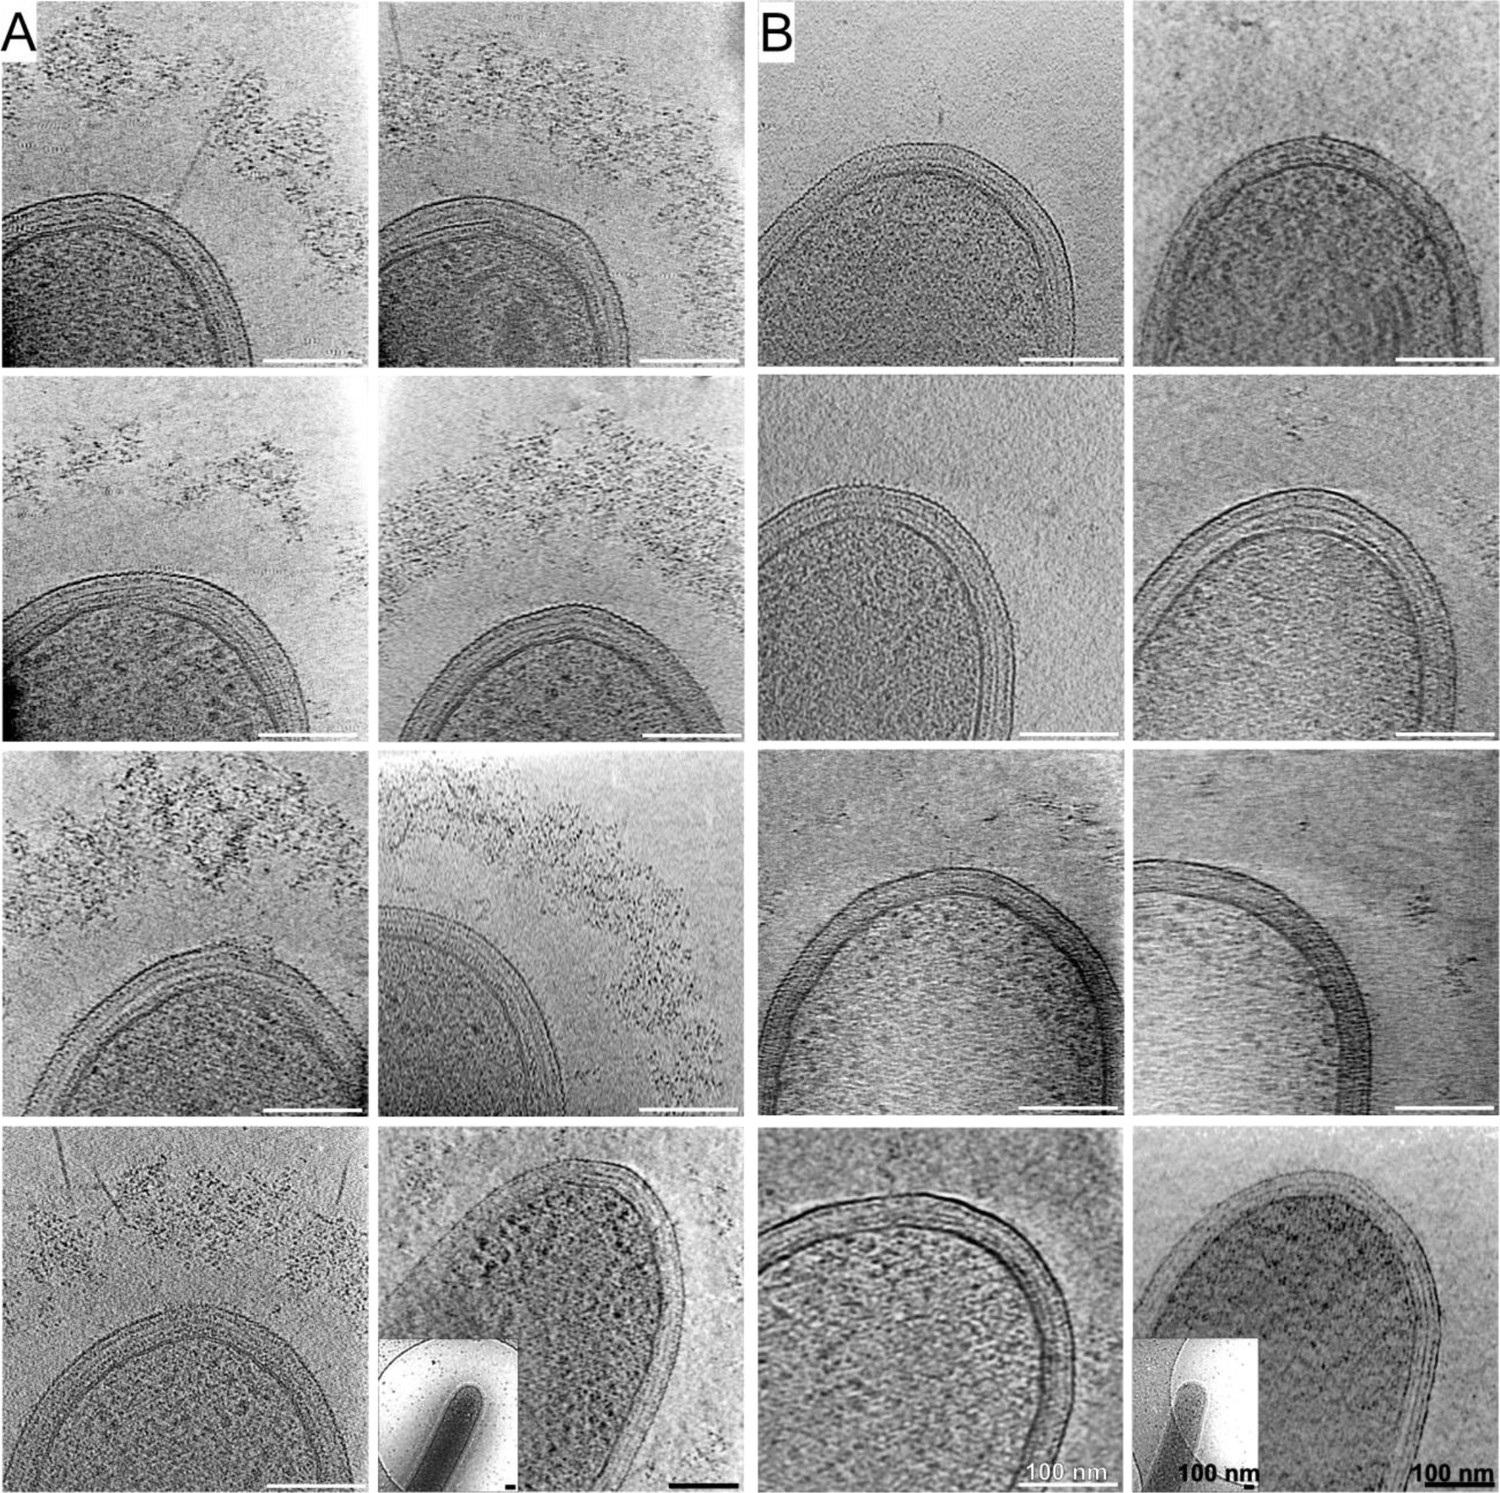
High- and low-density cellulosomes.
Examples of projections of high-density (A) and low-density (B) cellulosome layers around bacteria. The lack of densities is dramatically clear in the low-density phenotype (A) in comparison to the abundance seen in (B). The last images of each set demonstrate corresponding low-magnification views in the bottom-left corner.
Figure 3—figure supplement 2
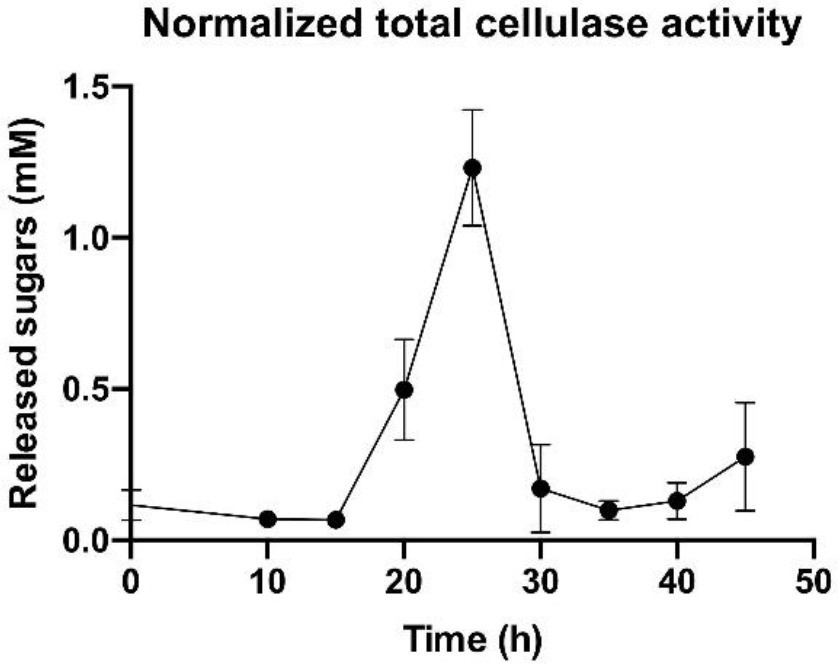
Overall enzymatic activity of the cellulosomal machinery during population growth.
A sharp increase in the total cellulase activity normalized by cell number is observed at the early stages of bacterial growth and is followed by a marked decrease at the end of the exponential phase. Error bars represent the standard deviation between three biological replicates.
Figure 4
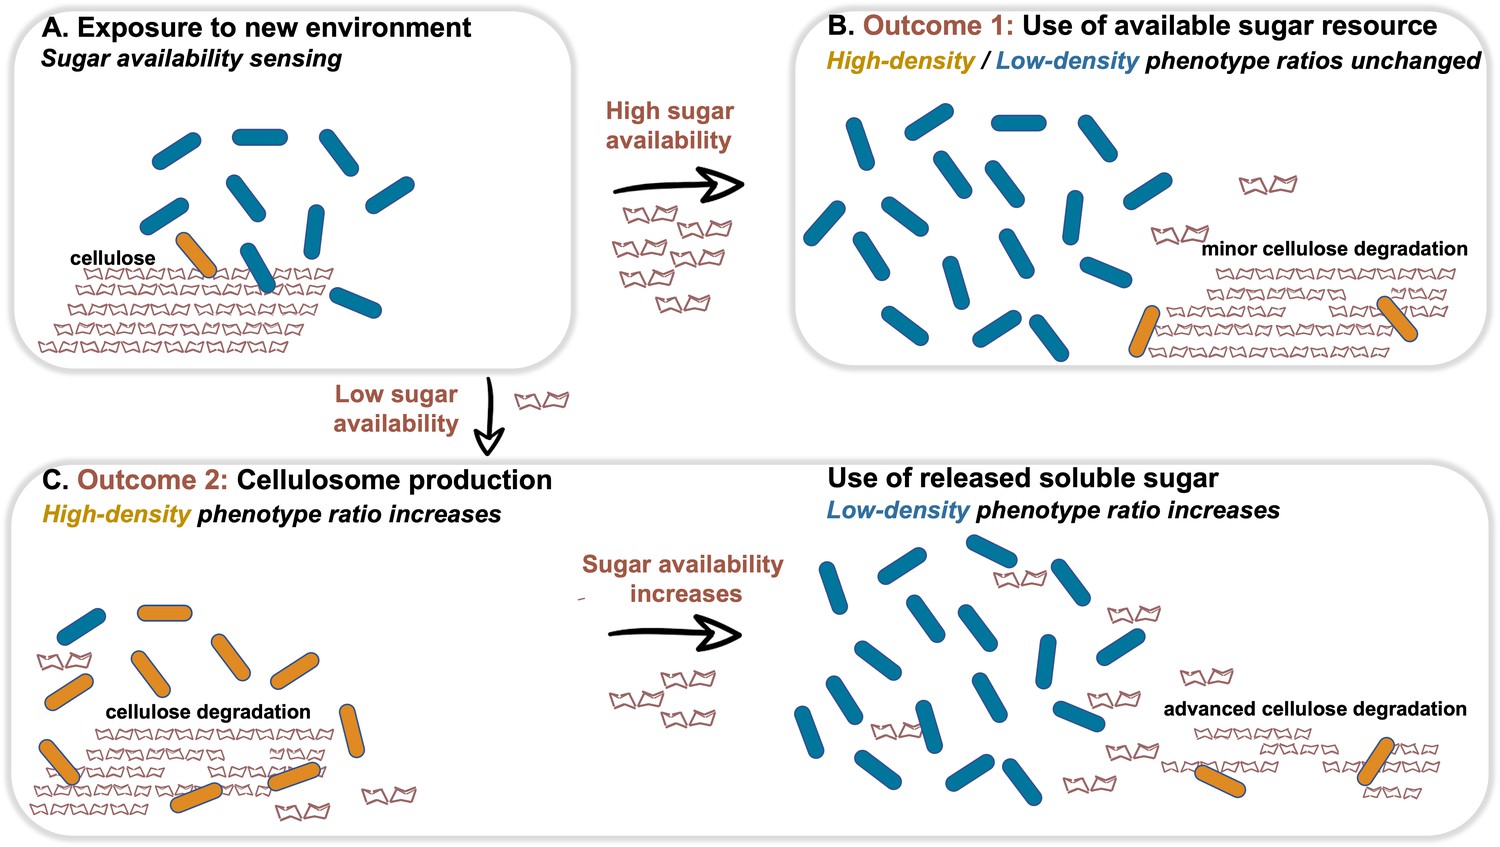
Dynamic phenotypic heterogeneity during cellulose degradation in the C. thermocellum population.
The figure represents a schematic model of the findings revealed in our study. Blue and orange rod-like shapes represent the low- and high-density subpopulations, respectively. When C. thermocellum cells are exposed to a new environment containing cellulose (A), there are two possible outcomes depending on sugar availability. High sugar availability results in a basal level of cellulosome expression with no change in phenotypic heterogeneity of the population (B), where the high-density phenotype serves as a cellulosomal reservoir for future sugar-limiting conditions. In contrast, low sugar availability triggers the expression of the cellulosomal machinery (C), resulting in a major change in phenotypic heterogeneity of the population, where the high-density phenotype ratio increases and provides the present and future populations with high levels of sugar production from the cellulose substrate. This in turn increases the available sugar concentrations, arresting cellulosome expression and production resulting in an increase in the ratio of the low-density phenotype without the production of the high-cost enzymatic machinery, whereby the high-density phenotype returns to low ratios in the population (bet-hedging strategy). The secreted cell-free cellulosomes and their interaction with the cellulose substrate are not represented in the figure.
Videos
Video 1
The position of CBM3a revealed by immunogold labeling.
The positions of CBM3a were identified by labeling with 6-nm gold clusters (red arrowheads). The protein was localized within the cellulosome layer.
Video 2
A bacterium with high-density-cellulosome phenotype.
Cryo-ET reveals the organization of the cellulosome structures.
Video 3
The cellulosome layer accommodates crystalline cellulose.
Globular enzymatic densities (orange) of the cellulosome layer were observed attached to the crystalline cellulose (green).
Video 4
A bacterium with low-density-cellulosome phenotype.
Additional files
Download links
A two-part list of links to download the article, or parts of the article, in various formats.
Downloads (link to download the article as PDF)
Open citations (links to open the citations from this article in various online reference manager services)
Cite this article (links to download the citations from this article in formats compatible with various reference manager tools)
Nanoscale resolution of microbial fiber degradation in action
eLife 11:e76523.
https://doi.org/10.7554/eLife.76523


