Concerted modification of nucleotides at functional centers of the ribosome revealed by single-molecule RNA modification profiling
- Department of Biomolecular Engineering and Santa Cruz Genomics Institute, University of California, Santa Cruz, United States
- RNA Center and Department of Molecular, Cell & Developmental Biology, University of California, Santa Cruz, United States
- Department of Pharmacy Practice & Science, College of Pharmacy, University of Arizona, United States
- Colegio Santa Francisca Romana, Colombia
- Monta Vista High School, United States
Figures
Figure 1 with 5 supplements
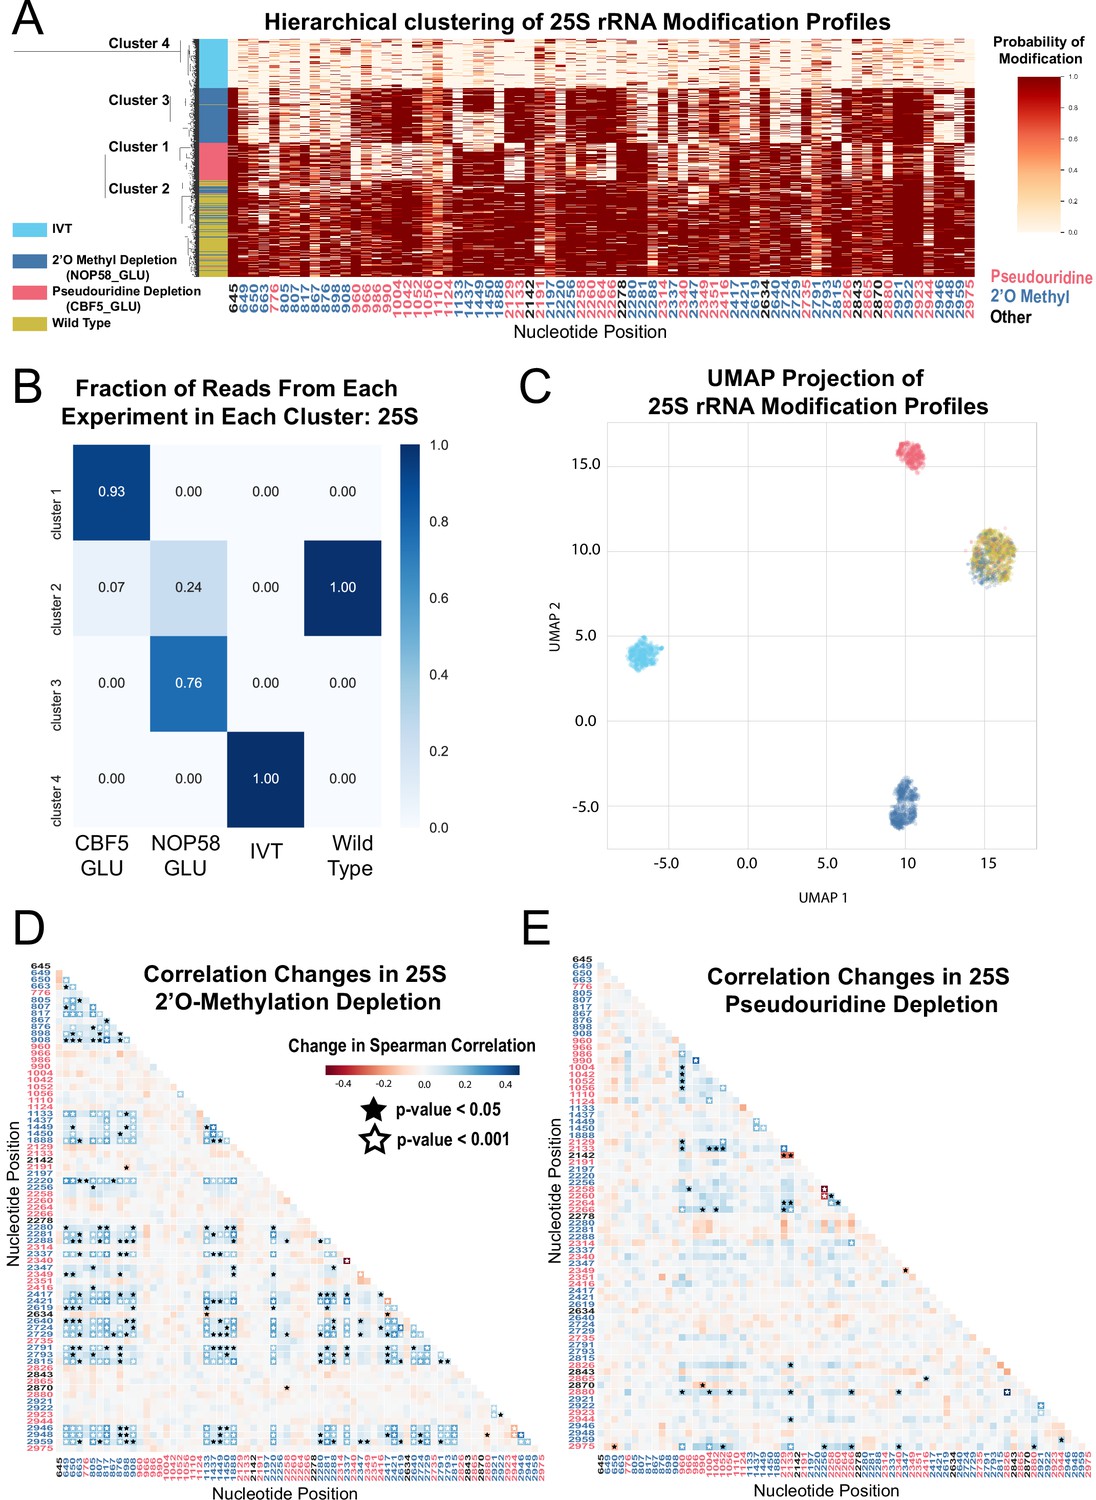
Clustering and correlation analysis of depletion experiment modification profiles in 25 S.
(A) Hierarchical clustering of 25 S yeast rRNA modification profiles of IVT, wild type, and both pseudouridine and 2´O methyl depletion experiments (1,000 reads/experiment). Each row is a full-length molecule, each column is a modified nucleotide and the color represents modification probability, see scale. (B) Fraction of reads from IVT, wild type and both depletion experiments in each cluster of 25 S rRNA. (C) UMAP visualization of 25 S yeast rRNA modification profiles of IVT, wild type, and both pseudouridine and 2´O methyl depletion experiments. UMAP color scheme is the same as the labels in panel A. (D,E) Change in Spearman correlations of 25 S reads in 2´O methyl depletion (D) and pseudouridine depletion (E) when compared to wild type. Stars represent significant changes when compared to wild-type correlation (see Materials and methods). Nucleotide positions are blue for 2´O-methyl, red for pseudouridine, and black for other (neither 2´O-methyl nor pseudouridine).
Figure 1—figure supplement 1
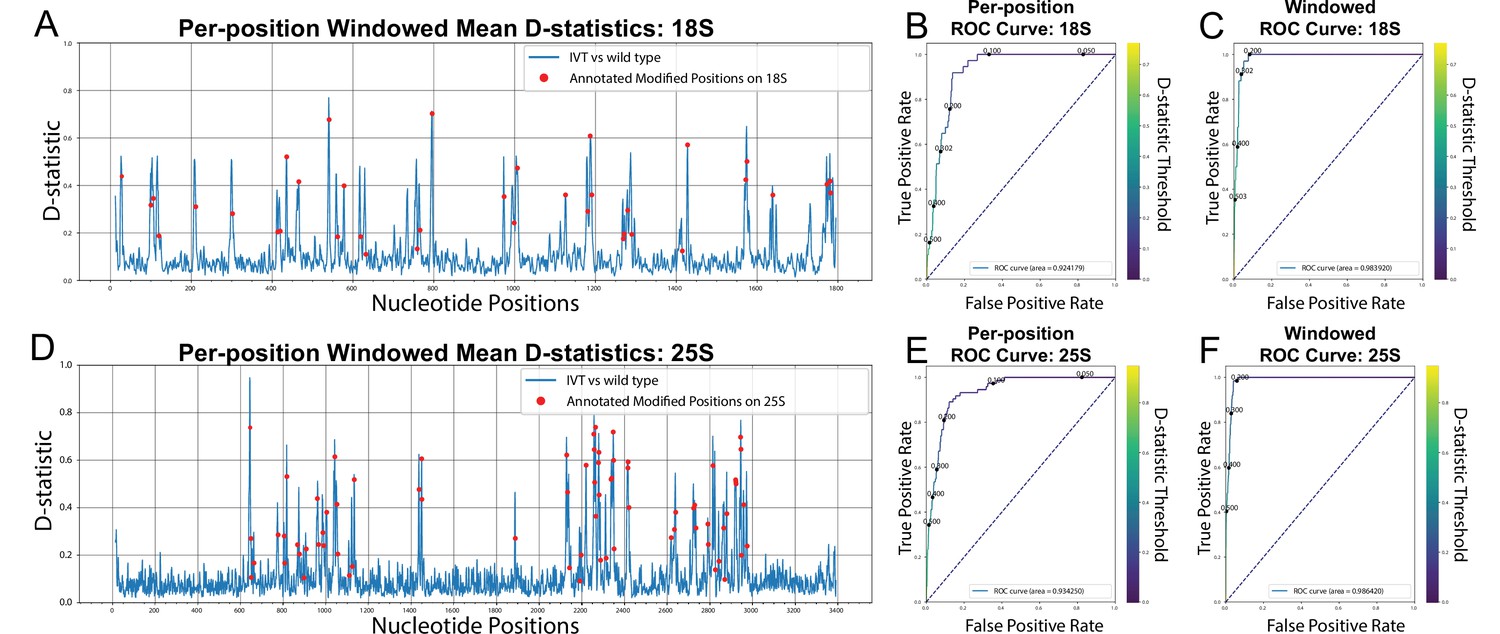
De-novo detection of modifications using Tombo.
(A,D) Per position, window averaged D-statistic plots from Tombo’s sample compare method for yeast 18 S (A) and 25 S (D) rRNA (Stoiber et al., 2016). The blue line represents the difference between the per-position distributions of the IVT sample vs the wild-type sample. The red markers are the location of each annotated modification on the corresponding rRNA (Taoka et al., 2016). (B,E) Per-position modification calling AUROC (Area Under the Receiver Operating Characteristic) curves for Tombo’s sample compare method comparing the IVT sample vs a wild-type sample for yeast 18 S (B) and 25 S (E) rRNA. (C,F) Modification window calling AUROC curves for Tombo’s sample compare method comparing the IVT sample vs the wild type sample for yeast 18 S (C) and 25 S (F) rRNA (see Materials and methods).
Figure 1—figure supplement 2
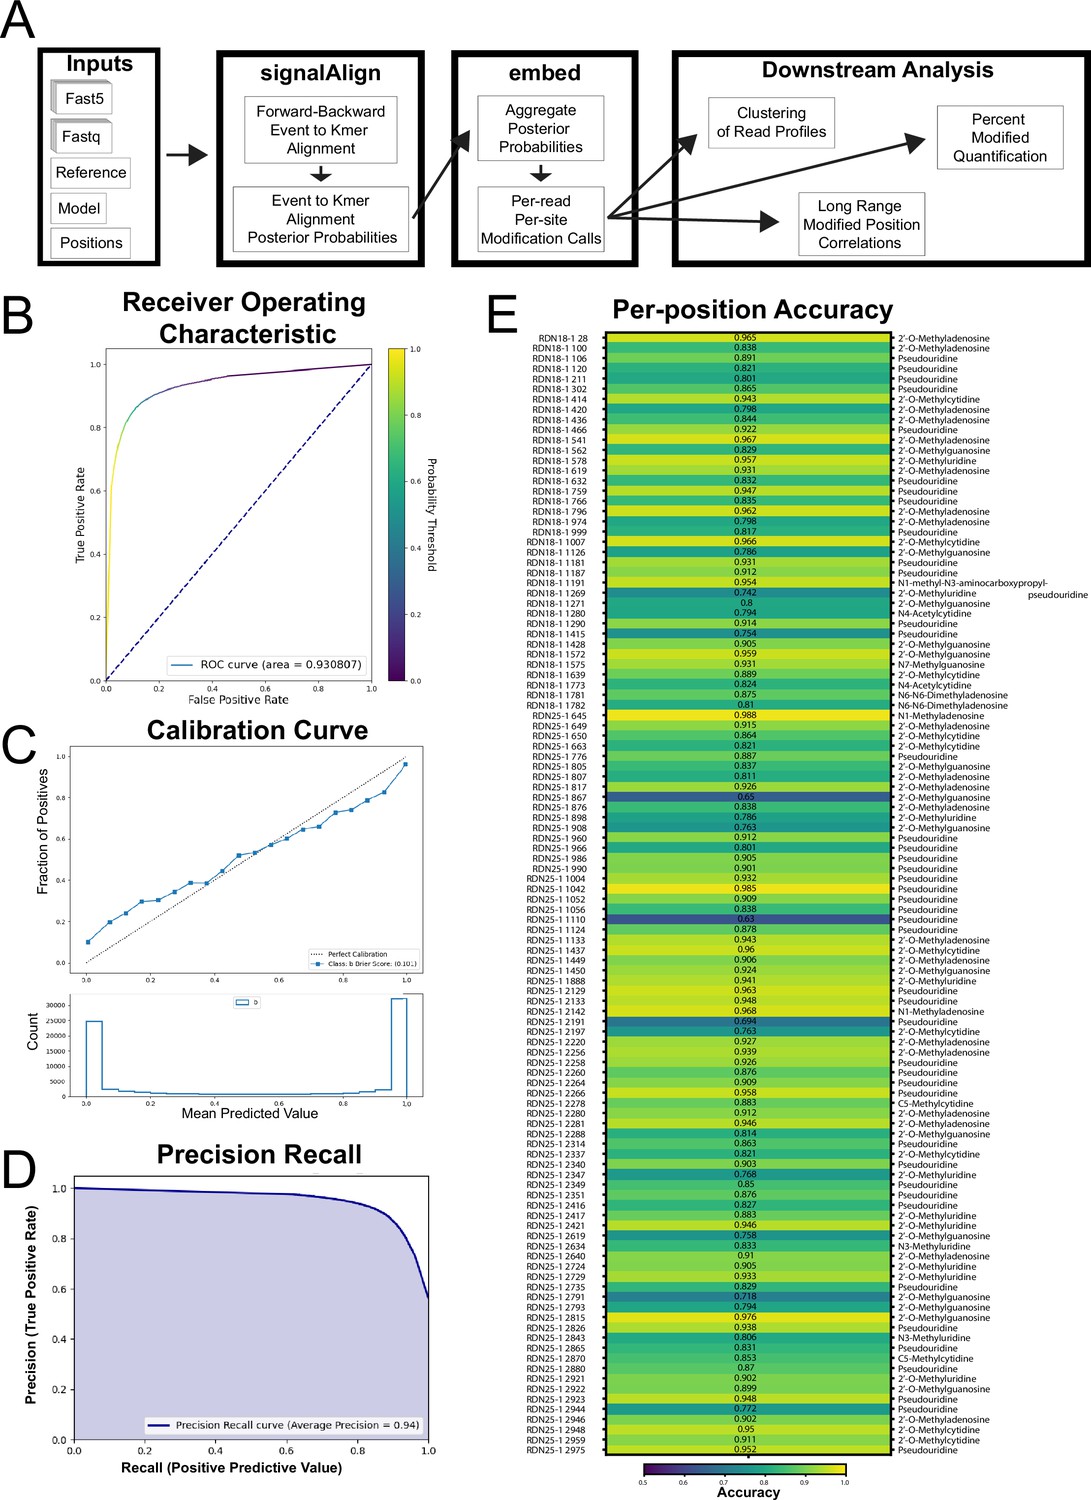
SignalAlign pipeline overview, overall accuracy metrics from testing data and per-position model accuracy.
(A) Analysis pipeline. (B–E) Testing accuracy metrics of the final model of supervised training. Both training protocol and testing metrics are described in detail in Materials and methods. (B) Receiver operating characteristic (ROC) curve and area under the ROC (0.93). (C) Calibration curve showing the fraction of true positives for several ranges of probabilities. The brier score (0.101) is a metric for determining how well a model is calibrated. (D) Precision-recall curve. (E) Per-position accuracy with corresponding modification annotation for each position (Taoka et al., 2016).
Figure 1—figure supplement 3

Clustering and correlation analysis of depletion experiment modification profiles in 18 S rRNA.
(A) Hierarchical clustering of 18 S yeast rRNA modification profiles of IVT, wild type, and both pseudouridine and 2’O methyl depletion experiments. (B) Fraction reads from IVT, wild type and both depletion experiments (CBF5_GAL, NOP58_GAL) in each cluster of 18 S rRNA. (C) UMAP visualization of 18 S yeast rRNA modification profiles of IVT, wild type, and both pseudouridine and 2’O methyl depletion experiments. UMAP color scheme is the same as the labels in panel A. (D) Bioanalyzer of comparing levels of 18 S and 25 S rRNA in galactose-grown samples (CBF5_GAL, NOP58_GAL) compared to glucose-grown samples (CBF5_GLU, NOP58_GLU). (E/F) Change in Spearman correlations of 25 S reads in 2’O methyl depletion (E) and pseudouridine depletion (F) when compared to wild type. Stars represent significant changes when compared to wild-type correlation and significantly different from zero correlation (see Materials and methods).
Figure 1—figure supplement 4
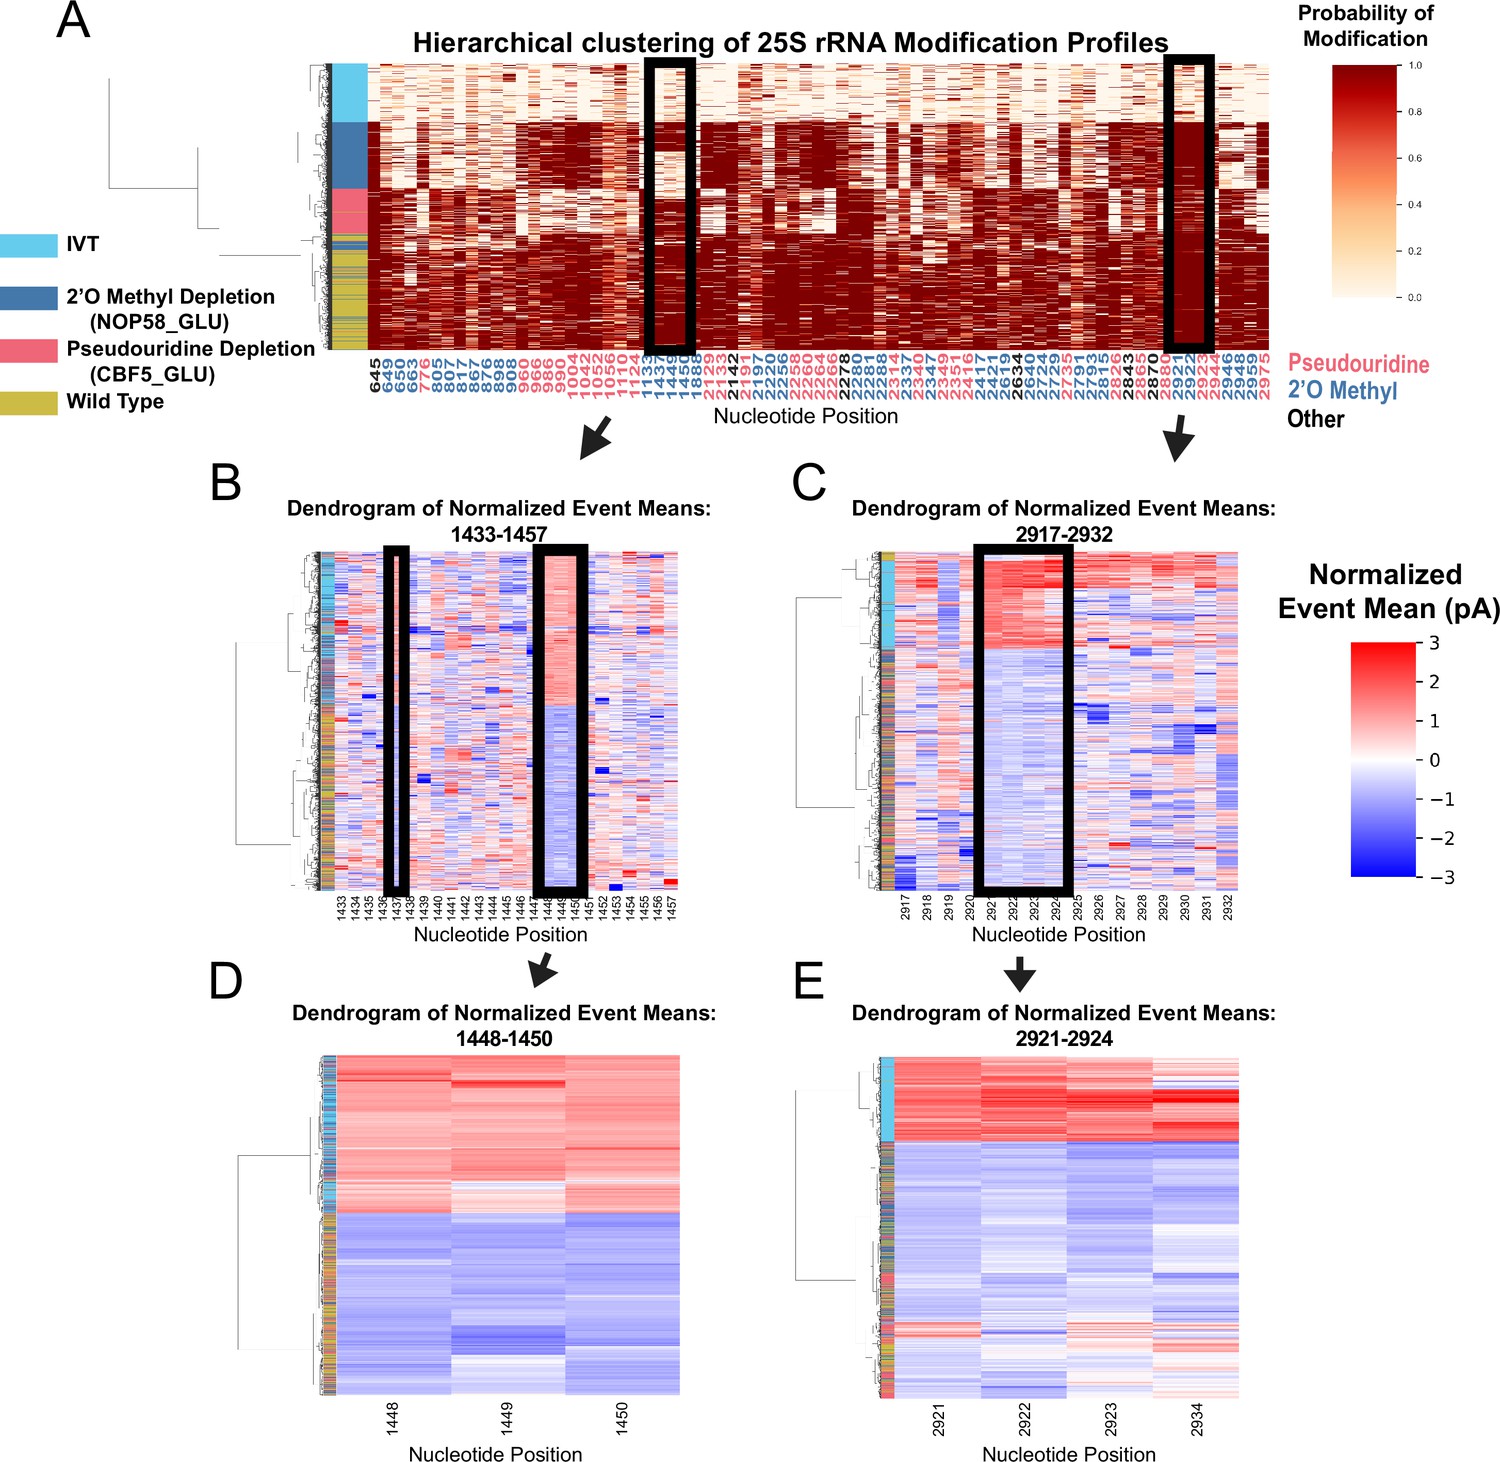
Clustering of underlying events to search for patterns of modification in the pseudouridine and 2’O methyl depletion experiments.
(A) Hierarchical clustering of 25 S yeast rRNA modification profiles of IVT, wild type, and both pseudouridine and 2’O methyl depletion experiments (1,000 reads in each experiment). Each row represents a full-length single read, each column represents a modified nucleotide and the scale represents the probability of being modified. (B–E) Hierarchical clustering of normalized event means aligned to the reference sequence from IVT, wild type, and both pseudouridine and 2’O methyl depletion experiments covering positions 1433–1457 (B), 2917–2932 (C), 1448–1450 (D), and 2921–2924 (E) (see Materials and methods and Supplementary Note 1).
Figure 1—figure supplement 5
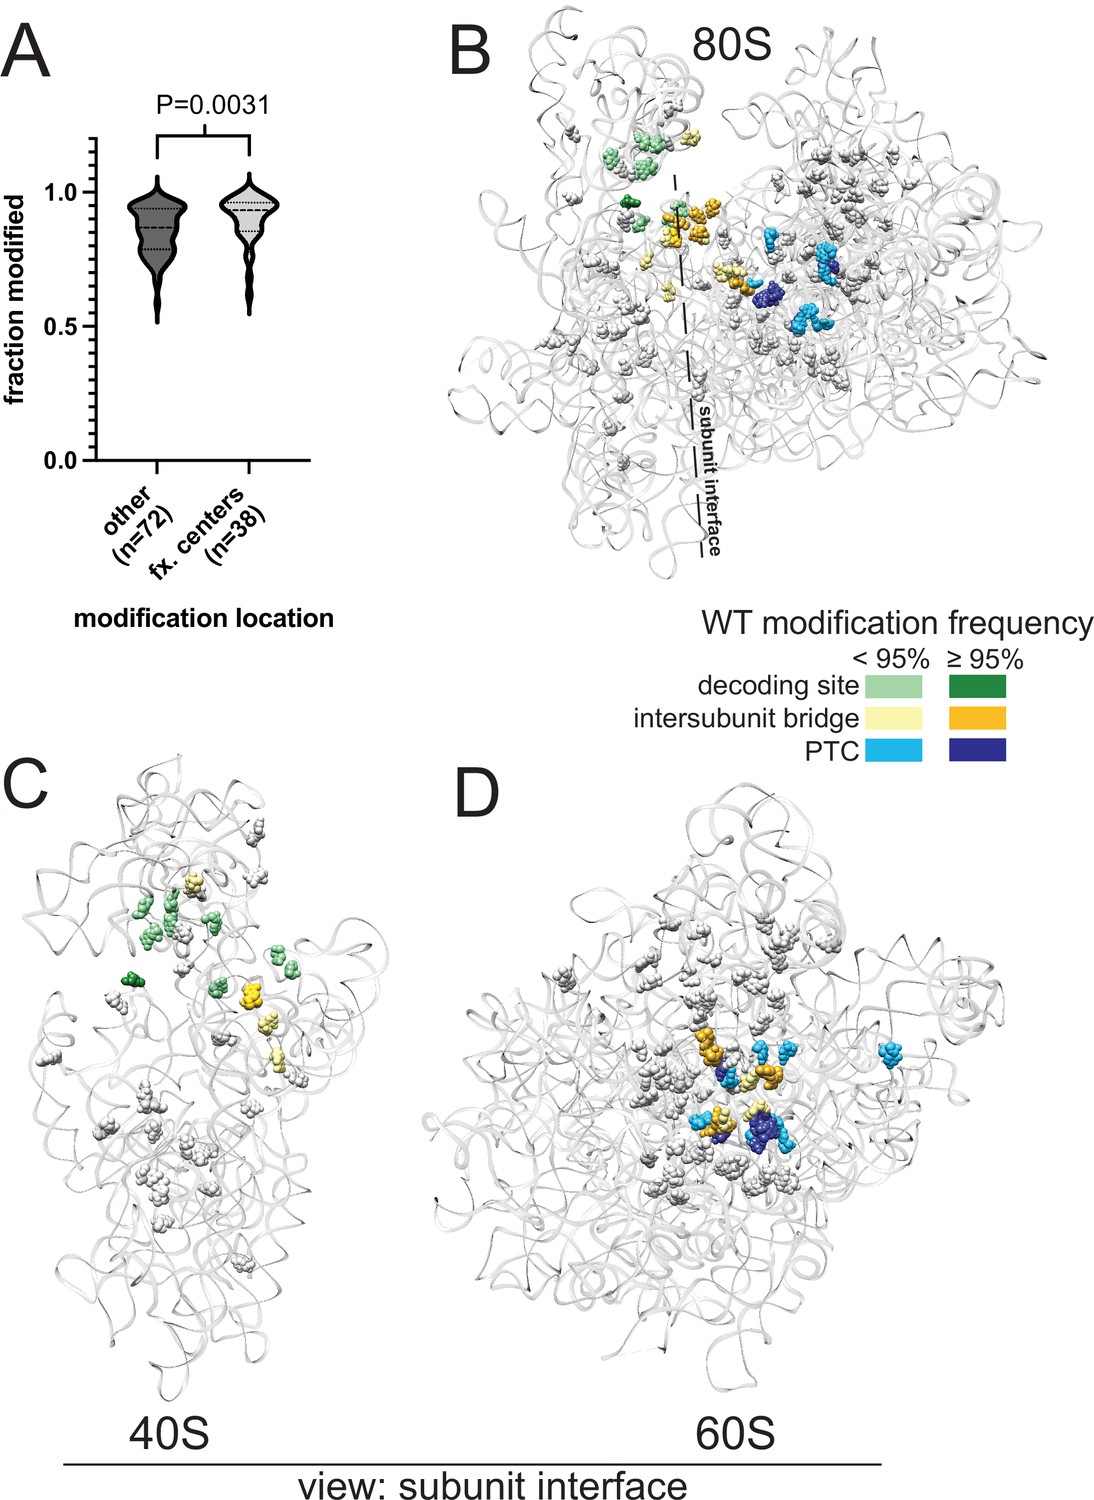
Analysis of yeast rRNA modification frequency in relation to functional centers of the ribosome.
(A) Distribution of fraction modified for positions within or not within the functional centers of yeast rRNA. Distribution means are significantly (p-value = 0.0031) different via a two-sided Mann-Whitney U-test. (B–D) Crystal structure model of wild type S. cerevisiae 80 S (B), 40 S (C) and 60 S (D) rRNA highlighting modification frequency within functional centers. PDB: 4V88 (Ben-Shem et al., 2011).
Figure 2 with 5 supplements
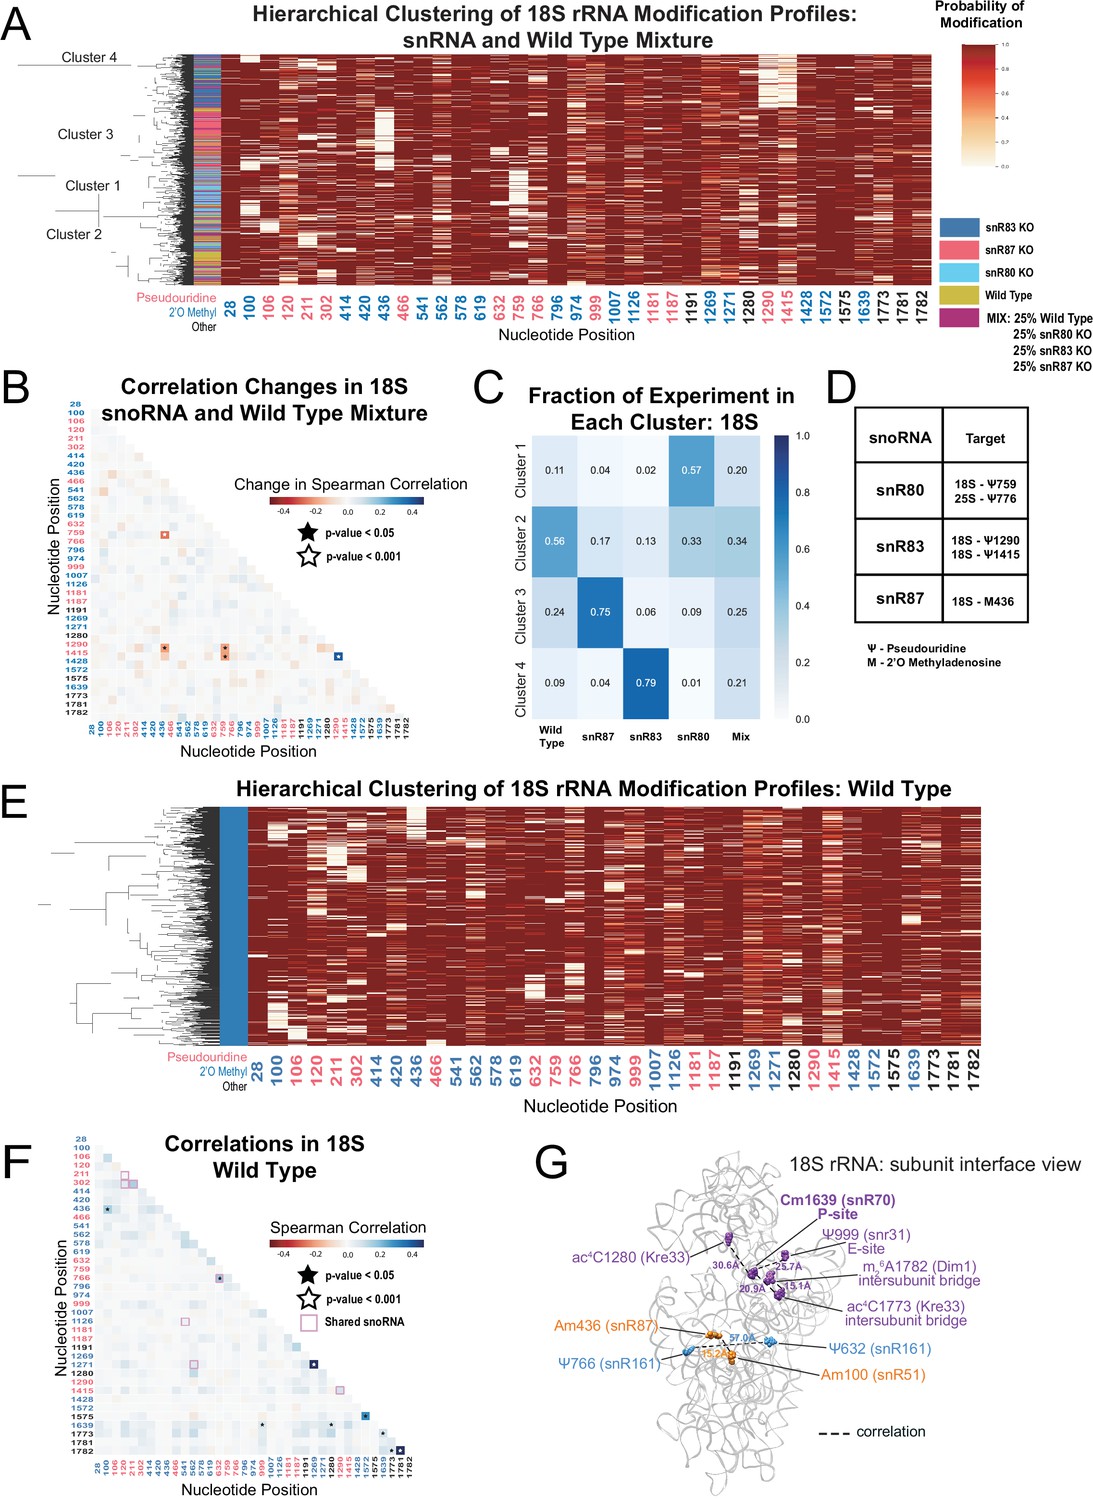
Clustering of 18 S rRNA modification profiles and correlation analysis from the mixture experiment and wild type rRNA.
(A) Hierarchical clustering of 18 S modification of profiles from pooled wild type, snR80ᐃ, snR83ᐃ, and snR87ᐃ RNA (500 reads in each experiment). Each row is a full-length molecule, each column is a modified nucleotide and the color represents modification probability, see scale. (B) Change in Spearman correlations of 18 S reads in the mixture experiment when compared to wild type. Stars represent significant changes when compared to wild-type correlation and significantly different from zero correlation (see Materials and methods). (C) Fraction of wild type, snR80ᐃ, snR83ᐃ, and snR87ᐃ profiles in each cluster of 18 S rRNA. (D) Table of snoRNAs knocked down with the corresponding expected knocked down modifications. (E) Hierarchical clustering of 18 S yeast rRNA modification profiles from wild-type yeast (1000 reads). (F) Wild-type Spearman correlation of 18 S wild-type reads. Stars represent significantly different to IVT correlations and significantly different from zero. correlation. (G) Crystal structure model of wild-type S. cerevisiae 18 S rRNA highlighting significant correlated positions. PDB: 4V88 (Ben-Shem et al., 2011).
Figure 2—figure supplement 1
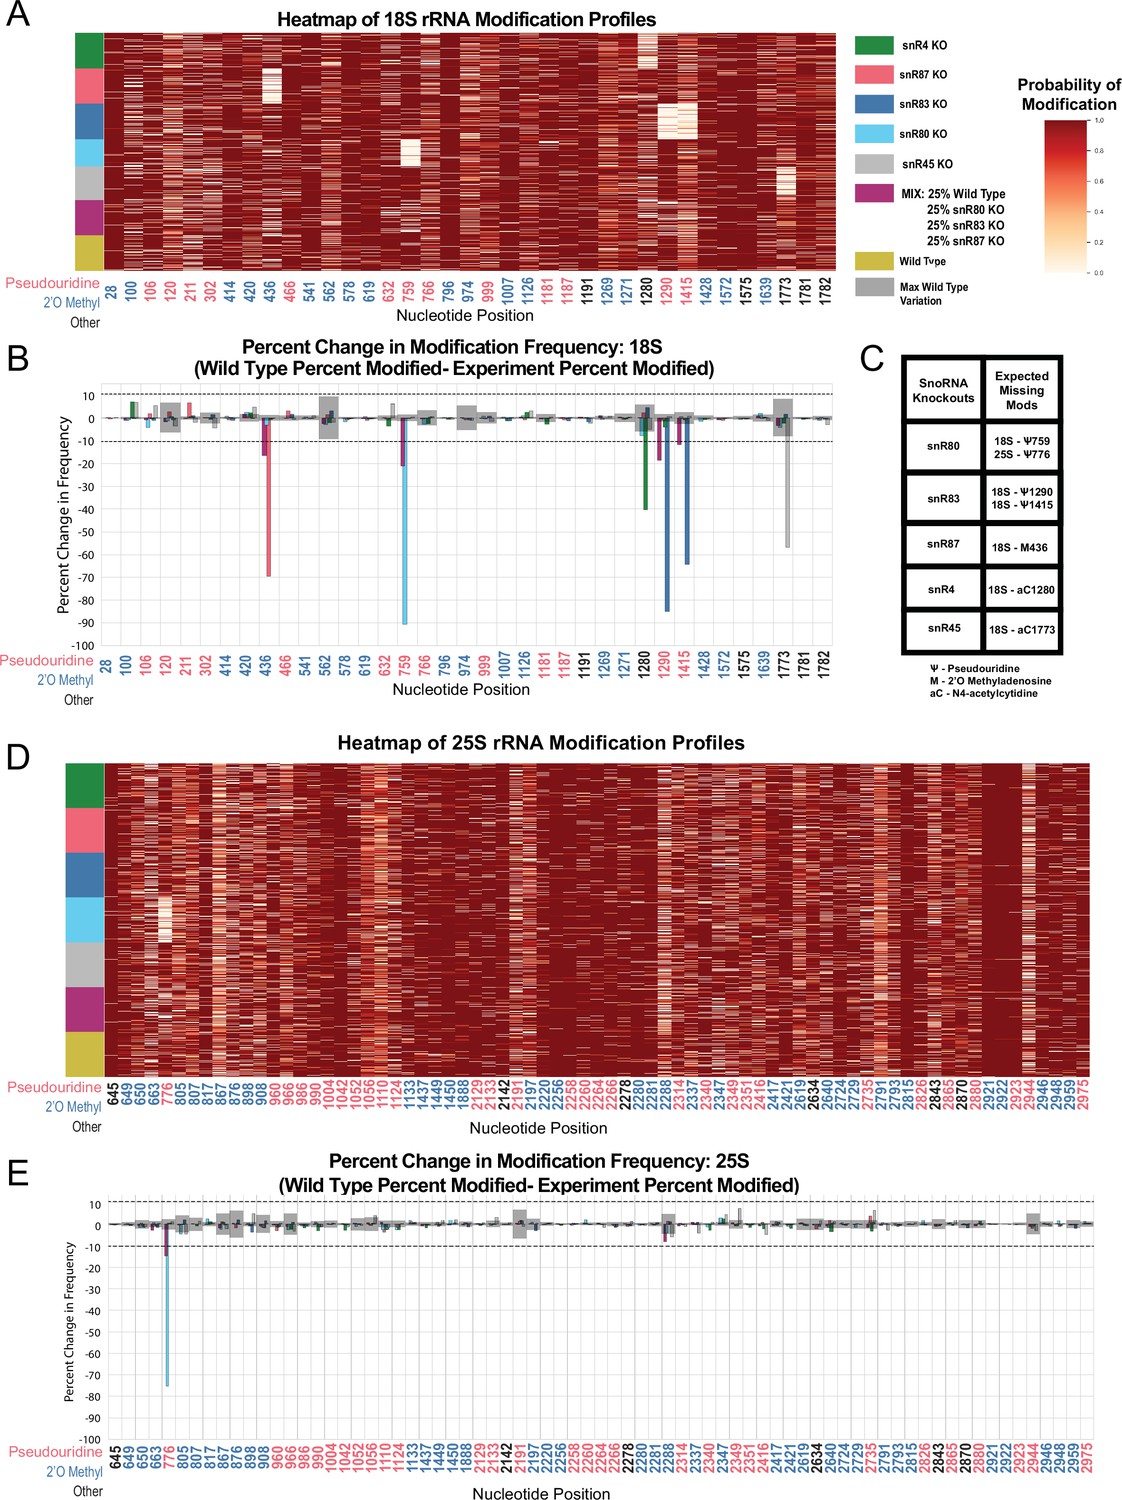
Heatmaps and percent modification change of snoRNA knockout and mixture experiments.
(A) Heatmap of wild type, mixed sample, snR80ᐃ, snR83ᐃ, and snR87ᐃ, snR45ᐃ and snR4ᐃ modification profiles of 18 S (1,000 reads in each experiment). Each row represents a full length single read, each column represents a modified nucleotide and the scale represents the probability of being modified. (B) Mixed sample, snR80ᐃ, snR83ᐃ, and snR87ᐃ, snR45ᐃ and snR4ᐃ 18 S percent change in modification frequency when compared to wild type. Gray bars indicate the variance of wild type rRNA modification at each position and the black dotted lines represent the maximum variance found at any position. (C) Table of snoRNAs knocked down with the corresponding expected knocked down modifications. (D) Heatmap of wild type, mixed sample, snR80ᐃ, snR83ᐃ, and snR87ᐃ, snR45ᐃ and snR4ᐃ modification profiles of 25 S (1000 reads in each experiment). (E) Mixed sample, snR80ᐃ, snR83ᐃ, and snR87ᐃ, snR45ᐃ and snR4ᐃ 25 S percent change in modification frequency when compared to wild type.
Figure 2—figure supplement 2

Kmer distribution comparison between snoRNA knockout kmer distributions and the trained model kmer distributions.
Each figure has the model’s canonical kmer distribution, the model’s modified kmer distribution and the corresponding snoRNA knockout kernel density estimate (KDE) of all events aligned to that position (see Materials and methods). The rows show kmers covering position 759 in 18 S from snR80ᐃ, position 776 in 25 S from snR80ᐃ, position 1290 in 18 S from snR83ᐃ, position 1415 in 18 S from snR83ᐃ, position 436 in 18 S from snR87ᐃ, position 436 in 18 S from snR87ᐃ, position 1773 in 18 S from snR45ᐃ and position 1280 in 18 S from snR4ᐃ.
Figure 2—figure supplement 3
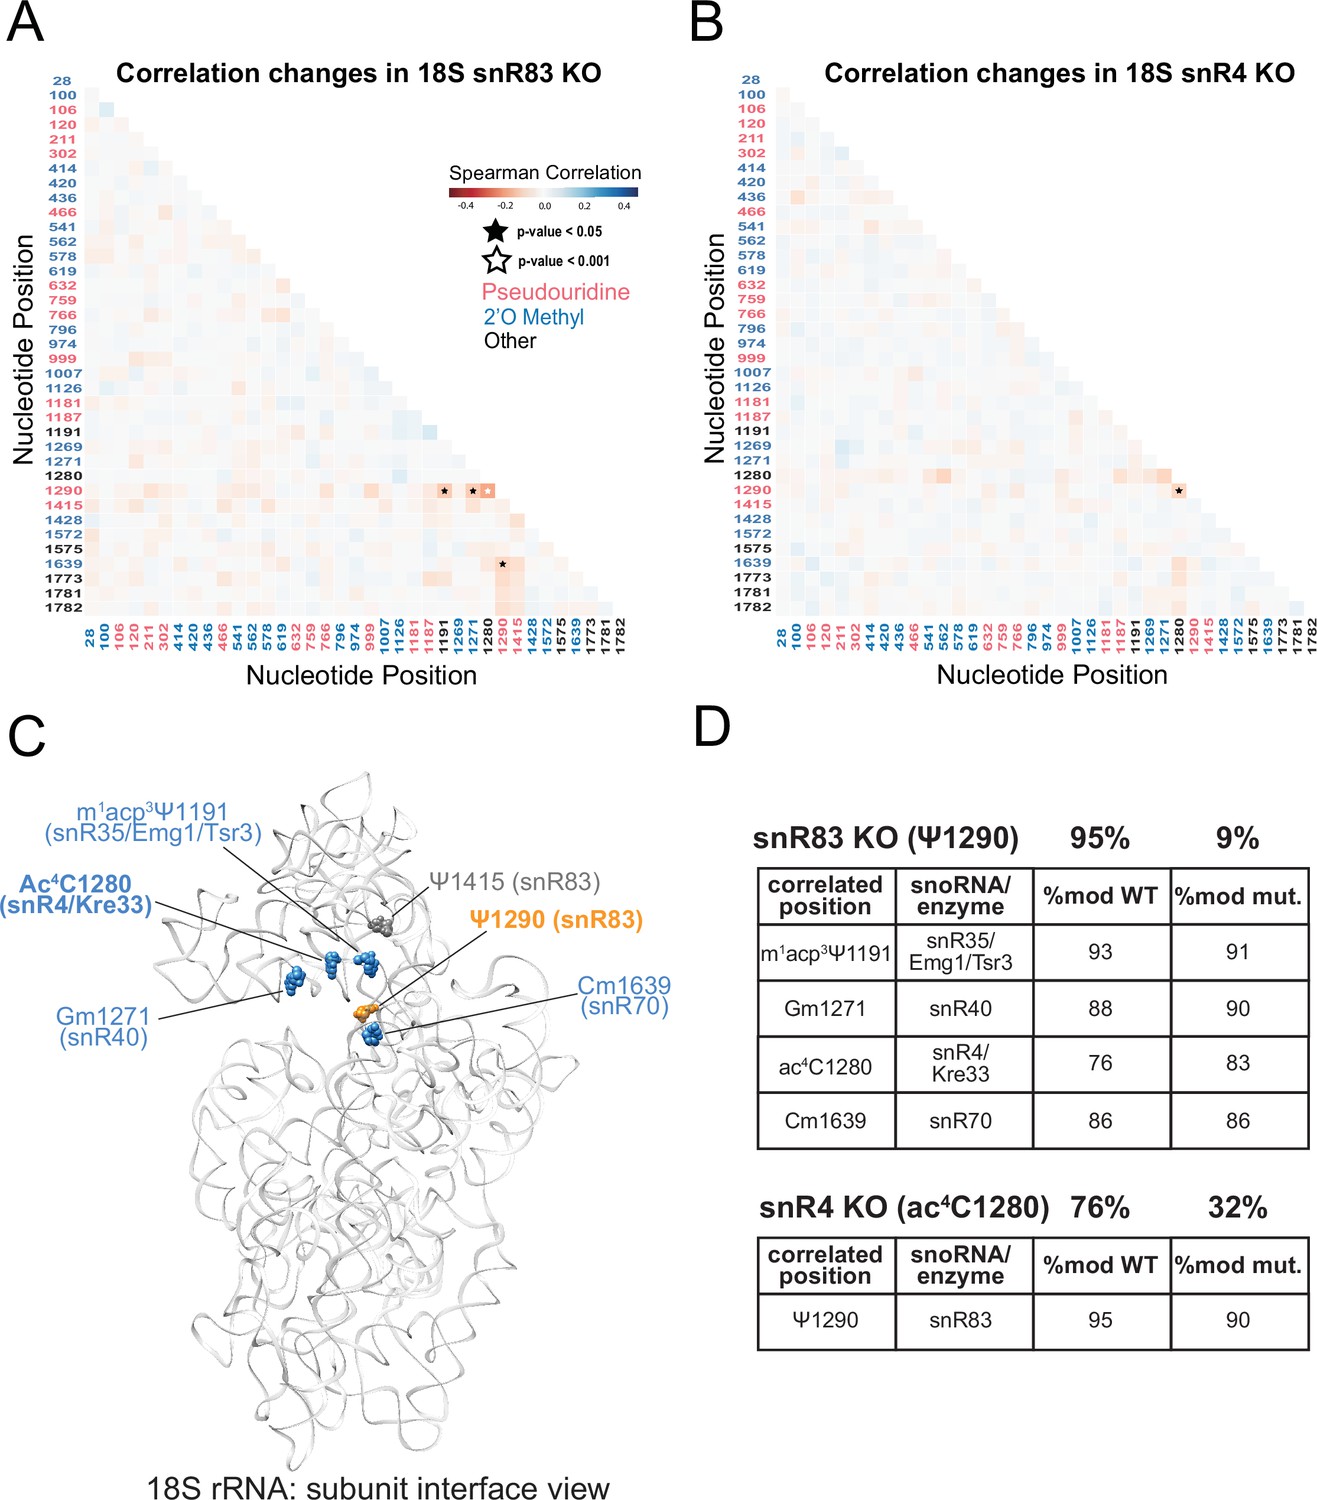
Clustering and correlation analysis of snoRNA KO experiment modification profiles in yeast 18 S rRNA.
(A/B) Change in Spearman correlations of 18 S reads in snR83 KO (A) and snR4 KO (B) when compared to wild type. Stars represent significant changes when compared to wild type correlation and significantly different from zero correlation (see Materials and methods). (C) Cryo-EM structure model of wild type S. cerevisiae 18 S rRNA highlighting significant, concerted positions. PDB: 4V88 (Ben-Shem et al., 2011). (D) Table of percent modification of sites of interest in wild type and snoRNA KO experiments.
Figure 2—figure supplement 4
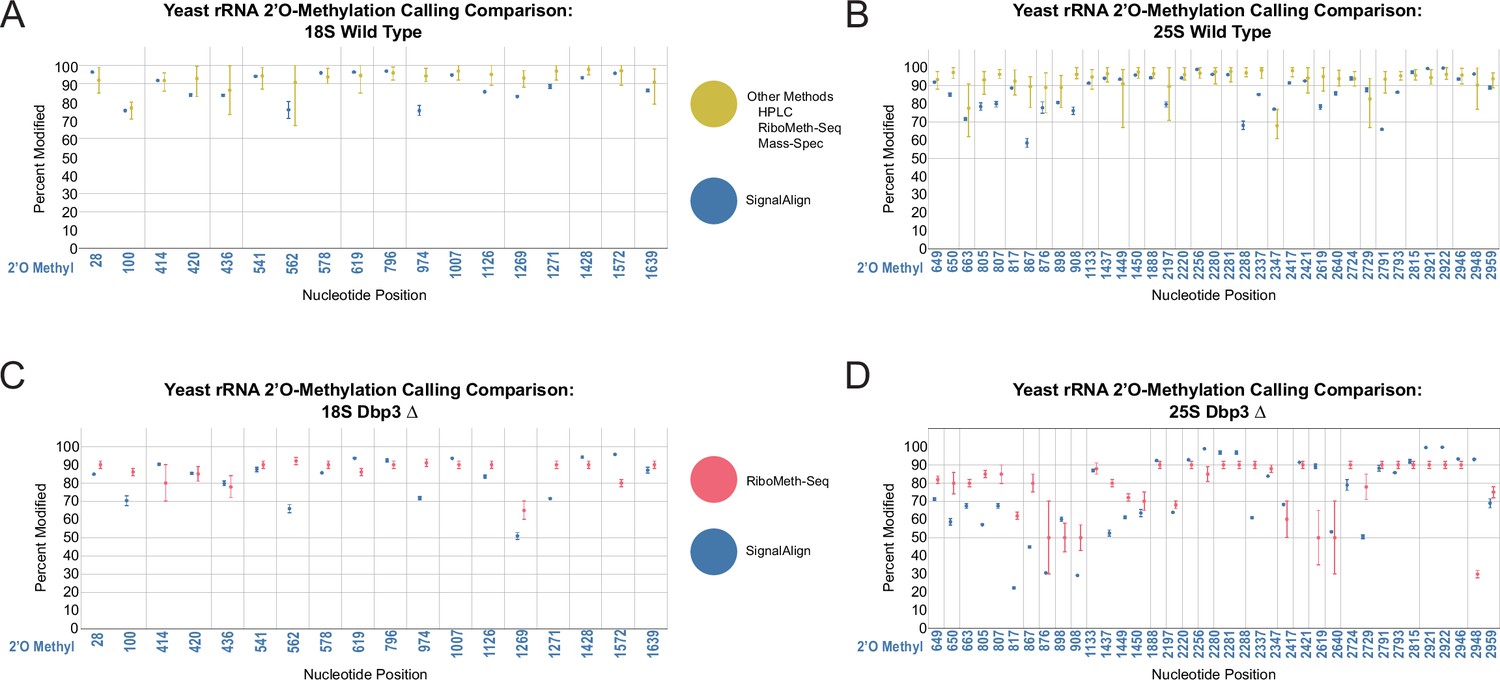
Comparison of rRNA 2’O-methylation calling from other modification detection techniques and signalAlign modification detection.
(A–B) Comparison between the range of modification percentages called via mass spectrometry (Taoka et al., 2016), HPLC (Yang et al., 2016), and two RiboMeth-seq approaches (Birkedal et al., 2015; Marchand et al., 2016) vs signalAlign modification percentages of wild-type yeast in 18 S (A) and 25 S (B). (C–D) Comparison between RiboMeth-seq modification percentages (Aquino et al., 2021) and signalAlign modification percentages for the Dbp3 knockout strain in 18 S (C) and 25 S (D) yeast rRNA. For the combination of several detection approaches, we calculated the minimum, maximum and mean modification percentage from the four papers. For all plots, error bars represent the minimum or maximum percent modification called and circles represent the mean modification percentage.
Figure 2—figure supplement 5
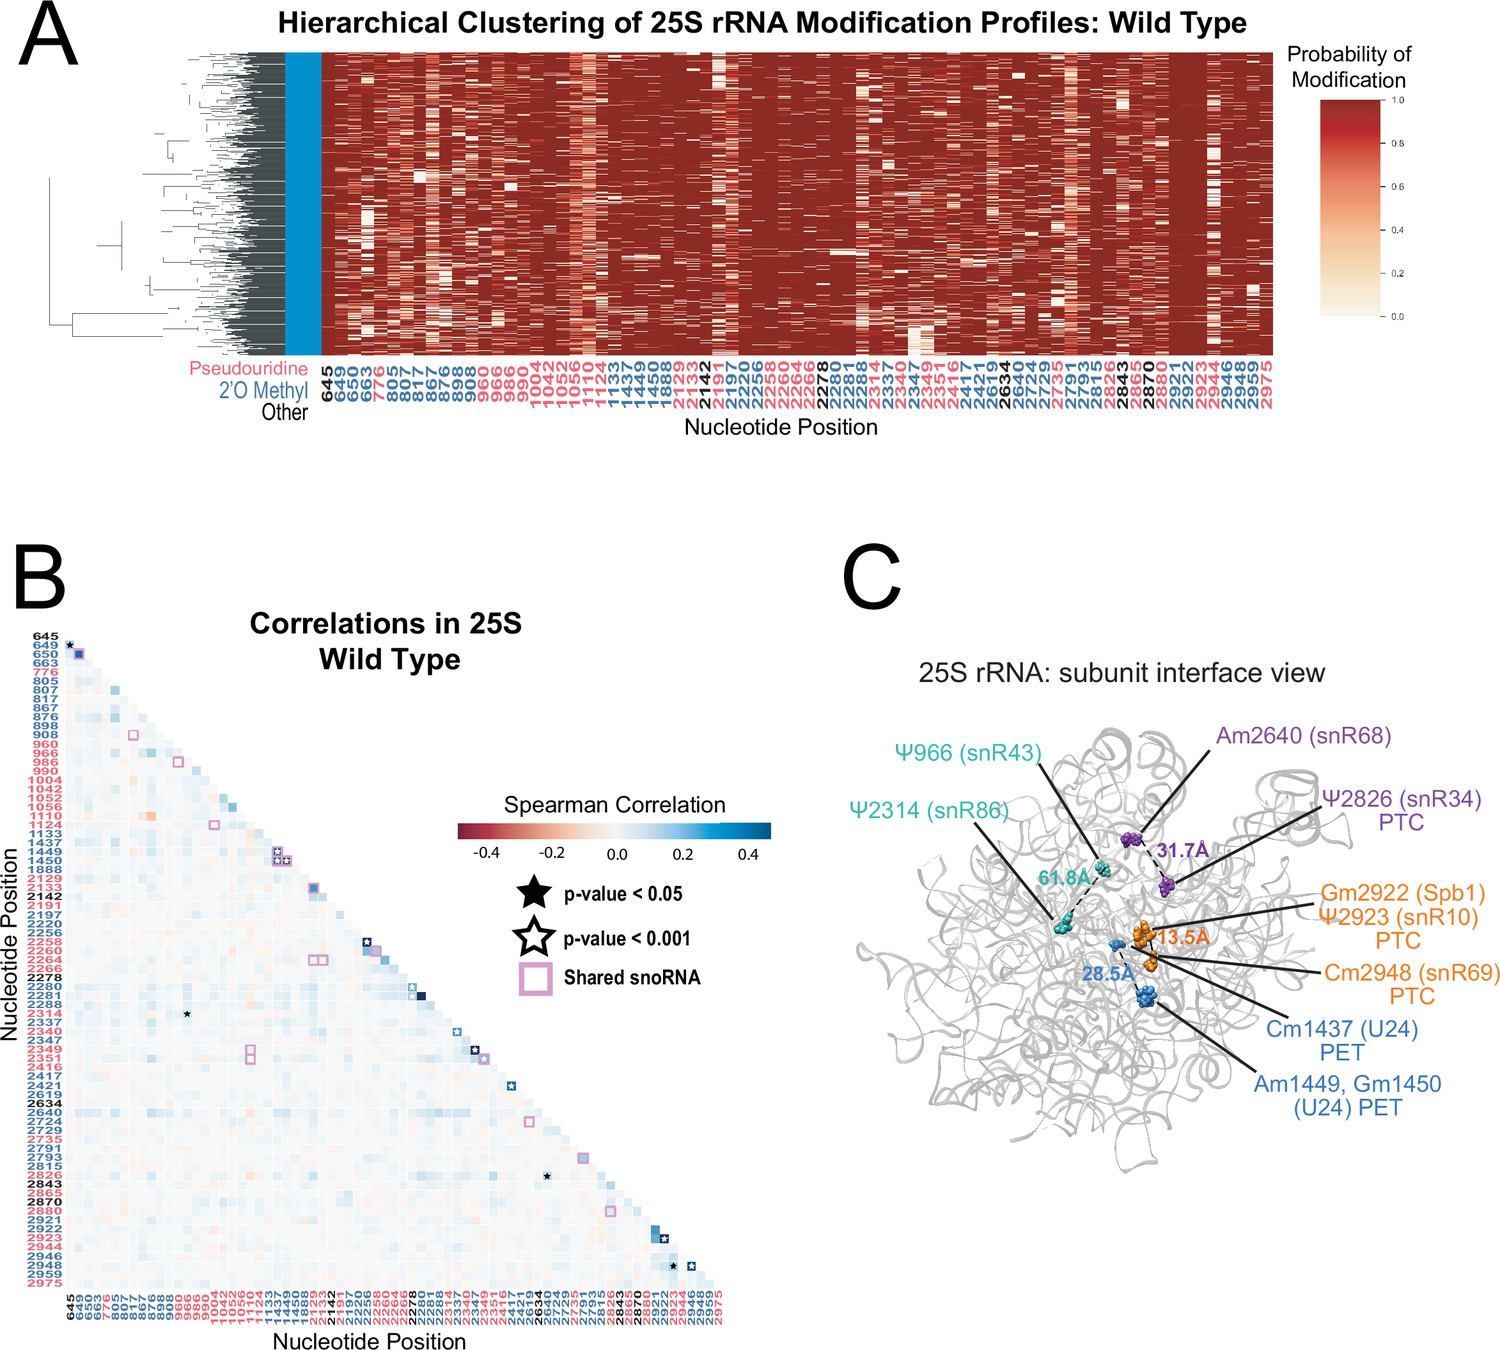
Yeast 25 S rRNA modification profile clustering and correlation analysis.
(A) Hierarchical clustering of 25 S yeast rRNA modification profiles from wild-type yeast (1000 reads). Each row represents a full length single read, each column represents a modified nucleotide and the scale represents the probability of being modified. (B) Wild-type Spearman correlation of 25 S wild-type reads. Stars represent significantly different concerted positions compared to IVT and significantly different from zero correlation. (C) Crystal structure model of wild-type S. cerevisiae 25 S rRNA highlighting significant, concerted positions. PDB: 4V88 (Ben-Shem et al., 2011).
Figure 3 with 4 supplements
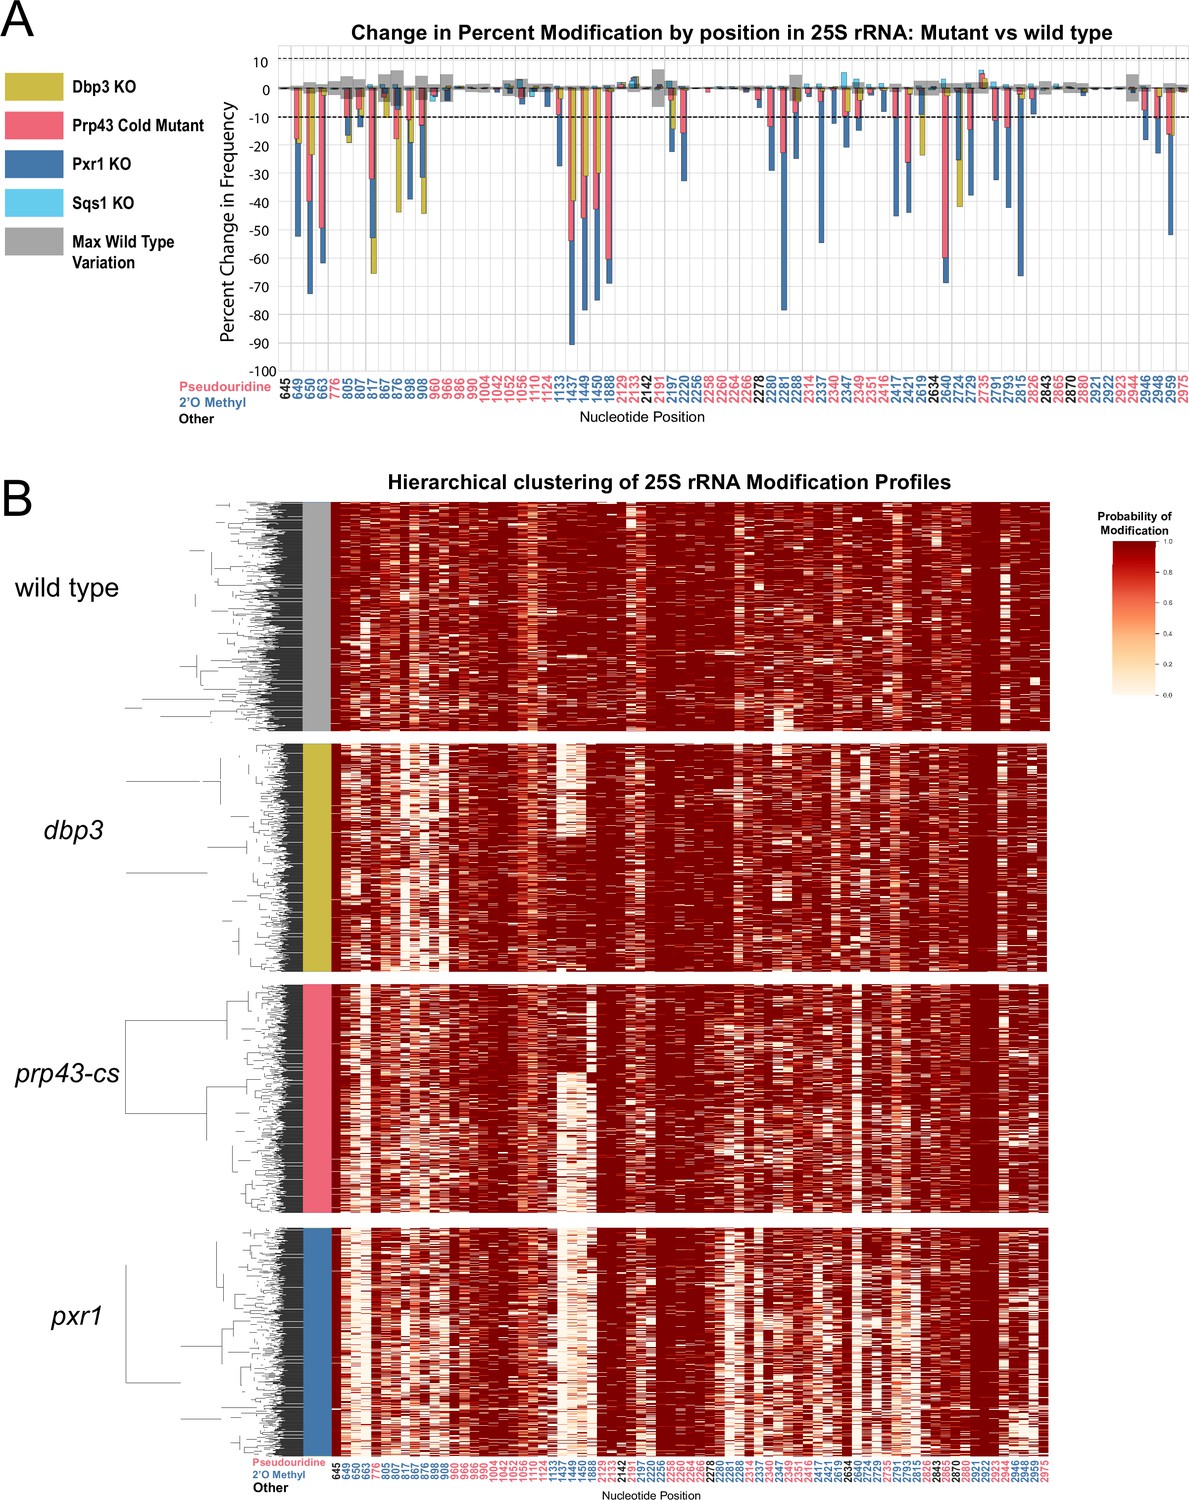
Clustering of 25 S rRNA modification profiles and percent change in modification frequency of mutant helicases Dbp3 and Prp43 and G-patch proteins Pxr1 and Sqs1.
(A) Barplots of the difference between wild-type modification frequency and dbp3ᐃ, prp43-cs, pxr1ᐃ, and sqs1ᐃ modification frequencies in 25 S yeast rRNA. Gray bars indicate the variance of wild type rRNA modification at each position and the black dotted lines represent the maximum variance observed at any site. (B) Hierarchical clustering of 25 S yeast rRNA modification profiles from wild type, dbp3ᐃ, prp43-cs, and pxr1ᐃ (1000 reads in each experiment). Each row is a full-length molecule, each column is a modified nucleotide and the color represents modification probability, see scale.
Figure 3—figure supplement 1
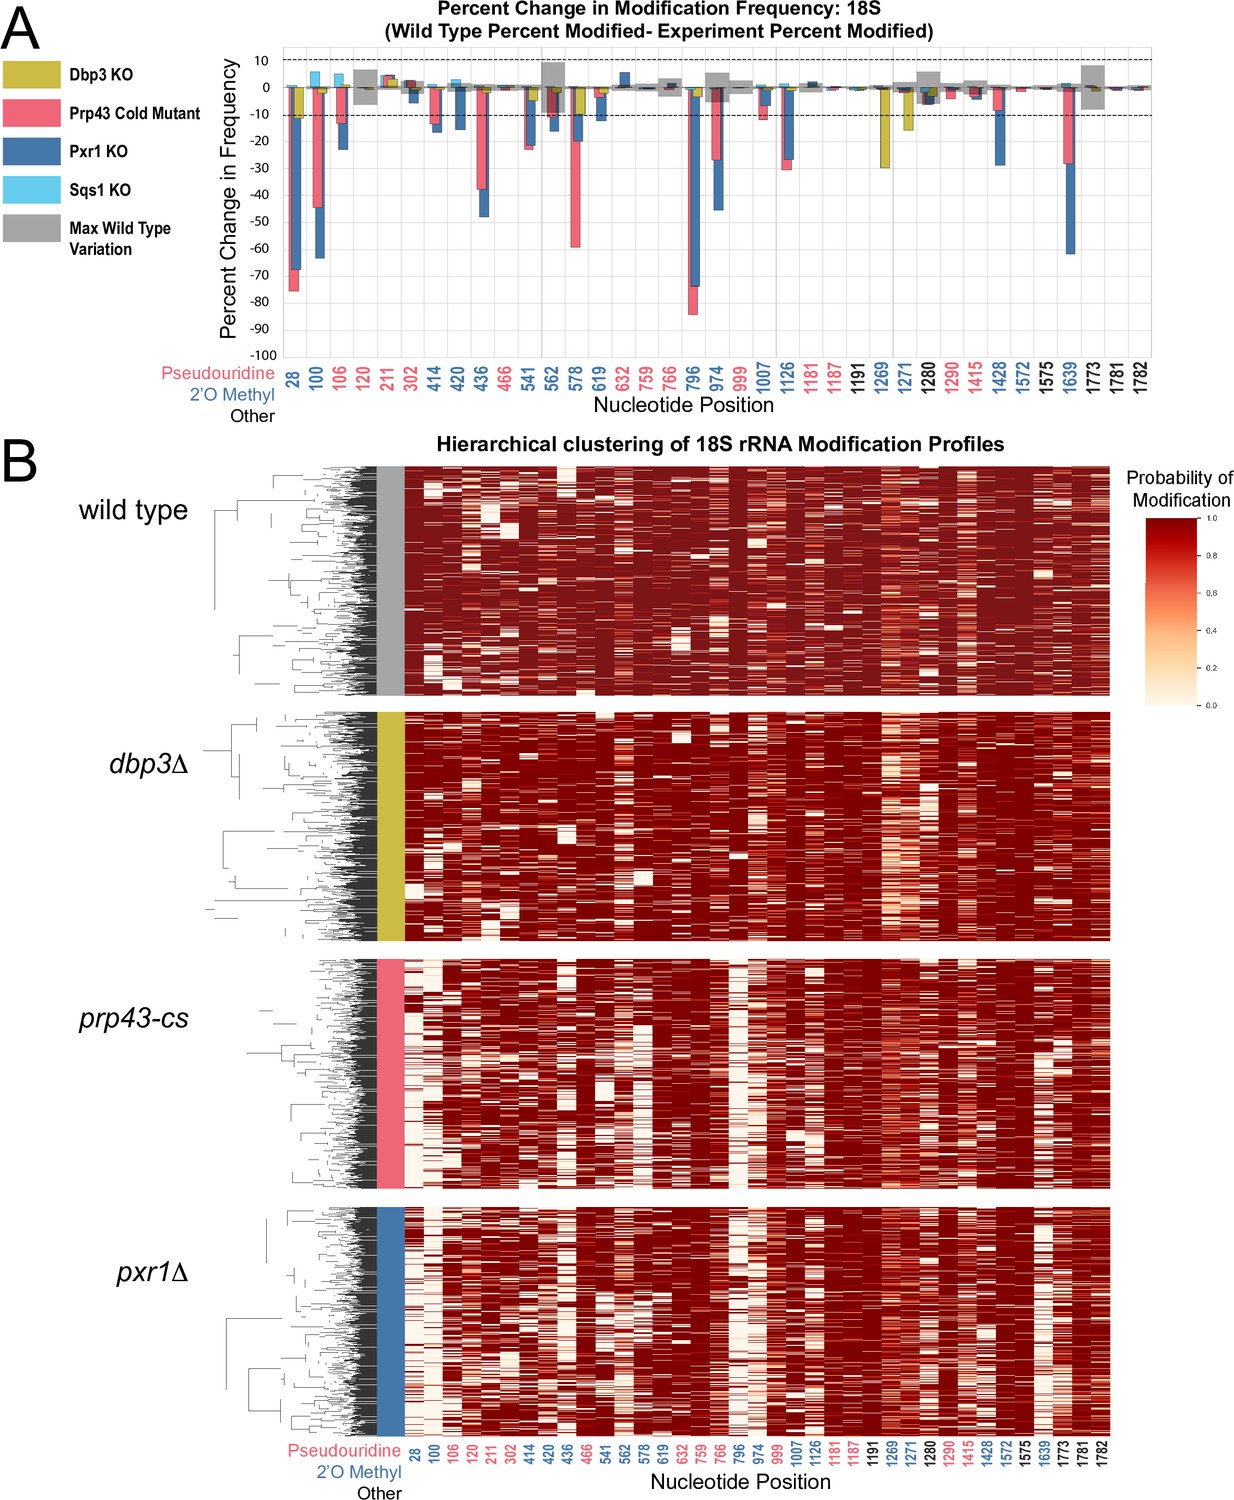
Clustering of 18 S rRNA modification profiles and percent change in modification frequency upon mutation of helicases Dbp3 and Prp43 and G-patch proteins Pxr1 and Sqs1.
(A) Barplots of the difference between wild-type modification frequency and dbp3ᐃ, prp43-cs, pxr1ᐃ, and sqs1ᐃ modification frequencies in 18 S yeast rRNA. Gray bars indicate the variance of wild type rRNA modification at each position and the black dotted lines represent the maximum variance. (B) Hierarchical clustering of 18 S yeast rRNA modification profiles from wild type, dbp3ᐃ, prp43-cs, and pxr1ᐃ (1000 reads in each experiment). Each row represents a full-length single read, each column represents a modified nucleotide and the scale represents the probability of being modified.
Figure 3—figure supplement 2

Clustering of 18 S rRNA modification profiles and percent change in modification frequency upon mutation of helicases Prp43 and Prp16, compared to wild type controls grown at 30 °C or shifted to 18 °C for 1 hr.
(A) Barplots of the difference between 18 S yeast rRNA modification frequency of wild type cells grown at 30 °C and wild type, prp43-cs, and prp16-cs cells shifted to 18 °C for 1 hr. Gray bars indicate the variance of wild-type rRNA modification at each position and the black dotted lines represent the maximum variance. (B) Hierarchical clustering of 18 S yeast rRNA modification profiles from wild type 30 °C, wild type 18 °C, prp43-cs, and prp16-cs (1,000 reads in each experiment). Each row represents a full-length single read, each column represents a modified nucleotide and the scale represents the probability of being modified.
Figure 3—figure supplement 3

Clustering of 25 S rRNA modification profiles and percent change in modification frequency upon mutation of helicases Prp43 and Prp16, compared to wild-type controls grown at 30 °C or shifted to 18 °C for 1 hour.
(A) Barplots of the difference between 25 S yeast rRNA modification frequency of wild-type cells grown at 30 °C and wild type, prp43-cs, and prp16-cs cells shifted to 18 °C for 1 hr. Gray bars indicate the variance of wild type rRNA modification at each position and the black dotted lines represent the maximum variance. (B) Hierarchical clustering of 18 S yeast rRNA modification profiles from wild type 30 °C, wild type 18 °C, prp43-cs, and prp16-cs (1000 reads in each experiment). Each row represents a full-length single read, each column represents a modified nucleotide and the scale represents the probability of being modified.
Figure 3—figure supplement 4

Clustering of underlying events to search for patterns of modification in the Dbp3 KO and Prp43 cold mutant.
Hierarchical clustering of aligned standardized events from Dbp3 KO (A) and Prp43 cold mutant (B) covering the events from positions 1431–1455 (see Materials and methods). These positions cover the 3 2’O ribose methylations guided by the snoRNA U24 at positions 1437, 1449, and 1450.
Figure 4 with 1 supplement
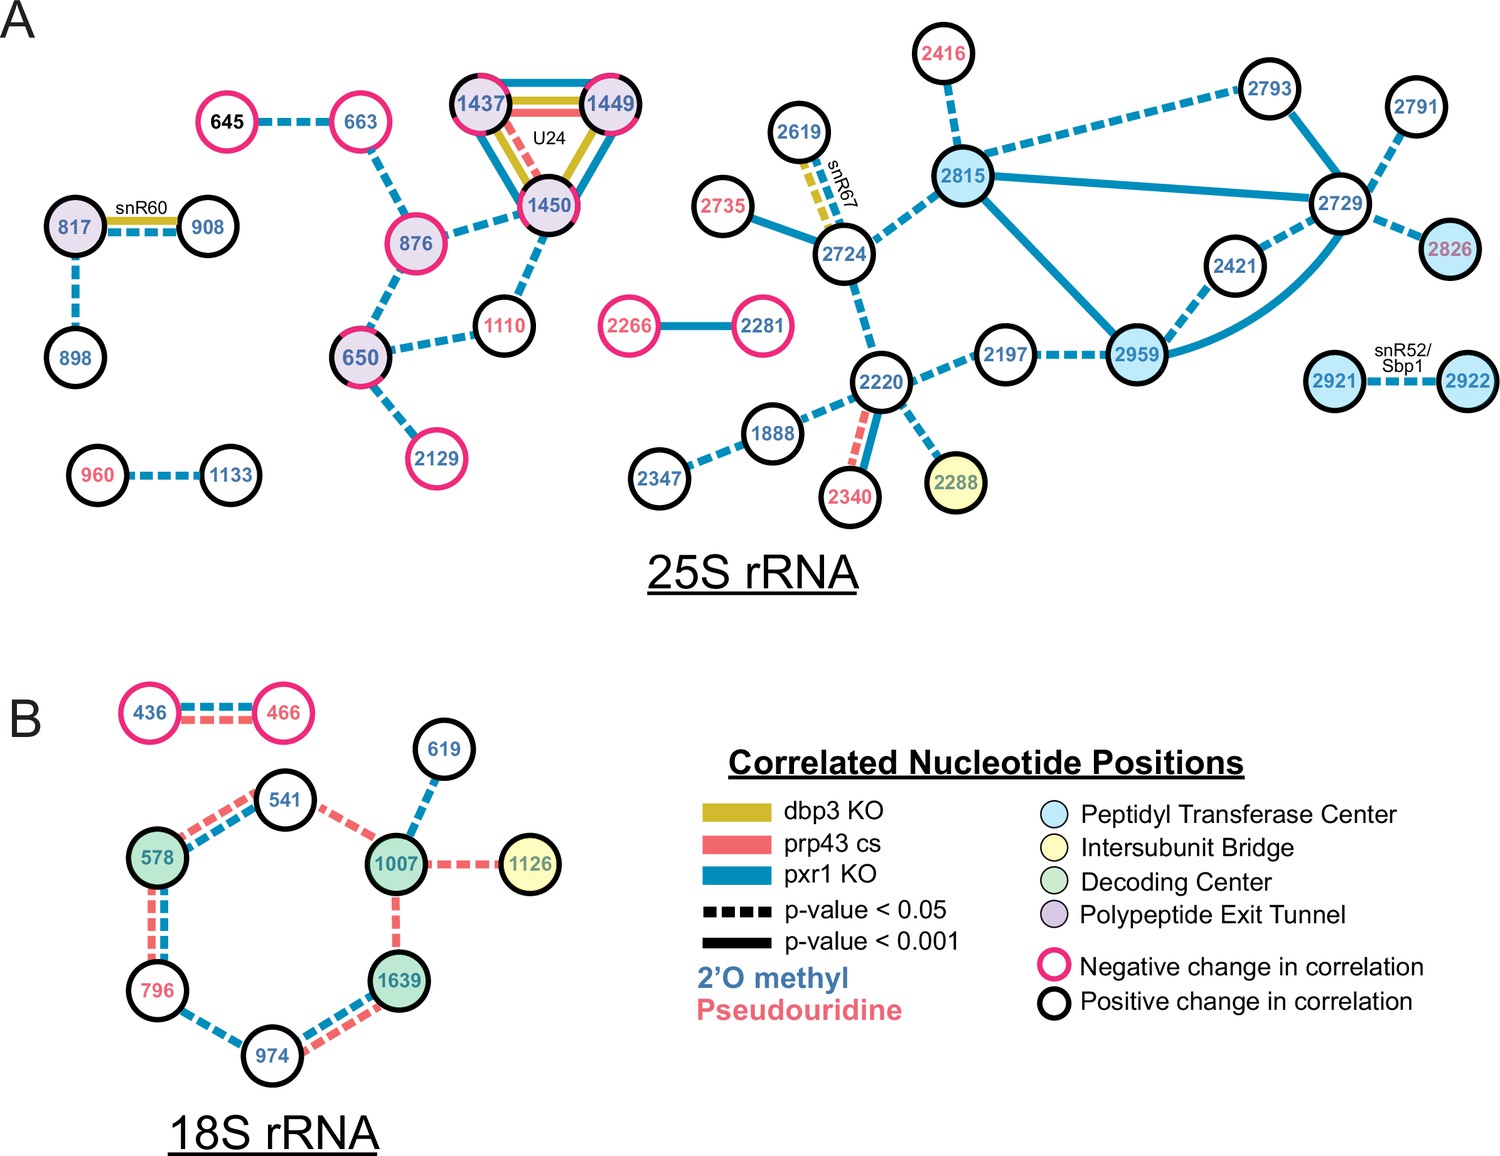
Changes in correlated nucleotide positions in dbp3ᐃ, prp43-cs, or pxr1ᐃ mutants.
Graphical representation of modification correlation changes, significance, and location within the functional centers of the ribosome. Pairs of correlated nucleotide changes (nodes) are shown for each mutant (colored edges) relative to wild type yeast 25 S rRNA (A) and 18 S rRNA (B). In cases where correlated pairs show differential changes in correlation in different mutants (eg. U24 modifications), node color rings are fragmented with the appropriate mutant edge connecting to either the magenta (negative change in correlation relative to wild type) or black (positive change in correlation relative to wild type) portion of the node.
Figure 4—figure supplement 1
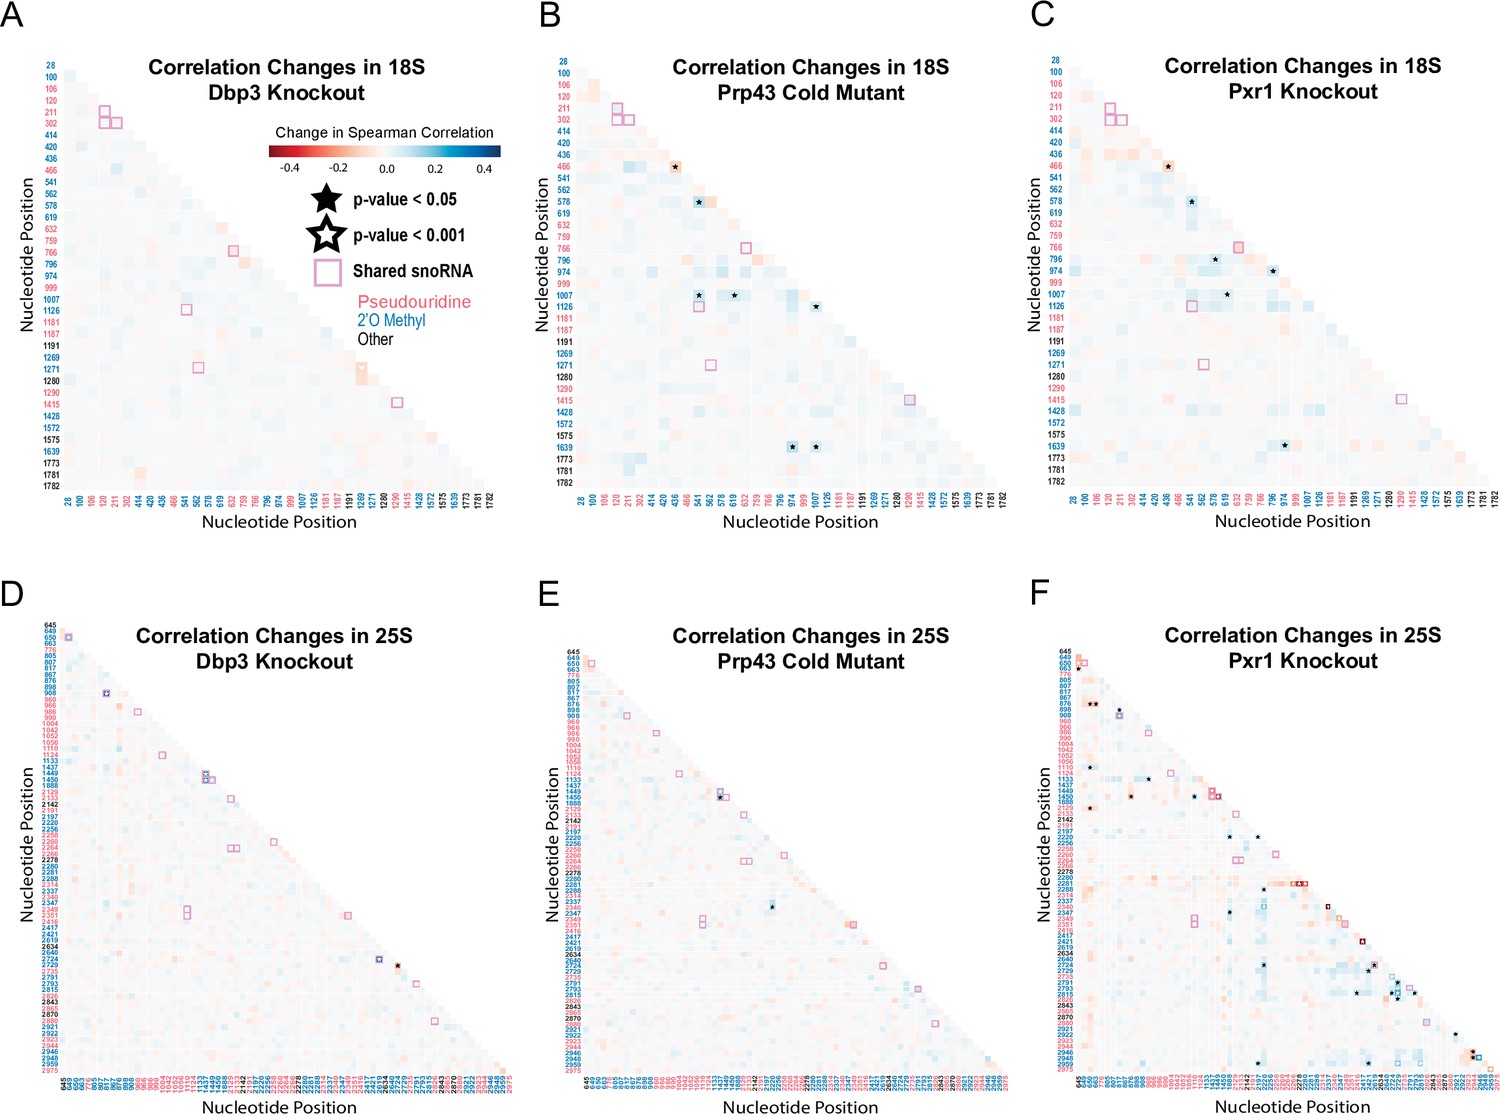
Correlation analysis of dbp3ᐃ, prp43-cs, and pxr1ᐃ.
Change in Spearman correlations of 18 S (A–C) and 25 S (D–E) reads in dbp3ᐃ (A/D), prp43-cs (B/E), and pxr1ᐃ (C/F) when compared to wild type. Stars represent significant changes when compared to wild type correlation and significantly different from zero correlation.
Figure 5
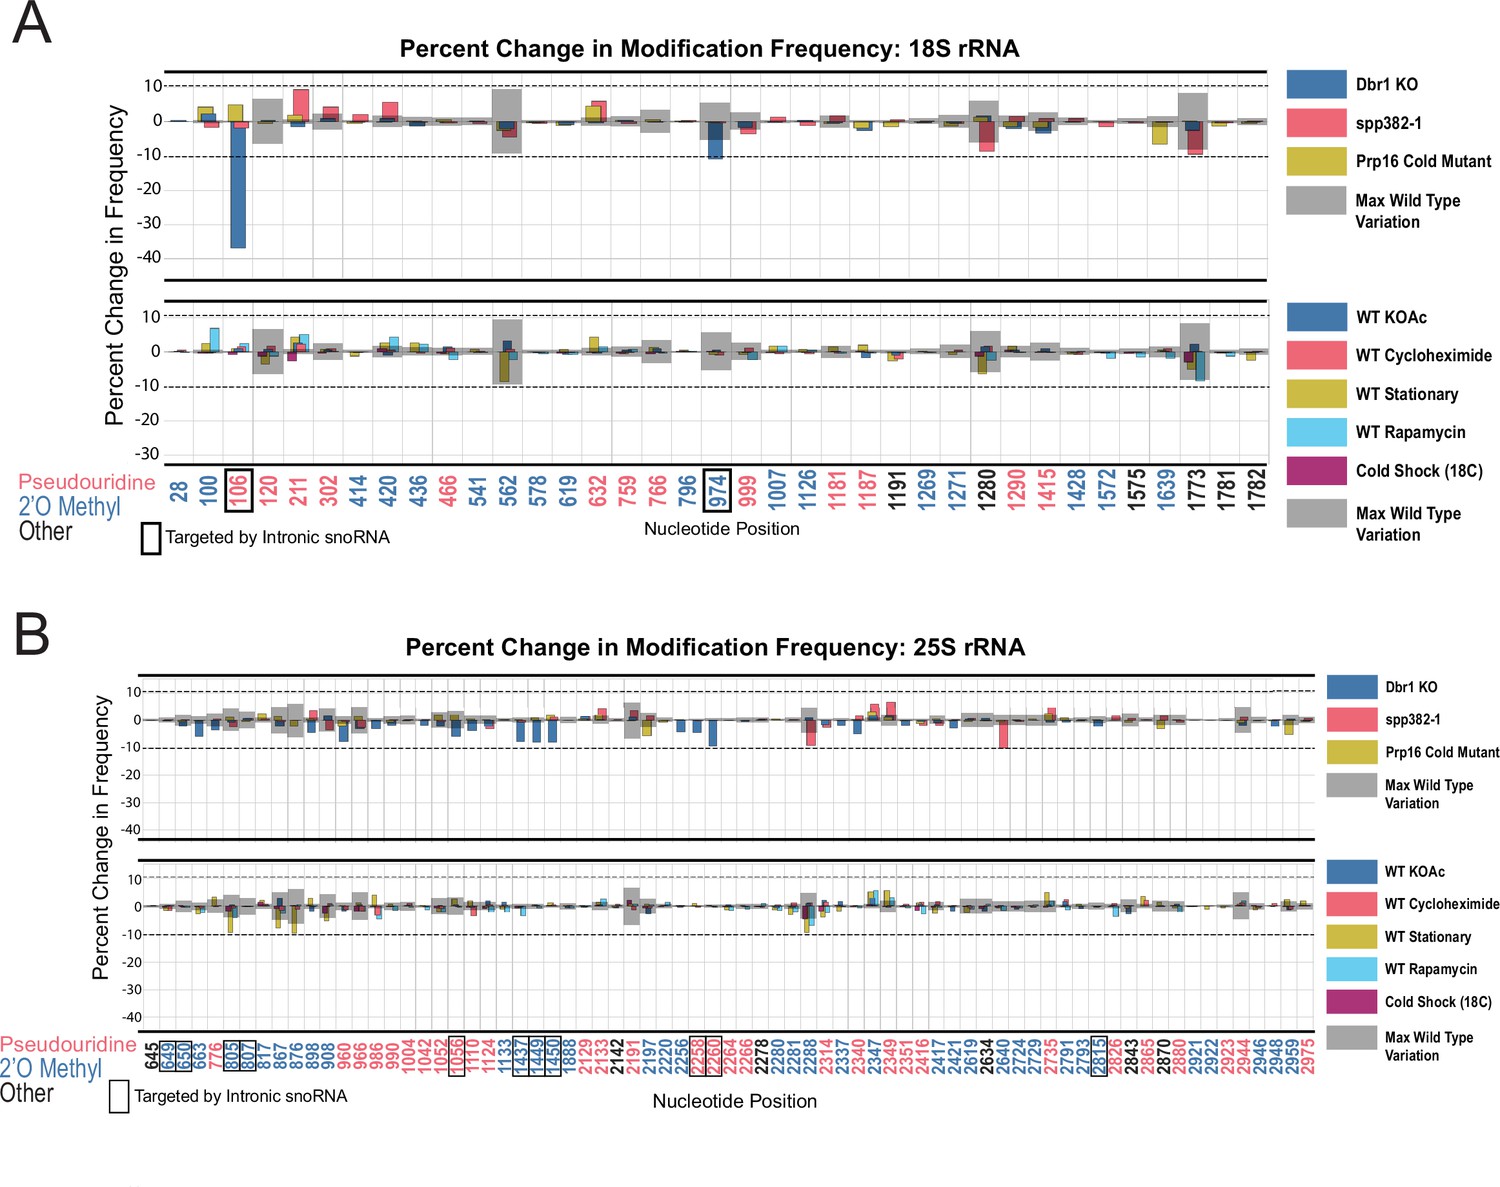
Resilience of yeast rRNA modifications to a variety of splicing mutants and experimental conditions.
Barplots of the difference between wild-type modification frequency and dbr1ᐃ, spp382-1, prp16-302, KOAc treated, cycloheximide treated, stationary, rapamycin treated and cold shock yeast modification frequencies in yeast 18 S (A) and 25 S (B) rRNA. Gray bars indicate the variance of wild-type rRNA modification at each position and the black dotted lines represent the maximum variance across sites.
Figure 6
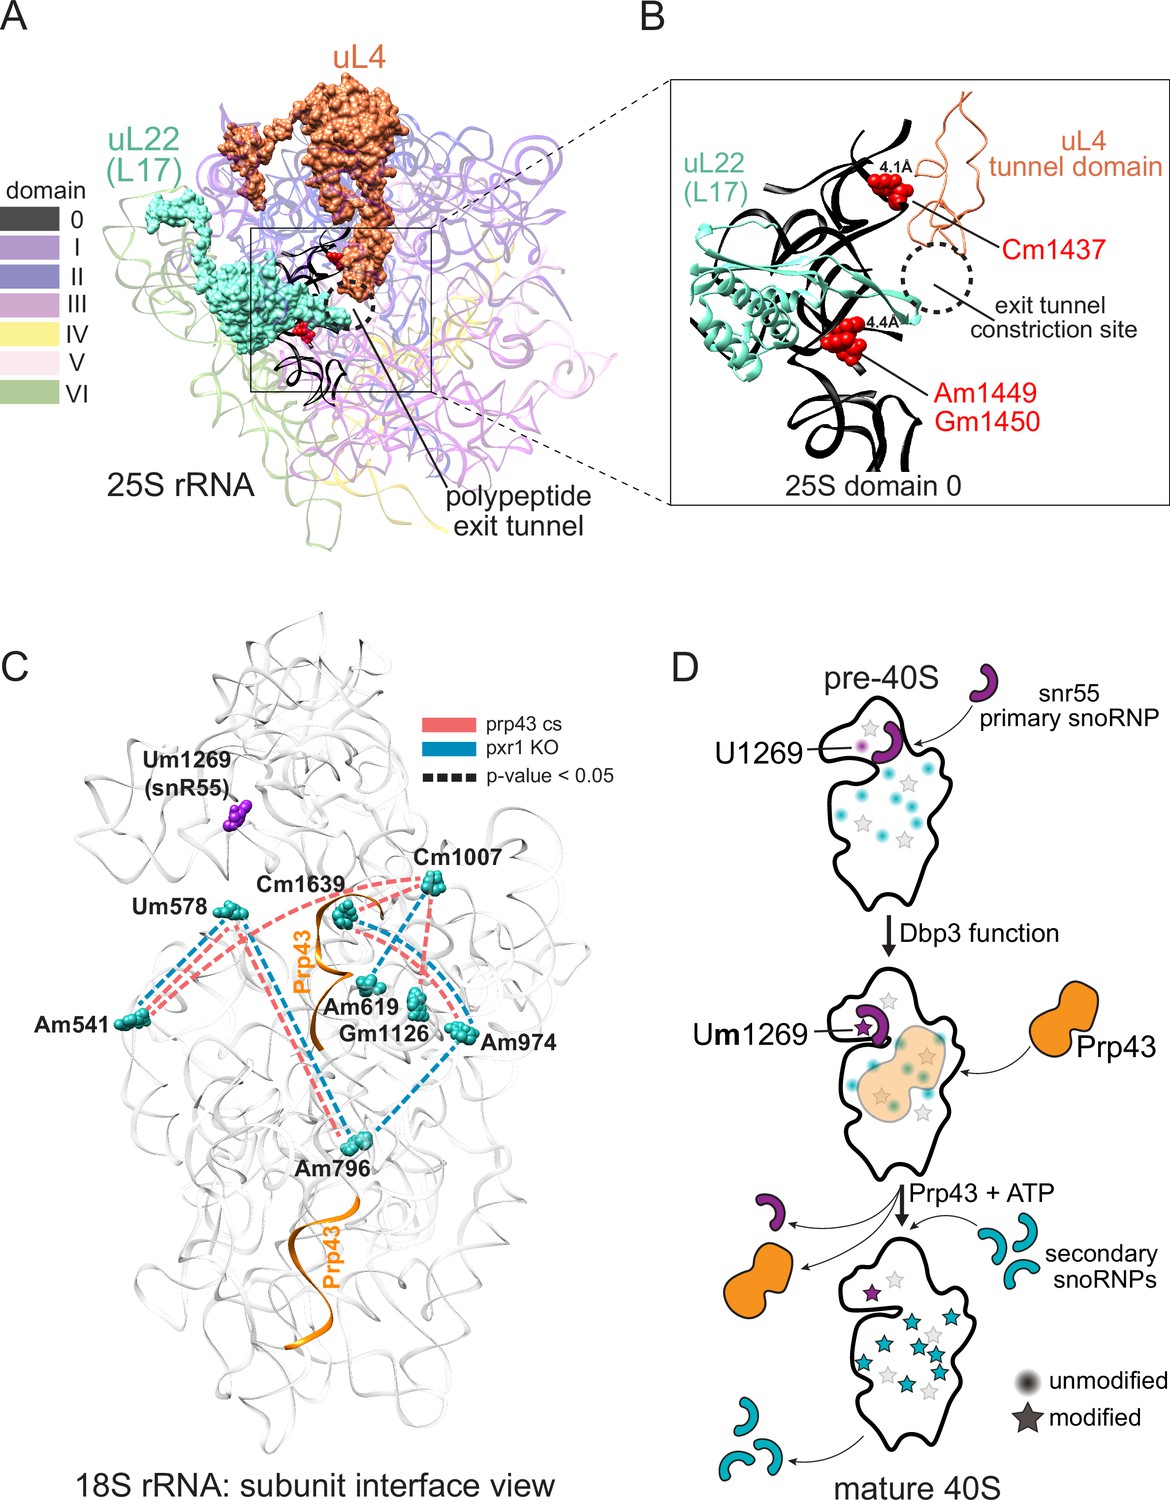
Models describing the functional basis for concerted modification at specific locations in the ribosome.
(A) Crystal structure model of yeast 25 S rRNA and ribosomal proteins uL4 and uL22 in surface view (PDB:4V88; Ben-Shem et al., 2011). rRNA domains are color coded according to the RiboVision Suite (Bernier et al., 2014). The distal end of the polypeptide exit tunnel is indicated. U24-guided modified nucleotides Cm1437, Am1449, and Gm1450 are shown in blue. (B) Focused view of the uL4 tunnel domain and the internal loop of uL22 forming the exit tunnel constriction sites. 25 S rRNA domain 0 is shown in black. 4.1Å and 4.4Å represent the distance between the indicated, modified nucleotide and the internal loops of uL4 and uL22 respectively. (C) Crystal structure model of yeast 18 S rRNA showing changes in concerted loss of modifications in prp43-cs, or pxr1ᐃ mutants when snR55 (Um1269, purple) is retained on the pre-ribosome in the absence of Prp43 (Bohnsack et al., 2009). Prp43 crosslinking sites are indicated in orange. (D) Model showing the hierarchical function of Dbp3 and Prp43, to promote concerted modification of 18 S rRNA nucleotides, during ribosome biogenesis. Circles and stars represent unmodified and modified positions, respectively. Modified nucleotides in the 5´ end of 18 S rRNA, proposed to occur early and co-transcriptionally, are represented as light gray stars. Color scheme is the same as panel C.
Author response image 1
Tables
Key resources table
| Reagent type (species) or resource | Designation | Source or reference | Identifiers | Additional information |
|---|---|---|---|---|
| Strain, strain background (Saccharomyces cerevisiae) | Saccharomyces cerevisiae, various strains and genetic backgrounds | See Supplementary file 1D | ||
| Strain, strain background (Escherichia coli) | XL1 Blue | In-house | Electrocompetent cells | |
| Recombinant DNA reagent | T7-18S | This paper | HindIII digested, run-off in vitro transcription (see Materials and methods) | |
| Recombinant DNA reagent | T7-25S | This paper | HindIII digested, run-off in vitro transcription (see Materials and methods) | |
| Sequence-based reagent | sequencing adapter | Integrated DNA Technologies | Sequencing adapter – Supplementary file 1E | /PHOS/GGCTTCTTCTTGCTCTTAGGTAGTAGGTTC |
| Sequence-based reagent | s.c. 18 S splint | Integrated DNA Technologies | Sequencing adapter splint – Supplementary file 1E | CCTAAGAGCAAGAAGAAGCCTAATGATCCTTCC |
| Sequence-based reagent | s.c. 25 S splint | Integrated DNA Technologies | Sequencing adapter splint – Supplementary file 1E | CCTAAGAGCAAGAAGAAGCCACAAATCAGACAA |
| Sequence-based reagent | s.c. IVT 18 S splint | Integrated DNA Technologies | Sequencing adapter splint – Supplementary file 1E | CCTAAGAGCAAGAAGAAGCCAGCTTTAATGATC |
| Sequence-based reagent | s.c. IVT 25 S splint | Integrated DNA Technologies | Sequencing adapter splint – Supplementary file 1E | CCTAAGAGCAAGAAGAAGCCAGCTTACAAATCA |
| Commercial assay or kit | Gibson Assembly Master Mix | New England Biolabs | E2611L | |
| Commercial assay or kit | MEGAscript T7 transcription kit | Invitrogen | AM1334 | |
| Commercial assay or kit | MinION Mk1B Sequencing Device | Oxford Nanopore Technologies | MIN-101B | |
| Commercial assay or kit | Flongle Adapter | Oxford Nanopore Technologies | ADP-FLG001 | |
| Commercial assay or kit | Direct RNA Sequencing Kit | Oxford Nanopore Technologies | SQK-RNA002 | |
| Commercial assay or kit | Flow Cell (R9.4.1) | Oxford Nanopore Technologies | FLO-MIN106D | |
| Commercial assay or kit | Flongle Flow Cell (R9.4.1) | Oxford Nanopore Technologies | FLO-FLG001 | |
| Commercial assay or kit | Flow Cell Priming Kit | Oxford Nanopore Technologies | EXP-FLP002 | |
| Commercial assay or kit | Flongle Sequencing Expansion | Oxford Nanopore Technologies | EXP-FSE001 | |
| Chemical compound, drug | Rapamycin | Research Products International | R64500-0.001 | |
| Chemical compound, drug | Potassium acetate | EMD Millipore | PX1330-1 | |
| Chemical compound, drug | Cycloheximide | Sigma | C7698-1G |
Additional files
-
Supplementary file 1
Supplementary tables.
(A) Spearman correlations between reference positions along with corresponding p-value, Benjamini-Hochberg corrected p-values, correlation comparison Fisher z-transform test, Benjamini-Hochberg corrected correlation comparison Fisher z-transform test p-values with wild type repeats and IVT. (B) Fraction modified by position for every experiment with associated wild type- to-experiment two sample chi squared test p-values and Benjamini-Hochberg corrected p-values. (C) Fraction modified by position, average fraction modified and standard deviation of the three replicates for wild type yeast rRNA. (D) Yeast strains used in this study. (E) Oligonucleotides used in this study. (F) Sequencing metrics for S. cerevisiae rRNA using direct RNA nanopore sequencing. (G) Experiment mapping between ENA, SRA, GEO IDs.
- https://cdn.elifesciences.org/articles/76562/elife-76562-supp1-v3.xlsx
-
Transparent reporting form
- https://cdn.elifesciences.org/articles/76562/elife-76562-transrepform1-v3.docx
Download links
A two-part list of links to download the article, or parts of the article, in various formats.
Downloads (link to download the article as PDF)
Open citations (links to open the citations from this article in various online reference manager services)
Cite this article (links to download the citations from this article in formats compatible with various reference manager tools)
Concerted modification of nucleotides at functional centers of the ribosome revealed by single-molecule RNA modification profiling
eLife 11:e76562.
https://doi.org/10.7554/eLife.76562


