Drosophila mechanical nociceptors preferentially sense localized poking
- School of Life Sciences, Tsinghua University, China
- Institute of Biomechanics and Medical Engineering, Department of Engineering Mechanics, Tsinghua University, China
Figures
Figure 1 with 1 supplement
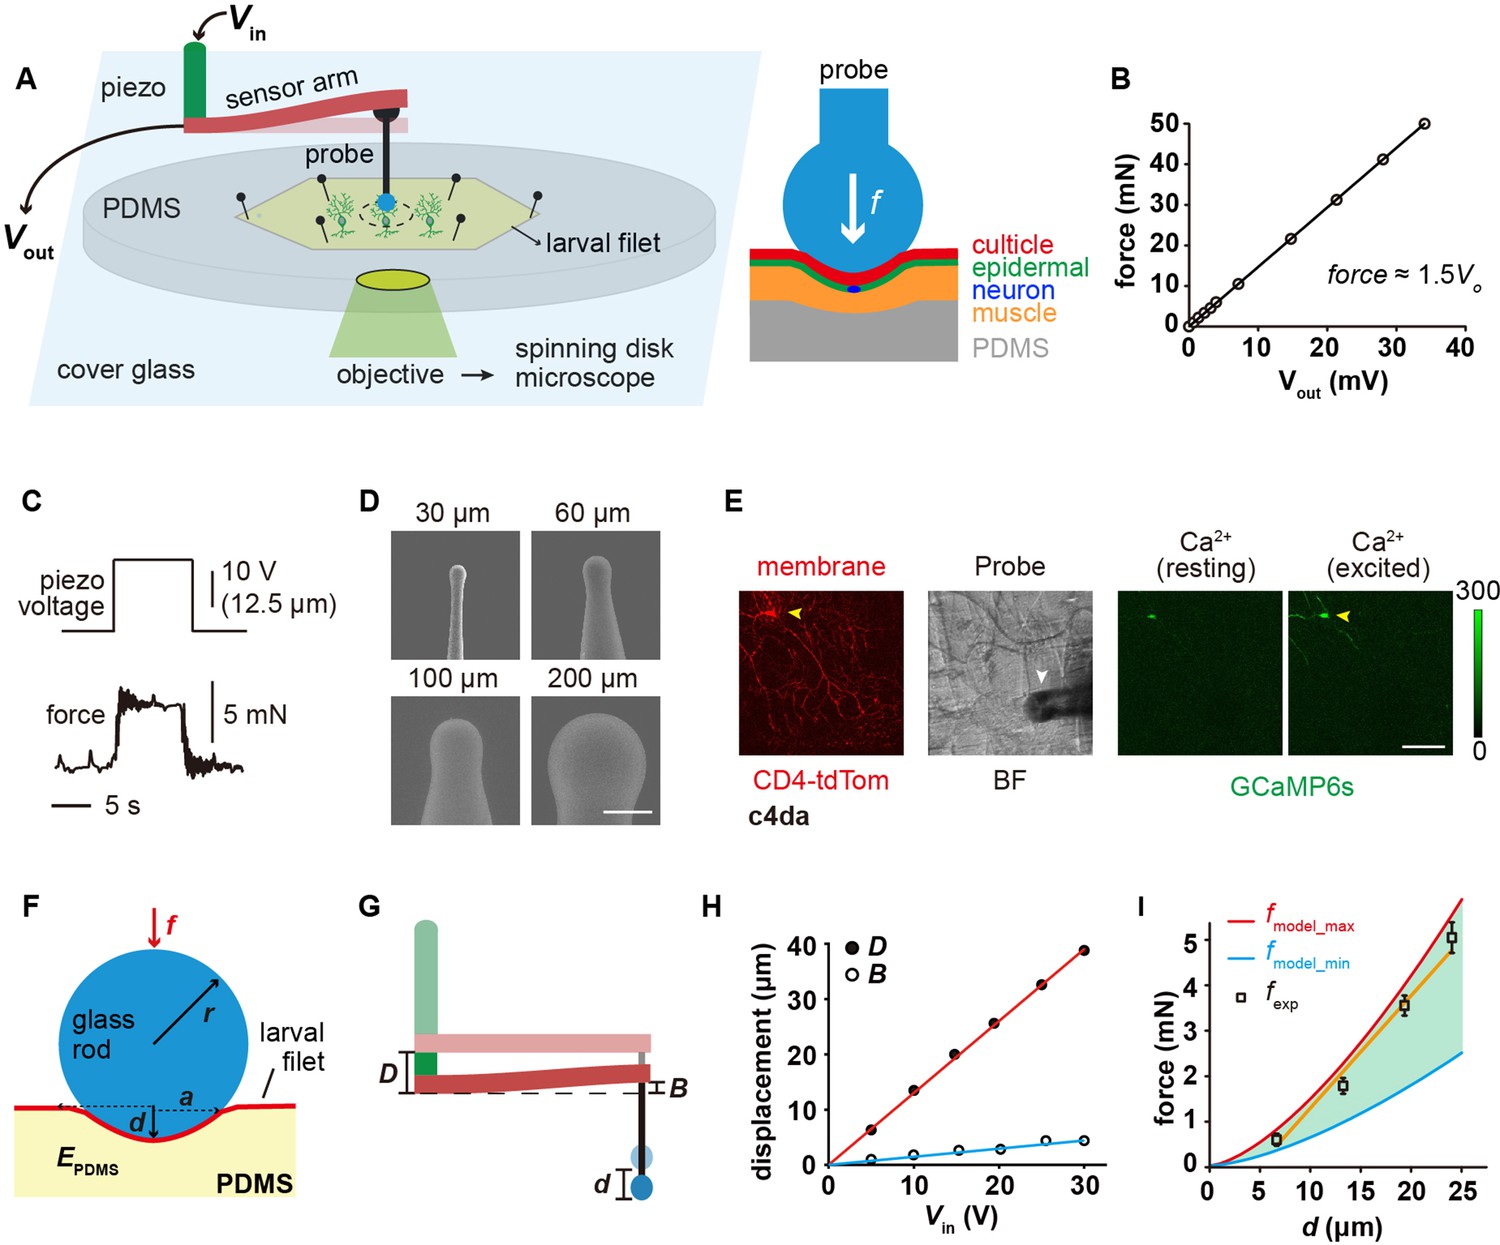
The 'mechanical-optical' recording system.
(A) The cartoon schematics for the ‘mechanical-optical’ recording system (left) and the contact model between a spherical probe and the larval fillet (right). Vin was the driving voltage of the piezo actuator. Vout was the readout voltage of the strain gauge. (B) The force calibration curve of the strain gauge. The data points were mean values from three measurements. (C) Representative traces for the input (driving voltage of the piezo actuator, upper panel) and the mechanical output (stimulating force, lower panel) of the recording system. (D) The scanning electron microscopy images of glass force probes of different sizes. Scale bar, 100 μm. (E) Left panel: a representative image of c4da (membrane, red channel), Middle panel: a bright field image of larval fillet. Right panel: two representative images showing the GCaMP6s signals in c4da at resting (left) and exciting (right) conditions. Yellow arrowhead: soma. White arrowhead: force probe. Scale bar, 100 μm. Genotype: uas-cd4-tdTom; ppk-gal4/20×uas-ivs-gcamp6s. (F) The mechanical schematics of the 'sphere-surface' model. Note that the contact interface had a spherical crown shape. The definitions of all model parameters were described in Materials and methods. (G) The cartoons schematics showing the relationship among indentation depth of the force probe (d) deflection of the beam (B) and stepping distance of the piezo (D). (H) The plots of D (red) and B (blue) versus the driving voltage of the piezo (Vin). (I) The comparison between the calculated (red and blue) and experimentally measured (black) contact forces. In our calculations, the maximal (4 MPa, red) and minimal (1.6 MPa, blue) values of the elastic modules of PDMS were from the literatures (Johnston et al., 2014; Vlassov et al., 2018). Data were presented as mean ± std (n=9 assays).
-
Figure 1—source data 1
Numerical data for Figure 1.
- https://cdn.elifesciences.org/articles/76574/elife-76574-fig1-data1-v3.zip
Figure 1—figure supplement 1

The customized ‘mechanical-optical’ recording system.
(A) The mechanical device was mounted on the working stage of a spinning-disk confocal microscope. (B) The mechanical device. Yellow box: the piezo actuator. Cyan box: the beam coupled with a strain gauge. (C) The dendritic damage was minimized in our experimental system. Here, we showed the morphology of the dendrite before (red) and after (green) a 4 mN (saturation force for the 60 μm probe) and a 1.5 mN (saturation force for the 30 μm probe) forces. The asterisks indicate the center of the force probe. The local region around the force application point was enlarged (merge) and the merged image showed that despite the presence of small displacement, no apparent dendritic damage was observed. Note that we cannot absolutely exclude the possibility of microscopic dendritic breakage below the resolution of the light microscope. However, the dependence of the calcium responses to mechanosensitive channel Piezo and ppk1/ppk26 supports the idea that the responses that we observed were evoked by forces. Genotype: ppk-cd4-tdTomato. Scale bars: 50 μm. (D) The dendritic damage caused by the poking in the modified behavior assays was minimized. The dorsal side of larval middle segments were examined before and after the behavior assays using the 60 or 30 μm probes. No significant damages were observed. Genotype: ppk-cd4-tdgfp. Scale bar: 50 μm.
Figure 2 with 3 supplements
The mechanosensory features of c4da.
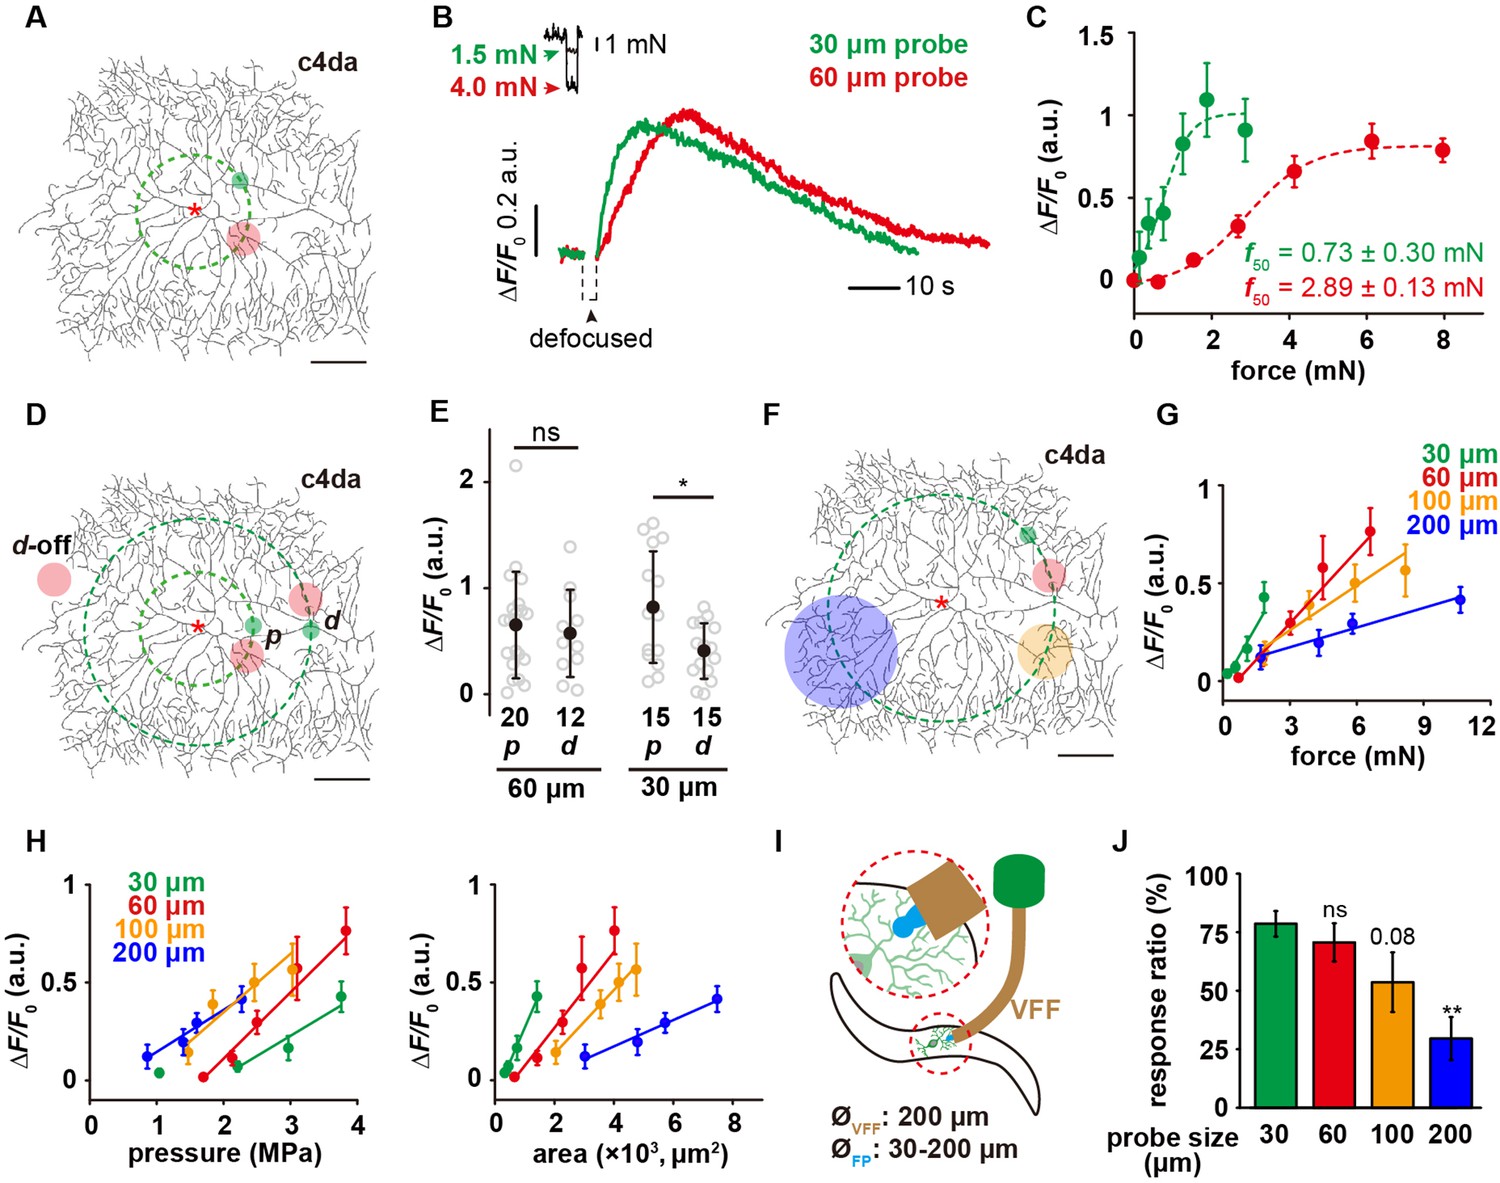
(A) A representative image of c4da. The forces were applied at about 100 μm from the soma, i.e. along the green dashed circle. The representative force application points were marked using the filled circles (Green: 30 μm probe. Red: 60 μm probe). Genotype: uas-cd4-tdtom; ppk-gal4. (B) Representative responses of c4da (ΔF/F0, i.e. the change in calcium signal in the soma, unless otherwise stated hereinafter) to mN-scale forces delivered using the 30 μm (green) and 60 μm (red) probes. The black arrowhead indicated the defocused period of the soma caused by the stimulating force (2 s). Genotype: ppk-gal4/+; ppk-cd4-tdtom/20×uas-ivs-gcamp6s. (C) The force-response (ΔF/F0) plots of c4da (n=12 cells). The dashed lines were Boltzmann fitting. (D) The schematic showing the force application points (filled circles, green: 30 μm probe, red: 60 μm probe) of different stimuli. The dashed concentric circles were 100 and 200 μm in radius, respectively. (p) proximal dendrite. (d) distal dendrite. d-off: the ‘dendrite-off’ region. (E) The responses of c4da (ΔF/F0) to the proximal and distal stimuli using the 30 (1.5 mN) and 60 μm (4 mN) probes. Mann Whitney U test was used. *: p<0.05. ns: no significance. (F) The schematic showing the stimuli (filled circles, green: 30 μm probe, red: 60 μm probe, orange: 100 μm probe, blue: 200 μm probe) delivered using the probes of different sizes. The dashed circle was 200 μm in radius. (G) The responses of c4da (ΔF/F0, n=10 cells) to the forces applied on the distal dendrites using the probes of different sizes. (H) The plots of the responses of c4da (the same dataset as panel (G)) to distal stimuli versus central pressure (P0) (left panel) and contact areas (Ac) (right panel), respectively. Also see Figure 2—figure supplement 2 for the plots of the responses versus the pressures at other positions (Px μm). (I) The cartoon schematics of the modified behavior assay for mechanical nociception. VFF: Von Frey fiber, FP: force probe. (J) The behavioral responses of wild-type larvae to the mechanical poking stimuli using the probes of different sizes. The experiments were performed three times and the total numbers of larvae used for each type of probe were as following: 30 μm probe (n=92), 60 μm probe (n=67), 100 μm probe (n=69), 200 μm probe (n=70). One-way ANOVA test was used. **: p<0.01. ns: no significance. In panels (A), (D) and (F), scale bar: 100 μm. Asterisk: the soma. In panels (C), (G) and (H), data were presented as mean ± sem. In panel (E) and (J), data were presented as mean ± std and the numbers of cells were indicated below the scattered data points.
-
Figure 2—source data 1
Numerical data for Figure 2.
- https://cdn.elifesciences.org/articles/76574/elife-76574-fig2-data1-v3.zip
Figure 2—figure supplement 1
Mechanosensory responses of c1da and c3da.
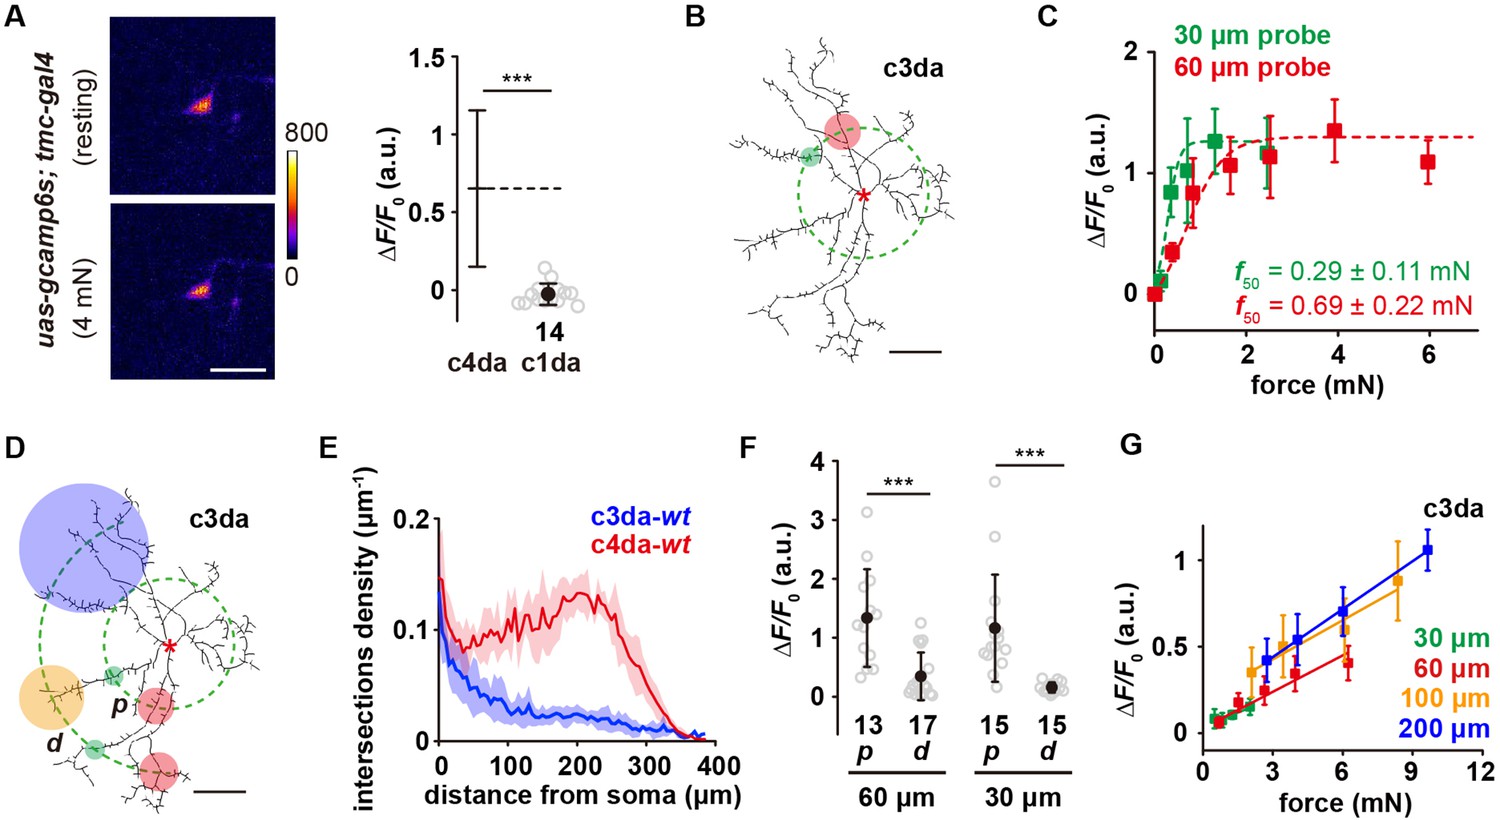
(A) Left panel: the representative image showing that c1da made no responses to a 4 mN compressive force. Right panel: Statistical quantification of the responses of c1da to compressive forces (4 mN, 60 μm probe). Mann Whitney U test was used. ***: p<0.001. (B) A representative image of c3da. The forces were applied at about 100 μm from the soma, i.e. along the green dashed circle. The representative force application points were marked using the filled circles (Green: 30 μm probe. Red: 60 μm probe). The data of c4da-wt (see Figure 2E) were provided for comparison. Genotype: uas-cd4-tdtom; gal4-19-12. (C) The force-response (ΔF/F0) plots of c3da (n=12 cells) using the probes of two different sizes (Green: 30 μm probe. Red: 60 μm probe). The dashed lines were Boltzmann fitting. (D) The schematic showing the stimuli (filled circles, green: 30 μm probe, red: 60 μm probe, orange: 100 μm probe, blue: 200 μm probe) delivered at different positions using the probes of different sizes on c3da. (p) proximal dendrite. (d) distal dendrite. (E) Modified Sholl analysis on the morphology of c3da-wt and c4da-wt. The shadow areas represented standard deviations. n=5 cells for each type of neurons. (F) The responses of c3da to the proximal and distal stimuli using the 30 (1.5 mN) and 60 μm (4 mN) probes. Mann Whitney U test was used. ***: p<0.001. (G) The responses of c3da (n=9 cells) to the forces applied on the distal dendrites using the probes of different sizes. In panel (A), scale bar: 30 μm. In panel (A) and (F), data were presented as mean ± std and the numbers of cells were indicated below the scattered data points. In panels (B), and (D), scale bar: 100 μm. In panels (C) and (G), data were presented as mean ± sem. Asterisk in panels (B) and (D): the soma.
-
Figure 2—figure supplement 1—source data 1
Numerical data for Figure 2—figure supplement 1.
- https://cdn.elifesciences.org/articles/76574/elife-76574-fig2-figsupp1-data1-v3.zip
Figure 2—figure supplement 2

The responses of c4da-wt to distal stimuli have a linear scaling relationship with the pressure (Px μm).
The responses of c4da to distal stimuli versus the pressures measured at 5 μm, 10 μm and 15 μm away from the center of the force (P5 μm, P10 μm, P15 μm). Data were presented as mean ± sem (n=10 cells).
-
Figure 2—figure supplement 2—source data 1
Numerical data for Figure 2—figure supplement 2.
- https://cdn.elifesciences.org/articles/76574/elife-76574-fig2-figsupp2-data1-v3.zip
Figure 2—figure supplement 3
The forces delivered using different stimulation probes.
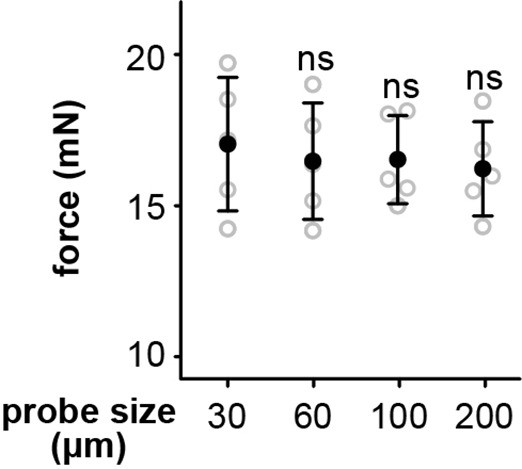
For each probe size, five fibers were used to measure the poking forces. The poking forces had no dependence on the probe size. Mann Whitney U test was used. ns: no significance.
-
Figure 2—figure supplement 3—source data 1
Numerical data for Figure 2—figure supplement 3.
- https://cdn.elifesciences.org/articles/76574/elife-76574-fig2-figsupp3-data1-v3.zip
Figure 3 with 1 supplement

The contribution of dendritic morphology to the sensory features of c4da.
(A) The schematic showing the force application points (filled circles, green: 30 μm probe, red: 60 μm probe, orange: 100 μm probe) on c4da-cti. The dashed concentric circles were 100 and 200 μm in radius, respectively. (p) proximal dendrite. (d) distal dendrite. d-off: the ’dendrite-off’ region. Asterisk: the soma. Scale bar, 100 μm. Genotype: ppk-gal4/+, ppk-cd4-tdtom/uas-cti. (B) Modified Sholl analysis on the morphology of c4da-wt and c4da-cti. Note that there was a broad region in c4da-wt (red bar) in which the dendritic density was nearly constant. The shadow areas represented standard deviations. n=5 cells for each genotype. The black arrowhead indicated the regions of proximal dendrites. (C) The responses of c4da-cti (ΔF/F0) to the force stimuli (4 mN) applied onto the proximal and distal dendrites using a 60 μm probe. The numbers of cells were indicated below the scattered data points. Mann Whitney U test was used. *: p<0.05. ns: no significance. cti: ppk-gal4/20×uas-ivs-gcamp6s, ppk-cd4-tdtom/uas-cti. scrambledi: ppk-gal4/20×uas-ivs-gcamp6s, ppk-cd4-tdtom/uas-scrambledi. (D) The responses of c4da-cti (ΔF/F0) to the forces applied on the distal dendrites using the probes of different sizes. Data were presented as mean ± sem (n=10 cells). (E) The behavioral responses of cti larvae to mechanical poking using the probes of different sizes. wt: w1118. ppk-gal4: ppk-gal4; +/+. uas-cti: +/+; uas-cti. cti: ppk-gal4/+; uas-cti/+. ppk-gal4 larvae: 30 μm probe (n=63 larvae from three experiments), 60 μm probe (n=60 larvae from three experiments) and 100 μm probe (n=68 larvae from three experiments). uas-cti larvae: 30 μm probe (n=68 larvae from three experiments), 60 μm probe (n=72 larvae from three experiments) and 100 μm probe (n=63 larvae from three experiments). cti larvae: 30 μm probe (n=97 larvae from four experiments), 60 μm probe (n=91 larvae from four experiments) and 100 μm probe (n=91 larvae from four experiments). One-way ANOVA test was used. **: p<0.01. ns: no significance. In panels (C), (D) and (E), the corresponding data from c4da-wt were provided for comparison. In panel (C) and (E), data were presented as mean ± std.
-
Figure 3—source data 1
Numerical data for Figure 3.
- https://cdn.elifesciences.org/articles/76574/elife-76574-fig3-data1-v3.zip
Figure 3—figure supplement 1
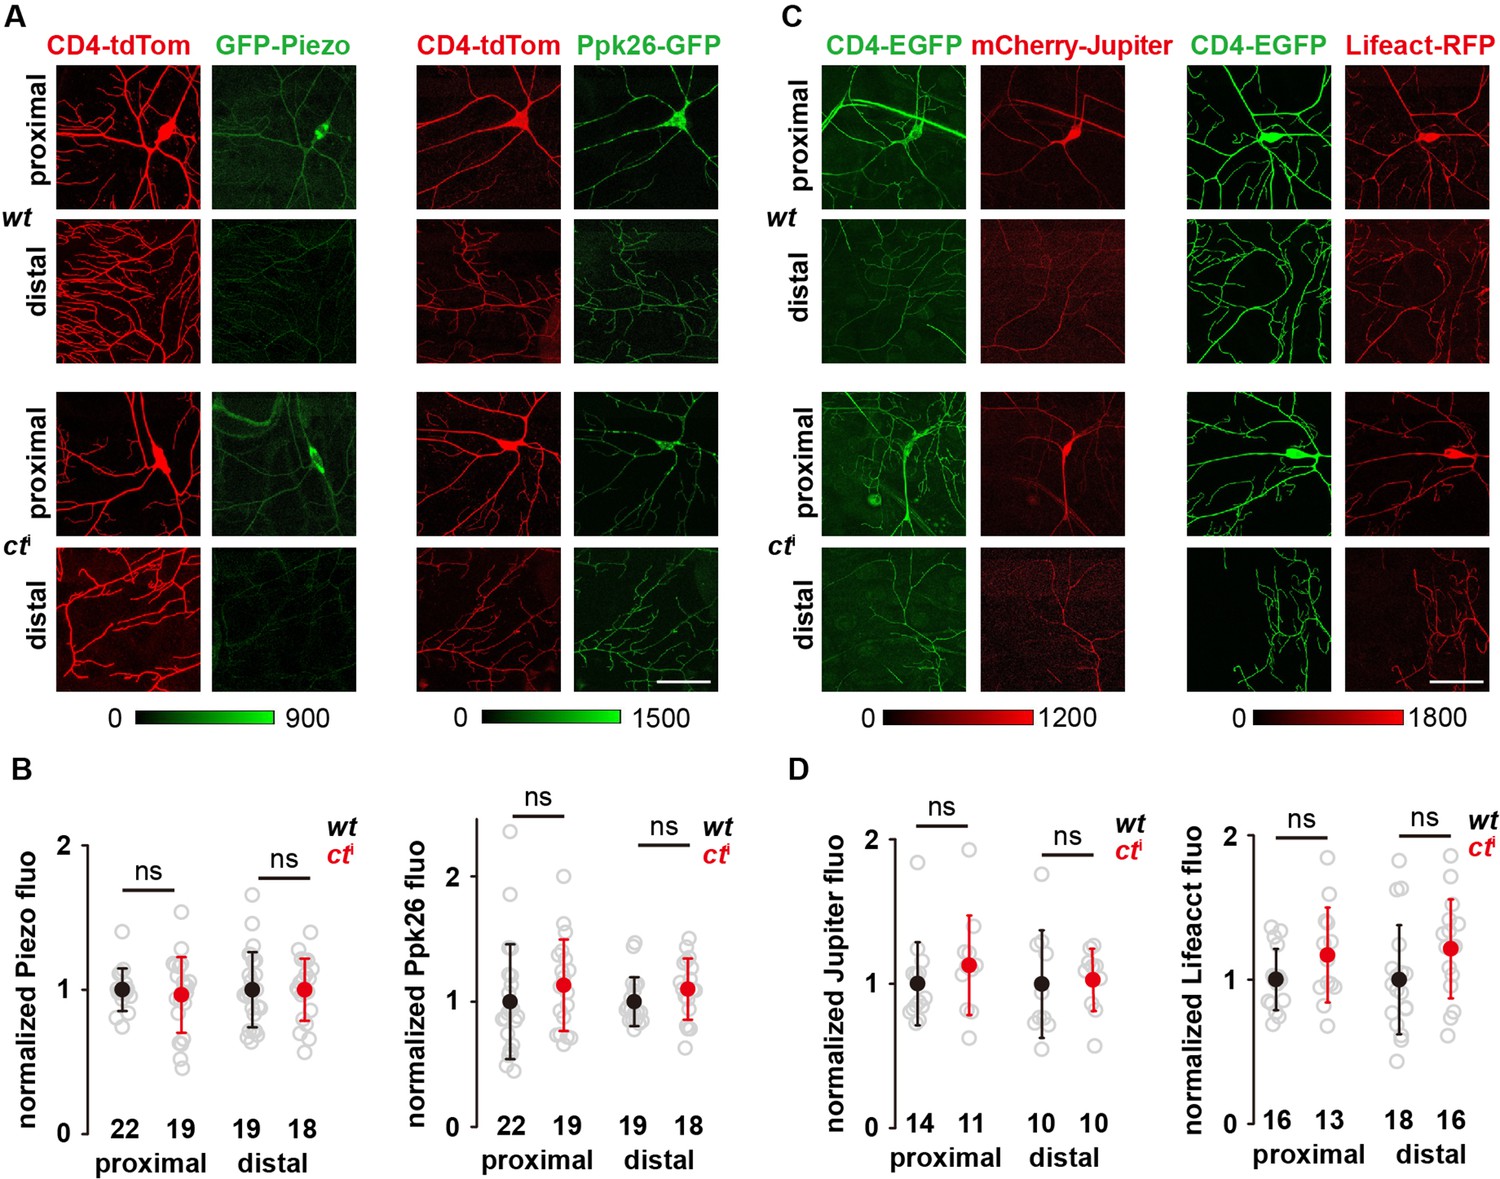
The expression and localization of the mechanosensory molecules and cytoskeletal elements in c4da-cti.
(A) The representative images of the mechanosensory molecules in c4da-wt and c4da-cti. c4da-wt (GFP-Piezo): gfp-piezo/ppk-gal4; ppk-cd4-tdtom/+. c4da-cti (GFP-Piezo): gfp-piezo/ppk-gal4; ppk-cd4-tdtom/uas-cti. c4da-wt (Ppk26-GFP): ppk-gal4/uas-cd4-tdtom, uas-ppk26-gfp/+. c4da-cti (Ppk26-GFP): ppk-gal4/uas-cd4-tdtom, uas-ppk26-gfp/uas-cti. (B) Statistical quantification of Piezo-GFP (left panel) and Ppk26-GFP (right panel) signals in c4da-wt and c4da-cti. (C) The representative images of F-actin (Lifeact) and microtubules (Jupiter) in c4da-wt and c4da-cti. c4da-wt (mCherry-Jupiter): ppk-gal4/ppk-cd4-tdgfp; uas-mcherry-jupiter/+. c4da-cti (mCherry-Jupiter): ppk-gal4/ppk-cd4-tdgfp; uas-mcherry-jupiter/uas-cti. c4da-wt (Lifeact-RFP): ppk-gal4/uas-lifeact-rfp, ppk-cd4-tdgfp/+. c4da-cti (Lifeact-RFP): ppk-gal4/uas-lifeact-rfp, ppk-cd4-tdgfp/uas-cti. (D) Statistical quantification of mCherry-Jupiter (left panel) and Lifeact-RFP (right panel) signals in c4da-wt and c4da-cti. In panels (A) and (C), scale bar: 50 μm. In panels (B) and (D), data were presented as mean ± std and the numbers of cells were indicated below the scattered data points. Student’s t test was used. ns: no significance.
-
Figure 3—figure supplement 1—source data 1
Numerical data for Figure 3—figure supplement 1.
- https://cdn.elifesciences.org/articles/76574/elife-76574-fig3-figsupp1-data1-v3.zip
Figure 4 with 1 supplement

The mechanosensitivity of c4da to lateral tension.
(A) The responses of c4da (ΔF/F0) to the d-off stimuli (4 mN, 60 μm probe) applied at different positions.The numbers of cells were indicated below the scattered data points. Mann Whitney U test was used. **: p<0.01. *: p<0.05. ns: no significance. Genotype: ppk-gal4/+; ppk-cd4-tdtom/20×uas-ivs-gcamp6s. (B) Left panel: representative heat maps showing the 2D distributions of pressure perpendicular to the cuticle surface (PP) and tension parallel with the cuticle surface (TL) of the 30 μm (upper) and 60 (lower) μm probes. Scale bar, 30 μm. Right panels: representative line profiles (normalized) showing the distribution of PP and TL versus the distance to the center of the force probe. Indentation depth: 20 μm. (C) The representative color map for the distance to the nearest dendrite, in which the distance was color-coded as indicated. Random positions were chosen (the red crosses) as the force application points in our simulations. Scale bar, 100 μm. (D–E) The activation probability in three conditions: (1) only sensitive to PP; (2) only sensitive to TL; (3) sensitive to both PP and TL. The dendritic coverage threshold (Cd) was the minimal length of activated dendrites that could excite neuronal responses. For each condition, 100 random positions and two sizes of probes (panel D) 30 μm; (panel E) 60 μm were used in our simulations for each cell (n=5 cells). In panel (A), (D) and (E), data were presented as mean ± std.
-
Figure 4—source data 1
Numerical data for Figure 4.
- https://cdn.elifesciences.org/articles/76574/elife-76574-fig4-data1-v3.zip
Figure 4—figure supplement 1
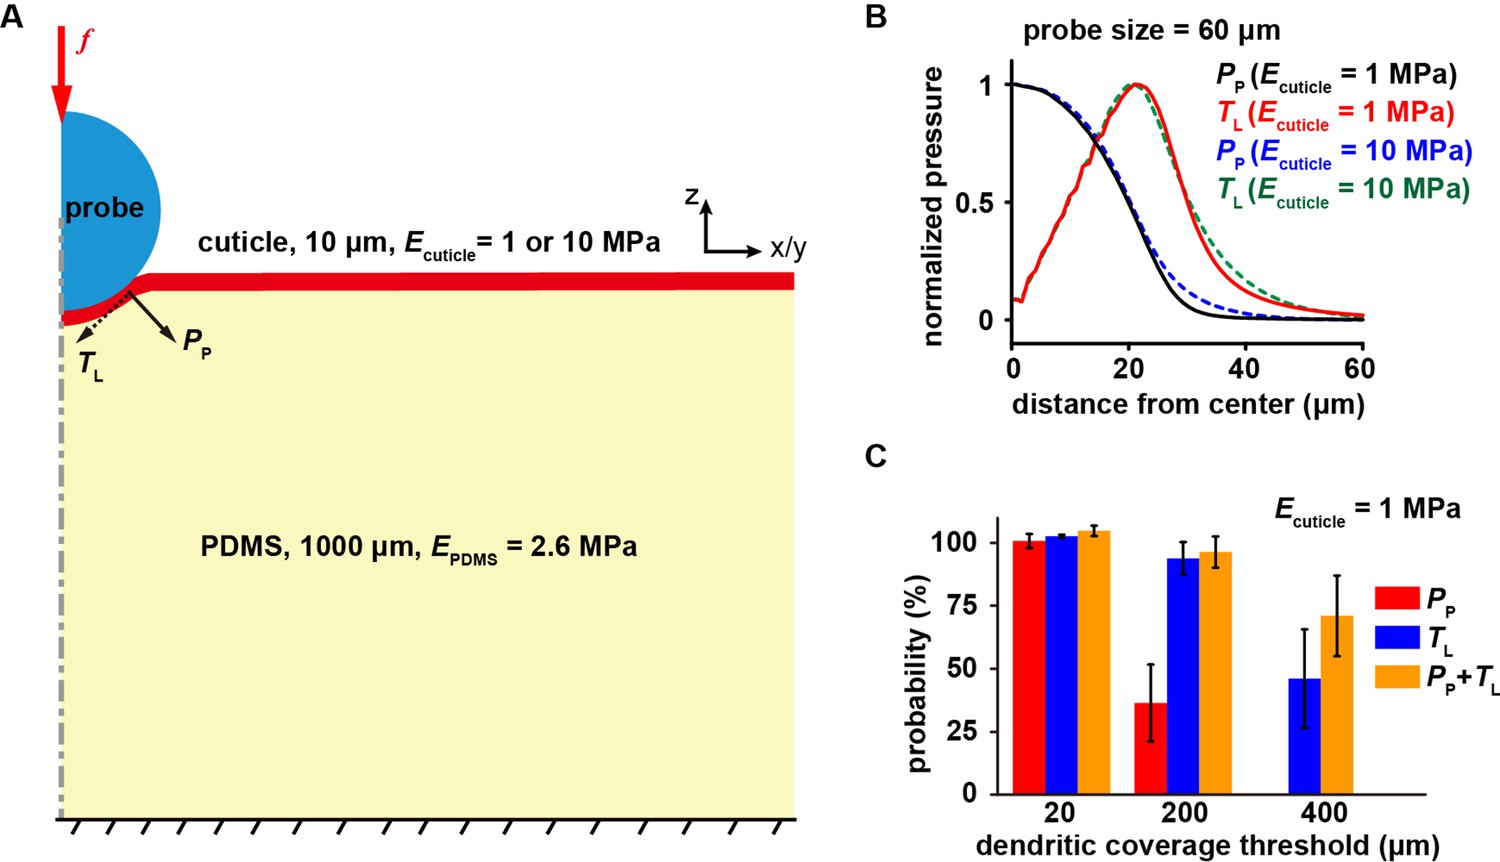
Mechanical modeling analysis on the distribution of PP and TL.
(A) Cartoon schematics for the mechanical model used in the finite element analysis. PP, pressure perpendicular to the cuticle surface. TL, tension parallel with the cuticle surface. (B) Representative line profiles (normalized) showing the distribution of PP and TL versus the distance to the center of the force probe. Two values of cuticle elastic modulus (1 and 10 MPa) were used to evaluate their effects on the simulation results. We found that in these two cases, the distributions of PP and TL were nearly unchanged. Indentation depth: 20 μm. (C) The activation probability (Ecuticle = 1 MPa) in three conditions: (1) only sensitive to PP; (2) only sensitive to TL; (3) sensitive to both PP and TL. The dendritic coverage threshold (Cd) is the minimal length of activated dendrites that could excite neuronal responses. For each condition, 100 random positions were simulated for each cell (n=5 cells).
-
Figure 4—figure supplement 1—source data 1
Numerical data for Figure 4—figure supplement 1.
- https://cdn.elifesciences.org/articles/76574/elife-76574-fig4-figsupp1-data1-v3.zip
Figure 5
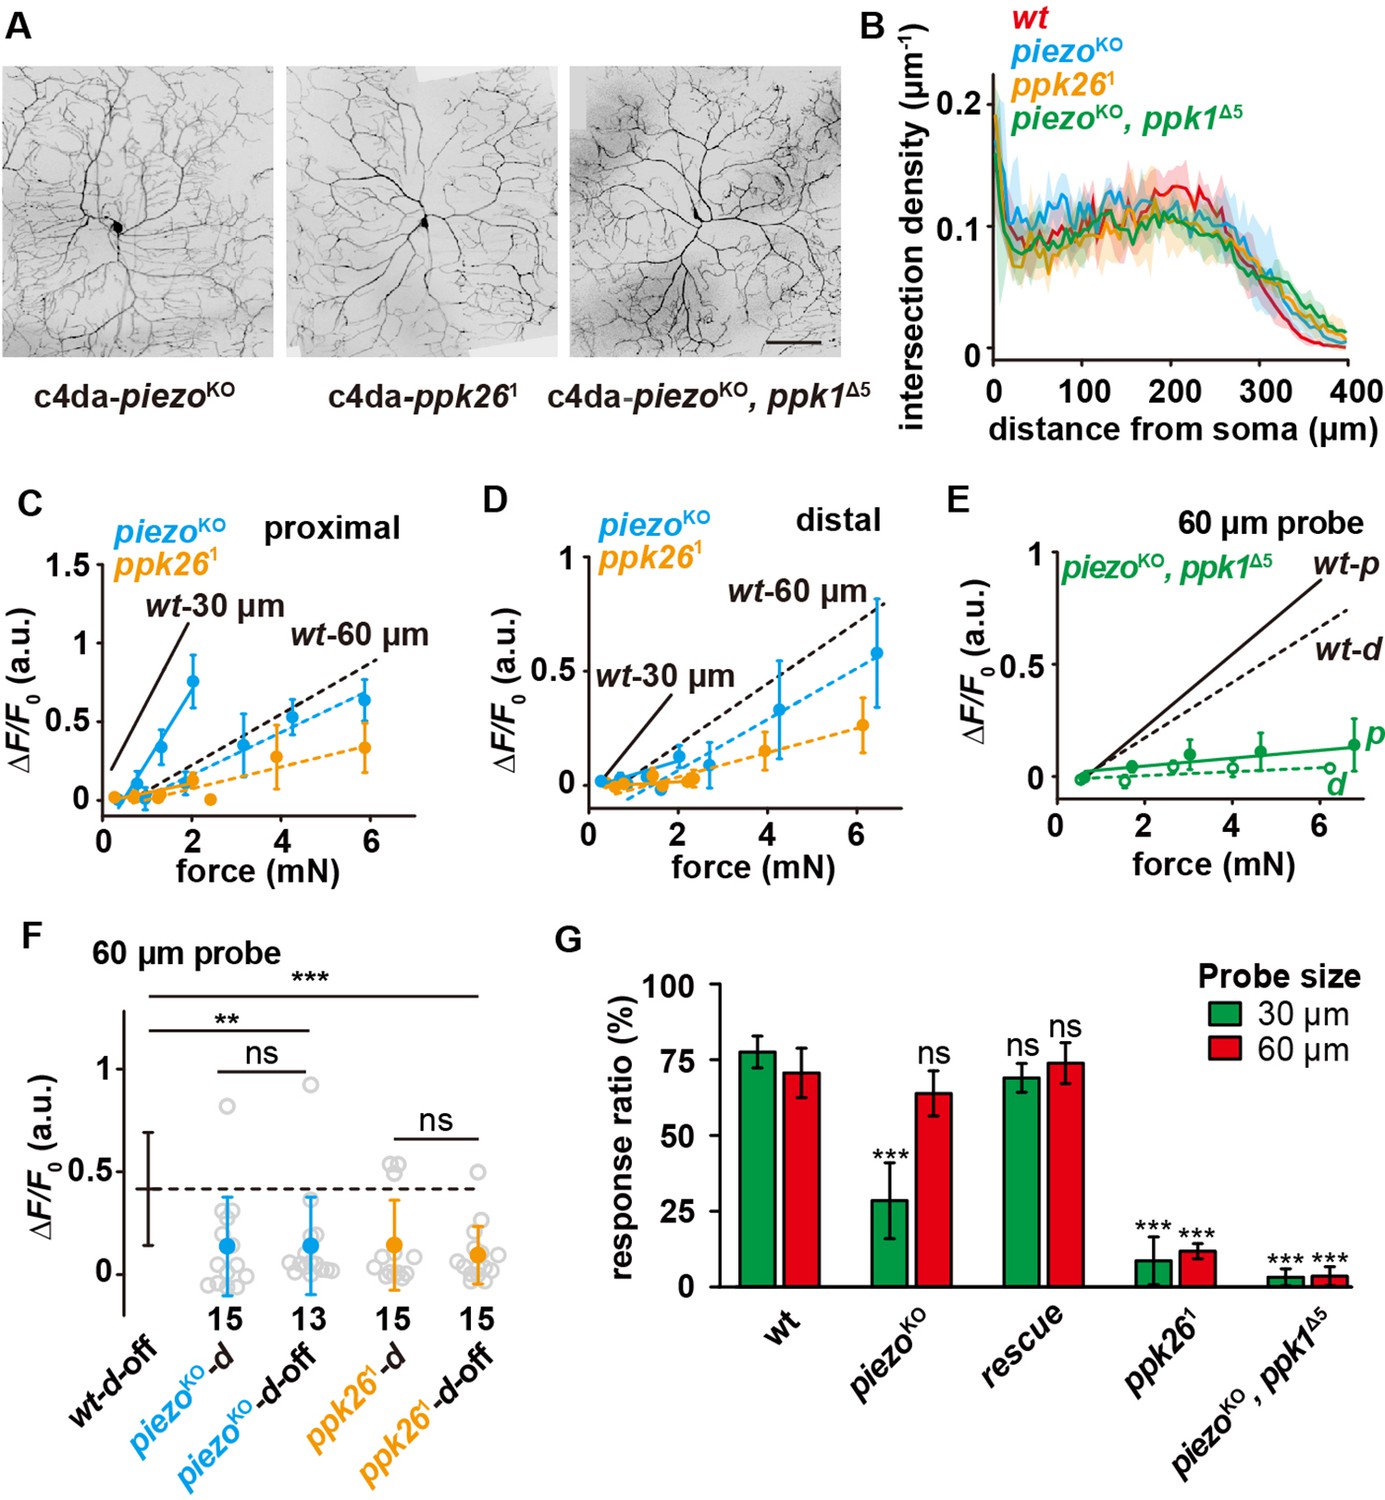
The differential contributions of Piezo and Ppk1/Ppk26 to the mechanosensitivity of c4da.
(A) Representative images of c4da-piezoKO (piezoKO; ppk-cd4-tdtom/+), c4da-ppk261 (uas-cd4-tdtom/ppk-gal4; ppk261), c4da-piezoKO, ppkΔ5 (piezoKO, ppkΔ5; ppk-cd4-tdtom/+). Scale bar: 100 μm. (B) Modified Sholl analysis on the morphologies of c4da-wt (n=5), c4da-piezoKO (n=3), c4da-ppk261 (n=3) and c4da-piezoKO, ppkΔ5 (n=3). The shadow areas represented standard deviations. (C–D) The responses of c4da-piezoKO and c4da-ppk261 (ΔF/F0) to the proximal (C) and distal (D) stimuli delivered using the probes of two different sizes. Solid lines: 30 μm probe. Dashed lines: 60 μm probe. piezoKO: piezoKO; ppk-gal4/20×uas-ivs-gcamp6s (n=12 cells). ppk261: ppk-gal4/20×uas-ivs-gcamp6s; ppk261 (n=12 cells). (E) The responses of c4da-piezoKO, ppkΔ5 (ΔF/F0) to the proximal and distal stimuli delivered using a 60 μm probe. Solid lines: proximal stimuli. Dashed lines: distal stimuli. Genotype: piezoKO, ppk1Δ5: piezoKO, ppk1Δ5; ppk-gal4/20×uas-ivs-gcamp6s (n=8 cells). (F) The responses of c4da-piezoKO and c4da-ppk261 (ΔF/F0) to the d-off stimuli (4 mN) delivered using a 60 μm probe. The numbers of cells were indicated below the scattered data points. Mann Whitney U test was used. **: p<0.01. ***: p<0.001. ns: no significance. (G) The behavioral responses of the c4da-piezoKO, c4da-rescue, c4da-ppk261 and c4da-piezoKO, ppkΔ5 larvae to mechanical poking using the probes of different sizes. wt: w1118. piezoKO: piezoKO; +/+. rescue: piezoKO;uas-gfp-piezo/ppk-gal4. ppk261: +/+; ppk261. piezoKO, ppk1Δ5: piezoKO, ppk1Δ5; +/+. piezoKO larvae: 30 μm probe (n=70 larvae from three experiments), 60 μm probe (n=63 larvae from three experiments). rescue larvae: 30 μm probe (n=50 larvae from three experiments), 60 μm probe (n=47 larvae from three experiments). ppk261 larvae: 30 μm probe (n=72 larvae from three experiments), 60 μm probe (n=93 larvae from three experiments). piezoKO, ppk1Δ5 larvae: 30 μm probe (n=61 larvae from three experiments), 60 μm probe (n=60 larvae from three experiments). One-way ANOVA test was used for the comparison among different genotypes. ***: p<0.001. ns: no significance. In panels (C), (D) and (E) data were presented as mean ± sem. In panels (F) and (G), data were presented as mean ± std. In panels (C), (D), (E), (F) and (G), the data from c4da-wt were provided for comparison.
-
Figure 5—source data 1
Numerical data for Figure 5.
- https://cdn.elifesciences.org/articles/76574/elife-76574-fig5-data1-v3.zip
Figure 6 with 2 supplements
Active signal propagation in the dendrites of c4da.
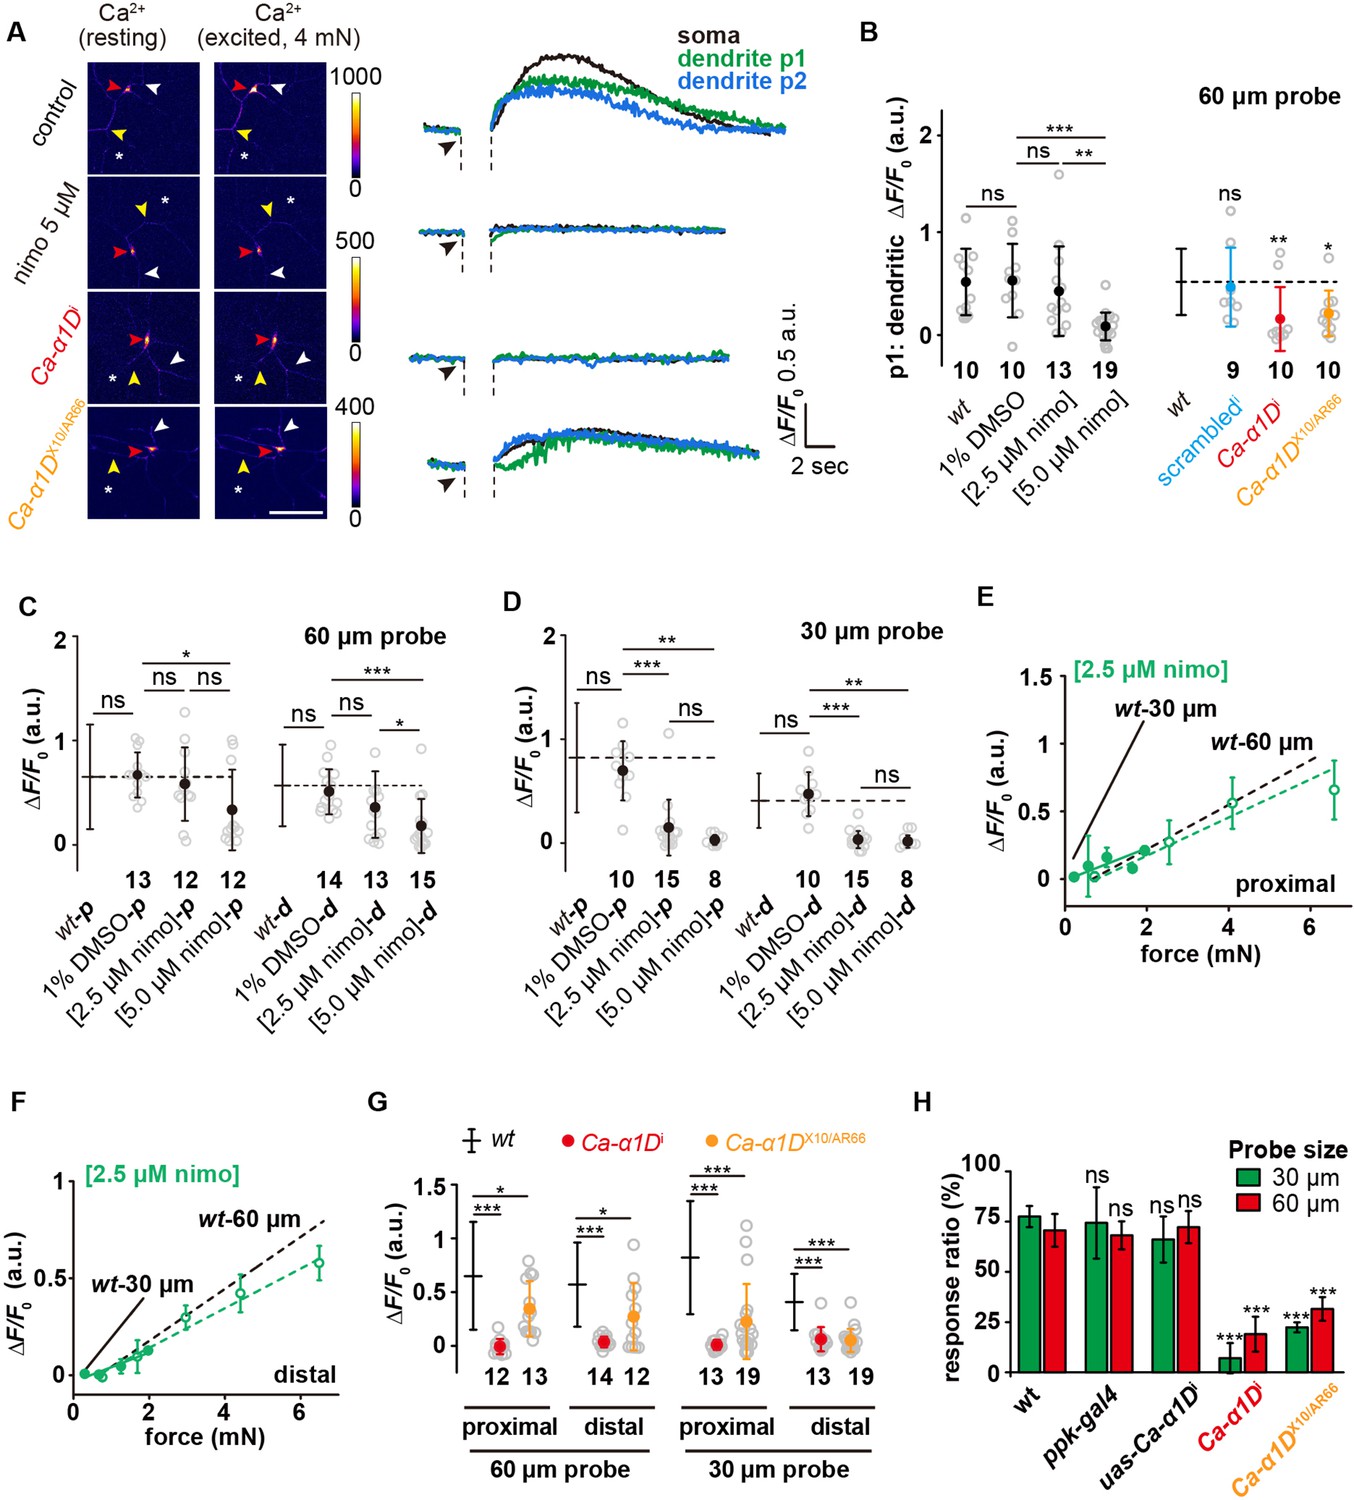
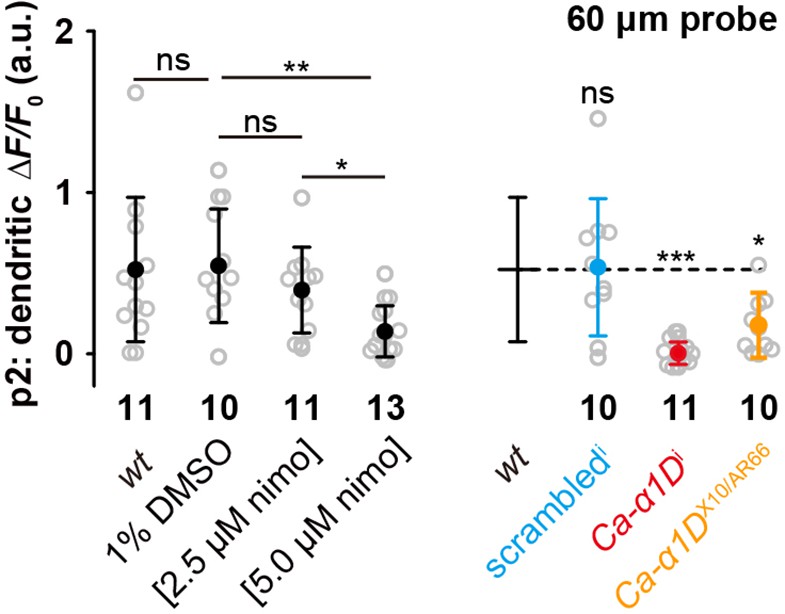
(A) Representative images and curves showing the responses (ΔF/F0) of the soma (red arrowhead), the homolateral dendrite (position p1: yellow arrowhead) and contralateral dendrite (position p2: white arrowhead) of c4da-wt, nimodipine-treated c4da-wt, c4da-Ca-α1Di and Ca-α1DX10/AR66 to the stimuli (4 mN, 60 μm probe). The asterisk indicated the force application point. Scale bar: 50 μm. C4da-wt: ppk-gal4/+; ppk-cd4-tdtom/20×uas-ivs-gcamp6s. Ca-α1Di: ppk-gal4/20×uas-ivs-gcamp6s; ppk-cd4-tdtom/ uas-Ca-α1Di. Ca-α1DX10/AR66: Ca-α1DX10/ Ca-α1DAR66; ppk-gal4/20×uas-ivs-gcamp6s. (B) Statistical quantification of calcium increases in the homolateral dendrites in response to the stimuli (4 mN, 60 μm probe). The genotypes were the same as those shown in panel (A). Mann Whitney U test was used for the comparison between c4da-wt and the mutants. Kruskal Wallis test was used for the comparison among the groups with drug treatment. ***: p<0.001. **: p<0.01. ns: no significance. (C) and (D) The responses (ΔF/F0) of nimodipine treated c4da-wt to the proximal and distal stimuli from the probes of different sizes. (C): 60 μm probe stimuli. (D) : 30 μm probe stimuli. Kruskal Wallis test was used. ***: p<0.001. **: p<0.01. *: p<0.05. ns: no significance. (E) and (F) The responses (ΔF/F0) of c4da-wt (n=10 cells) treated with 2.5 μM nimodipine to the proximal (E) and distal (F) stimuli delivered using the probes of two different sizes. Solid lines: 30 μm probe. Dashed lines: 60 μm probe. (G) The responses (ΔF/F0) of c4da-Ca-α1Di and c4da-Ca-α1DX10/AR66 to the stimuli applied at different dendritic regions (proximal and distal) and delivered using the probes of two different sizes (60 μm: 4 mN, 30 μm: 1.5 mN). (H) The behavioral responses of the c4da-Ca-α1Di larvae to mechanical poking using the probes of two different sizes. wt: w1118. ppk-gal4: ppk-gal4; +/+. uas-Ca-α1Di: +/+; uas-Ca-α1Di. Ca-α1Di: ppk-gal4/+; uas-Ca-α1Di /+. Ca-α1DX10/AR66: Ca-α1DX10/ Ca-α1DAR66; +/+. uas-Ca-α1Di larvae: 30 μm probe (n=61 larvae from three experiments), 60 μm probe (n=61 larvae from three experiments). Ca-α1Di larvae: 30 μm probe (n=56 larvae from three experiments), 60 μm probe (n=60 larvae from three experiments). Ca-α1DX10/AR66 larvae: 30 μm probe (n=43 larvae from three experiments), 60 μm probe (n=47 larvae from three experiments). One-way ANOVA test was used for the comparison among different genotypes. ***: p<0.001. ns: no significance. In panels (B), (C), (D), (G) and (H), data were presented as mean ± std. In panels (B), (C), (D) and (G), the numbers of cells were indicated below the scattered data points. In panels (E) and (F), data were presented as mean ± sem. In panels (C), (D), (E), (F), (G) and (H), the corresponding data from c4da-wt were provided for comparison.
-
Figure 6—source data 1
Numerical data for Figure 6.
- https://cdn.elifesciences.org/articles/76574/elife-76574-fig6-data1-v3.zip
Figure 6—figure supplement 1
Statistics quantification of the calcium increase in the contralateral dendrites in response to the force stimuli.
C4da-wt: ppk-gal4/+; ppk-cd4-tdtom/20×uas-ivs-gcamp6s. Scrambledi: ppk-gal4/20×uas-ivs-gcamp6s, ppk-cd4-tdtom/uas-Scrambledi. Ca-α1Di: ppk-gal4/20×uas-ivs-gcamp6s; ppk-cd4-tdtom/uas-Ca-α1Di. Ca-α1DX10/AR66: Ca-α1DX10/Ca-α1DAR66; ppk-gal4/20×uas-ivs-gcamp6s. The force stimuli (4 mN) were applied using a 60 μm probe. The numbers of cells were indicated below the scattered data points. Mann Whitney U test was used for the comparison between c4da-wt and the mutants. Kruskal Wallis test was used for the comparison among the groups with drug treatment. *: p<0.05. **: p<0.01. **: p<0.001. ns: no significance.
-
Figure 6—figure supplement 1—source data 1
Numerical data for Figure 6—figure supplement 1.
- https://cdn.elifesciences.org/articles/76574/elife-76574-fig6-figsupp1-data1-v3.zip
Figure 6—figure supplement 2
The expression and localization of Ca-α1D in vivo.
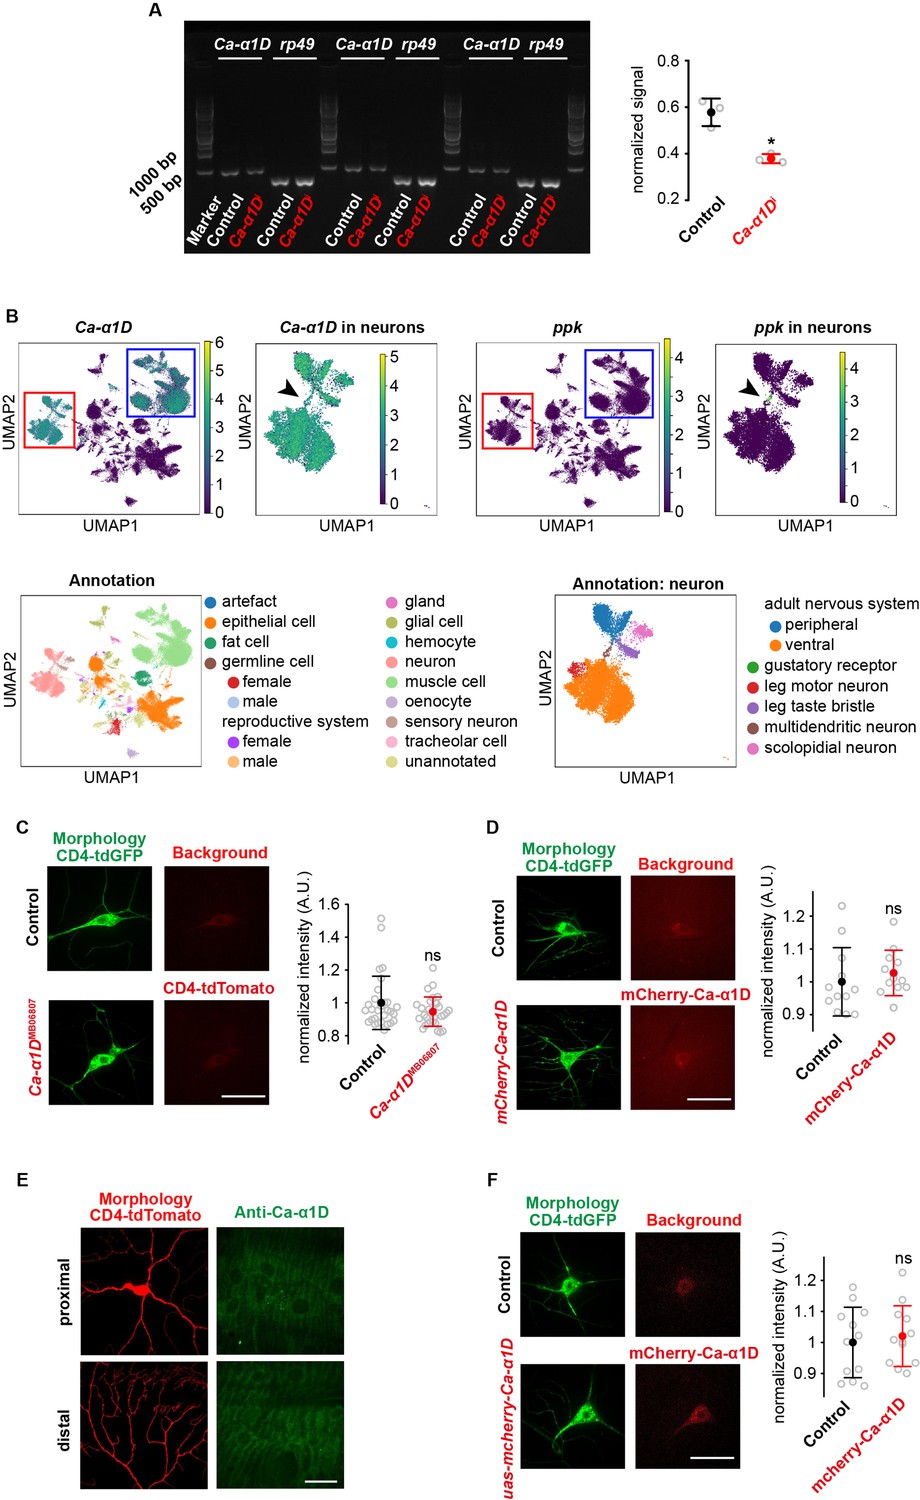
(A) The expression level of Ca-α1D in wild-type and Ca-α1Di was examined using RT-PCR. Because Ca-α1D expressed in various types of neurons and the number of c4da in the whole animal was small, we knocked down the expression of Ca-α1D in the whole animal using tub-gal4. Using RT-PCR, we found that the expression level of Ca-α1D was significantly reduced in the Ca-α1Di strain. The expression of rp49 was used as the reference for normalization. Note that the same strain was also used as a knockdown mutant in other functional studies (Terada et al., 2016; Basak et al., 2021). (B) The expression pattern of Ca-α1D analyzed based on the FlyCellAtlas (Li et al., 2022) single-cell RNA-sequencing datasets We found that Ca-α1D mainly expressed in excitable cells, such as neurons (red square) and muscle cells (blue square). In particular, it expressed in the multidendritic neurons that specifically expressed ppk1 (black arrowhead). (C) To confirm the expression of Ca-α1D in c4da, we examined the Mi{ET1}Ca-α1DMB06807 line. However, no significant signal was observed. Control: ppk-cd4-tdgfp/+; uas-cd4-tdtom/+. Ca-α1DMB06807: Mi{ET1}Ca-α1DMB06807/ppk-cd4-tdgfp; uas-cd4-tdtom/+. n=30 cells for each genotype. (D) We generated a transgenic strain that expressed mCherry-Ca-α1D under the endogenous promoter of Ca-α1D. However, no signal was observed (n=12 cells). Control: ppk-cd4-tdgfp/+; +/+. mcherry-Ca-α1D: ppk-cd4-tdgfp/+;mcherry-Ca-α1D. (E) We used a previously reported antibody (see Materials and Methods) to examine the localization of Ca-α1D. However, no signal was observed. (F) We generated a transgenic strain to express mCherry-Ca-α1D under the control of the ppk-gal4 strain. However, no signal was observed (n=12 cells). Control: ppk-cd4-tdgfp/+; ppk-gal4/+. uas-mcherry-Ca-α1D: ppk-cd4-tdgfp/+; 10×uas-mcherry-Ca-α1D/ppk-gal4. In panel C, D and F, scale bar: 30 μm. In panel (E), scale bar: 100 μm. In panel (A, C, D and F), data were presented as mean ± std. Student’s t test was used for statistical analysis. *: p<0.05; ns: no significance.
-
Figure 6—figure supplement 2—source data 1
Gel image and numerical data for Figure 6—figure supplement 2.
- https://cdn.elifesciences.org/articles/76574/elife-76574-fig6-figsupp2-data1-v3.zip
Figure 7
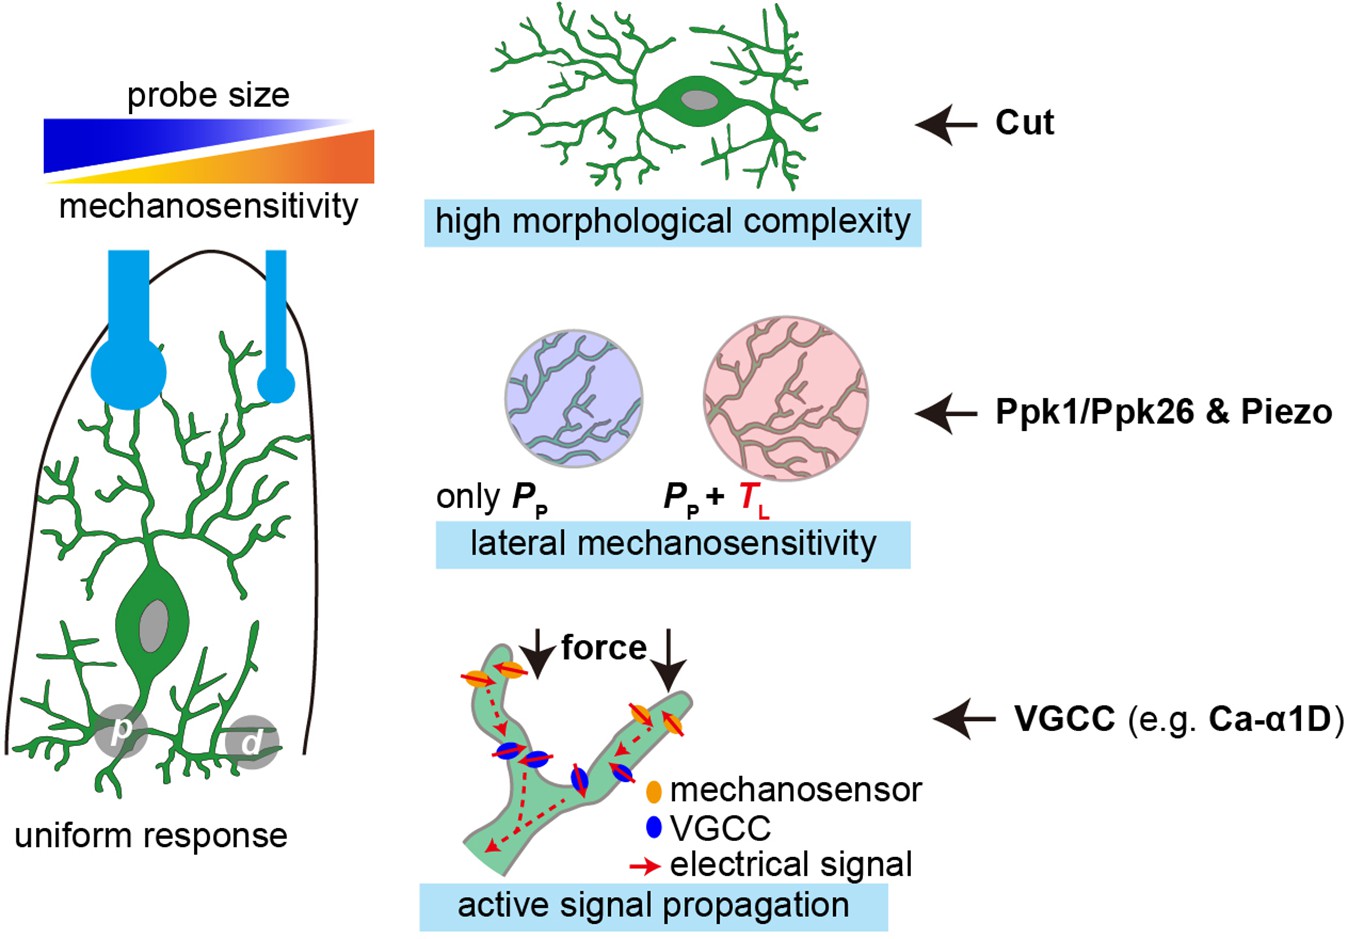
The cellular mechanisms that facilitate the mechanosensory features of c4da.
Left panel: c4da showed a greater sensitivity to localized poking forces and made uniform responses to the forces applied at different dendritic regions (p) proximal stimuli. (d) distal stimuli. Right panel: the key cellular mechanisms that facilitate the sensory features of c4da and the important contributing molecules.
Author response image 1
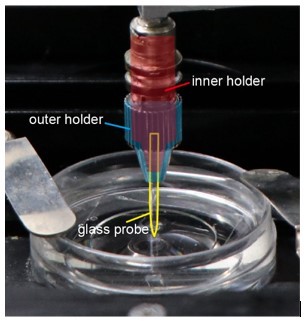
The schematics for how the probe was mounted.
As shown in the picture, the force probe was firmly mounted in the double-layered holder. These glass probes were short and solid, so they would not be bent during the experiments.
Author response image 2
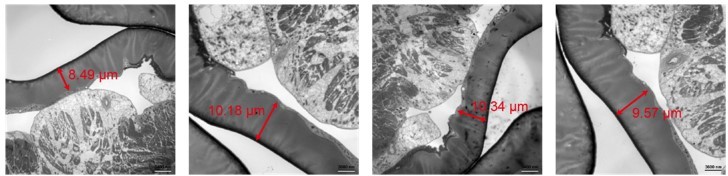
Representative TEM micrographs on Drosophila larval fillet preparation.
The thickness of the cuticle was indicated. The samples were prepared using high pressure freezing and freeze substitution as previously described9.
Author response image 3
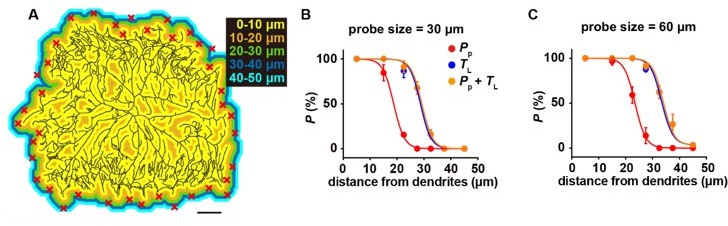
The mechanosensitivity to lateral tension increases the probability of cell activation.
(A) The representative color map for the distance to the nearest dendrite, in which the distance was labeled by different colors. Scale bar, 100 μm. Random positions were chosen (the red crosses) as the force application points in the simulations (n=5 cells, 30 positions for each cell). (B-C) The plots of the cell activation probability versus the distance from a dendrite. Two types of probes were simulated, i.e. 30 μm (B) and 60 μm (C). Three conditions were considered: (1) only sensitive to PP; (2) only sensitive to TL; (3) sensitive to both PP and TL. The dendritic coverage threshold set was 20 μm. In panel B and C, data were presented as mean±std.
Videos
Video 1
The representative response of a c4da cell to the 4 mN force stimulus.
The asterisk indicated the force application point and the white arrowhead indicated the soma.
Additional files
Download links
A two-part list of links to download the article, or parts of the article, in various formats.
Downloads (link to download the article as PDF)
Open citations (links to open the citations from this article in various online reference manager services)
Cite this article (links to download the citations from this article in formats compatible with various reference manager tools)
Drosophila mechanical nociceptors preferentially sense localized poking
eLife 11:e76574.
https://doi.org/10.7554/eLife.76574


