Cd59 and inflammation regulate Schwann cell development
- Neuroscience Graduate Program, University of Virginia, United States
- Program in Fundamental Neuroscience, University of Virginia, United States
- Department of Biology, University of Virginia, United States
- Department of Cell Biology, University of Virginia, United States
Figures
Figure 1 with 1 supplement
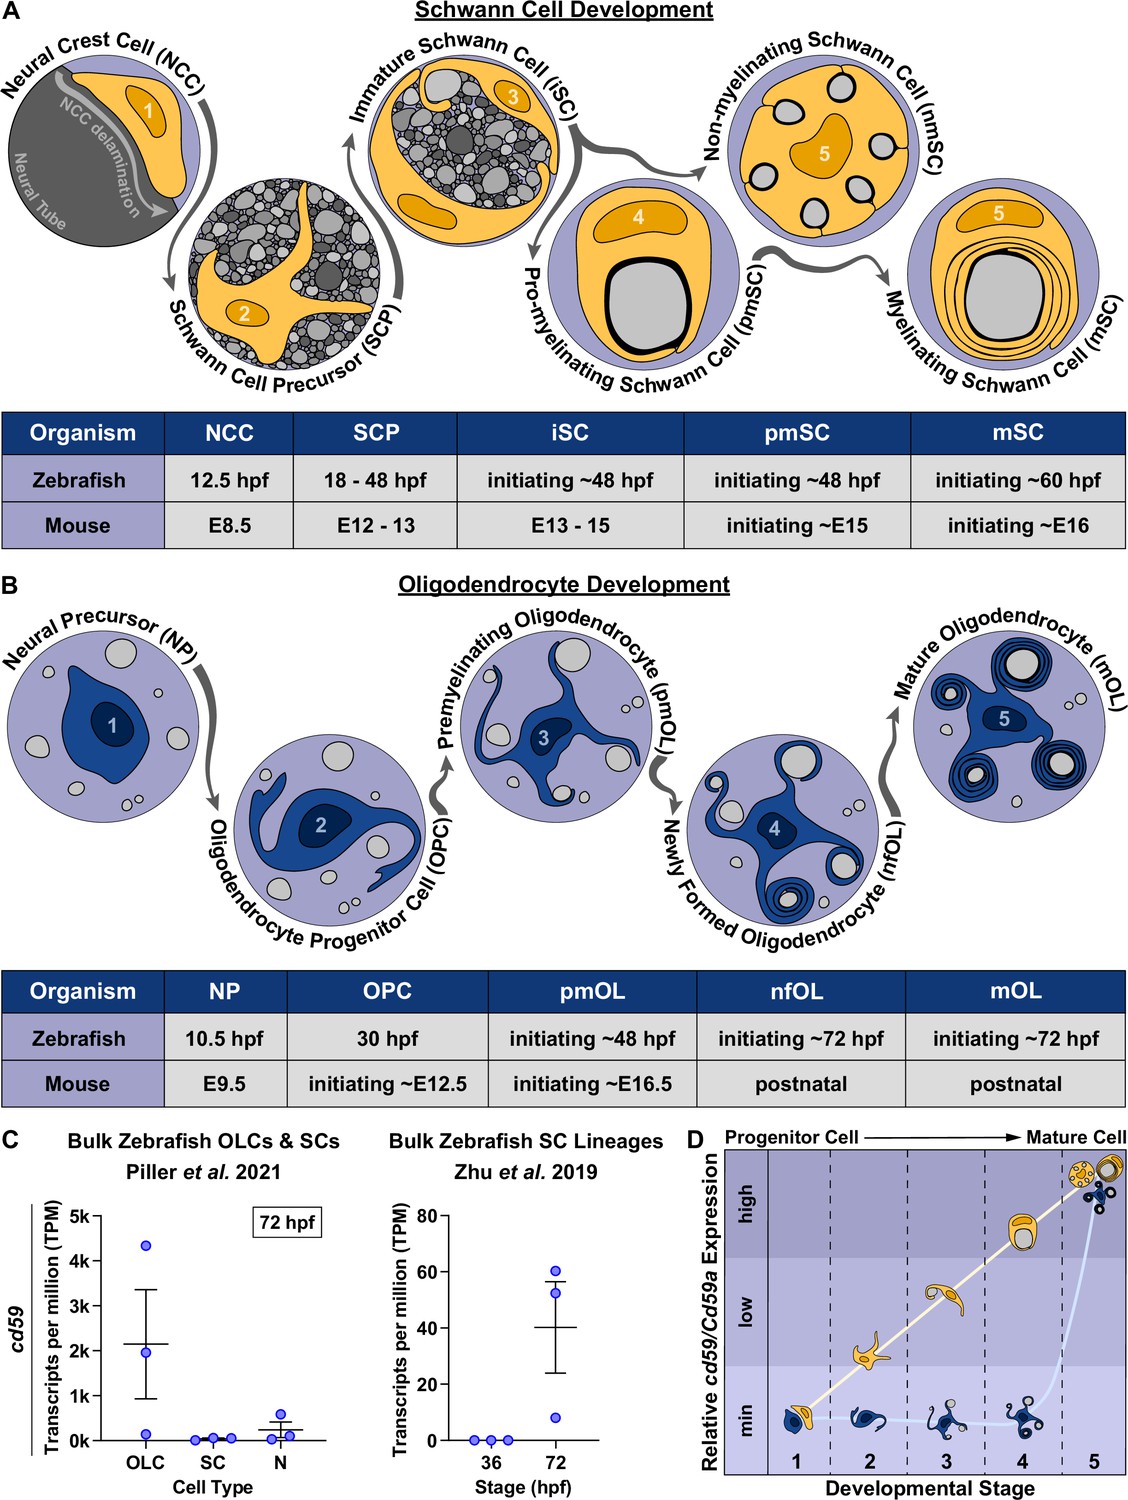
cd59 is expressed in myelinating glial cells during nervous system development.
(A) Timeline of Schwann cell (SC) (orange) development (top panel). SC developmental stages for zebrafish (hours post fertilization [hpf]) and mice (embryonic day [E]) are indicated in the bottom panel. (B) Timeline of oligodendrocyte (OL) (blue) development. OL developmental stages for zebrafish (hpf) and mice (E and postnatal day) are indicated in the bottom panel. (C) Scatter plot of cd59 expression (TPM) in oligodendrocyte lineage cells (OLCs), SCs, and neurons (N) at 72 hpf (left; mean ± SEM: OLC: 2145.1 ± 1215.1; SC: 40.1 ± 16.3; N: 240.5 ± 173.3; dot = replicate) as well as SCs at 36 and 72 hpf (right; mean ± SEM: 36 hpf: 0.0 ± 0.0, 72 hpf: 40.2 ± 16.3; dot = replicate). (D) Schematic of the relative cd59/Cd59a expression in developing SCs (orange) and OLs (blue) determined from RNAseq analysis in Figure 1—figure supplement 1. Developmental stage numbers correspond with stages indicated in (A) and (B). Artwork created by Ashtyn T. Wiltbank with Illustrator (Adobe) based on previous schematics and electron micrographs published in Ackerman and Monk, 2016; Cunningham and Monk, 2018; Jessen and Mirsky, 2005.
-
Figure 1—source data 1
Source data for cd59 bulk, RNAseq expression depicted in Figure 1C.
Data contributed to scatter plot of cd59 expression (TPM) in oligodendrocyte lineage cells (OLCs), Schwann cells (SCs), and neurons (N) at 72 hours post fertilization (hpf) (left; mean ± SEM: OLC: 2145.1 ± 1215.1, SC: 40.1 ± 16.3; N: 240.5 ± 173.3; data point = replicate) as well as SCs at 36 and 72 hpf (right; mean ± SEM: 36 hpf: 0.0 ± 0.0, 72 hpf: 40.2 ± 16.3; data point = replicate).
- https://cdn.elifesciences.org/articles/76640/elife-76640-fig1-data1-v1.xlsx
Figure 1—figure supplement 1
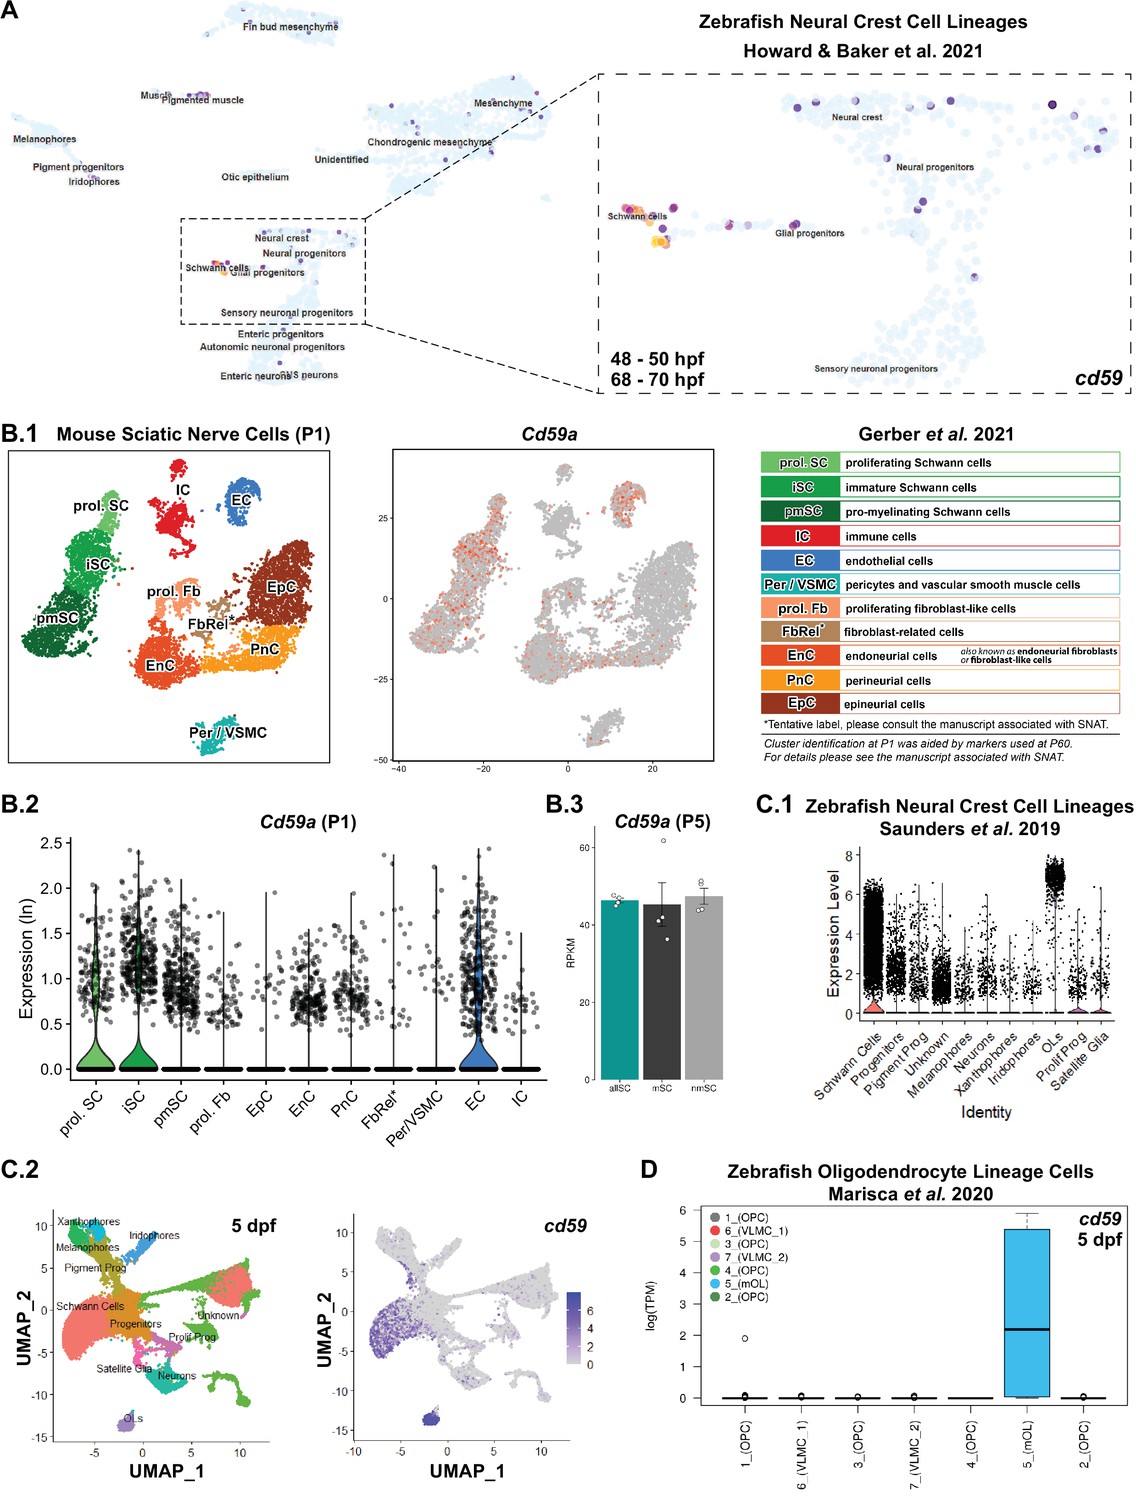
Myelinating glial cell cd59/Cd59a expression from bulk and scRNAseq.
(A) Uniform manifold approximation and projection (UMAP) of cd59 expression in developing, zebrafish neural crest cell (NCC) lineages (48–50 hours post fertilization [hpf] and 68–70 hpf; Howard et al., 2021). (B.1) t-SNE plot and (B.2) violin plot of Cd59a expression [natural log(ln)] in developing, mouse sciatic nerve cells (postnatal day 1 [P1]) (Gerber et al., 2021). (B.3) Bar chart of Cd59a expression (RPKM) in developing, mouse sciatic nerve cells (P5) (Gerber et al., 2021). (C.1) Violin plot and (C.2) UMAP of cd59 expression in developing, zebrafish NCC lineages (5 days post fertilization [dpf]; Saunders et al., 2019). (D) Bar chart of cd59a expression [log(TPM)] in zebrafish, myelinating oligodendrocyte lineage cells (OLCs) (5 dpf; Marisca et al., 2020). All panels were prepared with the web applications included in the noted publications except for (C.1 and C.2), which were assembled by our lab.
Figure 2 with 2 supplements

cd59 is expressed in Schwann cells (SCs) and oligodendrocytes (OLs).
(A) Bright-field images of whole-mount chromogenic in situ hybridization (CISH) showing cd59 expression (purple) in the heart, pancreas, dorsal and ventral oligodendrocyte lineage cells (OLCs) (dOLCs and vOLCs, respectively; filled arrows), and posterior lateral line nerve (pLLN) SCs (empty arrows) at 3 days post fertilization (dpf). Schematic (right panel) indicates location of spinal cord, notochord, and pLLN in transverse section. (B) Fluorescent in situ hybridization (FISH) (RNAscope; ACD) showing cd59 expression (cyan) in sox10:megfp-positive, pLLN SCs (cd59-positive orange cells indicated by empty arrows), and spinal cord OLs (cd59-positive orange cells indicated by filled arrows) at 3 dpf in transverse sections (top row). Representative image (top row) displays one SC on each pLLN (left and right empty arrows) as well as multiple OLs in the spinal cord (filled arrows). Images were acquired with confocal imaging. (C) Imaris renderings of the confocal images shown in (B), including the full image (left panel). From the full image (left panel, C), a single SC (indicated with the open magenta arrow and enlarged in the middle panel, C’) and a single OLC (indicated with the filled magenta arrow and enlarged in the right panel, C’’) illustrate the cd59 puncta localized within the myelinating cells. (D) Mosaic labeling showing a cd59:tagrfp-positive OL in the spinal cord (left) and two SCs on the pLLN (right) at 3 dpf. (E) Immunofluorescence (IF) showing cd59:tagrfp expression (cyan) in Sox10-positive SCs (orange) along the pLLN at 3 and 7 dpf (left and right panels, respectively). Double-positive cells are indicated with white arrows. White dashed lines outline the pLLN. Sox10-positive pigment cells outside of the dashed lines were not included in the analysis. (F) Scatter plot of percent cd59:tagrfp-positive SCs on the pLLN from 3 to 7 dpf (mean ± SEM: 3 dpf: 9.4 ± 1.5; 4 dpf: 10.0 ± 1.0; 5 dpf: 7.8 ± 1.2; 6 dpf: 4.4 ± 0.6; 7 dpf: 5.8± 0 .6; p-values: 3 vs. 6 dpf: p=0.0126, 4 vs. 6 dpf: p=0.0095, 4 vs. 7 dpf: Pp0.0477; dot = 1 fish). Data collected from somites 11–13 (~320 µm) and normalized to units per 100 µm. These data were compared with a one-way ANOVA with Tukey’s post-hoc test using GraphPad Prism. All fluorescent images were acquired with confocal imaging. Scale bars: (A) lateral view, 100 µm; transverse section, 25 µm; (B, D) 10 µm; (E) 25 µm. Artwork created by Ashtyn T. Wiltbank with Illustrator (Adobe).
-
Figure 2—source data 1
Source data for the quantification of percent cd59:tagrfp-positive cells per 100 µm depicted in Figure 2E.
Data contributed to scatter plot of percent cd59:tagrfp-positive Schwann cells (SCs) on the posterior lateral line nerve (pLLN) from 3 to 7 days post fertilization (dpf) (mean ± SEM: 3 dpf: 9.4 ± 1.5; 4 dpf: 10.0 ± 1.0; 5 dpf: 7.8 ± 1.2; 6 dpf: 4.4 ± 0.6; 7 dpf: 5.8 ± 0.6; p-values: 3 vs. 6 dpf: p=0.0126, 4 vs. 6 dpf: p=0.0095, 4 vs. 7 dpf: p=0.0477; data point = 1 fish). These data were compared with a one-way ANOVA with Tukey’s post-hoc test using GraphPad Prism. Data collected from somites 11–13 (~320 μm) and normalized to units per 100 μm.
- https://cdn.elifesciences.org/articles/76640/elife-76640-fig2-data1-v1.xlsx
Figure 2—figure supplement 1
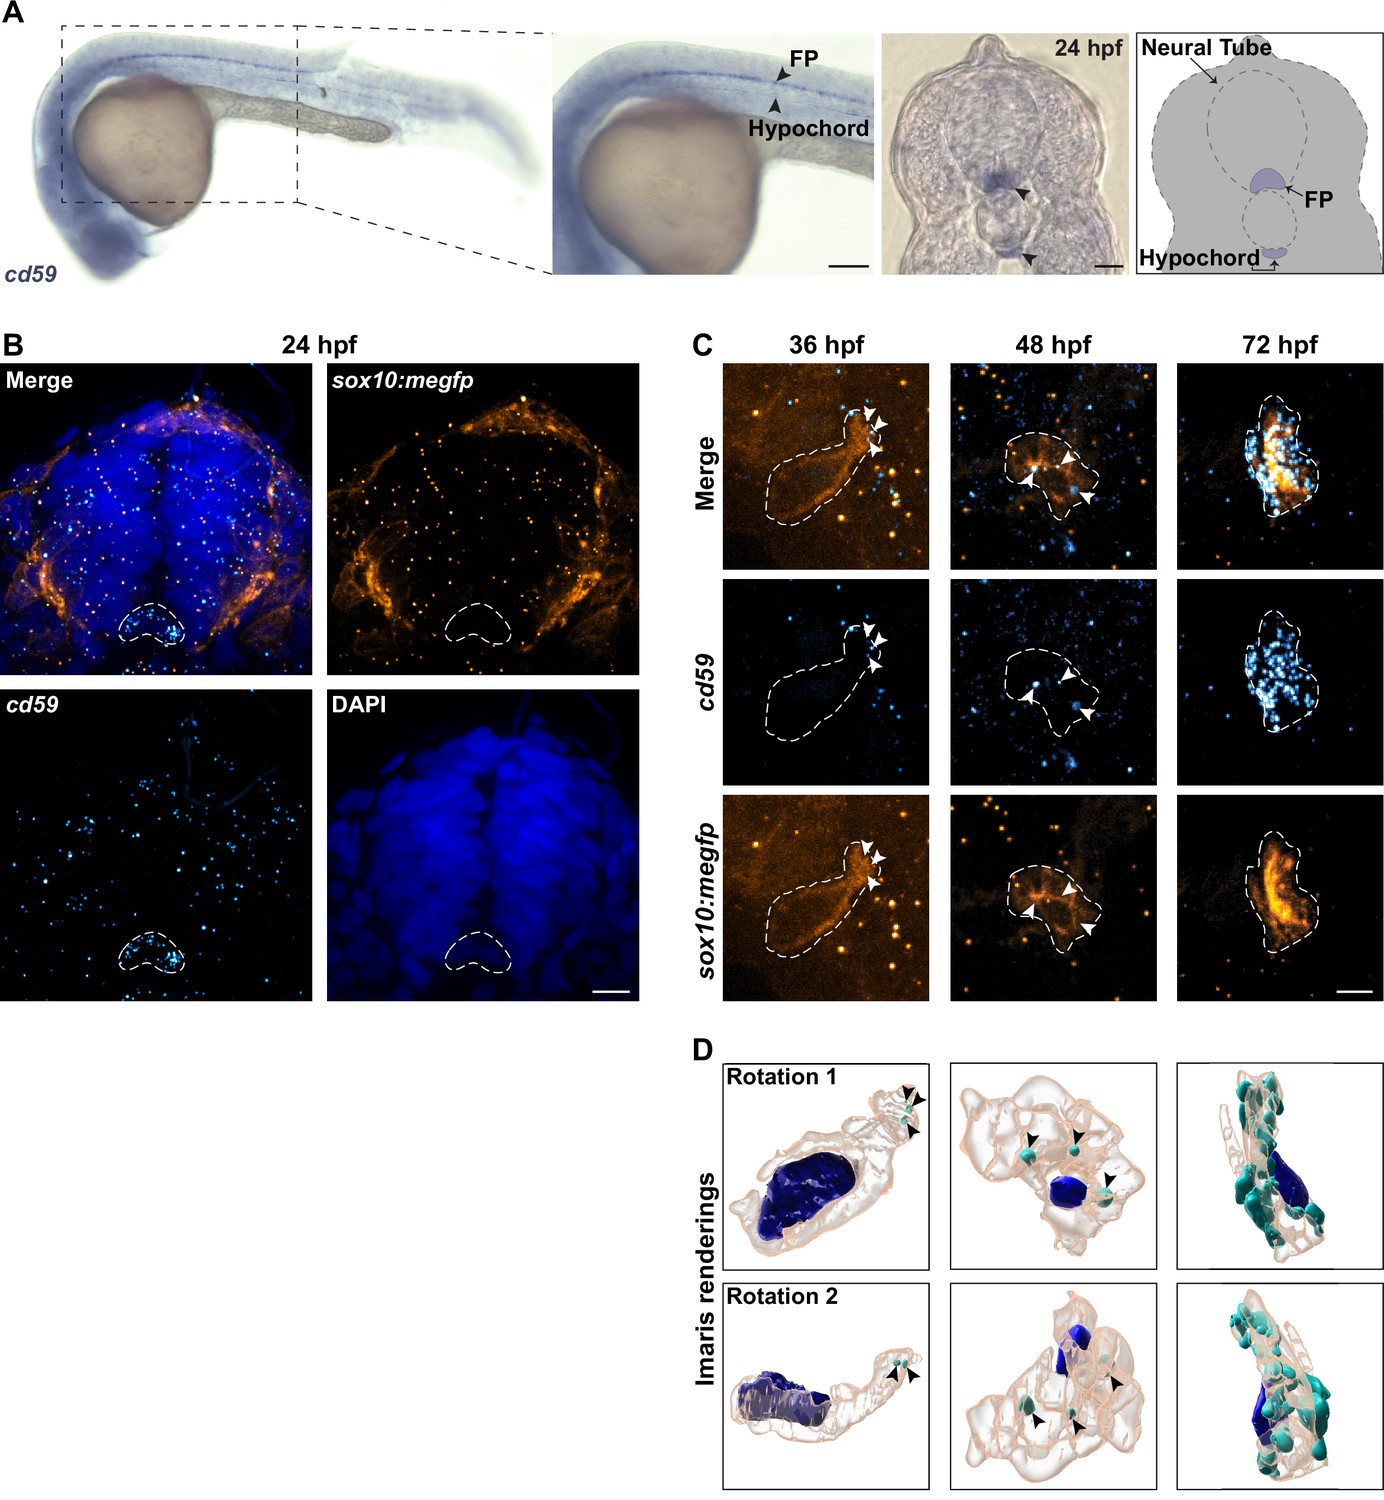
cd59 is expressed in the floorplate, hypochord, and developing Schwann cell (SCs).
(A) Bright-field images of whole-mount chromogenic in situ hybridization (CISH) showing cd59 expression (purple) in the floorplate (FP) and hypochord at 24 hours post fertilization (hpf). Schematic (right panel) indicates location of cd59 expression (purple) in FP, hypochord, and neural tube in transverse section. (B) Fluorescent in situ hybridization (FISH) (RNAscope; ACD) showing cd59 expression (cyan) in the FP (outlined in white dashed lines) and lack of expression in sox10:megfp-positive neural crest cells (NCCs) (orange) in transverse sections (z projection of 20 µm). DAPI-positive nuclei indicated in blue. (C) FISH (RNAscope; ACD) showing cd59 expression (cyan) in sox10:megfp-positive (orange) SC precursors (SCPs) at 36 hpf, immature SCs (iSCs) at 48 hpf, and SCs at 72 hpf on the posterior lateral line nerve (pLLN). Representative images each display a transverse section (z projection of 20 µm) of single SC on the pLLN. (D) Imaris renderings show cd59 puncta that are localized within the SC at each stage. Two viewpoints are provided to better visualize the location of the puncta. All florescent images were acquired with confocal imaging. Scale bars: (A) lateral view, 100 µm; transverse section, 25 µm; (B) 10 µm; (C) 5 µm. Artwork created by Ashtyn T. Wiltbank with Illustrator (Adobe).
Figure 2—figure supplement 2
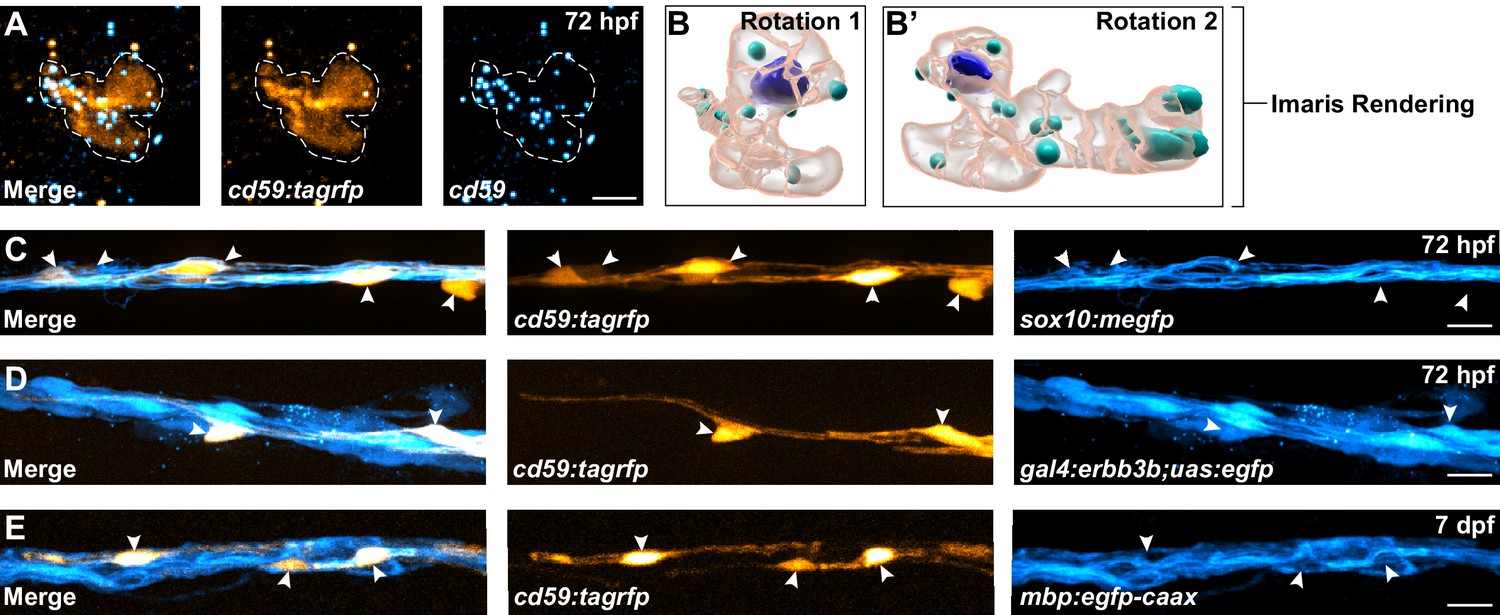
cd59:tagrfp-positive Schwann cells (SCs) express canonical SC markers.
(A) Fluorescent in situ hybridization (FISH) (RNAscope; ACD) showing cd59 expression (cyan) in cd59:tagrfp-positive SC (orange) along the posterior lateral line nerve (pLLN) at 72 hours post fertilization (hpf). Representative image displays a transverse section (z projection of 20 µm) of single SC on the pLLN. (B) Imaris renderings show cd59 puncta that are localized within the SC. Two viewpoints (B, B’) are provided to better visualize the location of the puncta. (C) In vivo imaging showing cd59:tagrfp- (orange), sox10:megfp- (cyan) positive SCs on the pLLN at 72 hpf. The cd59:tagrfp line labels the cytoplasm of cd59-expressing cells with TagRFP. The sox10:megfp line labels the cell membranes of sox10-expressing cells with EGFP. (D) In vivo imaging showing cd59:tagrfp-(orange), gal4:erbb3b;uas:egfp (cyan)-positive SCs on the pLLN at 72 hpf. The gal4:erbb3b;uas:egfp line labels the cytoplasm of erbb3b-expressing cells with EGFP. (E) In vivo imaging showing that cd59:tagrfp- (orange), mbp:egfp-caax (cyan)-positive SCs on the pLLN at 7 dpf. The mbp:egfp-caax line labels the cell membranes of mbp-expressing cells with EGFP. All images were acquired with confocal imaging. Scale bars: (A) 5 µm; (C–E) 10 µm.
Figure 3 with 1 supplement
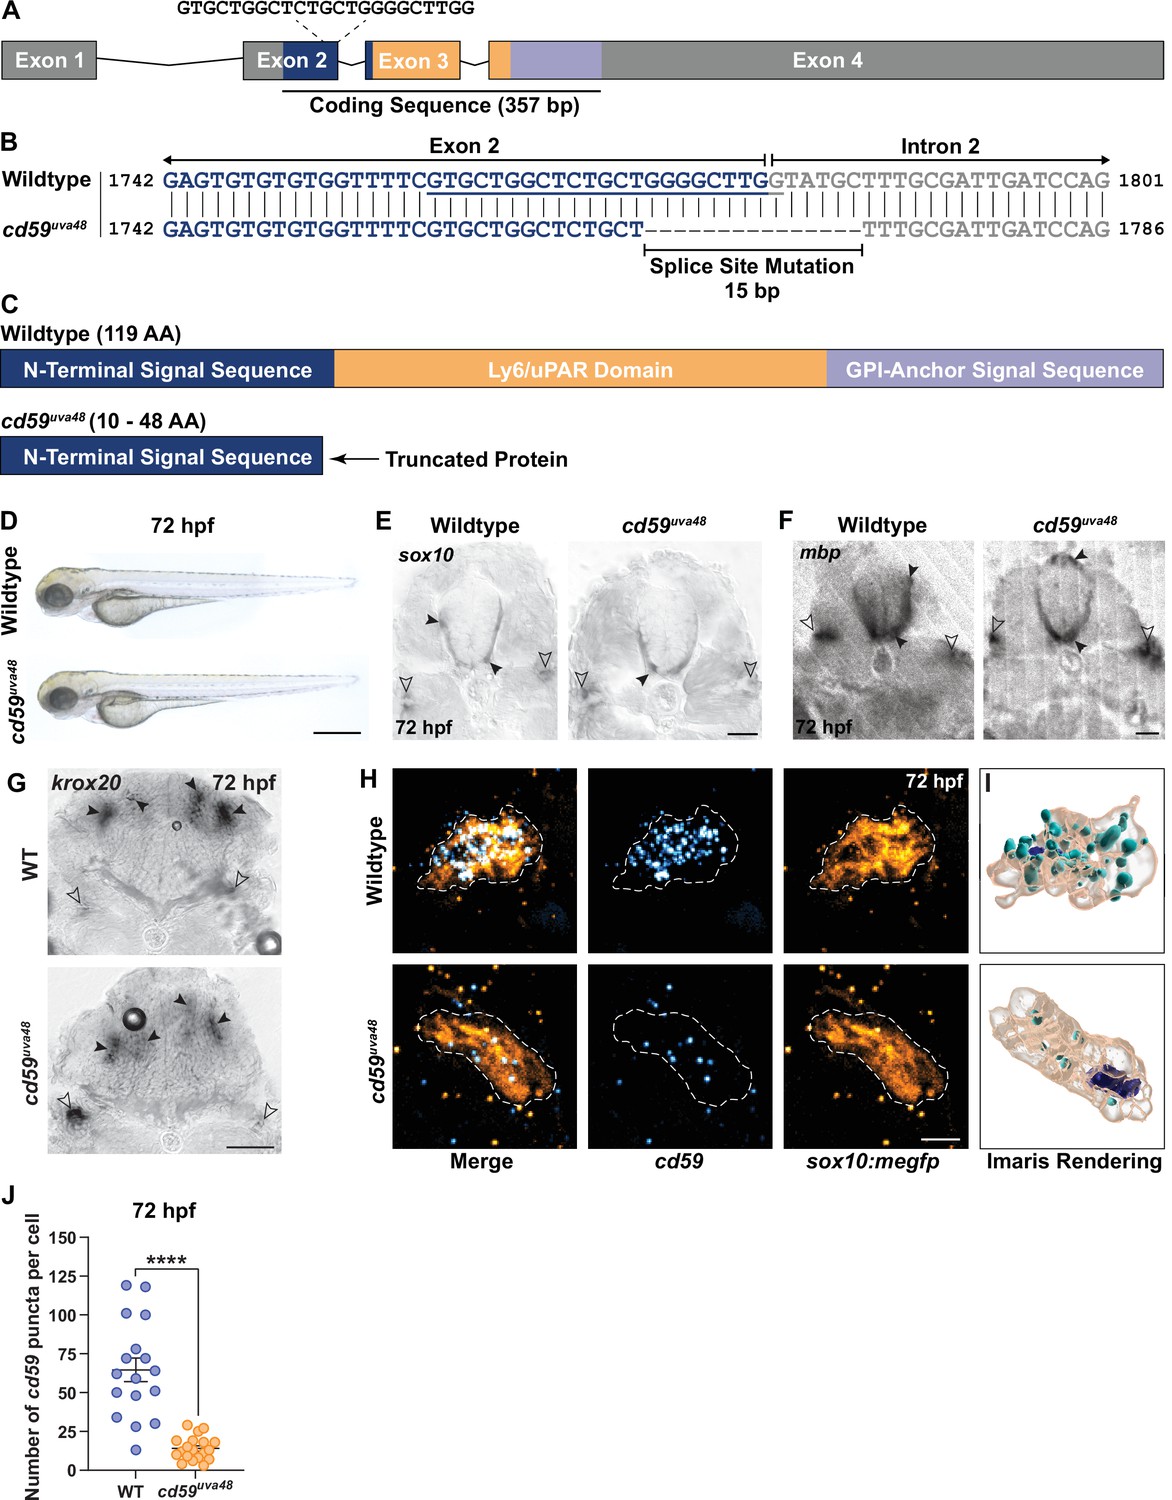
Generation of cd59 mutant zebrafish with CRISPR/Cas9 genome editing.
(A) Schematic of zebrafish cd59 gene. The cd59 coding sequence (357 bp; CDS) encodes the protein domains with the corresponding colors indicated in (C). The non-CDS is indicated in gray. The dashed lines indicate the sgRNA and the target sequence. (B) Genomic sequences for wildtype cd59 and mutant cd59uva48 showing a 15 bp deletion at the splice site between exon 2 (blue) and intron 2 (gray) of the cd59 gene. (C) Schematic of Cd59 protein made in wildtype (119 AA; top panel) and cd59uva48 mutant fish (10–48 AA; bottom panel). (D) Bright-field images of wildtype and cd59uva48 mutant larvae at 72 hours post fertilization (hpf) showing no anatomical defects as a result of cd59 mutation. (E) Chromogenic in situ hybridization (CISH) showing sox10-positive (gray) oligodendrocytes (OLs) in the spinal cord (filled arrows) and Schwann cells (SCs) on the posterior lateral line nerve (pLLN) (empty arrows) at 72 hpf in transverse sections. (F) CISH showing mbp-positive (gray) OLs in the spinal cord (filled arrows) and SCs on the pLLN (empty arrows) at 72 hpf in transverse sections. (G) CISH showing krox20-positive (gray) SCs on the pLLN (empty arrows) and neurons in the brain (filled arrows) at 72 hpf in transverse sections. (H) Fluorescent in situ hybridization (FISH) (RNAscope; ACD) showing cd59 expression (cyan) in sox10:megfp-positive SCs (orange) along the pLLN at 72 hpf. Representative images each display a transverse section (z projection of 20 µm) of single SC on the pLLN. (I) Imaris renderings show cd59 puncta that are localized within each SC. (J) Scatter plot of the number of cd59 RNA puncta in pLLN SCs (mean ± SEM: WT: 64.7 ± 7.6, cd59uva48: 14 ± 1.7; p<0.0001; dot = 1 cell; n = 7 fish per group). These data were compared with Student’s t-test using GraphPad Prism. CISH and FISH images were acquired with confocal imaging. Scale bars: (A) 0.25 mm; (E, F) 25 µm; (G) 50 µm. Artwork created by Ashtyn T. Wiltbank with Illustrator (Adobe).
-
Figure 3—source data 1
Source data for the quantification of the number of cd59 puncta in Schwann cells (SCs) at 72 hours post fertilization (hpf) depicted in Figure 3H.
Data contributed to scatter plot of the number of cd59 RNA puncta in posterior lateral line nerve (pLLN) SCs (mean ± SEM: WT: 64.7 ± 7.6, cd59uva48: 14 ± 1.7; p<0.0001; data point = 1 cell; n = 7 fish per group). These data were compared with Student’s t-test using GraphPad Prism.
- https://cdn.elifesciences.org/articles/76640/elife-76640-fig3-data1-v1.xlsx
Figure 3—figure supplement 1
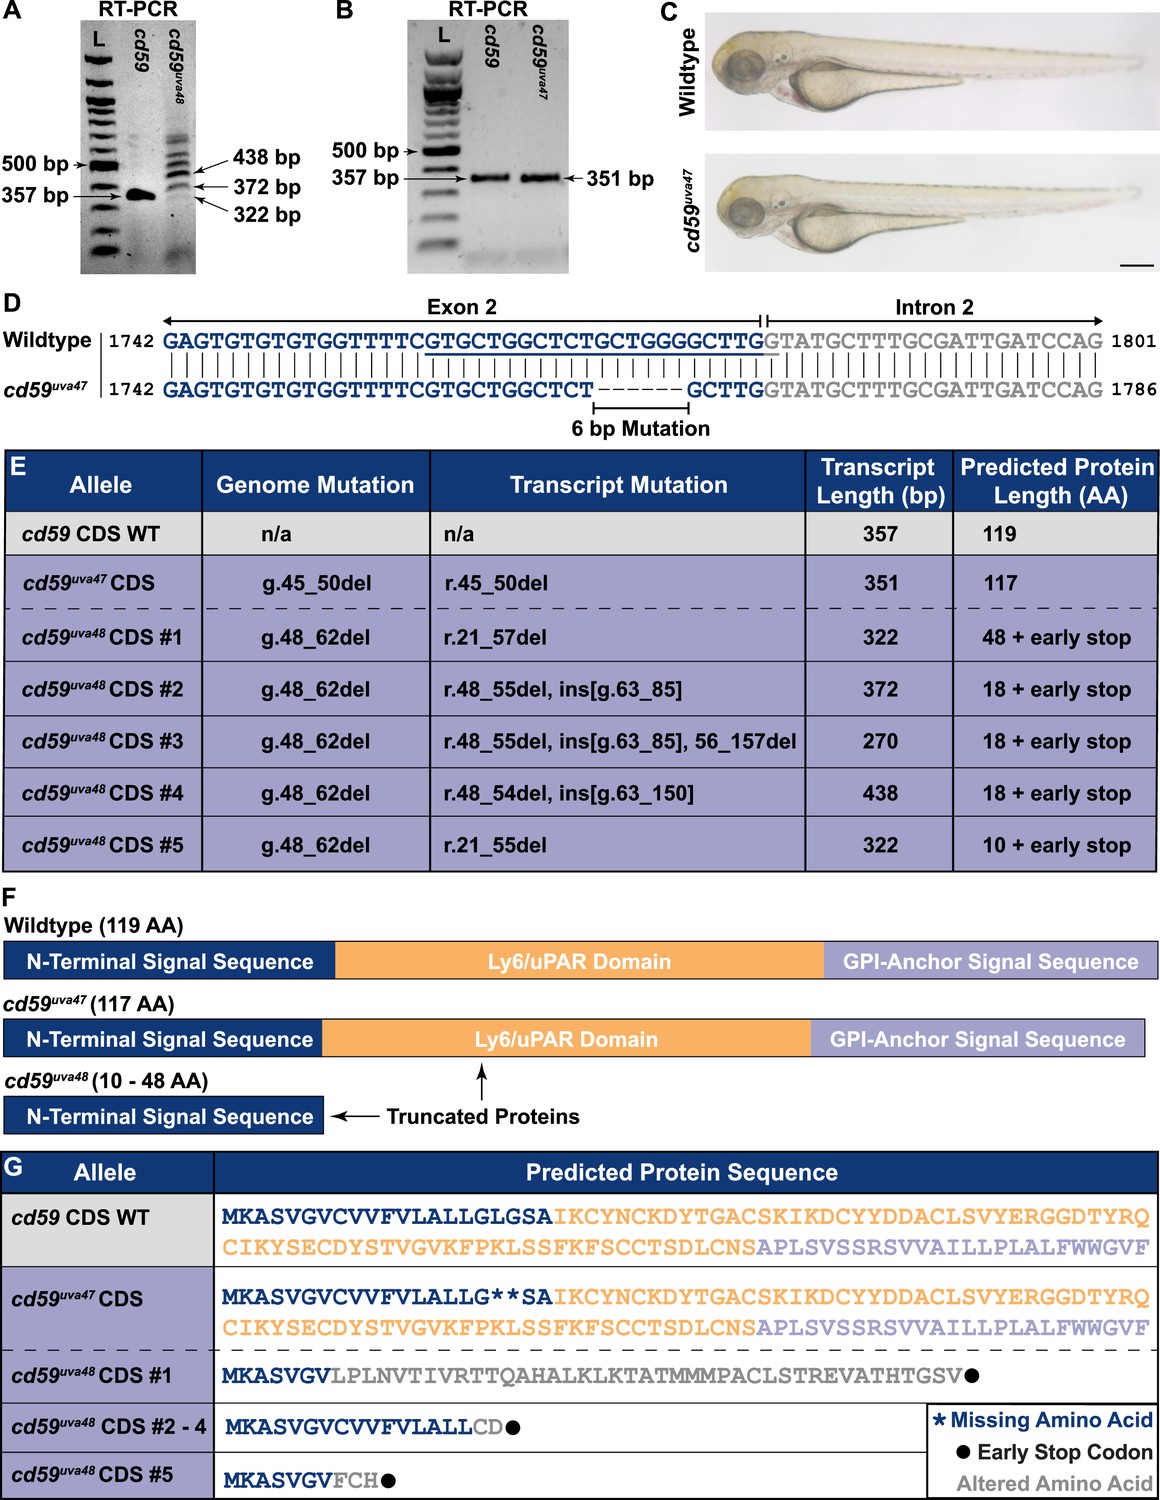
Characterization of cd59 mutant zebrafish.
(A) Gel electrophoresis showing wildtype (357 bp) and cd59uva48 (variable transcript size) RT-PCR products at 72 hours post fertilization (hpf). (B) Gel electrophoresis showing wildtype (357 bp) and cd59uva47 (351 bp) RT-PCR products at 72 hpf. RT-PCR products were compared to 100 bp DNA ladder for (A) and (B). (C) Bright-field images of wildtype and cd59uva47 mutant larvae at 72 hpf showing no anatomical defects as a result of cd59 mutation. (D) Genomic sequences for wildtype cd59 and mutant cd59uva47 showing a 6 bp deletion at the end of exon 2 (blue) in the cd59 gene. (E) Table showing the genome and transcript mutations associated with sequenced RT-PCR products from wildtype (gray) and cd59 mutant alleles (purple). The resulting transcript and protein length for each allele also included. (F) Schematic of Cd59 protein made in wildtypes (119 AA; top panel), cd59uva47 mutants (117 AA; middle panel), and cd59uva48 mutants (10–48 AA; middle panel). (G) Expasy protein translations (Duvaud et al., 2021) of sequenced RT-PCR products showing altered amino acid sequences (gray text), early stop codons (black dots), and missing amino acids (blue asterisks) detected in cd59 mutant alleles (purple). Protein domains colored as described previously. Scale bar: (A) 0.25 mm. Artwork created by Ashtyn T. Wiltbank with Illustrator (Adobe).
-
Figure 3—figure supplement 1—source data 1
Source data from gel electrophoresis of RT-PCR of cd59uva48 mutant embryos.
Unlabeled and labeled images of gel electrophoresis showing wildtype (357 bp) and cd59uva48 (variable transcript size) RT-PCR products at 72 hours post fertilization (hpf). RT-PCR products were compared to 100 bp DNA.
- https://cdn.elifesciences.org/articles/76640/elife-76640-fig3-figsupp1-data1-v1.pdf
-
Figure 3—figure supplement 1—source data 2
Source data from gel electrophoresis of RT-PCR of cd59uva47 mutant embryos.
Unlabeled and labeled images of gel electrophoresis showing wildtype (357 bp) and cd59uva47 (351 bp) RT-PCR products at 72 hours post fertilization (hpf). RT-PCR products were compared to 100 bp DNA.
- https://cdn.elifesciences.org/articles/76640/elife-76640-fig3-figsupp1-data2-v1.pdf
Figure 4 with 2 supplements
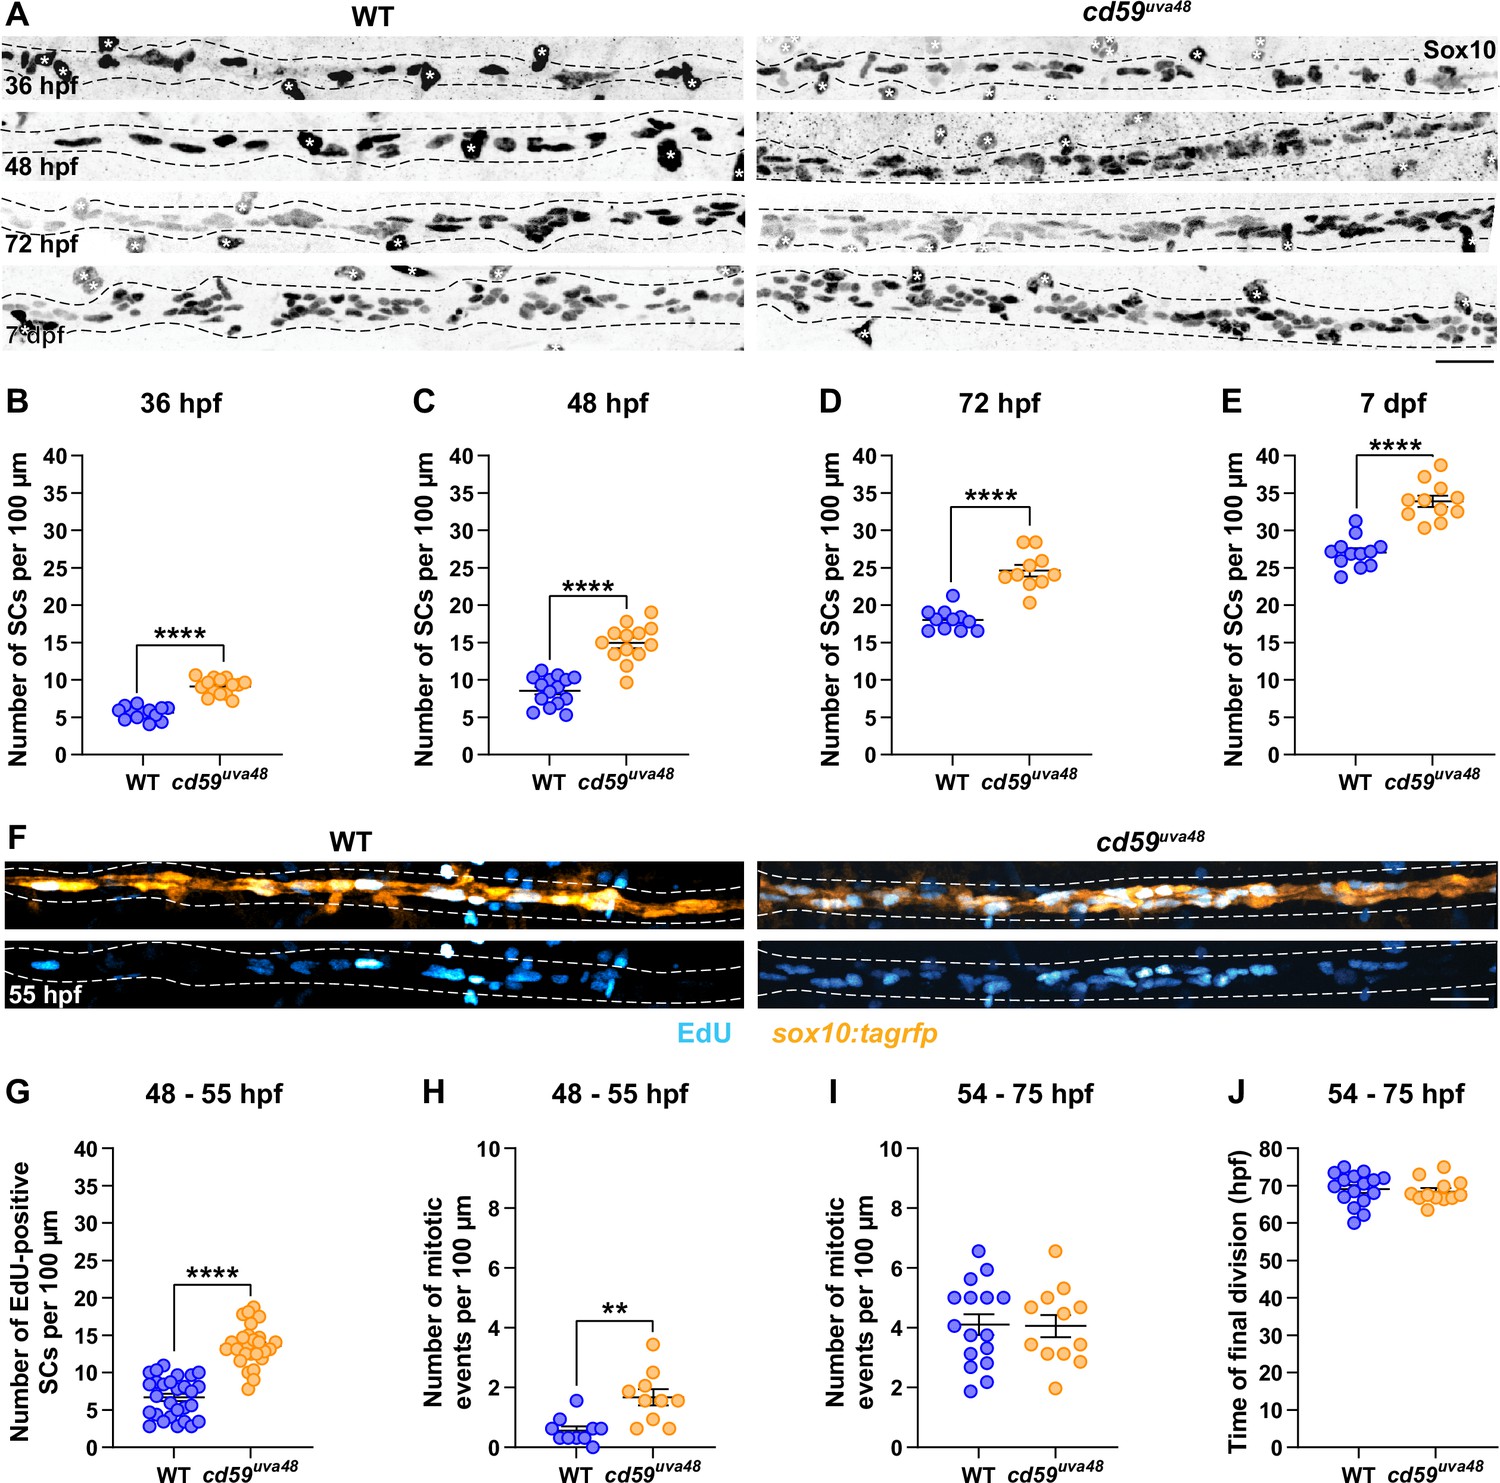
cd59 regulates Schwann cell (SC) proliferation.
(A) Immunofluorescence (IF) showing Sox10-positive SCs (black/gray) along the posterior lateral line nerve (pLLN) from 36 hours post fertilization (hpf) to 7 days post fertilization (dpf). Black dashed lines outline the pLLN. Sox10-positive pigment cells outside of the dashed lines (white asterisks) were not included in the analysis. (B–E) Scatter plots of the number of Sox10-positive SCs along the pLLN from 36 hpf to 7 dpf (mean ± SEM: 36 hpf: WT: 5.6 ± 0.2, cd59uva48: 9.1 ± 0.3; 48 hpf: WT: 8.6 ± 0.5, cd59uva48: 15.0 ± 0.7; 72 hpf: WT: 18.0 ± 0.4, cd59uva48: 24.3 ± 0.8; 7 dpf: WT: 27.0 ± 0.6, cd59uva48: 33.9 ± 0.8; p-values: p<0.0001; dot = 1 fish). (F) EdU incorporation assay showing sox10:tagrfp-positive, pLLN SCs (orange) pulsed with EdU (cyan) from 48 to 55 hpf. (G) Scatter plot of the number of EdU-positive SCs along the pLLN at 55 hpf (WT: 6.7 ± 0.5, cd59uva48: 13.6 ± 0.5; p<0.0001; dot = 1 fish). (H) Scatter plot of the number of mitotic events observed in SCs from 48 to 55 hpf (mean ± SEM: WT: 0.6 ± 0.1, cd59uva48: 1.7 ± 0.3; p=0.0019; dot = 1 fish). (I) Scatter plot of the number of mitotic events observed in SCs from 54 to 75 hpf (mean ± SEM: WT: 4.1 ± 0.3, cd59uva48: 4.1 ± 0.4; dot = 1 fish). (H) Scatter plot of the time of final cell division (hpf) observed in SCs from 54 to 75 hpf (mean ± SEM: WT: 69.1 ± 1.1, cd59uva48: 68.4 ± 0.9; dot = 1 fish). All data were collected from somites 11–13 (~320 µm) and normalized to units per 100 µm. All images in this figure were acquired with confocal imaging. Each dataset was compared with Student’s t-test using GraphPad Prism. Scale bars: (A, F) 25 µm.
-
Figure 4—source data 1
Source data for the quantification of the number of Schwann cells (SCs) on the posterior lateral line nerve (pLLN) at 36 hours post fertilization (hpf).
Data contributed to scatter plot of the number of Sox10-positive SCs along the pLLN at 36 hpf (mean ± SEM: WT: 5.6 ± 0.2, cd59uva48: 9.1 ± 0.3; p-value: p<0.0001; data point = 1 fish). These data were compared with Student’s t-test using GraphPad Prism. Data were collected from somites 11–13 (~320 µm) and normalized to units per 100 µm.
- https://cdn.elifesciences.org/articles/76640/elife-76640-fig4-data1-v1.xlsx
-
Figure 4—source data 2
Source data for the quantification of the number of Schwann cells (SCs) on the posterior lateral line nerve (pLLN) at 48 hours post fertilization (hpf).
Data contributed to scatter plot of the number of Sox10-positive SCs along the pLLN at 48 hpf (mean ± SEM: WT: 8.6 ± 0.5, cd59uva48: 15.0 ± 0.7; p-value: p<0.0001; data point = 1 fish). These data were compared with Student’s t-test using GraphPad Prism. Data were collected from somites 11–13 (~320 µm) and normalized to units per 100 µm.
- https://cdn.elifesciences.org/articles/76640/elife-76640-fig4-data2-v1.xlsx
-
Figure 4—source data 3
Source data for the quantification of the number of Schwann cells (SCs) on the posterior lateral line nerve (pLLN) at 72 hours post fertilization (hpf).
Data contributed to scatter plot of the number of Sox10-positive SCs along the pLLN at 72 hpf (mean ± SEM: WT: 18.0 ± 0.4, cd59uva48: 24.3 ± 0.8; p-value: p<0.0001; data point = 1 fish). These data were compared with Student’s t-test using GraphPad Prism. Data were collected from somites 11–13 (~320 µm) and normalized to units per 100 µm.
- https://cdn.elifesciences.org/articles/76640/elife-76640-fig4-data3-v1.xlsx
-
Figure 4—source data 4
Source data for the quantification of the number of Schwann cells (SCs) on the posterior lateral line nerve (pLLN) at 7 days post fertilization (dpf).
Data contributed to scatter plot of the number of Sox10-positive SCs along the pLLN at 7 dpf (mean ± SEM: WT: 27.0 ± 0.6, cd59uva48: 33.9 ± 0.8; p-value: p<0.0001; data point = 1 fish). These data were compared with Student’s t-test using GraphPad Prism. Data were collected from somites 11–13 (~320 µm) and normalized to units per 100 µm.
- https://cdn.elifesciences.org/articles/76640/elife-76640-fig4-data4-v1.xlsx
-
Figure 4—source data 5
Source data for the quantification of the number of EdU-positive Schwann cells (SCs) on the posterior lateral line nerve (pLLN) from 48 to 55 hours post fertilization (hpf) depicted in Figure 4G.
Data contributed to scatter plot of the number of EdU-positive SCs along the pLLN at 55 hpf (mean ± SEM: WT: 6.7 ± 0.5, cd59uva48: 13.6 ± 0.5; p<0.0001; dot = 1 fish). These data were compared with Student’s t-test using GraphPad Prism. Data were collected from somites 11–13 (~320 µm) and normalized to units per 100 µm.
- https://cdn.elifesciences.org/articles/76640/elife-76640-fig4-data5-v1.xlsx
-
Figure 4—source data 6
Source data for the quantification of the number of mitotic events from 48 to 55 hours post fertilization (hpf) depicted in Figure 4H.
Data contributed to scatter plot of the number of mitotic events observed in Schwann cells (SCs) from 48 to 55 hpf (mean ± SEM: WT: 0.6 ± 0.1, cd59uva48: 1.7 ± 0.3; p=0.0019; data point = 1 fish). These data were compared with Student’s t-test using GraphPad Prism. Data were collected from somites 11–13 (~320 µm) and normalized to units per 100 µm.
- https://cdn.elifesciences.org/articles/76640/elife-76640-fig4-data6-v1.xlsx
-
Figure 4—source data 7
Source data for the quantification of the number of mitotic events from 54 to 75 hours post fertilization (hpf) depicted in Figure 4I.
Data contributed to scatter plot of the number of mitotic events observed in Schwann cells (SCs) from 54 to 75 hpf (mean ± SEM: WT: 4.1 ± 0.3, cd59uva48: 4.1 ± 0.4; data point = 1 fish). These data were compared with Student’s t-test using GraphPad Prism. Data were collected from somites 11–13 (~320 µm) and normalized to units per 100 µm.
- https://cdn.elifesciences.org/articles/76640/elife-76640-fig4-data7-v1.xlsx
-
Figure 4—source data 8
Source data for the time of final Schwann cell (SC) division during 54–75 hours post fertilization (hpf) depicted in Figure 4J.
Data contributed to scatter plot of the time of final cell division (hpf) observed in SCs from 54 to 75 hpf (mean ± SEM: WT: 69.1 ± 1.1, cd59uva48: 68.4 ± 0.9; data point = 1 fish). These data were compared with Student’s t-test using GraphPad Prism. Data were collected from somites 11–13 (~320 µm).
- https://cdn.elifesciences.org/articles/76640/elife-76640-fig4-data8-v1.xlsx
Figure 4—figure supplement 1
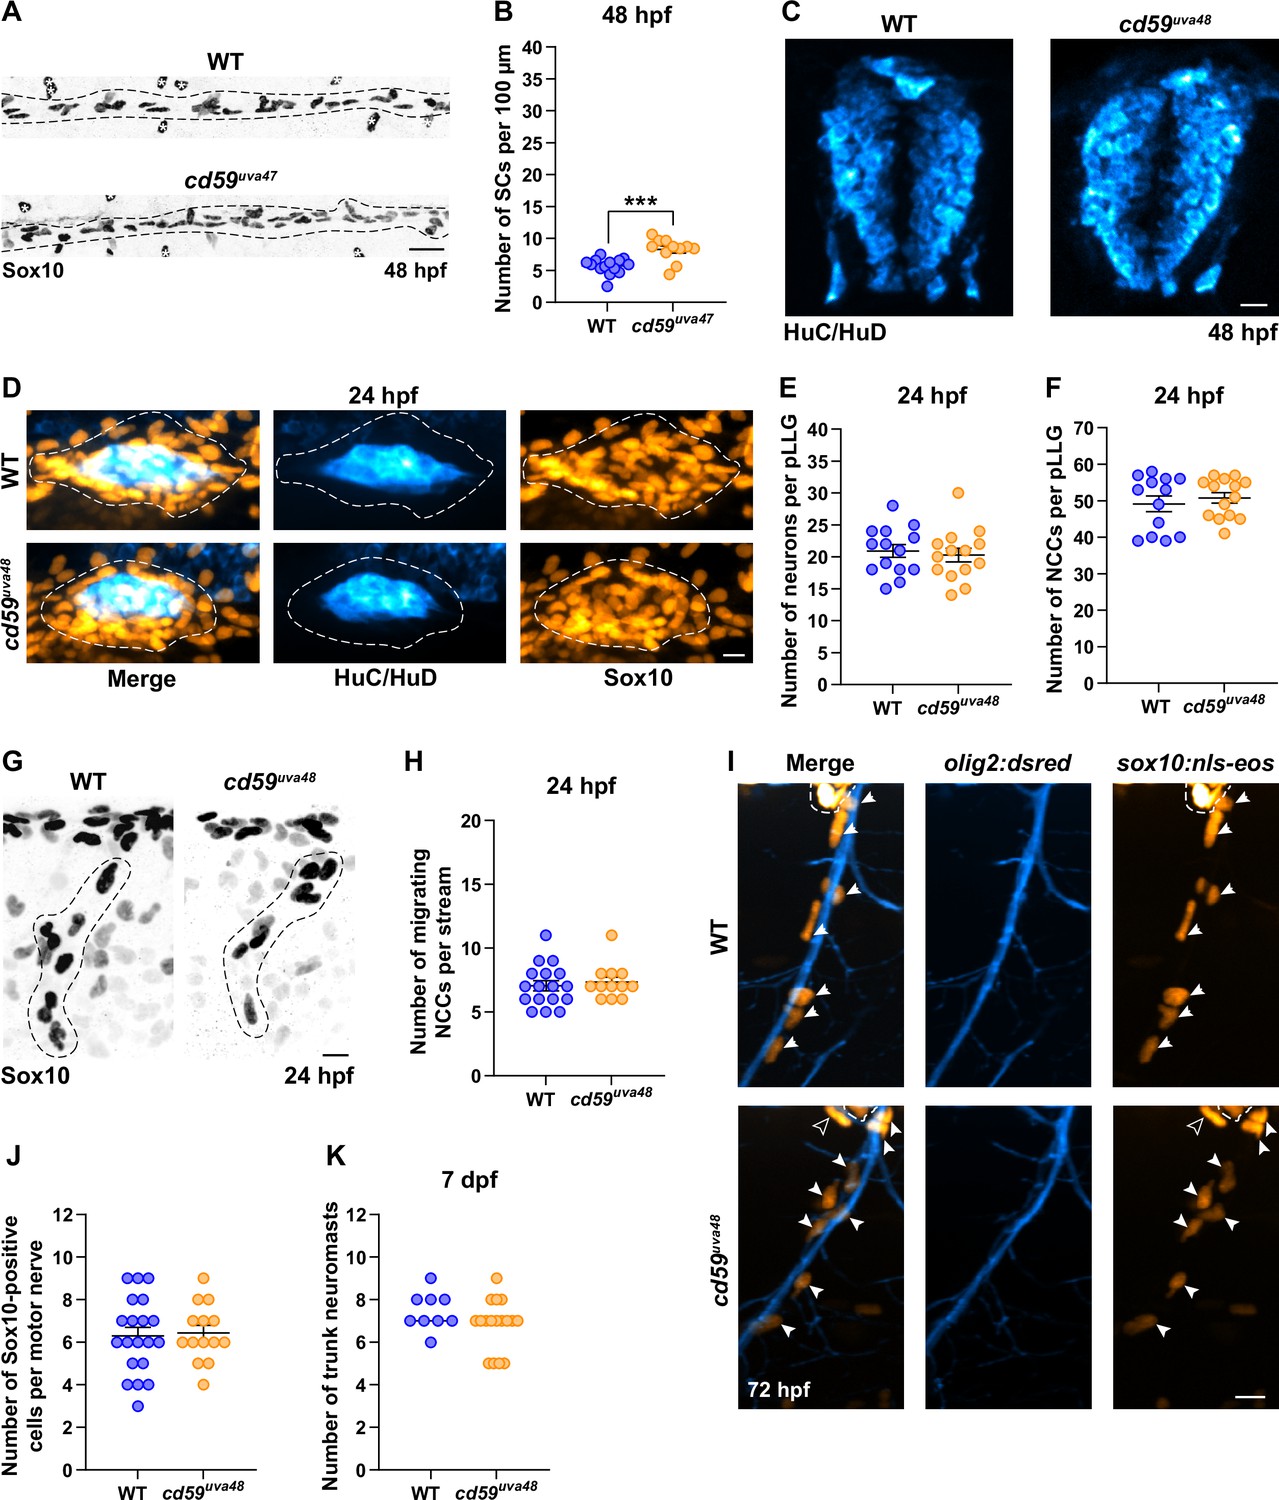
cd59 does not impact proliferation of neurons, neural crest cells (NCCs), motor Schwann cells (SCs), or MEP glia.
(A) Immunofluorescence (IF) showing Sox10-positive SCs (black/gray) along the posterior lateral line nerve (pLLN) at 48 hours post fertilization (hpf). Black dashed lines outline the pLLN. Sox10-positive pigment cells outside of the dashed lines (white asterisks) were not included in the analysis. (B) Scatter plot of the number of Sox10-positive SCs along the pLLN at 48 hpf (mean ± SEM: WT: 5.7 ± 0.3, cd59uva48: 8.3 ± 0.5; p=0.0003; dot = 1 fish). Data were collected from somites 11–13 (~320 µm) and normalized to units per 100 µm. (C) IF showing HuC/HuD-positive neurons (cyan) in the spinal cord at 48 hpf (n = 6 fish per group). (D) IF showing HuC/HuD-positive neurons (cyan) and Sox10-positive NCCs (orange) in the posterior lateral line ganglia (pLLG) at 24 hpf. White dashed lines outline the pLLG. NCCs outside of the dashed lines were not included in the analysis. (E) Scatter plot of the number of HuC/HuD-positive neurons in the pLLG at 24 hpf (mean ± SEM: WT: 20.9 ± 1.0, cd59uva48: 20.3 ± 1.1; dot = 1 fish). (F) Scatter plot of the number of Sox10-positive NCCs in the pLLG at 24 hpf (mean ± SEM: WT: 49.2 ± 2.1, cd59uva48: 50.8 ± 1.4; dot = 1 fish). (G) IF showing Sox10-positivie NCCs (black/gray) migrating in the trunk at 24 hpf. Black dashed lines outline the migrating NCCs. NCCs outside of the dashed lines were not included in the analysis. Data collected from the 12th somite. (H) Scatter plot of the number of Sox10-positive, migrating NCCs in the trunk at 24 hpf (mean ± SEM: WT: 7.1 ± 0.4, cd59uva48: 7.3 ± 0.4; dot = 1 fish). (I) Confocal images of sox10-nls-eos-positive SCs (orange, filled arrows) along olig2:dsred-positive nerves at 72 hpf. SCs along the rostral and caudal branches of the motor nerve were not included in the quantification (one rostral SC indicated with empty arrow). Satellite glia on the dorsal root ganglia (outlined with white dashed line) were not included in the quantification. Data collected from the 12th somite. (J) Scatter plot of the number of Sox10-positive SCs and MEP glia on a motor nerve at 72 hpf (mean ± SEM: WT: 6.3 ± 0.4, cd59uva48: 6.4 ± 0.36; dot = 1 fish). (K) Scatter plot of the number of Tubulin-positive neuromasts in the trunk at 7 days post fertilization (dpf) (mean ± SEM: WT: 7.4 ± 0.3, cd59uva48: 6.8 ± 0.3; dot = 1 fish). All images in this figure were acquired with confocal imaging. Each dataset was compared with Student’s t-test using GraphPad Prism. Scale bars: (A) 25 µm; (C, D, G, I) 10 µm.
-
Figure 4—figure supplement 1—source data 1
Source data for the quantification of the number of Schwann cells (SCs) on the posterior lateral line nerve (pLLN) at 48 hours post fertilization (hpf) in cd59uva47 mutant embryos.
Data contributed to scatter plot of the number of Sox10-positive SCs along the pLLN at 48 hpf (mean ± SEM: WT: 5.7 ± 0.3, cd59uva48: 8.3 ± 0.5; p=0.0003; data point = 1 fish). These data were compared with Student’s t-test using GraphPad Prism. Data were collected from somites 11–13 (~320 µm) and normalized to units per 100 µm.
- https://cdn.elifesciences.org/articles/76640/elife-76640-fig4-figsupp1-data1-v1.xlsx
-
Figure 4—figure supplement 1—source data 2
Source data for the quantification of the number of neurons per posterior lateral line ganglia (pLLG) at 24 hours post fertilization (hpf) depicted in Figure 4—figure supplement 1E.
Data contributed to scatter plot of the number of HuC/HuD-positive neurons in the pLLG at 24 hpf (mean ± SEM: WT: 20.9 ± 1.0, cd59uva48: 20.3 ± 1.1; data point = 1 fish). These data were compared with Student’s t-test using GraphPad Prism.
- https://cdn.elifesciences.org/articles/76640/elife-76640-fig4-figsupp1-data2-v1.xlsx
-
Figure 4—figure supplement 1—source data 3
Source data for the quantification of the number of neural crest cells (NCCs) associated with the posterior lateral line ganglia (pLLG) at 24 hours post fertilization (hpf) depicted in Figure 4—figure supplement 1F.
Data contributed to scatter plot of the number of Sox10-positive NCCs in the pLLG at 24 hpf (mean ± SEM: WT: 49.2 ± 2.1, cd59uva48: 50.8 ± 1.4; data point = 1 fish). These data were compared with Student’s t-test using GraphPad Prism.
- https://cdn.elifesciences.org/articles/76640/elife-76640-fig4-figsupp1-data3-v1.xlsx
-
Figure 4—figure supplement 1—source data 4
Source data for the quantification of the number of migrating neural crest cells (NCCs) per stream at 24 hours post fertilization (hpf) depicted in Figure 4—figure supplement 1H.
Data contributed to scatter plot of the number of Sox10-positive, migrating NCCs in the trunk at 24 hpf (mean ± SEM: WT: 7.1 ± 0.4, cd59uva48: 7.3 ± 0.4; data point = 1 fish). These data were compared with Student’s t-test using GraphPad Prism.
- https://cdn.elifesciences.org/articles/76640/elife-76640-fig4-figsupp1-data4-v1.xlsx
-
Figure 4—figure supplement 1—source data 5
Source data for the quantification of the number of Sox10-positive cells (Schwann cells [SCs] and MEP glia) per spinal motor nerve at 72 hours post fertilization (hpf) depicted in Figure 4—figure supplement 1J.
Data contributed to scatter plot of the number of Sox10-positive cell per spinal motor nerves at 72 hpf (mean ± SEM: WT: 6.3 ± 0.4, cd59uva48: 6.4 ± 0.36; dot = 1 fish). These data were compared with Student’s t-test using GraphPad Prism.
- https://cdn.elifesciences.org/articles/76640/elife-76640-fig4-figsupp1-data5-v1.xlsx
-
Figure 4—figure supplement 1—source data 6
Source data for the quantification of the number of trunk neuromasts at 7 days post fertilization (dpf) depicted in Figure 4—figure supplement 1K.
Data contributed to scatter plot of the number of Tubulin-positive neuromasts in the trunk at 7 dpf (mean ± SEM: WT: 7.4 ± 0.3, cd59uva48: 6.8 ± 0.3; data point = 1 fish). These data were compared with Student’s t-test using GraphPad Prism.
- https://cdn.elifesciences.org/articles/76640/elife-76640-fig4-figsupp1-data6-v1.xlsx
Figure 4—figure supplement 2
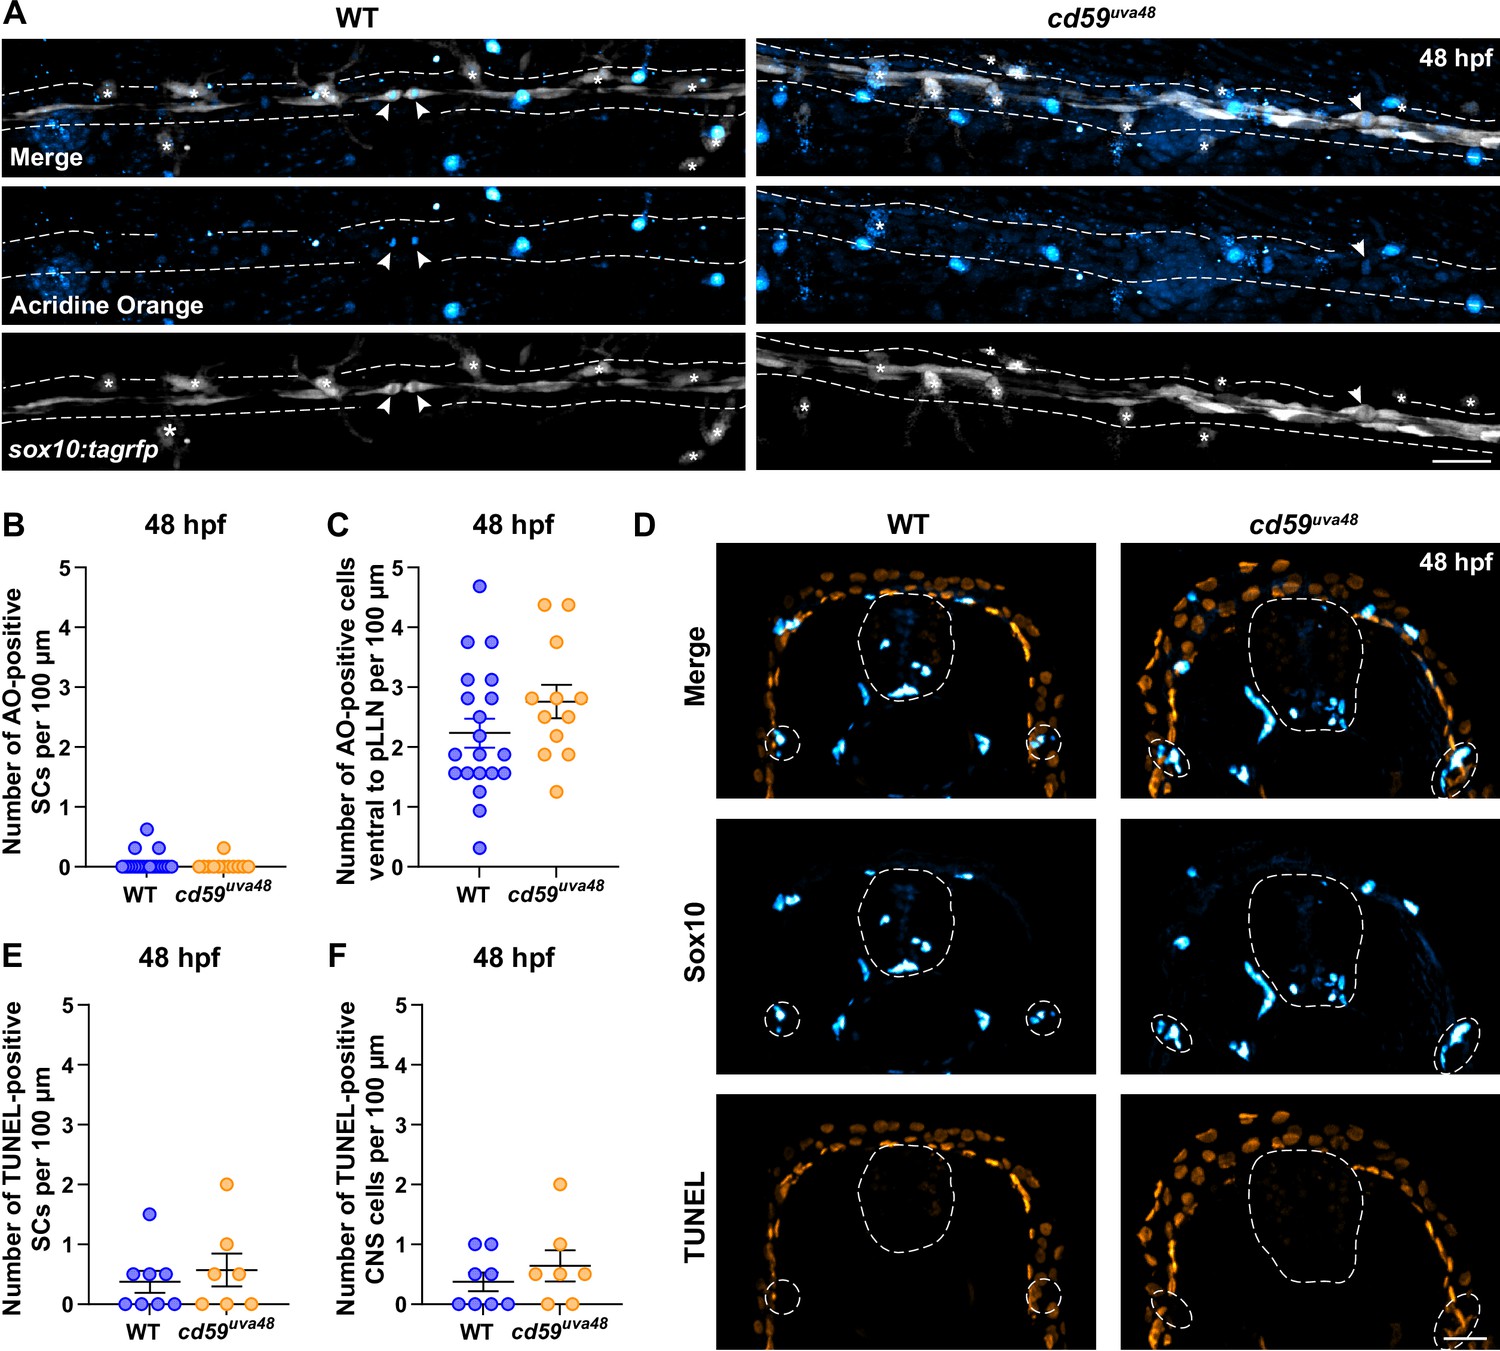
Loss of cd59 does not impact cell death within the peripheral nervous system (PNS) and central nervous system (CNS).
(A) Acridine orange (AO) incorporation assay showing AO-positive (cyan), sox10:tagrfp-positive Schwann cells (SCs) (gray) along the posterior lateral line nerve (pLLN) at 48 hours post fertilization (hpf). White dashed lines outline the pLLN. Arrowheads denote proliferative events, which can also be detected by AO. (B) Scatter plot of the number of AO-positive SCs along the pLLN at 48 hpf (mean ± SEM: WT: 0.06 ± 0.04, cd59uva48: 0.03 ± 0.03; dot = 1 fish). (C) Scatter plot of the number of AO-positive cells ventral to the pLLN at 48 hpf (mean ± SEM: WT: 2.2 ± 0.2, cd59uva48: 2.8 ± 0.3; dot = 1 fish). Data were collected from somites 11–13 (~320 µm) and normalized to units per 100 µm for (B) and (C). (D) TUNEL assay showing TUNEL-positive (orange) cells in the spinal cord and Sox10-positive SCs along the pLLN at 48 hpf. White dashed lines outline the spinal cord (medial) and the pLLNs (lateral). (E) Scatter plot of the number of TUNEL-positive SCs along the pLLN at 48 hpf (mean ± SEM: WT: 0.4 ± 0.2, cd59uva48: 0.6 ± 0.3; dot = 1 fish). (F) Scatter plot of the number of TUNEL-positive cells in the spinal cord at 48 hpf (mean ± SEM: WT: 0.4 ± 0.2, cd59uva48: 0.6 ± 0.3; dot = 1 fish). Data were collected from 10 consecutive transverse sections per fish (~200 µm) and normalized to units per 100 µm for (E) and (F). All images in this figure were acquired with confocal imaging. Each dataset was compared with Student’s t-test using GraphPad Prism. Scale bars: (A, D) 25 µm.
-
Figure 4—figure supplement 2—source data 1
Source data for the quantification of the number of acridine orange (AO)-positive Schwann cells (SCs) at 48 hours post fertilization (hpf) depicted in Figure 4—figure supplement 2B.
Data contributed to scatter plot of the number of AO-positive SCs along the posterior lateral line nerve (pLLN) at 48 hpf (mean ± SEM: WT: 0.06 ± 0.04, cd59uva48: 0.03 ± 0.03; data point = 1 fish). These data were compared with Student’s t-test using GraphPad Prism. Data were collected from somites 11–13 (~320 µm) and normalized to units per 100 µm.
- https://cdn.elifesciences.org/articles/76640/elife-76640-fig4-figsupp2-data1-v1.xlsx
-
Figure 4—figure supplement 2—source data 2
Source data for the quantification of the number of acridine orange (AO)-positive cells ventral to the posterior lateral line nerve (pLLN) at 48 hours post fertilization (hpf) depicted in Figure 4—figure supplement 2C.
Data contributed to scatter plot of the number of AO-positive cells ventral to the pLLN at 48 hpf (mean ± SEM: WT: 2.2 ± 0.2, cd59uva48: 2.8 ± 0.3; dot = 1 fish). These data were compared with Student’s t-test using GraphPad Prism. Data were collected from somites 11–13 (~320 µm) and normalized to units per 100 µm.
- https://cdn.elifesciences.org/articles/76640/elife-76640-fig4-figsupp2-data2-v1.xlsx
-
Figure 4—figure supplement 2—source data 3
Source data for the quantification of the number of TUNEL-positive Schwann cells (SCs) at 48 hours post fertilization (hpf) depicted in Figure 4—figure supplement 2E.
Data contributed to scatter plot of the number of TUNEL-positive SCs along the pLLN at 48 hpf (mean ± SEM: WT: 0.4 ± 0.2, cd59uva48: 0.6 ± 0.3; data point = 1 fish). These data were compared with Student’s t-test using GraphPad Prism. Data were collected from 10 consecutive transverse sections per fish (~200 µm) and normalized to units per 100 µm.
- https://cdn.elifesciences.org/articles/76640/elife-76640-fig4-figsupp2-data3-v1.xlsx
-
Figure 4—figure supplement 2—source data 4
Source data for the quantification of the number of TUNEL-positive central nervous system (CNS) cells at 48 hours post fertilization (hpf) depicted in Figure 4—figure supplement 2F.
Data contributed to scatter plot of the number of TUNEL-positive cells in the spinal cord at 48 hpf (mean ± SEM: WT: 0.4 ± 0.2, cd59uva48: 0.6 ± 0.3; data point = 1 fish). These data were compared with Student’s t-test using GraphPad Prism. Data were collected from 10 consecutive transverse sections per fish (~200 µm) and normalized to units per 100 µm.
- https://cdn.elifesciences.org/articles/76640/elife-76640-fig4-figsupp2-data4-v1.xlsx
Figure 5 with 1 supplement

Myelin and node of Ranvier development is impaired in cd59uva48 mutants.
(A) Transmission electron micrographs showing posterior lateral line nerve (pLLN) axons myelinated by Schwann cells (SCs) at 7 days post fertilization (dpf). Myelin is shaded in blue, and myelinated axons are shaded in orange. (B) Immunofluorescence (IF) showing NaV channels (cyan) along mbpa:tagrfp-caax-positive pLLNs (orange) at 7 dpf. Diffuse NaV channel staining along unmyelinated nerves was not quantified. White dashed lines outline the pLLN. White dashed boxes correspond with the insets on the right. (C) IF showing NF186 clusters (cyan) along mbpa:tagrfp-caax-positive pLLNs (orange) at 7 dpf. White dashed lines outline the pLLN, and the white dashed boxes correspond to the insets on the right. Representative images in (B) and (C) depict somites 11–13 (~320 µm). (D) Average number of myelin wrappings per pLLN axon plotted relative to the average area of axon cross-section at 7 dpf. Data were collected from three sections per fish separated by 100 µm. Significance was determined by comparing the average number of myelin wraps divided by the average axon area for each fish with Student’s t-test using GraphPad Prism (average number of myelin wraps per fish mean ± SEM: WT: 3.95 ± 0.19, cd59uva48: 3.27 ± 0.20; average axon area per fish mean ± SEM: WT: 0.51 ± 0.03, cd59uva48: 0.52 ± 0.03; average number of myelin wraps/average axon area per fish mean ± SEM: WT: 0.13 ± 0.01, cd59uva48: 0.16 ± 0.002; p=0.0568; dot = 1 fish). Data quantified in (D) were determined from electron micrographs in (A). (E) Scatter plot of the number of NaV channel clusters along mbpa:tagrfp-positive pLLN nerves at 7 dpf (mean ± SEM: WT: 17.3 ± 0.7, cd59uva48: 9.9 ± 0.9; p<0.0001; dot = 1 fish). (F) Scatter plot of the number of NF186 clusters along mbpa:tagrfp-positive pLLN nerves at 7 dpf (mean ± SEM: WT: 24.0 ± 0.7, cd59uva48: 18.2 ± 1.3; p=0.0011; dot = 1 fish). Data were collected from somites 3–13 (~320 µm) and normalized to units per 100 µm for (E) and (F). Images shown in (A) were acquired with transmission electron microscopy. Images shown in (B) and (C) were acquired with confocal imaging. Each dataset was compared with Student’s t-test using GraphPad Prism. Scale bars: (A) 1 µm; (B, C) 25 µm.
-
Figure 5—source data 1
Source data for the quantification of the average number of myelin wraps per fish relative to the average area of axon cross-section per fish at 7 days post fertilization (dpf) depicted in Figure 5D.
Data contributed to X-Y plot of the average number of myelin wrappings per fish relative to the average axon area per fish at 7 dpf. Data were collected from three sections per fish separated by 100 µm. Significance was determined by comparing the average number of myelin wraps divided by corresponding the average axon area for each fish with Student’s t-test using GraphPad Prism (average number of myelin wraps per fish mean ± SEM: WT: 3.95 ± 0.19, cd59uva48: 3.27 ± 0.20; average axon area per fish mean ± SEM: WT: 0.51 ± 0.03, cd59uva48: 0.52 ± 0.03; average number of myelin wraps/average axon area per fish mean ± SEM: WT: 0.13 ± 0.01, cd59uva48: 0.16 ± 0.002; p=0.0568; dot = 1 fish).
- https://cdn.elifesciences.org/articles/76640/elife-76640-fig5-data1-v1.xlsx
-
Figure 5—source data 2
Source data for the quantification of the number of NaV channel clusters on the posterior lateral line nerve (pLLN) at 7 days post fertilization (dpf) depicted in Figure 5E.
Data contributed to scatter plot of the number of NaV channel clusters along mbpa:tagrfp-positive pLLN nerves at 7 dpf (mean ± SEM: WT: 17.3 ± 0.7, cd59uva48: 9.9 ± 0.9; p<0.0001; data point = 1 fish). These data were compared with Student’s t-test using GraphPad Prism. Data were collected from somites 3–13 (~320 µm) and normalized to units per 100 µm.
- https://cdn.elifesciences.org/articles/76640/elife-76640-fig5-data2-v1.xlsx
-
Figure 5—source data 3
Source data for the quantification of the number of NF186 clusters along the posterior lateral line nerve (pLLN) at 7 days post fertilization (dpf) depicted in Figure 5F.
Data contributed to scatter plot of the number of NF186 clusters along mbpa:tagrfp-positive pLLN nerves at 7 dpf (mean ± SEM: WT: 24.0 ± 0.7, cd59uva48: 18.2 ± 1.3; p=0.0011; data point = 1 fish). These data were compared with Student’s t-test using GraphPad Prism. Data were collected from somites 3–13 (~320 µm) and normalized to units per 100 µm.
- https://cdn.elifesciences.org/articles/76640/elife-76640-fig5-data3-v1.xlsx
Figure 5—figure supplement 1
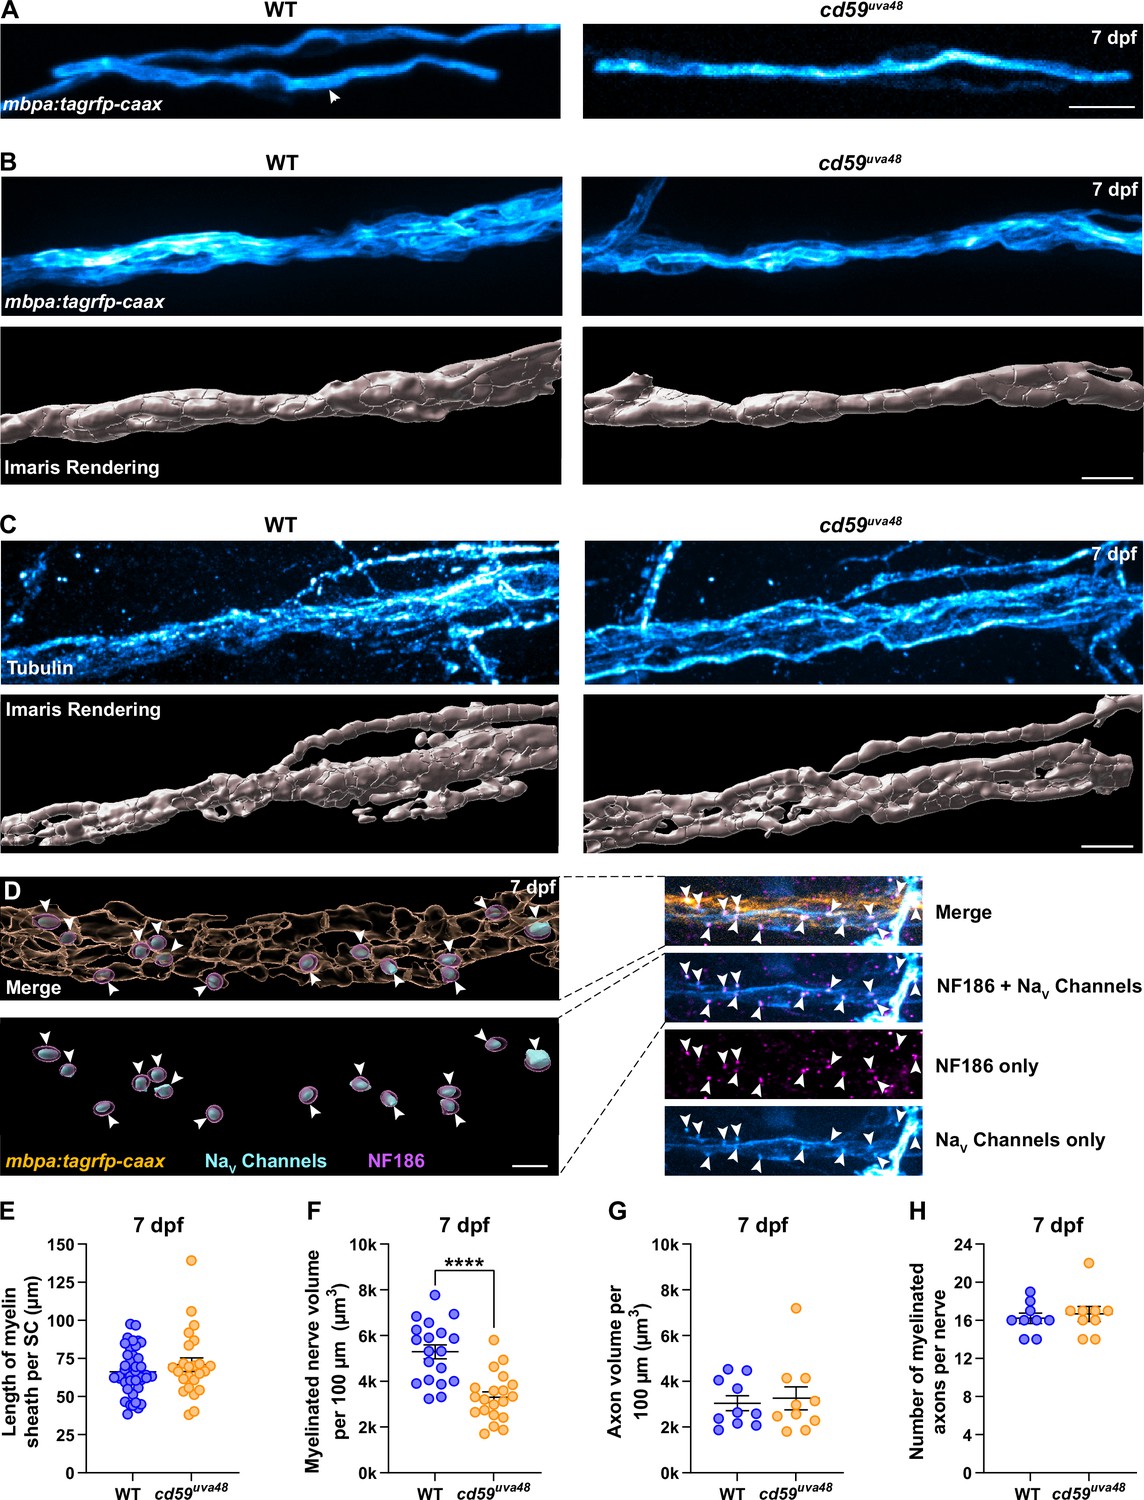
Myelin volume is reduced in cd59uva48 mutants.
(A) Mosaic labeling of mbpa:tagrfp-caax-positive Schwann cell (SC) myelin sheaths (cyan) along the posterior lateral line nerve (pLLN) at 7 days post fertilization (dpf). (B) In vivo imaging of mbpa:tagrfp-caax-positive pLLN nerves (cyan; top panel) at 7 dpf. Imaris renderings (white) of nerve volume in bottom panel. (C) Immunofluorescence (IF) showing Tubulin-positive pLLN axons (cyan; top panel) at 7 dpf. Imaris renderings (white) of axon volume in bottom panel. Representative images for (B) and (C) are from somite 12 (~110 µm). (D) Imaris renderings (right) of IF (left) showing colocalization of NF186 (magenta) and NaV channels (cyan) within mbpa:tagrfp-caax-positive nerves (orange). (E) Scatter plot of the length of myelin sheaths (µm) along the pLLN at 7 dpf (mean ± SEM: WT: 66.3 ± 2.4, cd59uva48: 63.4 ± 4.6; dot = 1 myelin sheath; n = 6–7 fish per group). (F) Scatter plot of the myelinated nerve volumes (µm3) along the pLLN at 7 dpf (mean ± SEM: WT: 5.3 ± 0.3, cd59uva48: 3.3 ± 0.2; p<0.0001; dot = 1 fish). (G) Scatter plot of axon volumes (µm3) along the pLLN at 7 dpf (mean ± SEM: WT: 3.3 ± 0.3, cd59uva48: 3.3 ± 0.5; dot = 1 fish). (H) Scatter plot of the number of myelinated axons per pLLN at 7 dpf. Data were collected from three sections per fish separated by 100 µm (mean ± SEM: WT: 16.22 ± 0.6, cd59uva48: 16.67 ± 0.8; dot = 1 section; n = 3 fish per group). Data quantified in (H) were determined from electron micrographs in (Figure 5A). All images in this figure were acquired with confocal imaging. Each dataset was compared with Student’s t-test using GraphPad Prism. Scale bars: (A–C) 10 µm; (D) 5 µm.
-
Figure 5—figure supplement 1—source data 1
Source data for the quantification of myelin sheath measurements depicted in Figure 5—figure supplement 1D.
Data contributed to scatter plot of the length of myelin sheaths (µm) along the posterior lateral line nerve (pLLN) at 7 days post fertilization (dpf) (mean ± SEM: WT: 66.3 ± 2.4, cd59uva48: 63.4 ± 4.6; data point = 1 myelin sheath; n = 6–7 fish per group). These data were compared with Student’s t-test using GraphPad Prism.
- https://cdn.elifesciences.org/articles/76640/elife-76640-fig5-figsupp1-data1-v1.xlsx
-
Figure 5—figure supplement 1—source data 2
Source data for the quantification of myelinated nerve volume measurements depicted in Figure 5—figure supplement 1E.
Data contributed to scatter plot of the myelinated nerve volumes (µm3) along the posterior lateral line nerve (pLLN) at 7 days post fertilization (dpf) (mean ± SEM: WT: 5.3 ± 0.3, cd59uva48: 3.3 ± 0.2; p<0.0001; data point = 1 fish). These data were compared with Student’s t-test using GraphPad Prism. Data were collected from somite 12 (~110 µm). All data were normalized to units per 100 µm.
- https://cdn.elifesciences.org/articles/76640/elife-76640-fig5-figsupp1-data2-v1.xlsx
-
Figure 5—figure supplement 1—source data 3
Source data for the quantification of axon volume measurements depicted in Figure 5—figure supplement 1F.
Data contributed to scatter plot of axon volumes (µm3) along the posterior lateral line nerve (pLLN) at 7 days post fertilization (dpf) (mean ± SEM: WT: 3.3 ± 0.3, cd59uva48: 3.3 ± 0.5; data point = 1 fish). These data were compared with Student’s t-test using GraphPad Prism. Data were collected from somite 12 (~110 µm). All data were normalized to units per 100 µm.
- https://cdn.elifesciences.org/articles/76640/elife-76640-fig5-figsupp1-data3-v1.xlsx
-
Figure 5—figure supplement 1—source data 4
Source data for the quantification of the number of myelinated axons per posterior lateral line nerve (pLLN) at 7 days post fertilization (dpf) depicted in Figure 5—figure supplement 1G.
Data contributed to scatter plot of the number of myelinated axons per pLLN at 7 dpf. Data were collected from three sections per fish separated by 100 µm (mean ± SEM: WT: 16.22 ± 0.6, cd59uva48: 16.67 ± 0.8; data point = 1 section; n = 3 fish per group). These data were compared with Student’s t-test using GraphPad Prism.
- https://cdn.elifesciences.org/articles/76640/elife-76640-fig5-figsupp1-data4-v1.xlsx
Figure 6

Membrane attack complex (MAC) formation on Schwann cell (SC) membranes is increased in cd59uva48 mutants.
(A) Top panel: immunofluorescence (IF) showing MACs (C5b-9+C5b-8; magenta, indicated with white arrows) embedded in sox10:megfp-positive posterior lateral line nerve (pLLN) SC membranes (gray) at 55 hours post fertilization (hpf). White dotted box corresponds with inset of a single z-plane on the right showing that MACs are within SC membranes. (B) Imaris renderings showing MACs (C5b-9+C5b-8; orange, indicated with white arrows) embedded in sox10:megfp-positive pLLN SC membranes (cyan) at 55 hpf. (B’) Enlarged renderings show MAC puncta (orange, indicated with black arrows) embedded in the SC membranes (cyan). (C) Scatter plot of the number of MACs in SC membranes at 55 hpf (mean ± SEM: WT: 3.3 ± 0.3, cd59uva48: 11.6 ± 1.9; p<0.0001; dot = 1 fish). These data were compared with Student’s t-test using GraphPad Prism. All data were normalized to units per 100 µm. All images were acquired with confocal imaging. Scale bars: (A, B) 10 µm; inset (A) and enlarged renderings (B’), 5 µm.
-
Figure 6—source data 1
Source data for the quantification of membrane attack complexes (MACs)-associated with Schwann cell (SC) membranes at 55 hours post fertilization (hpf) depicted in Figure 6B.
Data contributed to scatter plot of the number of MACs in SC membranes at 55 hpf (mean ± SEM: WT: 3.3 ± 0.3, cd59uva48: 11.6 ± 1.9; p<0.0001; data point = 1 fish). These data were compared with Student’s t-test using GraphPad Prism. Data were collected from somites 11–13 (~320 µm) and normalized to units per 100 µm.
- https://cdn.elifesciences.org/articles/76640/elife-76640-fig6-data1-v1.xlsx
Figure 7 with 1 supplement
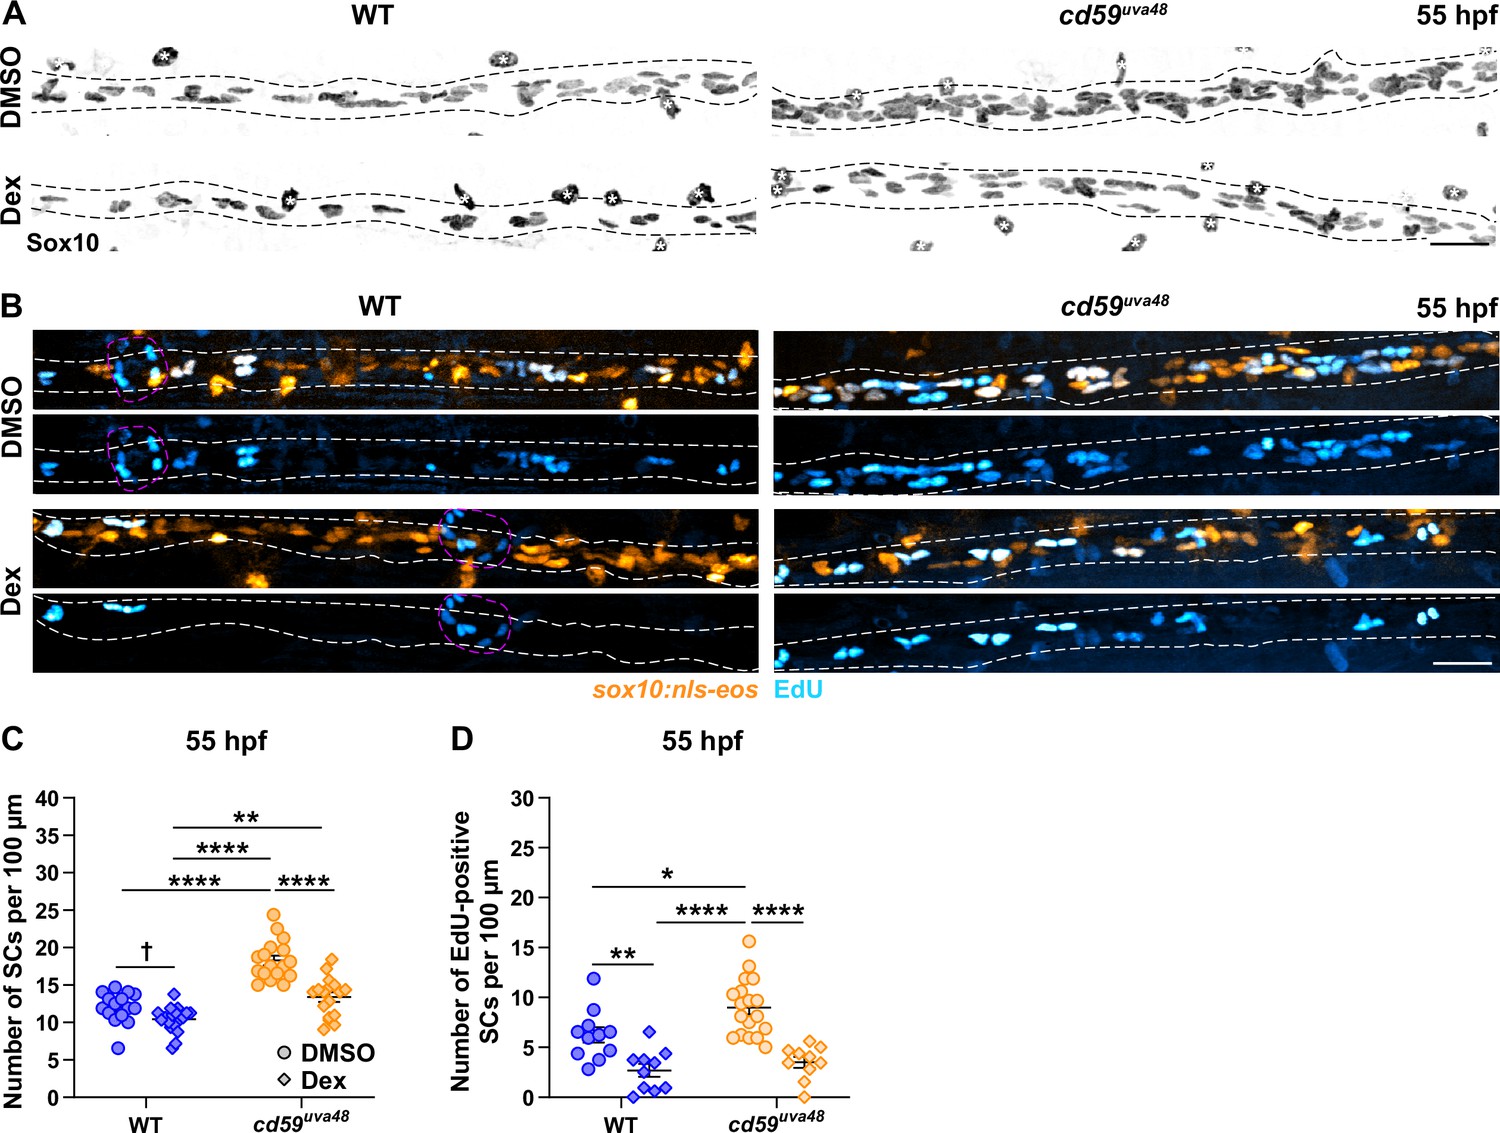
Cd59 and inflammation regulate developmental Schwann cell (SC) proliferation.
(A) Immunofluorescence (IF) showing Sox10-positive posterior lateral line nerve (pLLN) SCs (black/gray) at 55 hours post fertilization (hpf) in embryos treated with DMSO or 100 µM dexamethasone (Dex). Black dashed lines outline the pLLN. Sox10-positive pigment cells outside of the dashed lines (white asterisks) were not included in the analysis. (B) EdU incorporation assay showing sox10:nls-eos-positive, pLLN SCs (orange) pulsed with EdU (cyan) from 48 to 55 hpf in embryos treated with DMSO or 100 µM Dex. White dashed lines outline the pLLN. Magenta dashed lines outline neuromasts. (C) Scatter plot of the number of pLLN SCs at 55 hpf. Asterisks (*) indicate significant differences discovered with two-way ANOVA with Tukey’s post-hoc test using GraphPad Prism. Obelisk (†) indicates the significant difference discovered with Student’s t-test (GraphPad Prism) comparing WT DMSO and WT Dex alone (mean ± SEM: DMSO: WT: 12.0 ± 0.5, cd59uva48: 18.1 ± 0.6; Dex: WT: 10.4 ± 0.4, cd59uva48: 13.4 ± 0.6; two-way ANOVA p-values: WT DMSO vs. cd59uva48 DMSO: p<0.0001, WT Dex vs. cd59uva48 DMSO: p<0.0001, WT Dex vs. cd59uva48 Dex: p=0.0014, cd59uva48 DMSO vs. cd59uva48 Dex: p<0.0001; t-test p-value (compared WT only): WT DMSO vs. WT Dex: p=0.0206; dot = 1 fish). (D) Scatter plot of the number of EdU-positive SCs along the pLLN at 55 hpf in embryos treated with DMSO or 100 µM Dex (mean ± SEM: DMSO: WT: 4.6 ± 0.85, cd59uva48: 9.0 ± 0.68; Dex: WT: 2.7 ± 0.65, cd59uva48: 3.5 ± 0.53; p-values: WT DMSO vs. WT Dex: p=0.0091, WT DMSO vs. cd59uva48 DMSO: p=0.0266, WT Dex vs. cd59uva48 DMSO: p<0.0001, cd59uva48 DMSO vs. cd59uva48 Dex: p<0.0001; dot = 1 fish). These data were compared with Student’s t-test using GraphPad Prism. All data were normalized to units per 100 µm. All images were acquired with confocal imaging. Scale bars: (A, B) 25 µm.
-
Figure 7—source data 1
Source data for the quantification of the number of Schwann cells (SCs) on the posterior lateral line nerve (pLLN) at 55 hours post fertilization (hpf) after dexamethasone (Dex) treatment depicted in Figure 7C.
Data contributed to scatter plot of the number of pLLN SCs at 55 hpf (mean ± SEM: DMSO: WT: 12.0 ± 0.5, cd59uva48: 18.1 ± 0.6; Dex: WT: 10.4 ± 0.4, cd59uva48: 13.4 ± 0.6; p-values: WT DMSO vs. cd59uva48 DMSO: p<0.0001, WT Dex vs. cd59uva48 DMSO: p<0.0001, WT Dex vs. cd59uva48 Dex: p=0.0014, cd59uva48 DMSO vs. cd59uva48 Dex: p<0.0001; t-test p-value (compared WT only): WT DMSO vs. WT Dex: p=0.0206; dot = 1 fish). All groups were compared with a two-way ANOVA with Tukey’s post-hoc test using GraphPad Prism. WT DMSO and WT Dex were also compared alone with Student’s t-test using GraphPad Prism. Asterisks (*) indicate significant differences discovered with two-way ANOVA with Tukey’s post-hoc test. Obelisk (†) indicates the significant difference discovered with Student’s t-test comparing WT DMSO and WT Dex alone. Data were collected from somites 11–13 (~320 µm) and normalized to units per 100 µm.
- https://cdn.elifesciences.org/articles/76640/elife-76640-fig7-data1-v1.xlsx
-
Figure 7—source data 2
Source data for the quantification of of EdU-positive Schwann cells (SCs) on the posterior lateral line nerve (pLLN) at 55 hours post fertilization (hpf) after dexamethasone (Dex) treatment depicted in Figure 7D.
Data contributed to scatter plot of the number of EdU-positive SCs at 55 hpf (mean ± SEM: DMSO: WT: 4.6 ± 0.85, cd59uva48: 9.0 ± 0.68; Dex: WT: 2.7 ± 0.65, cd59uva48: 3.5 ± 0.53; p-values: WT DMSO vs. WT Dex: p=0.0091, WT DMSO vs. cd59uva48 DMSO: p=0.0266, WT Dex vs. cd59uva48 DMSO: p<0.0001, cd59uva48 DMSO vs. cd59uva48 Dex: p<0.0001; dot = 1 fish). Data were compared with a two-way ANOVA with Tukey’s post-hoc test using GraphPad Prism. Data were collected from somites 11–13 (~320 µm) and normalized to units per 100 µm.
- https://cdn.elifesciences.org/articles/76640/elife-76640-fig7-data2-v1.xlsx
Figure 7—figure supplement 1
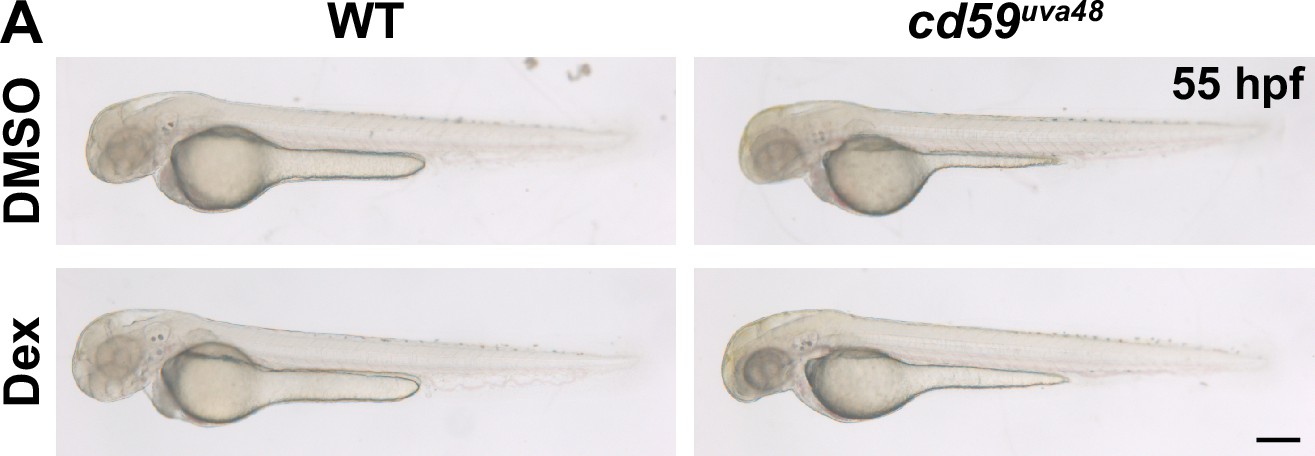
Controls for dexamethasone (Dex) treatment.
(A) Bright-field images of wildtype and mutant embryos (55 hours post fertilization [hpf]) treated with DMSO or 100 µM Dex from 24 to 55 hpf. Scale bar: (A) 0.25 mm.
Figure 8 with 1 supplement
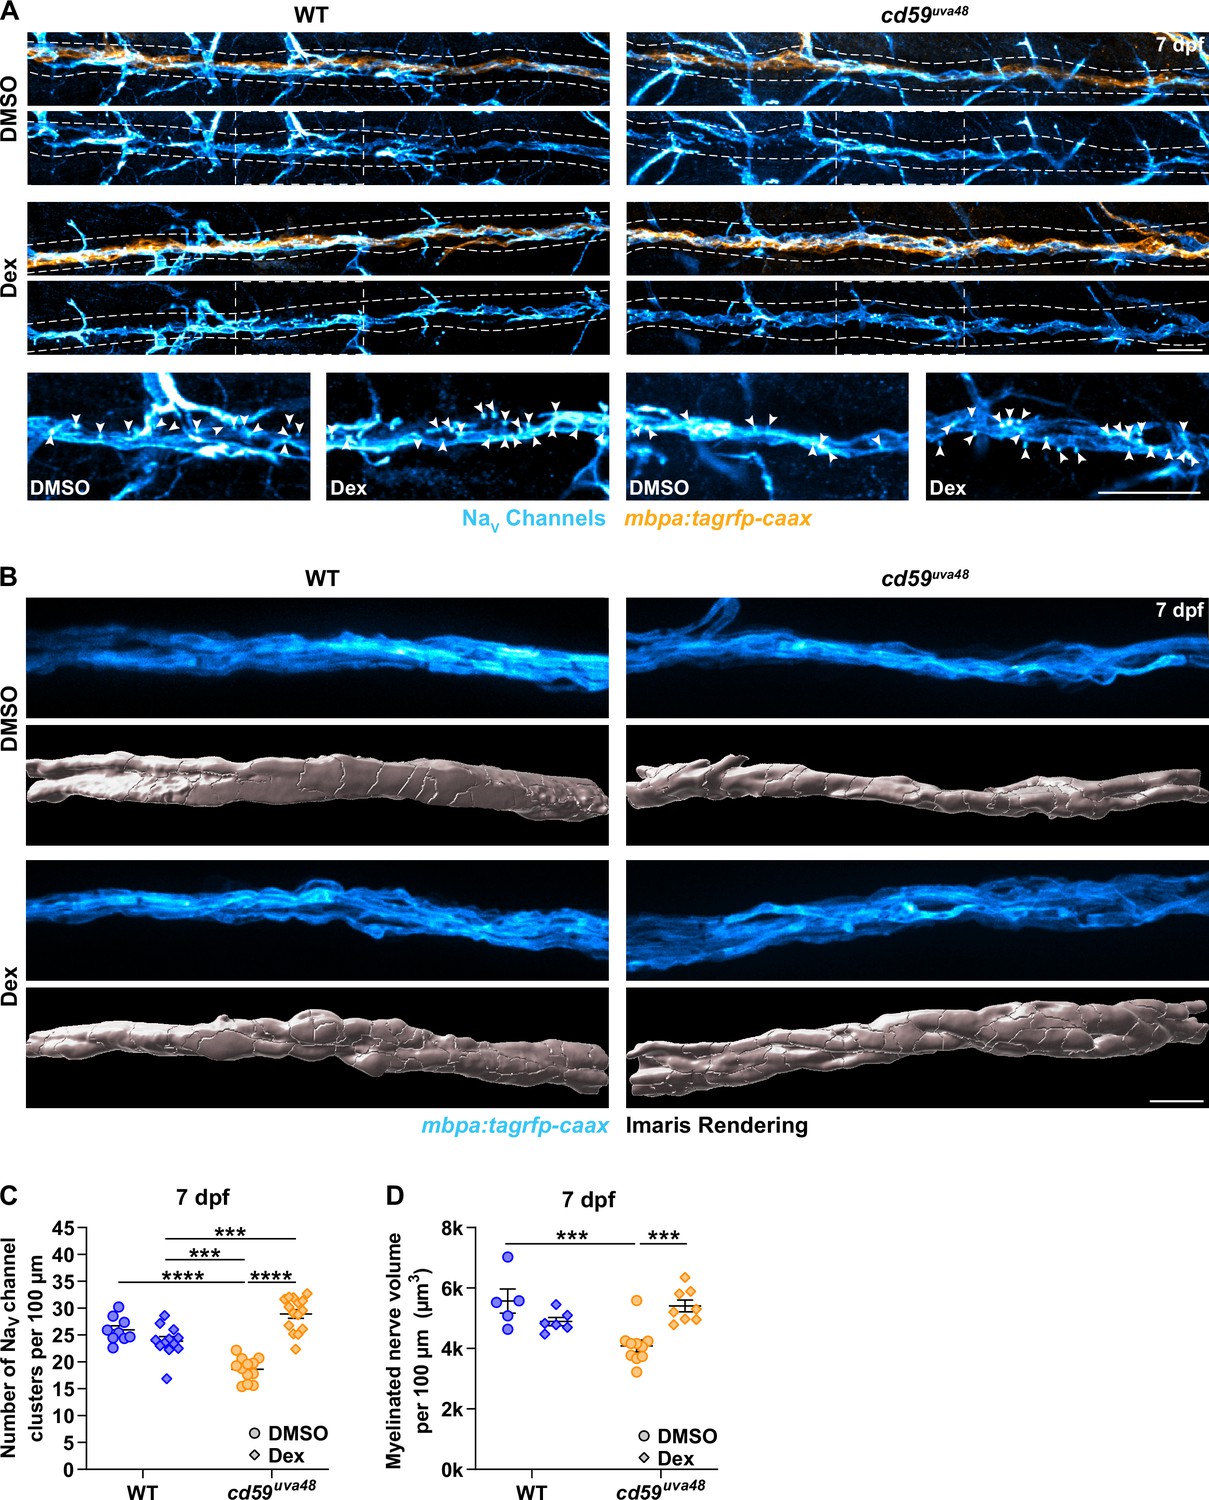
Developmental inflammation influences myelin and node of Ranvier development.
(A) Immunofluorescence (IF) showing NaV channels (cyan) along mbpa:tagrfp-caax-positive nerves (orange) at 7 days post fertilization (dpf) in larvae treated with DMSO or 100 µM dexamethasone (Dex). Diffuse NaV channel staining along unmyelinated nerves was not quantified. White dashed lines outline the posterior lateral line nerve (pLLN). White dashed boxes correspond with the insets below. Representative images are from somite 11–13 (~320 µm). (B) In vivo imaging showing the volume of mbpa:tagrfp-caax-positive nerves at 7 dpf in larvae treated with DMSO or 100 µM Dex. Bottom panels depict Imaris renderings (white) of myelinated nerve volumes. Representative images are from somite 12 (~110 µm). (C) Scatter plot of the number of NaV channel clusters along mbpa:tagrfp-caax-positive nerves at 7 dpf (mean ± SEM: DMSO: WT: 26.0 ± 0.8, cd59uva48: 18.6 ± 0.6; Dex: WT: 23.9 ± 0.8, cd59uva48: 28.9 ± 0.8; p-values: WT DMSO vs. cd59uva48 DMSO: p<0.0001, WT Dex vs. cd59uva48 DMSO: p=0.0001, WT Dex vs. cd59uva48 Dex: p=0.0001, cd59uva48 DMSO vs. cd59uva48 Dex: p<0.0001; dot = 1 fish). These data were compared with a two-way ANOVA with Tukey’s post-hoc test using GraphPad Prism. Data were collected from somites 3–13 (~320 µm). (D) Scatter plot of myelinated nerve volumes at 7 dpf (mean ± SEM: DMSO: WT: 5.6 ± 0.4, cd59uva48: 4.1 ± 0.2; Dex: WT: 4.9 ± 0.1, cd59uva48: 5.4 ± 0.2; p--values: WT DMSO vs. cd59uva48 DMSO: p=0.0009, cd59uva48 DMSO vs. cd59uva48 Dex: p=0.0006; dot = 1 fish). These data were compared with a two-way ANOVA with Tukey’s post-hoc test using GraphPad Prism. Data were collected from somite 12 (~110 µm). All data were normalized to units per 100 µm. All images were acquired with confocal imaging. Scale bars: (A) 25 µm; inset, 25 µm; (B) 10 µm.
-
Figure 8—source data 1
Source data for the quantification of the number of NaV channel clusters with dexamethasone (Dex) treatment depicted in Figure 8C.
Data contributed to scatter plot of the number of NaV channel clusters along mbpa:tagrfp-caax-positive nerves at 7 days post fertilization (dpf) (mean ± SEM: DMSO: WT: 26.0 ± 0.8, cd59uva48: 18.6 ± 0.6; Dex: WT: 23.9 ± 0.8, cd59uva48: 28.9 ± 0.8; p-values: WT DMSO vs. cd59uva48 DMSO: p<0.0001, WT Dex vs. cd59uva48 DMSO: p=0.0001, WT Dex vs. cd59uva48 Dex: p=0.0001, cd59uva48 DMSO vs. cd59uva48 Dex: p<0.0001; data point = 1 fish). These data were compared with a two-way ANOVA with Tukey’s post-hoc test using GraphPad Prism. Data were collected from somites 3–13 (~320 µm). All data were normalized to units per 100 µm.
- https://cdn.elifesciences.org/articles/76640/elife-76640-fig8-data1-v1.xlsx
-
Figure 8—source data 2
Source data for the quantification of the myelinated nerve volume with dexamethasone (Dex) treatment depicted in Figure 8D.
Data contributed to scatter plot of myelinated nerve volumes at 7 days post fertilization (dpf) (mean ± SEM: DMSO: WT: 5.6 ± 0.4, cd59uva48: 4.1 ± 0.2; Dex: WT: 4.9 ± 0.1, cd59uva48: 5.4 ± 0.2; p-values: WT DMSO vs. cd59uva48 DMSO: p=0.0009, cd59uva48 DMSO vs. cd59uva48 Dex: p=0.0006; data point = 1 fish). These data were compared with a two-way ANOVA with Tukey’s post-hoc test using GraphPad Prism. Data were collected from somite 12 (~110 µm). All data were normalized to units per 100 µm.
- https://cdn.elifesciences.org/articles/76640/elife-76640-fig8-data2-v1.xlsx
Figure 8—figure supplement 1
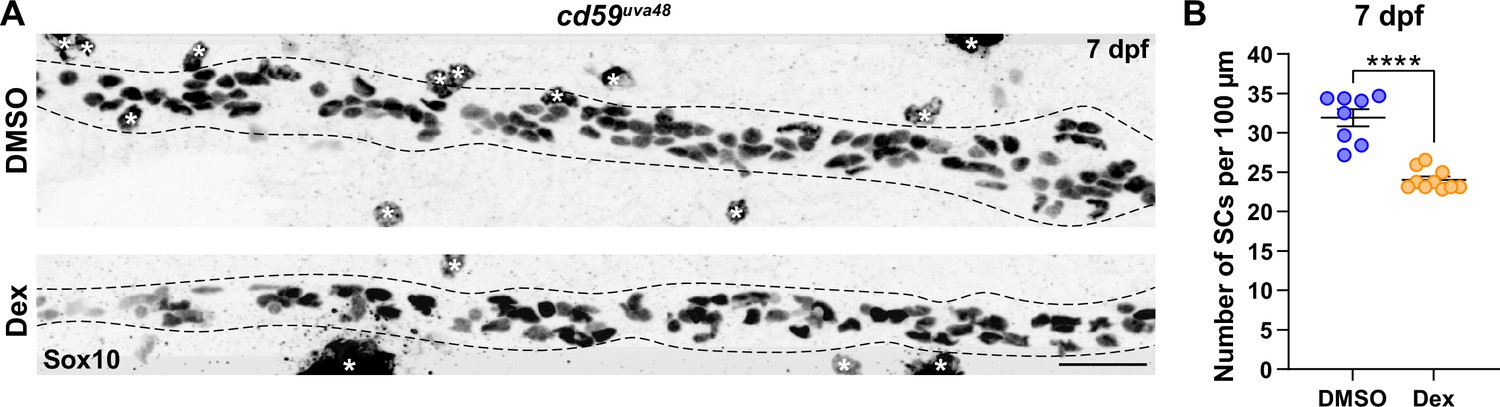
Extended dexamethasone (Dex) treatment had same impact on Schwann cell (SC) proliferation in cd59uva48 mutant larvae.
(A) Immunofluorescence (IF) showing Sox10-positive SCs (black/gray) at 7 days post fertilization (dpf) in cd59uva48 mutant larvae treated with DMSO or 100 µM Dex from 24 to 75 hours post fertilization (hpf). Black dashed lines outline the posterior lateral line nerve (pLLN). Sox10-positive pigment cells outside of the dashed lines (white asterisks) were not included in the analysis. Images were acquired with confocal imaging. (B) Scatter plot of the number of pLLN SCs at 7 hpf (mean ± SEM: DMSO: 31.9 ± 1.1, Dex: 24.0 ± 0.4; p<0.0001; dot = 1 fish). These data were compared with Student’s t-test using GraphPad Prism. Data were collected from somites 3–13 (~320 µm) and normalized to units per 100 µm. Scale bar: 25 µm.
-
Figure 8—figure supplement 1—source data 1
Source data for the quantification of the number of Schwann cells (SCs) on the posterior lateral line nerve (pLLN) at 7 days post fertilization (dpf) after extended dexamethasone (Dex) treatment depicted in Figure 8—figure supplement 1B.
Data contributed to scatter plot of the number of pLLN SCs at 7 hours post fertilization (hpf) (mean ± SEM: DMSO: 31.9 ± 1.1, Dex: 24.0 ± 0.4; p<0.0001; data point = 1 fish). These data were compared with Student’s t-test using GraphPad Prism. Data were collected from somites 3–13 (~320 µm) and normalized to units per 100 µm.
- https://cdn.elifesciences.org/articles/76640/elife-76640-fig8-figsupp1-data1-v1.xlsx
Videos
Video 1
Wildtype sox10:tagrfp-positive Schwann cells (SCs) along the posterior lateral line nerve (pLLN) migrate and undergo cell division from 48 to 55 hours post fertilization (hpf).
Images were taken every 10 min, and the movie runs at 3 frames per second (fps). Data were collected from somites 11–13 (~320 µm). Mitotic events indicated with magenta arrows. Quantification of the number of mitotic events is indicated in Figure 4H. Scale bar: 25 µm.
Video 2
cd59uva48 mutant sox10:tagrfp-positive Schwann cells (SCs) along the posterior lateral line nerve (pLLN) migrate and undergo cell division from 48 to 55 hours post fertilization (hpf).
Images were taken every 10 min, and the movie runs at 3 frames per second (fps). Data were collected from somites 11–13 (~320 µm). Mitotic events indicated with magenta arrows. Quantification of the number of mitotic events is indicated in Figure 4H. Scale bar: 25 µm.
Video 3
Wildtype sox10:tagrfp-positive Schwann cells (SCs) along the posterior lateral line nerve (pLLN) migrate, undergo cell division, and begin to form myelin from 54 to 75 hours post fertilization (hpf).
Images were taken every 10 min, and the movie runs at 3 frames per second (fps). Data were collected from somites 11–13 (~320 µm). Mitotic events indicated with magenta arrows. Quantification of the number of mitotic events is indicated in Figure 4I. Time of last final cell division is indicated in Figure 4J. Scale bar: 25 µm.
Video 4
cd59uva48 mutant sox10:tagrfp-positive Schwann cells (SCs) along the posterior lateral line nerve (pLLN) migrate, undergo cell division, and begin to form myelin from 54 to 75 hours post fertilization (hpf).
Images were taken every 10 min, and the movie runs at 3 frames per second (fps). Data were collected from somites 11–13 (~320 µm). Mitotic events indicated with magenta arrows. Quantification of the number of mitotic events is indicated in Figure 4I. Time of last final cell division is indicated in Figure 4J. Scale bar: 25 µm.
Tables
Key resources table
| Reagent type (species) or resource | Designation | Source or reference | Identifiers | Additional information |
|---|---|---|---|---|
| Strain, strain background (Danio rerio) | AB* | ZIRC | RRID:ZFIN_ZDB-GENO-960809-7 | |
| Genetic reagent (D. rerio) | Tg(sox10(4.9):nls-eos)w18 | McGraw et al., 2012 | RRID:ZFIN_ZDB-ALT-110721-2 | |
| Genetic reagent (D. rerio) | Tg(sox10(4.9):tagrfp)uva5 | Zhu et al., 2019 | RRID:ZFIN_ZDB-ALT-200513-7 | Also referred to as sox10:tagrfp; cytoplasmic expression of TagRFP |
| Genetic reagent (D. rerio) | Tg(sox10(7.2):megfp)sl3 | Kirby et al., 2006 | RRID:ZFIN_ZDB-ALT-150113-6 | Also referred to as sox10:megfp; membrane-tethered expression of eGFP |
| Genetic reagent (D. rerio) | Tg(mbp(2.0):egfp-caax)ue2 | Almeida et al., 2011 | RRID:ZFIN_ZDB-ALT-120103-2 | Also referred to as mbp:egfp-caax; membrane-tethered expression of eGFP |
| Genetic reagent (D. rerio) | gSAIzGFFD37A | Brown et al., 2022 | Also referred to as Gt(erbb3b:gal4);Tg(uas:egfp) or gal4:erbb3b;uas:egfp; cytoplasmic expression of eGFP | |
| Genetic reagent (D. rerio) | Tg(olig2:dsred2)vu19 | Shin et al., 2003 | RRID:ZFIN_ZDB-FISH-150901-8168 | Also referred to as olig2:dsred; cytoplasmic expression of DsRed2 |
| Genetic reagent (D. rerio) | Tg(mbpa(6.6):tagrfp-caax;cry:egfp)uva53 | This paper | Also referred to as mbpa:tagrfp-caax; membrane expression of TagRFP; more information found in ‘Generation of transgenic lines’; available from the Kucenas Lab | |
| Genetic reagent (D. rerio) | Tg(cd59(5.0):tagrfp)uva52 | This paper | Also referred to as cd59:tagrfp; cytoplasmic expression of TagRFP; more information found in ‘Generation of transgenic lines’; available from the Kucenas Lab | |
| Genetic reagent (D. rerio) | cd59uva48 | This paper | 15 bp deletion at splice site between exon 2 and intron 2 of cd59 gene, BX957297.10:g.44_58delTGCTGGGGCTTGGTA; more information found in ‘Generation of mutant lines’; available from the Kucenas Lab | |
| Genetic reagent (D. rerio) | cd59uva47 | This paper | 6 bp deletion in exon 2 of cd59 gene, BX957297.10:g.45_50delGCTGGG; more information found in ‘Generation of mutant lines’; available from the Kucenas Lab | |
| Recombinant DNA reagent | p5E-cd59(–5.0) | This paper | More information found in ‘Generation of transgenic lines’; available from the Kucenas Lab | |
| Recombinant DNA reagent | p5E-mbpa(–6.6) | This paper | More information found in ‘Generation of transgenic lines’; available from the Kucenas Lab | |
| Recombinant DNA reagent | pME-tagrfp | Don et al., 2017 | N/A | |
| Recombinant DNA reagent | pME-tagrfpcaax | Auer et al., 2015 | N/A | |
| Recombinant DNA reagent | p3E-polyA | Kwan et al., 2007 | N/A | |
| Recombinant DNA reagent | pDestTol2pA2 | Kwan et al., 2007 | N/A | |
| Recombinant DNA reagent | pDestTol2pA2cryegfp | Kwan et al., 2007 | N/A | |
| Recombinant DNA reagent | pCS2FA-transposase | Kwan et al., 2007 | N/A | Template for Tol2 transposase mRNA synthesis |
| Commercial assay or kit | MEGAshortscript T7 transcription kit | Invitrogen | Cat# AM1354 | |
| Commercial assay or kit | QIAprep spin miniprep kit | QIAGEN | Cat# 27106 | |
| Commercial assay or kit | QIAquick PCR purification kit | QIAGEN | Cat# 28106 | |
| Commercial assay or kit | QIAquick gel extraction kit | QIAGEN | Cat# 28704 | |
| Commercial assay or kit | RNeasy mini kit | QIAGEN | Cat# 74104 | |
| Commercial assay or kit | pENTR 5′-TOPO cloning kit | Invitrogen | Cat# K59120 | |
| Commercial assay or kit | TOPO TA cloning kit | Invitrogen | Cat# K4575J10 | |
| Commercial assay or kit | LR clonase II plus | Invitrogen | Cat# 12538-120 | |
| Commercial assay or kit | Click-it EdU cell proliferation kit for imaging. Alexa Fluor 647 dye | Invitrogen | Cat# C11340 | |
| Commercial assay or kit | RNAscope fluorescent multiplex reagent kit | ACD | Cat# 320850 | |
| Commercial assay or kit | mMESSAGE mMACHINE sp6 transcription kit | Invitrogen | Cat# AM1340 | |
| Commercial assay or kit | ApopTag red in situ apoptosis detection kit | Sigma | Cat# S7165 | |
| Commercial assay or kit | High-capacity cDNA reverse transcription kit | Thermo Fisher | Cat# 4368814 | |
| Commercial assay or kit | Glutaraldehyde (electron microscopy grade) | Sigma | Cat# G7651 | |
| Chemical compound, drug | RNAscope probe diluent | ACD | Cat# 300041 | |
| Chemical compound, drug | RNAscope probe-Dr-cd59-C2 | ACD | Cat# 561561-C2 | |
| Chemical compound, drug | DAPI fluoromount-G | Southern Biotech | Cat# AM1340 | |
| Chemical compound, drug | DIG RNA labeling mix | Roche | Cat# 11277073910 | |
| Chemical compound, drug | Dexamethasone | Sigma | Cat# D1756 | 100 µM, also referred to as Dex |
| Chemical compound, drug | Instant ocean sea salt | ThatFishPlace | Cat# 242818 | 0.3 g/L, used to make egg water |
| Chemical compound, drug | 1-Phenyl-2-thiourea | Sigma | Cat# P7629 | 0.004%, also referred to as PTU |
| Chemical compound, drug | Tricaine-S (MS-222) | The Pond Outlet | No Cat# | Also referred to as tricaine |
| Chemical compound, drug | Cas9 protein | PNA Bio | Cat# CP01-50 | |
| Chemical compound, drug | Low gelling temperature agarose | Sigma | Cat# 9414 | |
| Chemical compound, drug | Agar | Fisher Scientific | Cat# BP1423500 | |
| Chemical compound, drug | Sucrose | Sigma | Cat# S5016 | |
| Chemical compound, drug | 2-Methylbutane | Fisher Scientific | Cat# 03551-4 | |
| Chemical compound, drug | Acridine orange hemi (zinc chloride) salt | Santa Cruz Biotechnology | Cat# sc-214488 | Also referred to as AO |
| Chemical compound, drug | Diethyl pyrocarbonate | Sigma | Cat# D5758 | 1:1000; also referred to as DEPC |
| Chemical compound, drug | 20× SSC | Quality Biological | Cat# 351-003-131 | |
| Chemical compound, drug | Triton X-100 | Sigma | Cat# T8787 | |
| Chemical compound, drug | 100 bp DNA ladder | New England BioLabs Inc. | Cat# N3231L | |
| Chemical compound, drug | Sodium cacodylate trihydrate | Sigma | Cat# 0250 | Also referred to as SCT |
| Chemical compound, drug | Osmium tetroxide (electron microscopy grade) | Sigma | Cat# 75632 | |
| Chemical compound, drug | Uranyl acetate | Morris et al., 2017 | ||
| Chemical compound, drug | EPON | Morris et al., 2017 | ||
| Chemical compound, drug | Sheep serum | Gemini Bioproducts | Cat# 100-117 | |
| Chemical compound, drug | Goat serum | Gemini Bioproducts | Cat# 100-109 | |
| Chemical compound, drug | Proteinase K | Fisher Scientific | Cat# BP1700-100 | |
| Chemical compound, drug | Bovine serum albumin | Fisher Scientific | Cat# BP1600-100 | |
| Antibody | Anti-HuC/HuD (mouse monoclonal) | Invitrogen | Cat# A-21271 | (1:500) |
| Antibody | Anti-acetylated tubulin (mouse monoclonal) | Sigma | Cat# T7451 | (1:10,000); acetylated tubulin; also referred to as tubulin |
| Antibody | Fab fragments anti-digoxigenin-AP (sheep polyclonal) | Sigma | Cat# 11093274910; RRID:AB_514497 | (1:5000) |
| Antibody | Anti-sox10 (rabbit polyclonal) | Binari et al., 2013 | N/A | (1:5000) |
| Antibody | Anti-GFP (chicken polyclonal) | Abcam | Cat# ab13970; RRID:AB_300798 | (1:500) |
| Antibody | Anti-sodium channel, pan (mouse monoclonal) | Sigma | Cat# S8809 | (1:500) |
| Antibody | Anti-TagRFP (rabbit polyclonal) | Invitrogen | Cat# 10367 | (1:500) |
| Antibody | Anti-neurofascin 186 (rabbit polyclonal) | Gift from Matthew Rasband | N/A | (1:200), neurofascin 186; also referred to as NF186 |
| Antibody | Anti-C5b-8+C5b-9 (mouse monoclonal) | Abcam | Cat# ab66768 | (1:500), C5b-8+C5b-9; also referred to membrane attack complex or MAC |
| Antibody | Alexa Fluor 488 anti-chicken IgY (H+L) (goat polyclonal) | Thermo Fisher | Cat# A-11039; RRID:AB_2534096 | (1:1000) |
| Antibody | Alexa Fluor 647 anti-rabbit IgG (H+L) (goat polyclonal) | Thermo Fisher | Cat# A-21244; RRID:AB_2535812 | (1:1000) |
| Antibody | Alexa Fluor 647 anti-mouse IgG (H+L) (goat polyclonal) | Thermo Fisher | Cat# A-21235; RRID:AB_2535804 | (1:1000) |
| Antibody | Alexa Fluor 488 anti-mouse IgG (H+L) (goat polyclonal) | Thermo Fisher | Cat# A-11001 | (1:1000) |
| Antibody | Alexa Fluor 568 anti-rabbit IgG (H+L) (goat polyclonal) | Thermo Fisher | Cat# A-11011 | (1:1000) |
| Sequence-based reagent | cd59-F (for transgenic construction) | This paper | PCR primers | 5’-TCAGATCACATCACACCTGA-3'; more information found in ‘Generation of transgenic lines’ |
| Sequence-based reagent | cd59-R (for transgenic construction) | This paper | PCR primers | 5’-AATGCCTTCAGTTTACCAGTCT-3'; more information found in ‘Generation of transgenic lines’ |
| Sequence-based reagent | mbpa-F (for transgenic construction) | This paper | PCR primers | 5’-ATGTCGAGTAATATCGAGCAGC-3'; more information found in ‘Generation of transgenic lines’ |
| Sequence-based reagent | mbpa-R (for transgenic construction) | Almeida et al., 2011 | PCR primers | 5’-GTTGATCTGTTCAGTGGTCTACA-3'; |
| Sequence-based reagent | cd59-F (for mutant genotyping) | This paper | PCR primers | 5’-TGGTAAACTGAAGGCATTATGAAA-3'; more information found in ‘Generation of mutant lines’ |
| Sequence-based reagent | cd59-R (for mutant genotyping) | This paper | PCR primers | 5’-GCAGGCATCATCATAGTAGCAG-3'; more information found in ‘Generation of mutant lines’ |
| Sequence-based reagent | cd59-F (for RT-PCR analysis) | This paper | PCR primers | 5'-ATGAAAGCTTCTGTCGGAGTGT-3'; more information found in ‘RT-PCR analysis’ |
| Sequence-based reagent | cd59-R (for RT-PCR analysis) | This paper | PCR primers | 5'-TTAGAAAACACCCCACCAGAAG-3'; more information found in ‘RT-PCR analysis’ |
| Sequence-based reagent | cd59 sgRNA-F (for sgRNA synthesis) | This paper | PCR primers | 5’-TAATACGACTCACTATAGGGCTGGCTCTGCTGGGGCTGTTTAGAGCTAGAAATAGCAAG-3’; more information found in ‘Generation of mutant lines’ |
| Sequence-based reagent | Constant oligonucleotide-R (for sgRNA synthesis) | Gagnon et al., 2014 | PCR primers | 5’-AAAAGCACCGACTCGGTGCCACTTTTTCAAGTTGATAACGGACTAGCCTTATTTTAACTTGCTATTTCTAGCTCTAAAAC-3’ |
| Sequence-based reagent | cd59-F (for CISH RNA probe) | This paper | PCR primers | 5'-GCCTGCTTGTCTGTCTACGA-3'; more information found in ‘In situ hybridization’ |
| Sequence-based reagent | cd59-R+T7 (for CISH RNA probe) | This paper | PCR primers | 5'-TAATACGACTCACTATAGAGGTGACGAGATTAGCTGCG-3'; more information found in ‘In situ hybridization’ |
| Software, algorithm | ImageJ/Fiji | RRID:SCR_003070 | ||
| Software, algorithm | Prism 9.2 | GraphPad Software | RRID:SCR_002798 | |
| Software, algorithm | Metamorph | Molecular Devices | RRID:SCR_002368 | |
| Software, algorithm | Andor iQ 3.6.3 | Oxford Instruments | RRID:SCR_014461 | |
| Software, algorithm | Imaris 9.8.0 | Oxford Instruments | RRID:SCR_007370 | |
| Software, algorithm | RStudio | RStudio | RRID:SCR_000432 | |
| Software, algorithm | Illustrator | Adobe | RRID:SCR_010279 | |
| Software, algorithm | CHOPCHOP | Labun et al., 2019; Labun et al., 2016; Gagnon et al., 2014 | https://chopchop.cbu.uib.no/ | |
| Software, algorithm | CRISPRscan | Moreno-Mateos et al., 2015 | https://www.crisprscan.org/ |
Additional files
Download links
A two-part list of links to download the article, or parts of the article, in various formats.
Downloads (link to download the article as PDF)
Open citations (links to open the citations from this article in various online reference manager services)
Cite this article (links to download the citations from this article in formats compatible with various reference manager tools)
Cd59 and inflammation regulate Schwann cell development
eLife 11:e76640.
https://doi.org/10.7554/eLife.76640


