Single-cell transcriptomics of a dynamic cell behavior in murine airways
- Harvard Medical School and Wellman Center for Photomedicine, Massachusetts General Hospital, United States
- Harvard-MIT Health Sciences and Technology, Massachusetts Institute of Technology, United States
- Broad Institute of MIT and Harvard, United States
- Department of Systems Biology, Harvard Medical Schoo, United States
- Department of Environmental Health, Harvard T. H. Chan School of Public Health, United States
- Center for Regenerative Medicine, Massachusetts General Hospital, United States
- Division of Pulmonary and Critical Care Medicine, Department of Medicine, Massachusetts General Hospital, United States
Figures
Figure 1 with 1 supplement
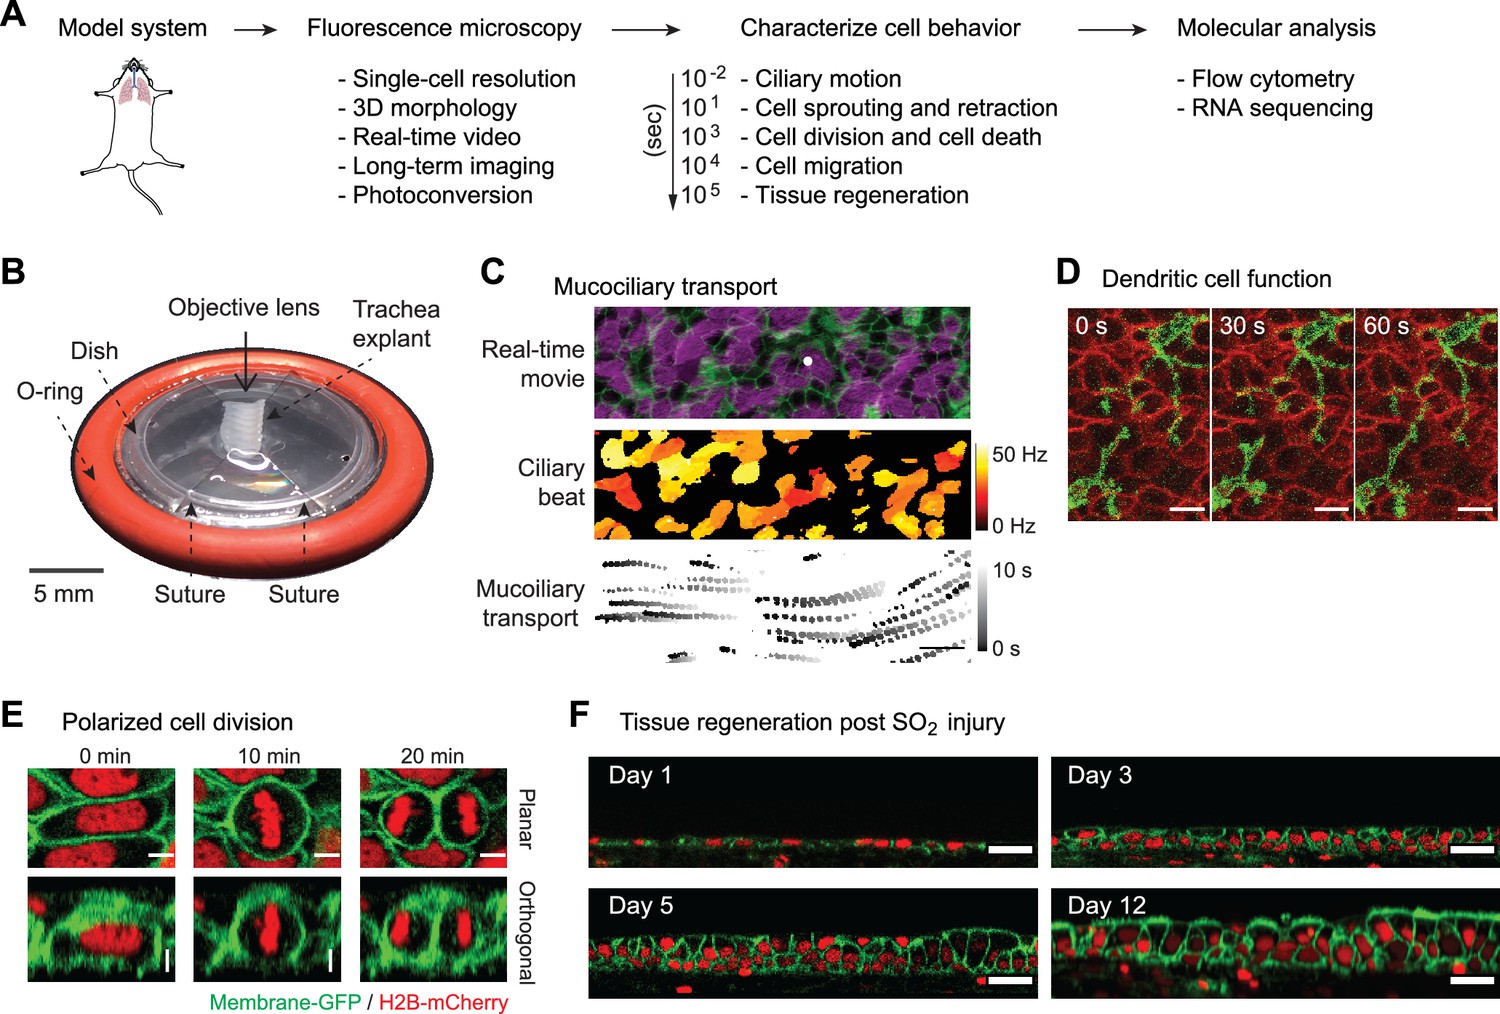
Platform for live imaging of airway tissue.
(A) Behavioral transcriptomics workflow, starting with imaging, followed by image analysis to characterize cellular behavior over different time frames, leading to single-cell applications. (B) Airway tissue (trachea) is explanted from a mouse and affixed to a custom platform for long-term air-liquid-interface (ALI) culture and imaging. The platform enables both time-lapse microscopy and downstream single-cell applications. (C) Imaging and image analysis of ciliary beating and mucociliary transport 1 μm spherical beads. (D) Intraepithelial dendritic cells (CD11cCre-MTMG) grow and retract dendrites in real time; scale bar = 5 μm (E) Selected snapshots of cell division during regeneration post-sulfur dioxide (SO2) injury. Epithelial cell divides along its long axis during regeneration (Hertwig’s rule); scale bar = 5 μm. (F) Long-term ALI culture enables imaging of tissue regeneration post-SO2 injury over >12 days. ALI culture enables regeneration of entire epithelial thickness; scale bar = 20 μm. Green = membrane GFP; red = nuclear-tdTomato.
Figure 1—figure supplement 1
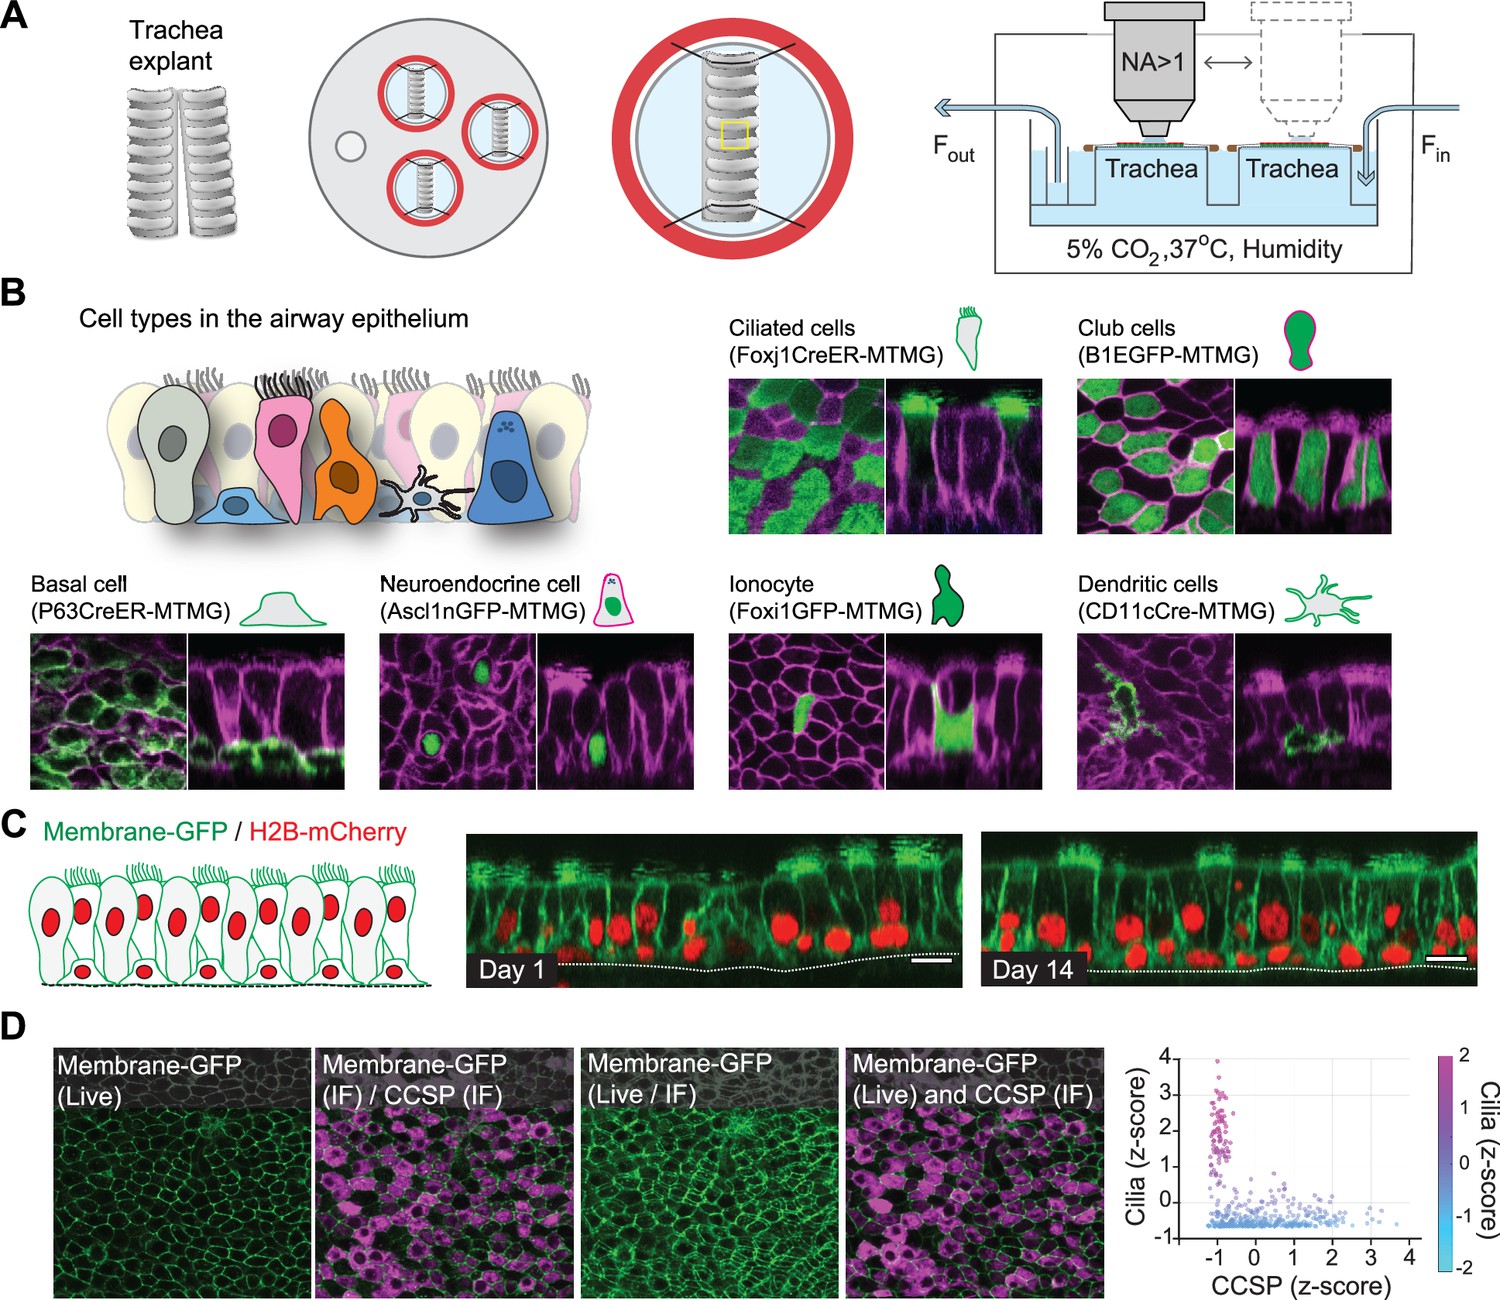
Platform for live imaging of airway tissue.
(A) Detailed schematic of air-liquid interface (ALI) platform for airway tissue imaging. The platform enables the imaging of multiple tissue explants at a time in a controlled environment maintaining ALI, temperature, humidity, and CO2 content. (B) Representative images of airway epithelial cells using different transgenic mouse models including fluorescent reporters for ciliated, club, basal, neuroendocrine, ionocyte, and dendritic cells. Green = cell type-specific GFP reporter; magenta = membrane-tdTomato. Scale bar = 10 μm. (C) Representative two-photon images of the same airway tissue explanted from a membrane-GFP/H2B-mCherry transgenic mouse at day 1 and day 14 in ALI culture. Scale bar = 10 μm. (D) Registration of live imaging with post-fixation-staining imaging using in silico tissue flattening followed by non-rigid 3D registration. Ciliated cells identified by live imaging were found to have low CCSP expression, while cells with high CCSP expression tended to have no cilia.
Figure 2 with 3 supplements
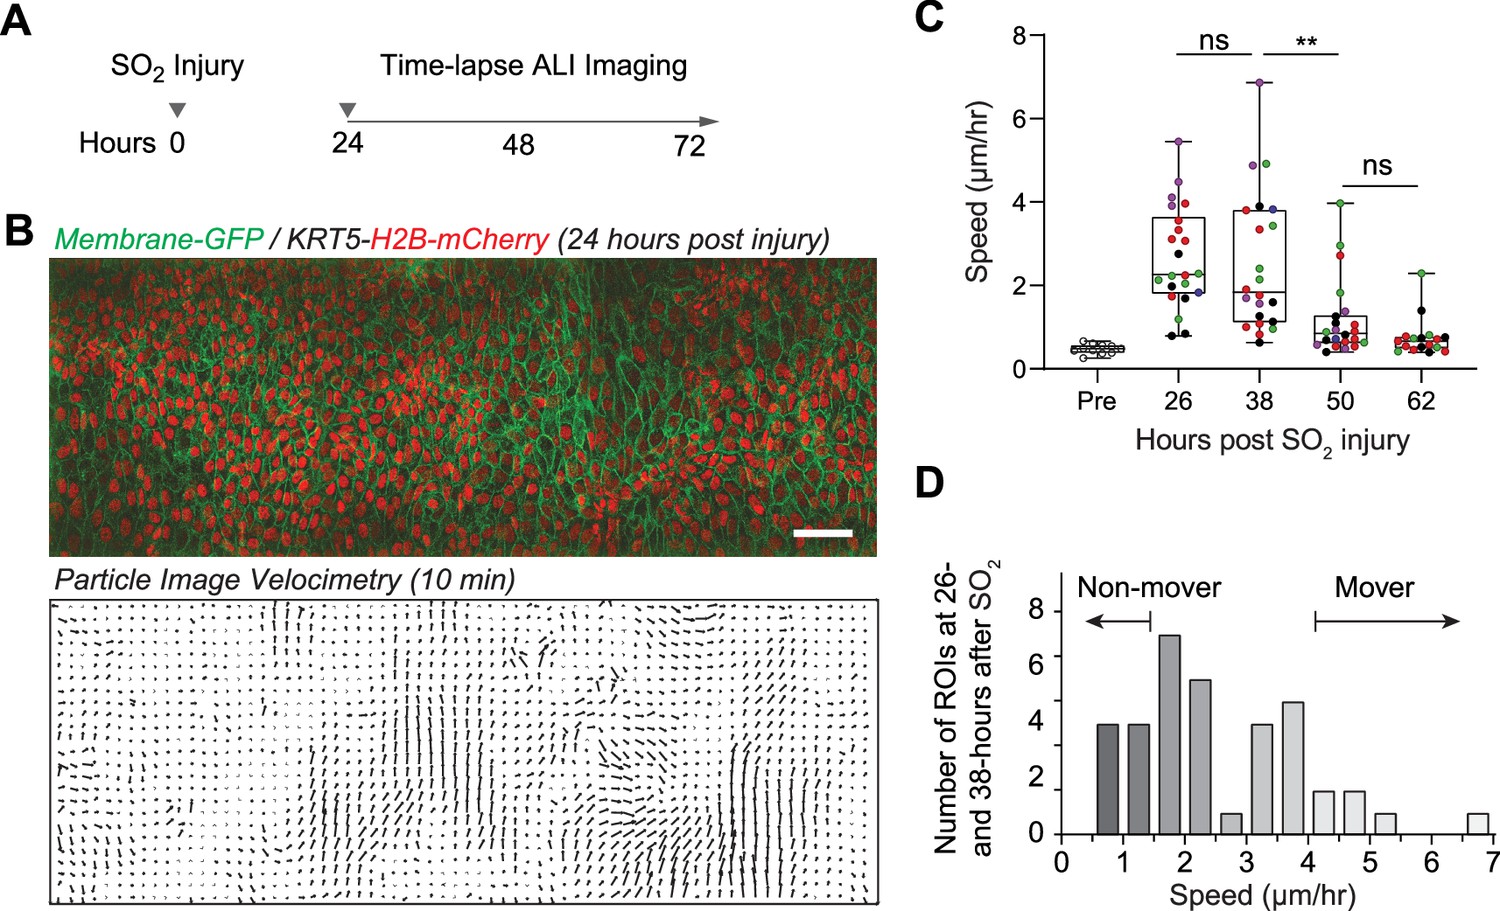
Live imaging enables observation of the movement of regenerating airway epithelial cells.
(A) Experimental design: tracheas are explanted 24 hr post-sulfur dioxide (SO2) injury for continuous time-lapse imaging. (B) Two-photon imaging of trachea epithelium from membrane- GFP, KRT5-H2B-mCherry transgenic mouse. Top image is a stitch of three areas. Bottom image shows displacement vectors over 10 min computed using particle imaging velocimetry (PIV). Scale bar = 50 μm. (C) Computed speed of epithelial cells measured at different time points post-SO2 injury in 22 independent regions from a total of five mice at four different time points (mouse origin is color-coded). Box and whisker plots are superimposed. A two-way ANOVA was run to examine the effect of time post-SO2 injury and different mice on the mean speed determined by PIV. There were 22 ROIs analyzed from five mice over four time points. There was a significant interaction between time and the mean speed, F(2.219, 42.91) = 16.12, p<0.0001, but no significant difference between mouse and mean speed, F(4,17) = 2.193, p=0.113. A Tukey post-hoc test revealed significant pairwise differences between 26 and 50 hr, 26 and 62 hr, 38 and 50 hr, as well as 38 and 62 hr. **p<0.01. (D) Frequency distribution of injury-induced cell movements measured at 26- and 38 hr after injury identifies ‘mover’ and ‘non-mover’ regions.
Figure 2—figure supplement 1
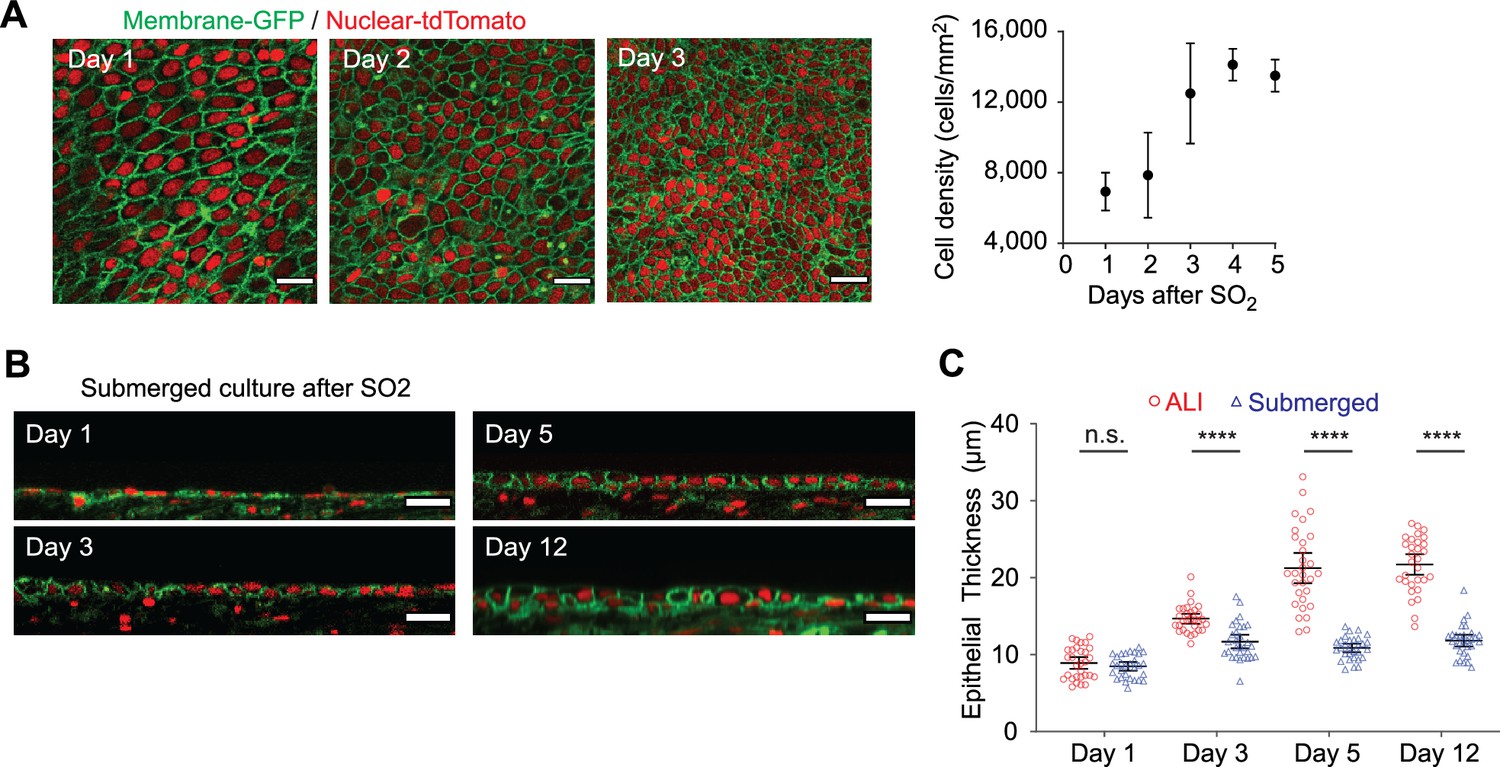
Epithelial regeneration after sulfur dioxide injury ex vivo.
(A) Quantification of cell density measured post-sulfur dioxide (SO2) injury using membrane-GFP/nuclear- tdTomato mice. Scale bar = 20 μm. n=5, error bars indicate the standard deviation. (B) Long-term imaging of tissue regeneration post-SO2 injury in a submerged culture condition. (C) Comparison of tissue regeneration between air-liquid interface (ALI) and submerged culture. Compared to submerged culture, ALI culture enables regeneration of the full epithelial thickness. Green = membrane GFP; red = nuclear tdTomato. Error bars indicate the 95% confidence intervals. ****p<0.0001.
Figure 2—figure supplement 2
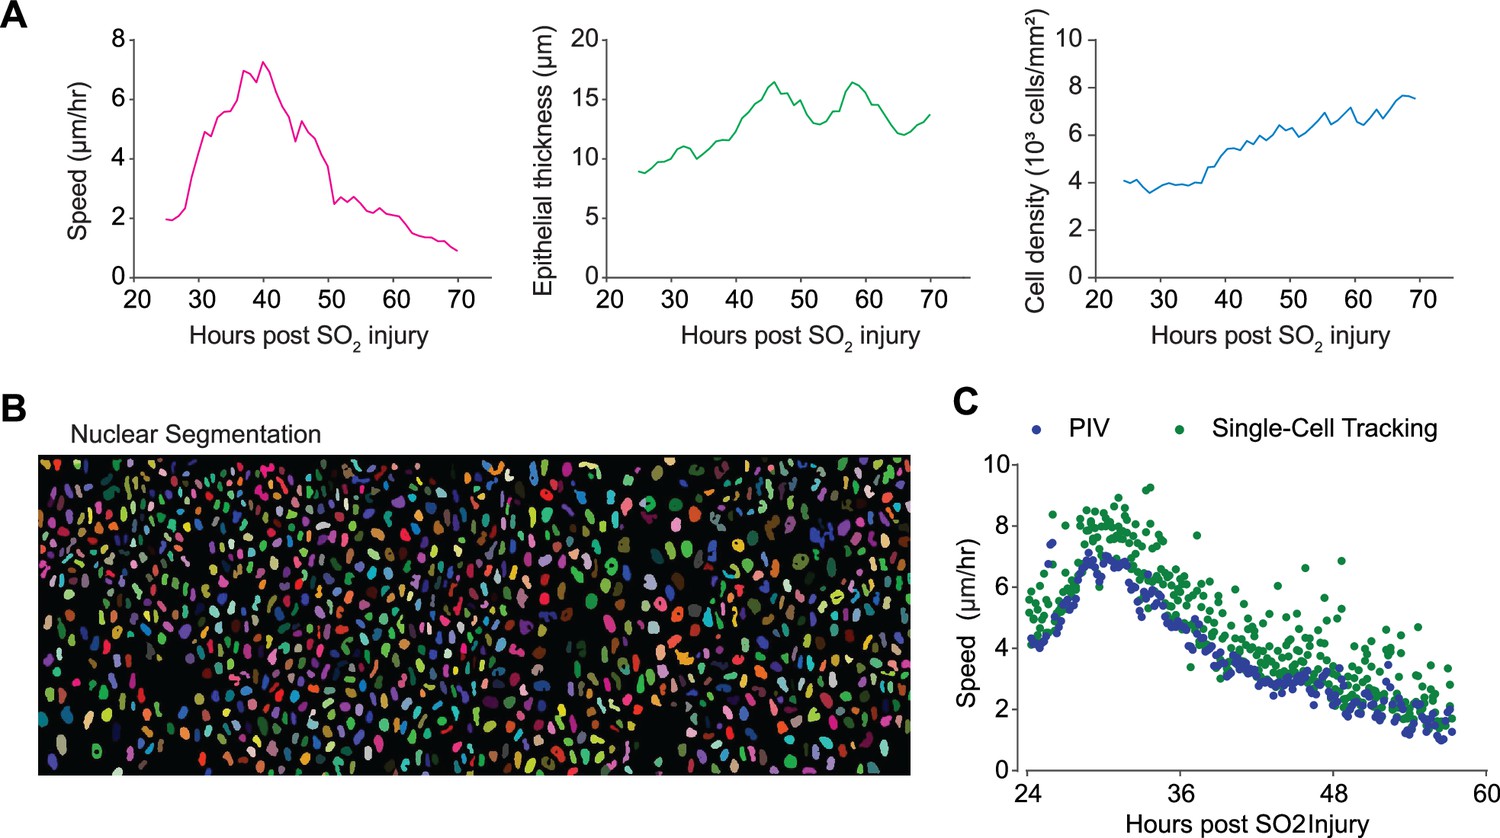
Live imaging enables quantitative analysis of epithelial cell movement over time.
(A) Quantification of key parameters quantified by time-lapse imaging of the regenerating epithelium, including speed, epithelial thickness, and cell density. (B) Nuclear segmentation of epithelial cells from KRT5rtTA-H2BmCherry transgenic mouse. (C) Speed of moving cells from time-lapse microscopy computed by particle-imaging-velocimetry (PIV) and single-cell tracking of segmented nuclei. There is no significant difference in the computed speed using different methods.
Figure 2—figure supplement 3
Live imaging with high temporal resolution.
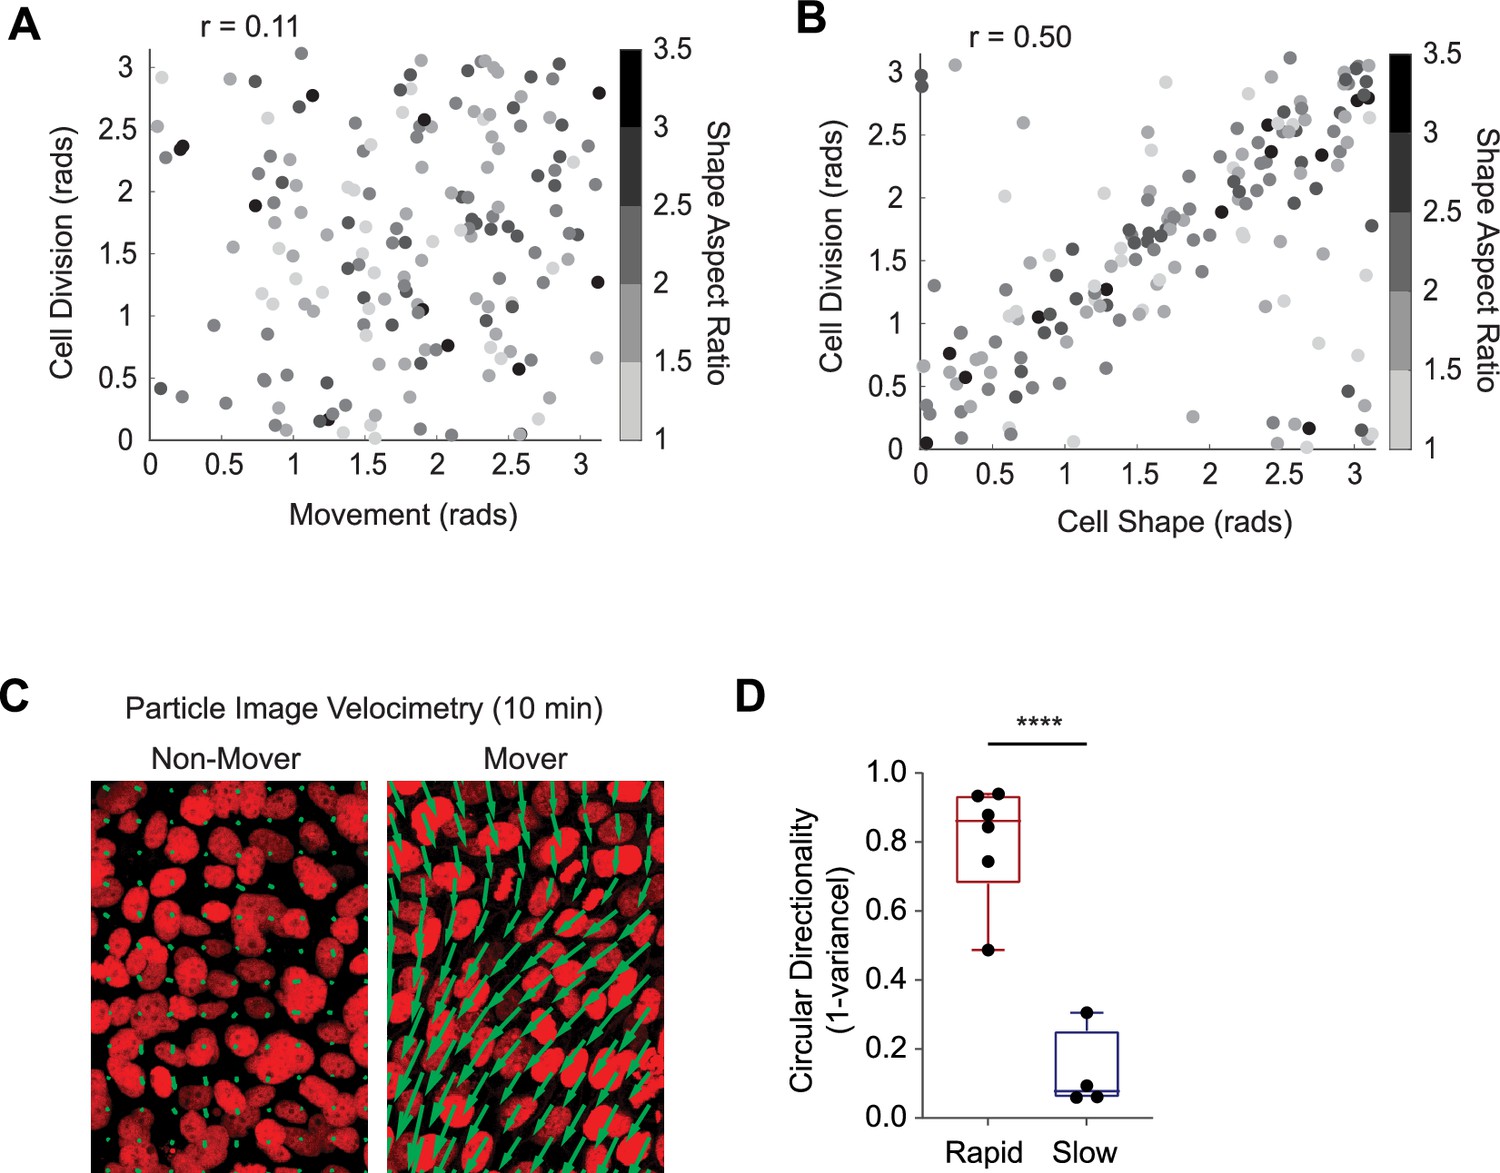
(A) Quantification of cell division behaviors during regeneration. The axis of cell division was found to have minimal correlation (r=0.11) with local movement, (B) but a moderate correlation with the long axis of the cell (r=0.50). (C) Representative movement vectors computed from particle image velocimetry (PIV) analysis for a rapid ‘mover’ and a slow ‘non-mover’ region. (D) Cell movement vectors computed from PIV analysis were fit to a von Mises distribution to compute the circular variance. Box and whisker plots are superimposed. Fast-moving cells had a low circular variance (directional), while slow-moving cells had a high circular variance (no directional preference). ****p<0.0001.
Figure 3 with 2 supplements
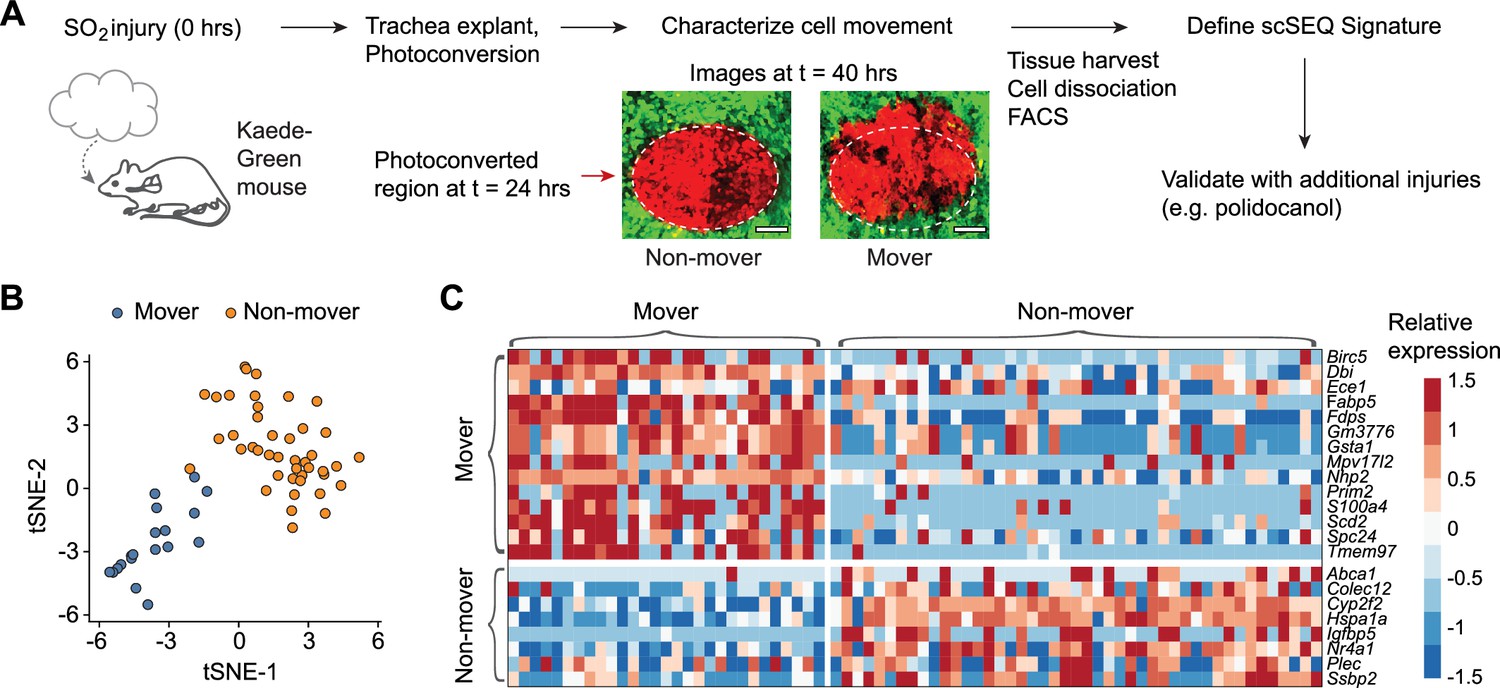
Transcriptionally distinct moving (M) and non-moving (NM) cells coordinate early airway epithelial regeneration across multiple injury types.
(a) Experimental design: tracheas are explanted 24 hr post-sulfur dioxide (SO2) injury (24 hpi) for continuous time-lapse two-photon imaging. Distinct cellular phenotypes are observed and labeled by photo-conversion for subsequent isolation and transcriptional analysis by full-length single-cell RNA-sequencing. Scale bar = 100 μm (b) Unsupervised clustering of regenerating cells partitions mover and non-mover cell phenotypes. (c) Heatmap of transcriptional signatures of mover and non-mover cells.
Figure 3—figure supplement 1
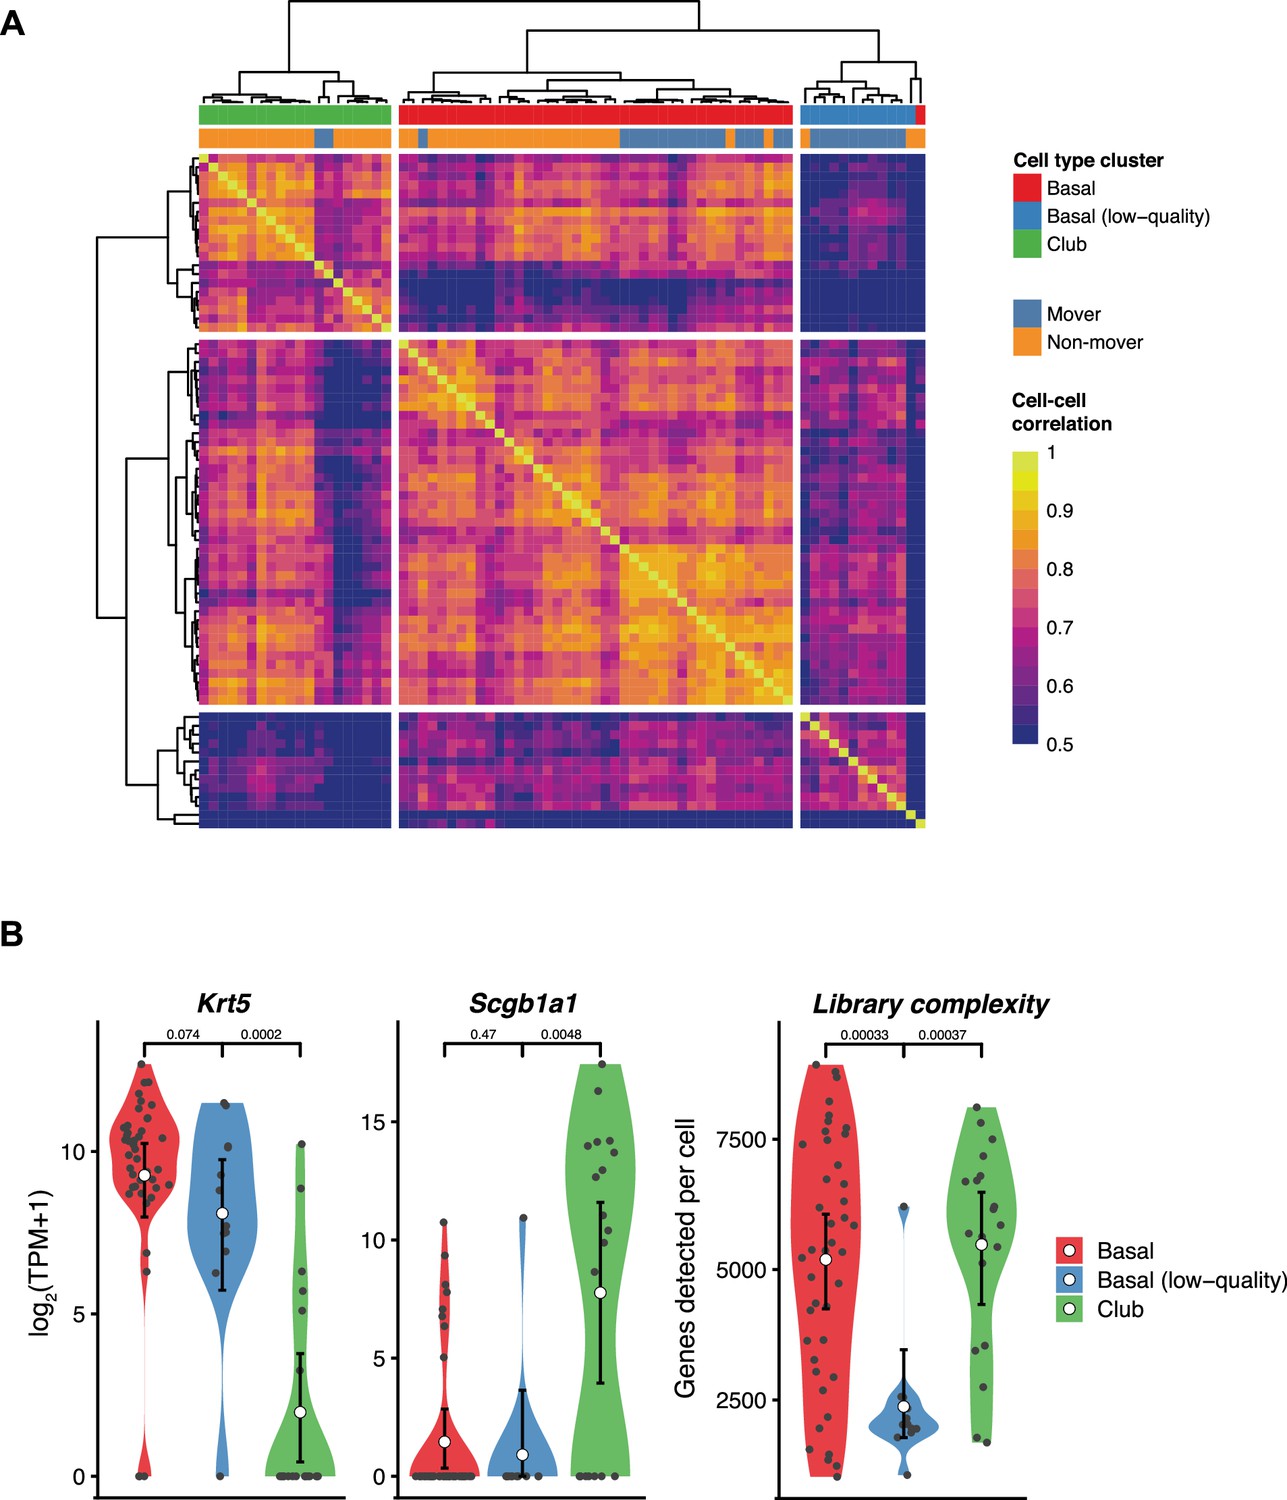
Unsupervised clustering of single-cell RNA-sequencing (scRNA-seq) data identifies club and basal cells.
(A). Heatmap shows cell-cell correlation, Pearson’s R (color bar) between all 74cells in the dataset. Dendrogram (top) shows the assignment of cells to clusters (color legend). (B). Violin plots show the expression of basal cell marker Krt5 (left), club cell marker Scgb1a1 (center), and the number of genes detected per cell (right), which were used to interpret the clusters. The center cicle indicates the mean and the error bar indicates the 95% confidence interval.
Figure 3—figure supplement 2
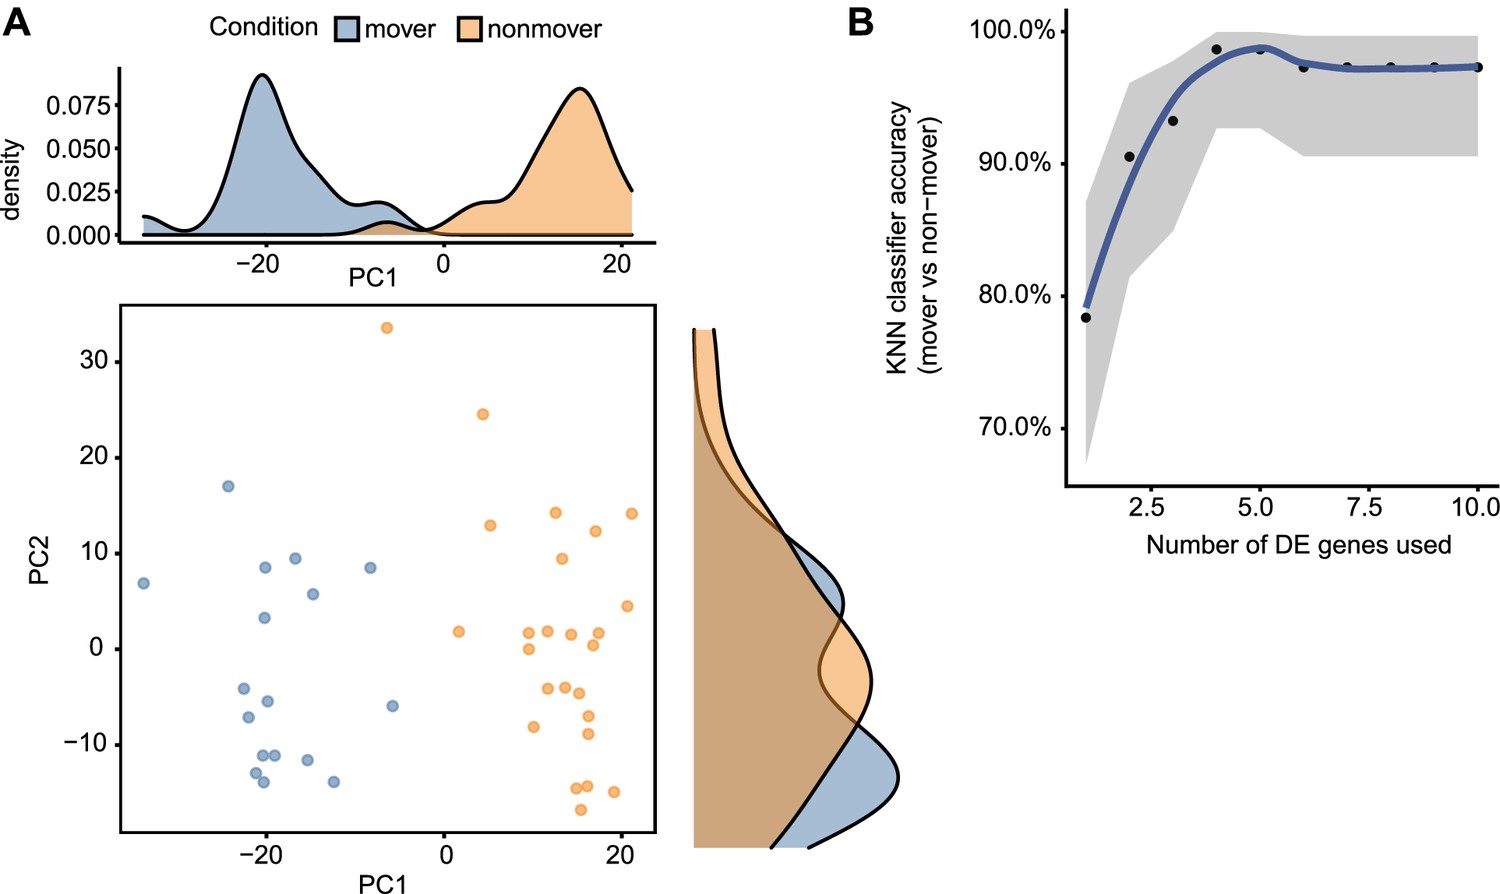
Transcriptional programs distinguish moving (M) and non-moving (NM) basal cells.
(A) Principal components analysis (PCA) scatter plot of 42 basal cells (points), showing that the distribution (top and side density histograms) of M and NM basal cells (color legend) is strongly associated with the first principal component. (B) Accuracy (y-axis) of a machine learning (k- nearest neighbor) classifier in distinguishing M from NM basal cells using the top n most differentially expressed genes (x-axis). The high accuracy indicates that M and NM clusters are well separated in transcriptional space.
Figure 4
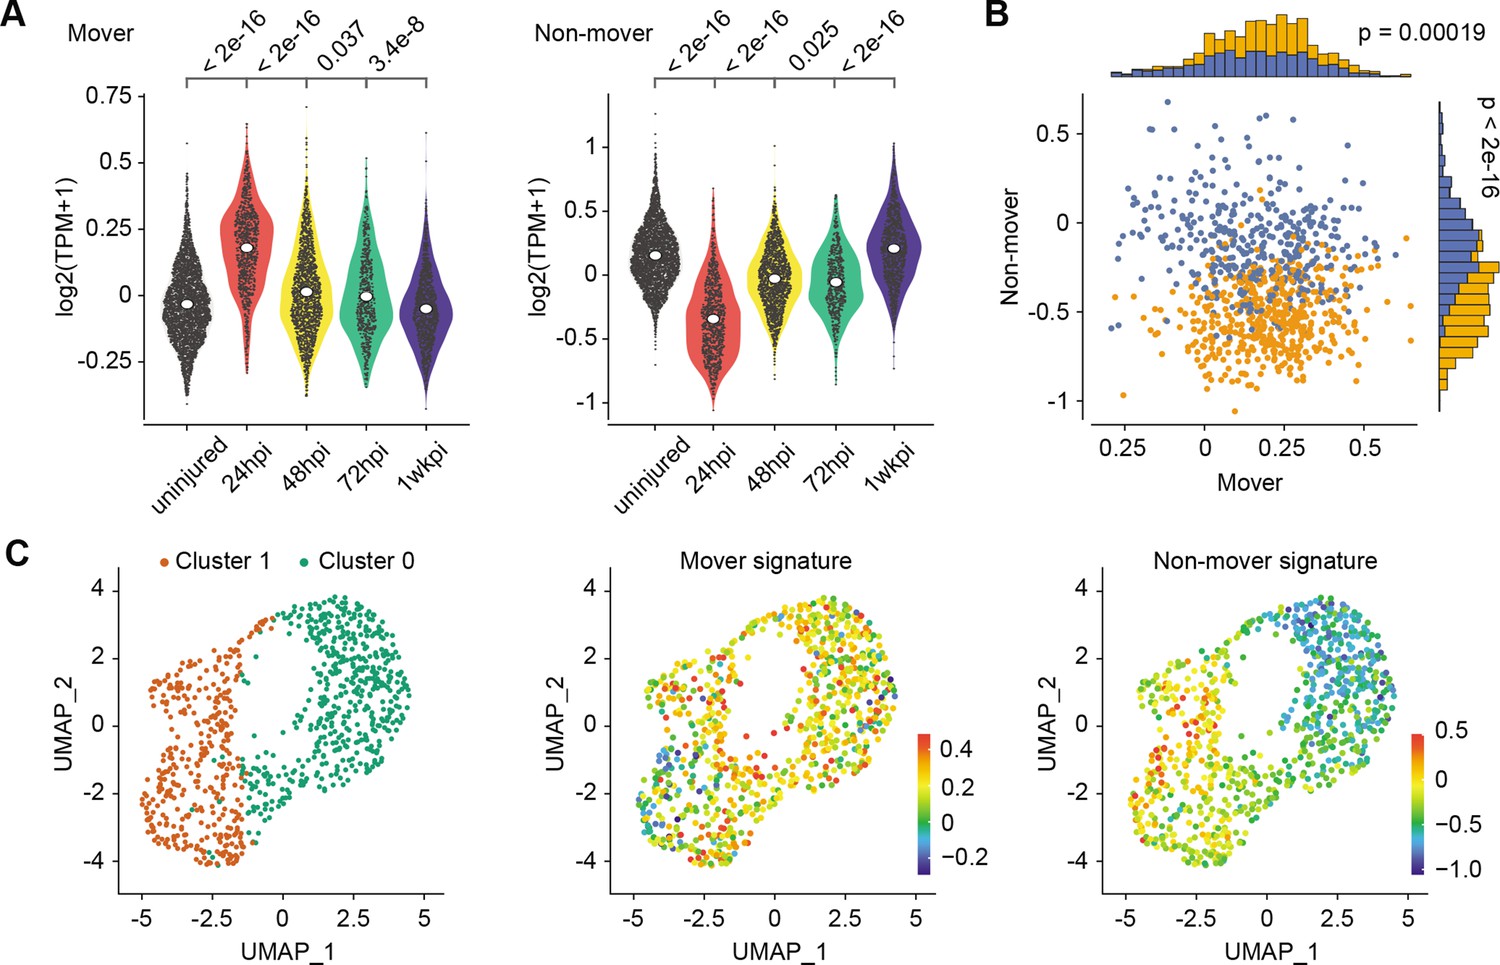
Transcriptionally distinct moving (M) and non-moving (NM) cells coordinate early airway epithelial regeneration across multiple injury types.
(A) Mover and non-mover transcriptional signatures are also enriched in early airway epithelial regeneration 24hours post-injury of an independent murine airway injury induced by polidocanol administration. (B) Scoring for mover and non-mover transcriptional signatures in 24hpi regenerating cells following polidocanol treatment partitions cells into two populations. (C) Unsupervised clustering of 24hpi regenerating cells yields two cell populations enriched in the expression of mover (cluster 0) or non-mover (cluster 1) signatures. P values from Mann-Whitney U test.
Videos
Video 1
Timelapse two-photon imaging at 20 min intervals of a regenerating airway epithelium starting at 24 hr after sulfur dioxide injury of a KRT5-H2B-mCherry transgenic mouse.
The video was composed by stitching maximum intensity projections of the H2B-mCherry signal from three adjacent areas.
Video 2
Timelapse two-photon imaging at 40 min intervals of an uninjured airway epithelium of a ROSA-nuclear-tdTomato (nT-nG) transgenic mouse.
The video is composed of maximum-intensity projections of the nuclear tdTomato signal from optical sectioning through the airway epithelium.
Video 3
Timelapse two-photon imaging at 10 min intervals of a regenerating airway epithelium starting at 24 hr after sulfur dioxide injury of a Membrane-GFP/CAGs-H2B-mCherry transgenic mouse.
The video was composed of single optical sections through the epithelium at 5 μm above the basement membrane (left) and through the mesenchyme at 5 μm below the basement membrane (right).
Additional files
Download links
A two-part list of links to download the article, or parts of the article, in various formats.
Downloads (link to download the article as PDF)
Open citations (links to open the citations from this article in various online reference manager services)
Cite this article (links to download the citations from this article in formats compatible with various reference manager tools)
Single-cell transcriptomics of a dynamic cell behavior in murine airways
eLife 12:e76645.
https://doi.org/10.7554/eLife.76645


