A dysmorphic mouse model reveals developmental interactions of chondrocranium and dermatocranium
- Department of Anthropology, The Pennsylvania State University, United States
- Department of Computer Science and Engineering, University of Notre Dame, United States
Figures
Figure 1 with 7 supplements
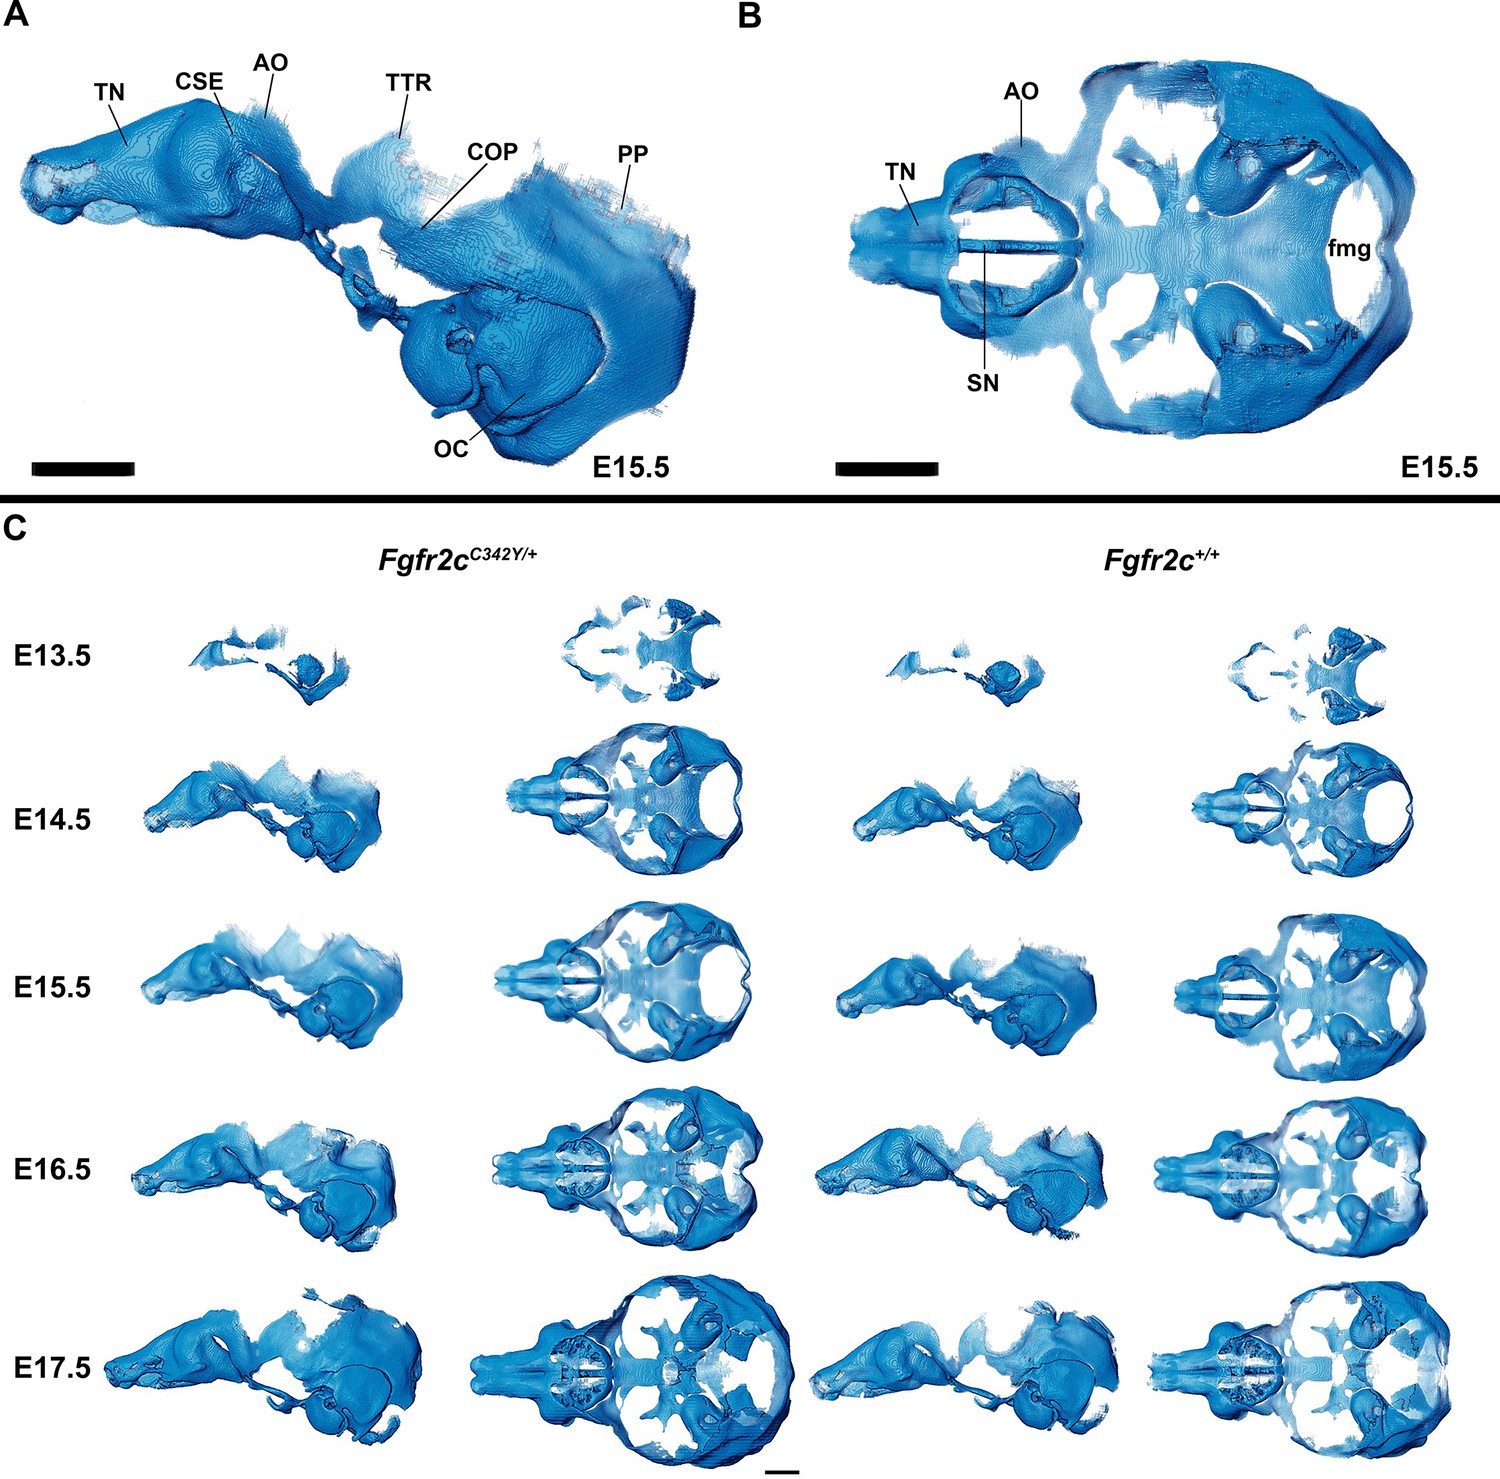
Anatomy of embryonic mouse chondrocranium.
(A, B) At embryonic day 15.5 (E15.5), the Fgfr2c+/+ mouse chondrocranium, (A) lateral, and (B) superior views is complete, consisting of the olfactory region, braincase floor, and lateral walls of the preoccipital and occipital regions. Specific areas of interest include the ala orbitalis (AO), sphenethmoid commissure (CSE), otic capsule (OC), parietal plate (PP), septum nasi (SN), tectum nasi (TN), orbitoparietal commissure (COP), and tectum transversum (TTR) cartilages and the foramen magnum (fmg). (C) 3D reconstructions of Fgfr2c+/+ and Fgfr2cC342Y/+ chondrocrania from E13.5 to E17.5 in lateral and superior views with nasal capsule to the left. Scale bars = 1 mm. A cartoon of the mouse chondrocranium with more extensive anatomical labeling of cartilages and discussion of their development can be found in Kawasaki and Richtsmeier, 2017a and Kawasaki and Richtsmeier, 2017b. Interactive viewer of 3D reconstructions can be found at: https://doi.org/10.25550/J-RHCA.
Figure 1—figure supplement 1

Comparison of Fgfr2cC342Y/+, (A) lateral and (B) superior views, and Fgfr2c+/+ (C) lateral and (D) superior view of mouse embryonic chondrocrania at embryonic day 13.5 (E13.5).
Specific areas of interest include the ala orbitalis (AO), sphenethmoid commissure (CSE), otic capsule (OC), parietal plate (PP), septum nasi (SN), tectum nasi (TN), orbitoparietal commissure (COP), and tectum transversum (TTR) cartilages. Note that the CSE and AO are present in the Fgfr2cC342Y/+ mouse but have not yet developed in the Fgfr2c+/+ mouse at E13.5. Scale bar = 1 mm.
Figure 1—figure supplement 2

Comparison of Fgfr2cC342Y/+, (A) lateral and (B) superior views, and Fgfr2c+/+ (C) lateral and (D) superior view of mouse embryonic chondrocrania at embryonic day 14.5 (E14.5).
Specific areas of interest include the ala orbitalis (AO), sphenethmoid commissure (CSE), otic capsule (OC), parietal plate (PP), septum nasi (SN), tectum nasi (TN), orbitoparietal commissure (COP), and tectum transversum (TTR) cartilages. The AO, TTR, and COP appear more developed in the Fgfr2cC342Y/+ mouse relative to the Fgfr2c+/+ mouse with a thick band of cartilage joining AO with TTR. Scale bar = 1 mm.
Figure 1—figure supplement 3

Comparison of Fgfr2cC342Y/+, (A) lateral and (B) superior views, and Fgfr2c+/+ (C) lateral and (D) superior view of mouse embryonic chondrocrania at embryonic day 15.5 (E15.5).
Specific areas of interest include the ala orbitalis (AO), sphenethmoid commissure (CSE), otic capsule (OC), parietal plate (PP), septum nasi (SN), tectum nasi (TN), orbitoparietal commissure (COP), and tectum transversum (TTR) cartilages. Note the more robust AO, TTR, and COP in the Fgfr2cC342Y/+ mouse relative to the Fgfr2c+/+ mouse with a thick band of cartilage joining AO with TTR. Scale bar = 1 mm.
Figure 1—figure supplement 4
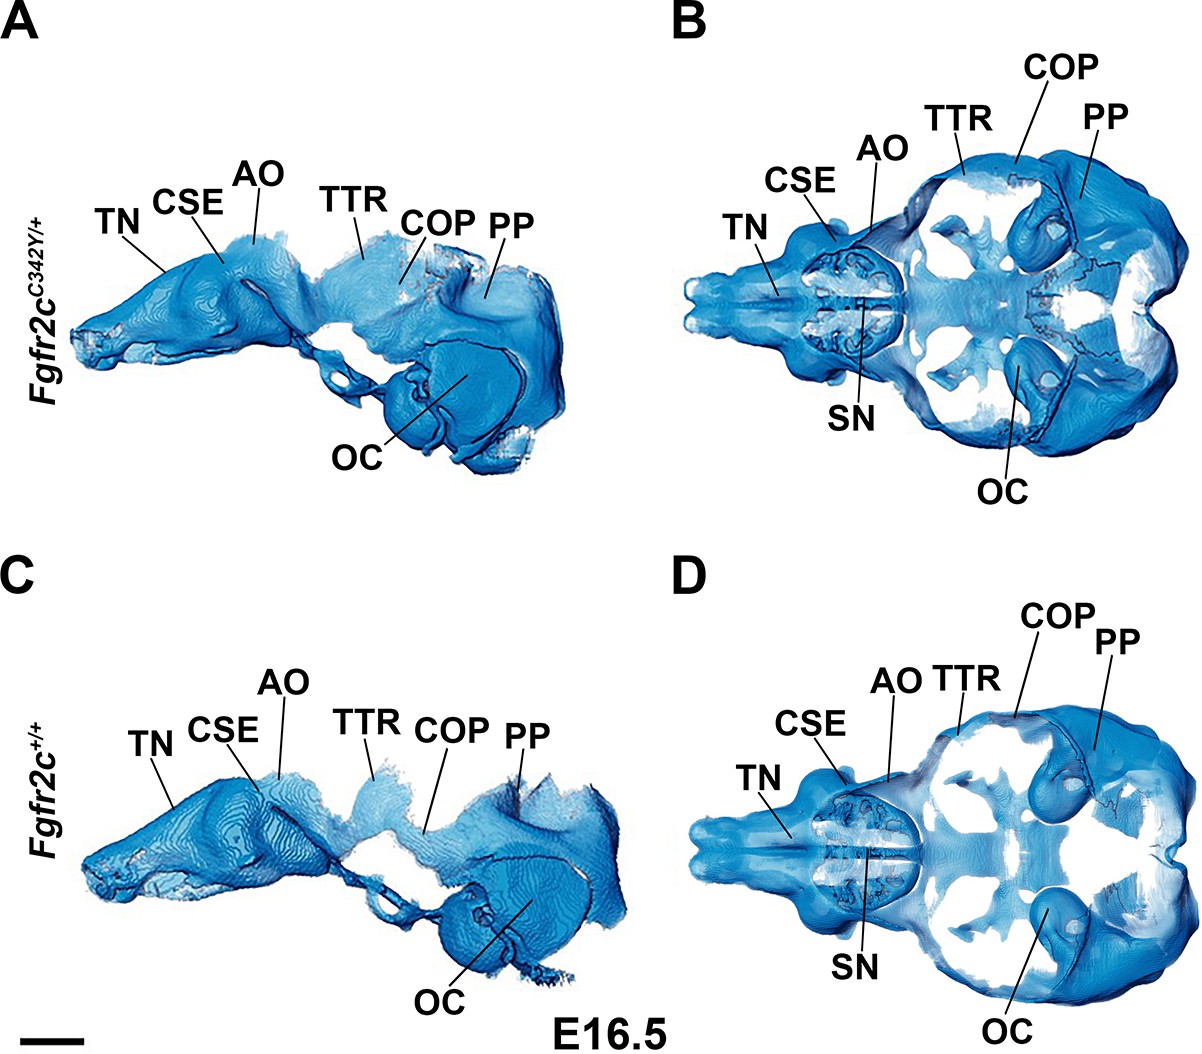
Comparison of Fgfr2cC342Y/+, (A) lateral and (B) superior views, and Fgfr2c+/+ (C) lateral and (D) superior view of mouse embryonic chondrocrania at embryonic day 16.5 (E16.5).
Specific areas of interest include the ala orbitalis (AO), sphenethmoid commissure (CSE), otic capsule (OC), parietal plate (PP), septum nasi (SN), tectum nasi (TN), orbitoparietal commissure (COP), and tectum transversum (TTR) cartilages. The chondrocranium of the Fgfr2cC342Y/+ mouse is more robust with an especially expanded AO, TTR, and COP in the Fgfr2cC342Y/+ mouse relative to the Fgfr2c+/+ mouse. Scale bar = 1 mm.
Figure 1—figure supplement 5

Comparison of Fgfr2cC342Y/+, (A) lateral and (B) superior views, and Fgfr2c+/+ (C) lateral and (D) superior view of mouse embryonic chondrocrania at embryonic day 17.5 (E17.5).
The Fgfr2cC342Y/+ chondrocranium is relatively larger by the naked eye by this age. Specific areas of interest include the ala orbitalis (AO), sphenethmoid commissure (CSE), otic capsule (OC), parietal plate (PP), septum nasi (SN), tectum nasi (TN), orbitoparietal commissure (COP), and tectum transversum (TTR) cartilages. By this time, some cartilages of the lateral wall are disappearing but AO, TTR, and COP remain relatively robust in the Fgfr2cC342Y/+ mouse relative to the Fgfr2c+/+ mouse. Scale bar = 1 mm.
Figure 1—video 1
Three-dimensional reconstruction of the isosurface of an embryonic day 15.5 (E15.5) Fgfr2c+/+ mouse chondrocranium.
Scale bar = 1.5 mm.
Figure 1—video 2
Three-dimensional reconstruction of the superimposed isosurfaces of an embryonic day 15.5 (E15.5) Fgfr2c+/+ mouse chondrocranium and skull.
Scale bar = 1.5 mm.
Figure 2 with 5 supplements
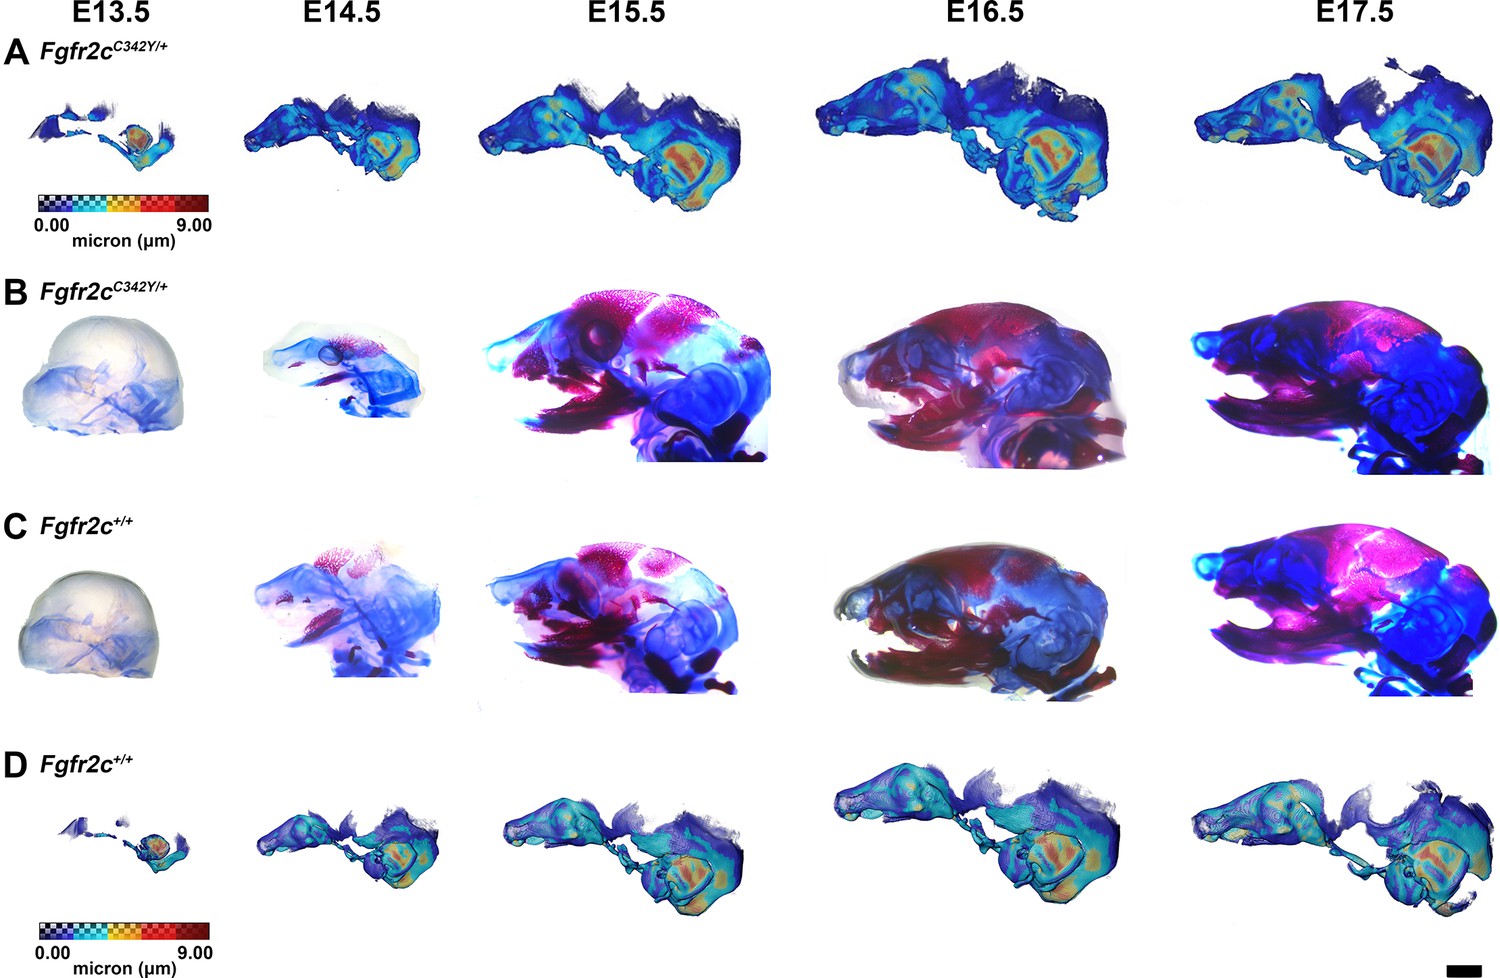
Thickness maps of the chondrocranium of mice segmented from PTA-enhanced micro-computed tomography (microCT) images and similarly aged, cleared, and stained specimens, embryonic day 13.5–17.5 (E13.5–E17.5).
(A, D) Thickness maps of Fgfr2cC342Y/+ (A) and Fgfr2c+/+ (D) mice segmented from PTA-enhanced microCT images. Colormap indicates cartilage thickness that ranged from just over 0 µm (dark blue) to nearly 9 µm (dark red). (B, C) Fgfr2cC342Y/+ (B) and Fgfr2c+/+ (C) specimens that were chemically cleared are stained with Alcian blue indicating proteoglycans in cartilage and alizarin red indicating calcium deposits. Scale bar = 1 mm.
Figure 2—figure supplement 1

Left lateral view of thickness maps of the chodrocrania of mice segmented from phosphotungstic acid (PTA)-enhanced micro-computed tomography (microCT) images of Fgfr2cC342Y/+ (A) and Fgfr2c+/+ (B) mice and cleared and stained Fgfr2cC342Y/+ (C) and Fgfr2c+/+ (D) mice at embryonic day 13.5 (E13.5).
Colormap indicates cartilage thickness that ranged from just over 0 µm (dark blue) to nearly 9 µm (dark red). Colormaps of Fgfr2cC342Y/+ (A) and Fgfr2c+/+ (B) chondrocrania in lateral view, segmented from PTA-enhanced microCT images indicate cartilage thicknesses that ranged from just over 0 µm (dark blue) to nearly 9 µm (dark red). The Fgfr2cC342Y/+ (C) and Fgfr2c+/+ (D) specimens that were chemically cleared and stained with Alcian blue indicating proteoglycans in cartilage and alizarin red indicating calcium containing osteocytes. Cartilaginous structures of interest include the ala orbitalis (AO), sphenethmoid commissure (CSE), otic capsule (OC), parietal plate (PP), septum nasi (SN), tectum nasi (TN), orbitoparietal commissure (COP), and tectum transversum (TTR). Note that the CSE and AO are present in the Fgfr2cC342Y/+ embryo but have not yet developed in the Fgfr2c+/+ embryo at E13.5. No osteocyte containing bone is shown in either genotype at this age. Scale bar = 1 mm.
Figure 2—figure supplement 2

Left lateral view of thickness maps of the chodrocrania of mice segmented from phosphotungstic acid (PTA)-enhanced micro-computed tomography (microCT) images of Fgfr2cC342Y/+ (A) and Fgfr2c+/+ (B) mice and cleared and stained Fgfr2cC342Y/+ (C) and Fgfr2c+/+ (D) mice at embryonic day 14.5 (E14.5).
Colormap indicates cartilage thickness that ranged from just over 0 µm (dark blue) to nearly 9 µm (dark red). Colormaps of Fgfr2cC342Y/+ (A) and Fgfr2c+/+ (B) chondrocrania in lateral view, segmented from PTA-enhanced microCT images indicate cartilage thicknesses that ranged from just over 0 µm (dark blue) to nearly 9 µm (dark red). Comparable areas of cartilage development identified in Fgfr2cC342Y/+ (C) and Fgfr2c+/+ (D) specimens that were chemically cleared and stained with Alcian blue indicating proteoglycans in cartilage. Developing bone is shown using alizarin red staining indicating calcium containing osteocytes. Specific cartilages of interest include the ala orbitalis (AO), sphenethmoid commissure (CSE), otic capsule (OC), parietal plate (PP), septum nasi (SN), tectum nasi (TN), orbitoparietal commissure (COP), and tectum transversum (TTR) cartilages. Note the more developed AO, TTR, and COP in the Fgfr2cC342Y/+ mouse relative to the Fgfr2c+/+ mouse. The frontal (FR) and parietal (PR) bones are separated by a presumptive coronal suture (CS) in the Fgfr2c+/+ specimen (D), but there is no comparable separation of the frontal and parietal bones in the Fgfr2cC342Y/+ mouse (C) suggesting a lack of suture formation. Scale bar = 1 mm.
Figure 2—figure supplement 3

Left lateral view of thickness maps of the chodrocrania of mice segmented from phosphotungstic acid (PTA)-enhanced micro-computed tomography (microCT) images of Fgfr2cC342Y/+ (A) and Fgfr2c+/+ (B) mice and cleared and stained Fgfr2cC342Y/+ (C) and Fgfr2c+/+ (D) mice at embryonic day 15.5 (E15.5).
Colormap indicates cartilage thickness that ranged from just over 0 µm (dark blue) to nearly 9 µm (dark red). Colormaps of Fgfr2cC342Y/+ (A) and Fgfr2c+/+ (B) chondrocrania in lateral view, segmented from PTA-enhanced microCT images indicate cartilage thicknesses that ranged from just over 0 µm (dark blue) to nearly 9 µm (dark red). Thickness maps show larger, thicker AO, TTR, and COP in the Fgfr2cC342Y/+ mouse relative to the Fgfr2c+/+ mouse. The Fgfr2cC342Y/+ (C) and Fgfr2c+/+ (D) specimens that were chemically cleared and stained with Alcian blue indicating proteoglycans in cartilage and alizarin red indicating calcium containing osteocytes indicate a large degree of dermal bone formation between E14.5 and E15.5. Most of the anterior cartilages (ala orbitalis [AO], sphenethmoid commissure [CSE], septum nasi [SN], tectum nasi [TN], orbitoparietal commissure [COP], and tectum transversum [TTR] cartilages) are covered by dermal bone. The otic capsule (OC) and parietal plate (PP) remain visible In these specimens, the frontal (FR) and parietal (PR) bones are separated by the coronal suture (CS) in both genotypes (C, D). Scale bar = 1 mm.
Figure 2—figure supplement 4

Left lateral view of thickness maps of the chodrocrania of mice segmented from phosphotungstic acid (PTA)-enhanced micro-computed tomography (microCT) images of Fgfr2cC342Y/+ (A) and Fgfr2c+/+ (B) mice and cleared and stained Fgfr2cC342Y/+ (C) and Fgfr2c+/+ (D) mice at embryonic day 16.5 (E16.5).
Colormap indicates cartilage thickness that ranged from just over 0 µm (dark blue) to nearly 9 µm (dark red). Colormaps of Fgfr2cC342Y/+ (A) and Fgfr2c+/+ (B) chondrocrania in lateral view, segmented from PTA-enhanced microCT images indicate cartilage thicknesses that ranged from just over 0 µm (dark blue) to nearly 9 µm (dark red). The entire chondrocranium of Fgfr2cC342Y/+ embryos is relatively robust with the tectum nasi (TN), ala orbitalis (AO), and tectum transversum (TTR) showing obvious thickness differences between genotypes. Fgfr2cC342Y/+ (C) and Fgfr2c+/+ (D) specimens that were chemically cleared and stained with Alcian blue indicating proteoglycans in cartilage and alizarin red indicating calcium containing osteocytes. The frontal (FR) and parietal (PR) bones are separated by the coronal suture (CS) in the Fgfr2c+/+ specimen (D), but the suture is obliterated in the Fgfr2cC342Y/+ mouse (C). The interparietal bone has formed in both geneotypes. Scale bar = 1 mm.
Figure 2—figure supplement 5

Left lateral view of thickness maps of the chodrocrania of mice segmented from phosphotungstic acid (PTA)-enhanced micro-computed tomography (microCT) images of Fgfr2cC342Y/+ (A) and Fgfr2c+/+ (B) mice and cleared and stained Fgfr2cC342Y/+ (C) and Fgfr2c+/+ (D) mice at embryonic day 17.5 (E17.5).
Colormap indicates cartilage thickness that ranged from just over 0 µm (dark blue) to nearly 9 µm (dark red). Colormaps of Fgfr2cC342Y/+ (A) and Fgfr2c+/+ (B) chondrocrania in lateral view, segmented from PTA-enhanced microCT images indicate cartilage thicknesses that ranged from just over 0 µm (dark blue) to nearly 9 µm (dark red). Though the chondrocranium is beginning to dissolve in both genotypes, this process appears to be more advanced in Fgfr2cC342Y/+ embryos, with the ala orbitalis (AO) and tectum transversum (TTR) becoming noticeably thin. Fgfr2cC342Y/+ (C) and Fgfr2c+/+ (D) specimens that were chemically cleared and stained with Alcian blue indicating proteoglycans in cartilage and alizarin red indicating calcium containing osteocytes. At this age, it is difficult to distinguish separate cartilages and bones in cleared and stained specimens. However, frontal (FR) and parietal (PR) bones are separated by the coronal suture (CS) in the Fgfr2c+/+ specimen (D), and there is no suture in the Fgfr2cC342Y/+ embryo (C). Scale bar = 1 mm.
Figure 3 with 2 supplements
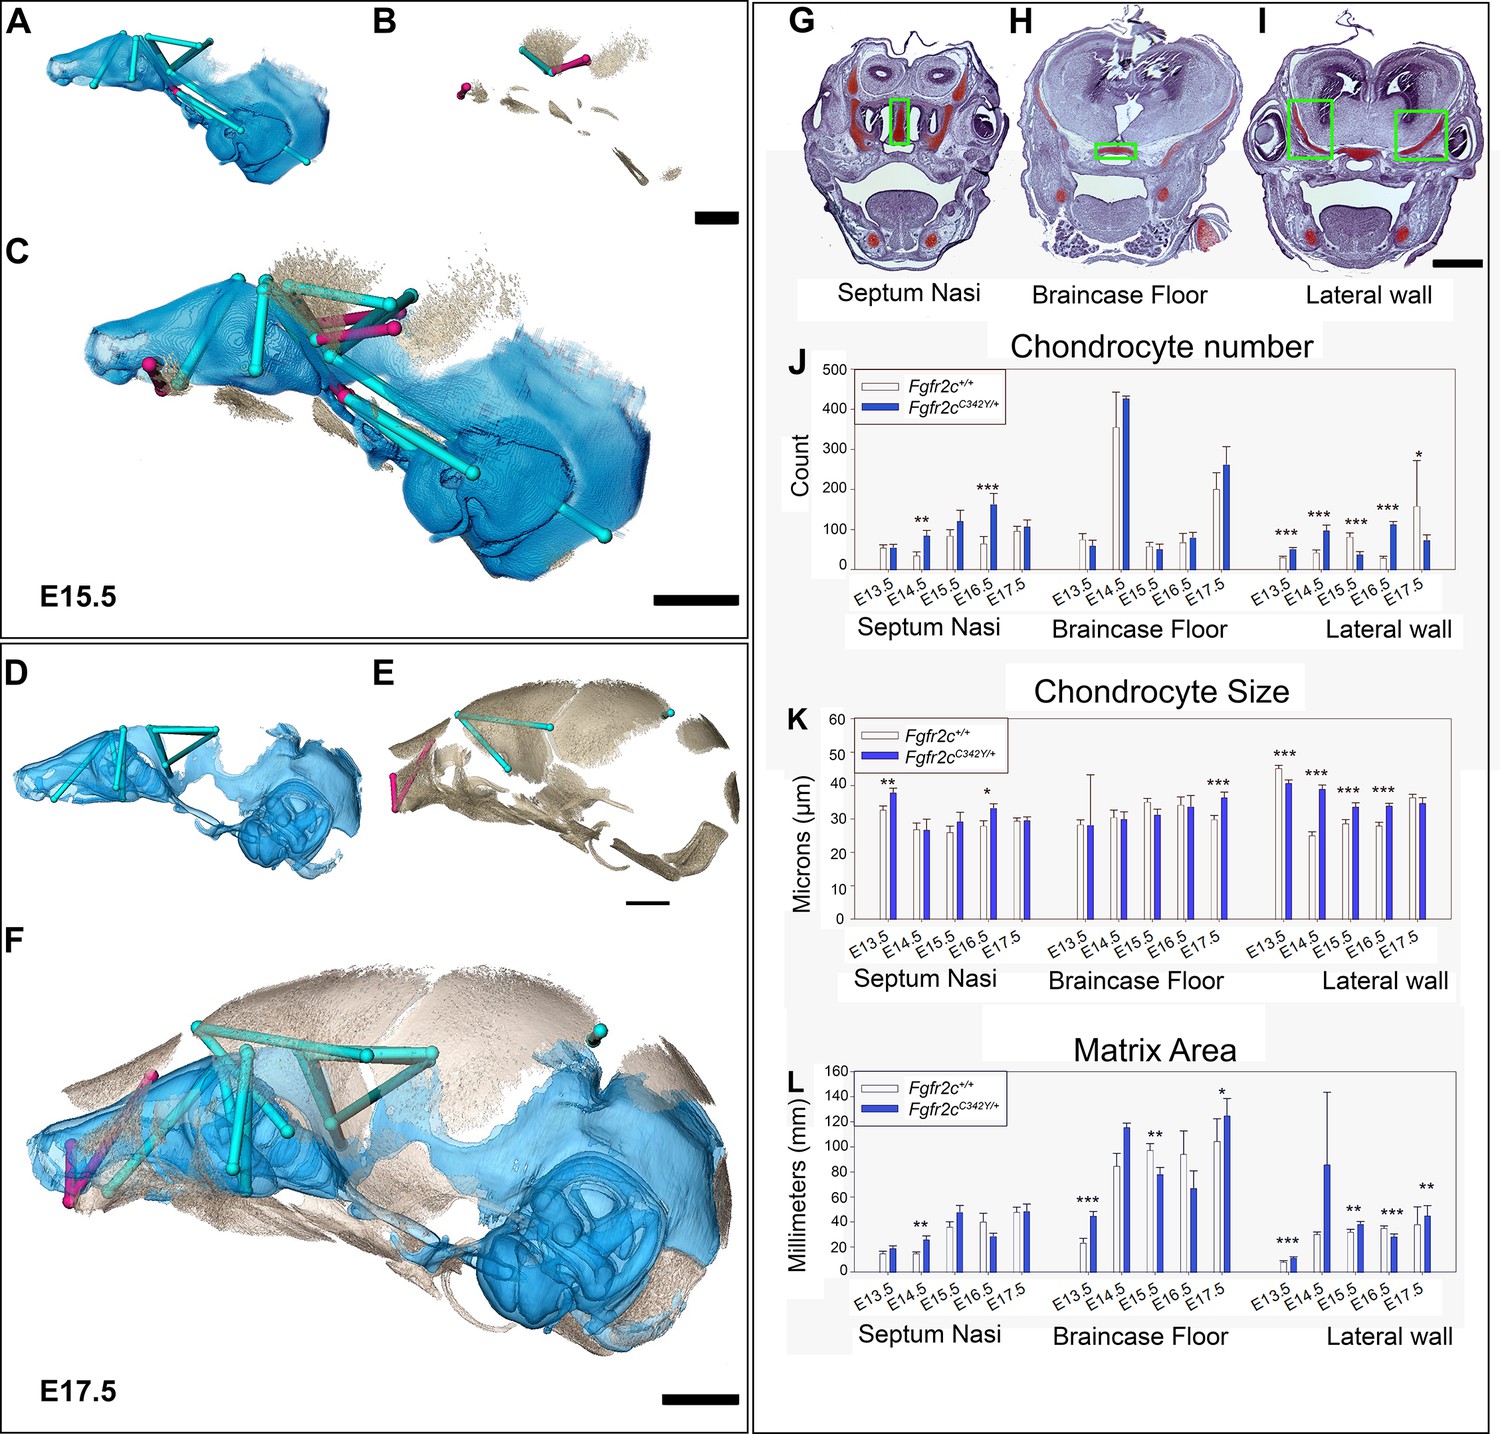
Euclidean distance matrix analysisDistance Matrix Analysis of the chondrocranium and bony skull, and histomorphology of the chondrocranium.
Linear distances of the chondrocranium (A, D), bony skull (B, E), and the two superimposed (C, F) that are statistically significantly different between genotypes by confidence interval testing (α=0.10). Blue lines indicate linear distances that are significantly larger in Fgfr2cC342Y/+ mice; fuchsia lines are significantly reduced in Fgfr2cC342Y/+ mice. (A–F) Significant differences between chondrocranium and bony skulls of Fgfr2cC342Y/+ and Fgfr2c+/+mice. A limited landmark set common to the chondrocranium and bony skull of embryonic day 15.5 (E15.5) (A–C) and E17.5 (D–F) embryos was used for analyses and indicated that the lateral wall and olfactory regions are most different between Fgfr2cC342Y/+ and Fgfr2c+/+ mice at these ages. (G–L) Histomorphology of the chondrocranium. Histological sections of the E15.5 chondrocranium highlighting the septum nasi (G), braincase floor (H), and lateral walls (I) in green boxes. These areas were assessed at E13.5, E14.5, E15.5, E16.5, and E17.5 for chondrocyte number (J), chondrocyte size (K), and area of cartilaginous matrix (L) in Fgfr2cC342Y/+ and Fgfr2c+/+ mice. In agreement with the larger chondrocrania of Fgfr2cC342Y/+ mice, there are localized regions that reveal increases in chondrocyte number, size, and/or contribution of matrix at each timepoint. Note the trend of increasing numbers of chondrocytes over time as expected in a growing chondrocranium. For histological analysis data are displayed as mean +/- standard error of at least three quantified images per individual (n) per region per age compared between genotypes using non-parametric Mann-Whitney U tests; *p≤0.05, **p≤0.01, ***p≤0.001. n (Fgfr2c+/+/Fgfr2cC342Y/+) = 4/4(E13.5), 7/7 (E14.5), 6/6 (E15.5), 6/5 (E16.5), 4/5 (E17.5). Scalebars = 1mm.
Figure 3—video 1
Three-dimensional reconstruction of the superimposed isosurfaces of an embryonic day 15.5 (E15.5) Fgfr2c+/+ mouse chondrocranium and skull with blue lines depicting linear distances that are significantly larger in Fgfr2cC342Y/+ mice as compared to Fgfr2c+/+ mice; fuchsia lines are significantly reduced in Fgfr2cC342Y/+ mice as compared to Fgfr2c+/+ mice.
Scalebar = 1 mm.
Figure 3—video 2
Three-dimensional reconstruction of the superimposed isosurfaces of an embryonic day 17.5 (E17.5) Fgfr2c+/+ mouse chondrocranium and skull with blue lines depicting linear distances that are significantly larger in Fgfr2cC342Y/+ mice as compared to Fgfr2c+/+ mice; fuchsia lines are significantly reduced in Fgfr2cC342Y/+ mice as compared to Fgfr2c+/+ mice.
Scalebar = 1 mm.
Figure 4
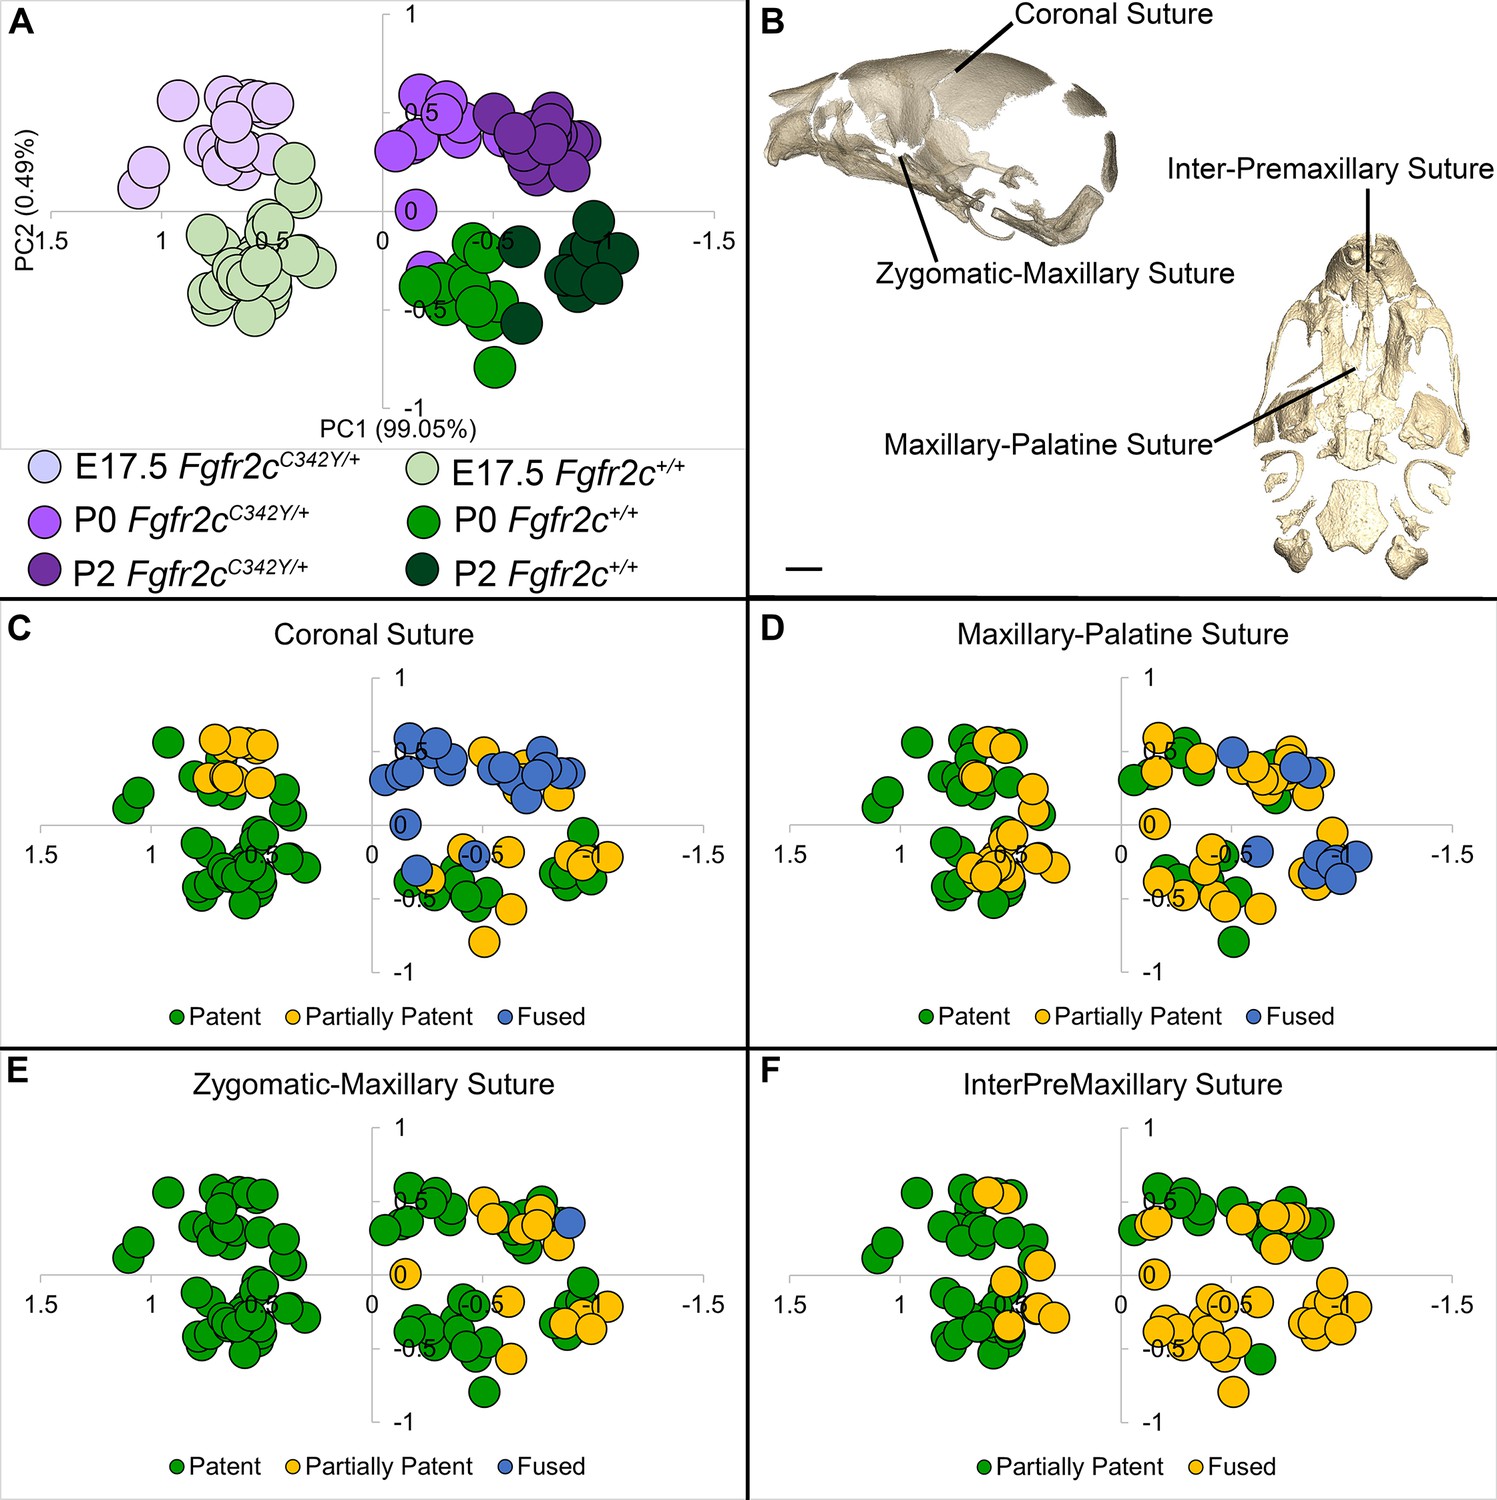
Relationship of suture patency patterns and craniofacial shape as estimated by principal components analysis (PCA).
(A) PCA of skull linear distance data estimated from 3D landmark locations collected from micro-computed tomography (microCT) images of mice at E17.5, postnatal day 0 (P0), and P2 shows distribution of all individuals along principal component 1 (PC1) and PC2. (B) Suture patency was scored for sutures as visualized on left lateral and inferior views of a microCT 3D reconstruction of a Fgfr2c+/+ P0 skull. (C–F) Distribution of individuals along PC1 and PC2 as shown in (A) coded for patency of the coronal suture (C), the maxillary-palatine suture (D), the zygomatic-maxillary suture (E), and the inter-premaxillary suture (F). Scale bar = 1 mm.
Figure 5
Euclidean distance matrix analysis of the bony skull during late prenatal and early postnatal stages.
Increased mineralization allowed a larger set of landmarks to be used for statistical comparison of skull shape between genotypes at embryonic day 17.5 (E17.5), postnatal day 0 (P0), and P2 (as compared to Figure 3). Superior (A–C) and lateral (D–F) views of linear distances of the bony skull that are statistically significantly different between genotypes by confidence interval testing (α=0.10) shown on the dermatocranium of a Fgfr2c+/+ mouse at E17.5 (A, D), P0 (B, E), and P2 (C, F). Blue lines indicate linear distances that are significantly larger in Fgfr2cC342Y/+ mice; fuchsia lines indicate linear distances that are significantly reduced in Fgfr2cC342Y/+ mice. Quantitative patterns reveal a reversal in relative size postnatally, with the Fgfr2cC342Y/+ skull becoming generally smaller than skulls of Fgfr2c+/+ littermates. Scalebar = 1 mm.
Figure 6 with 2 supplements
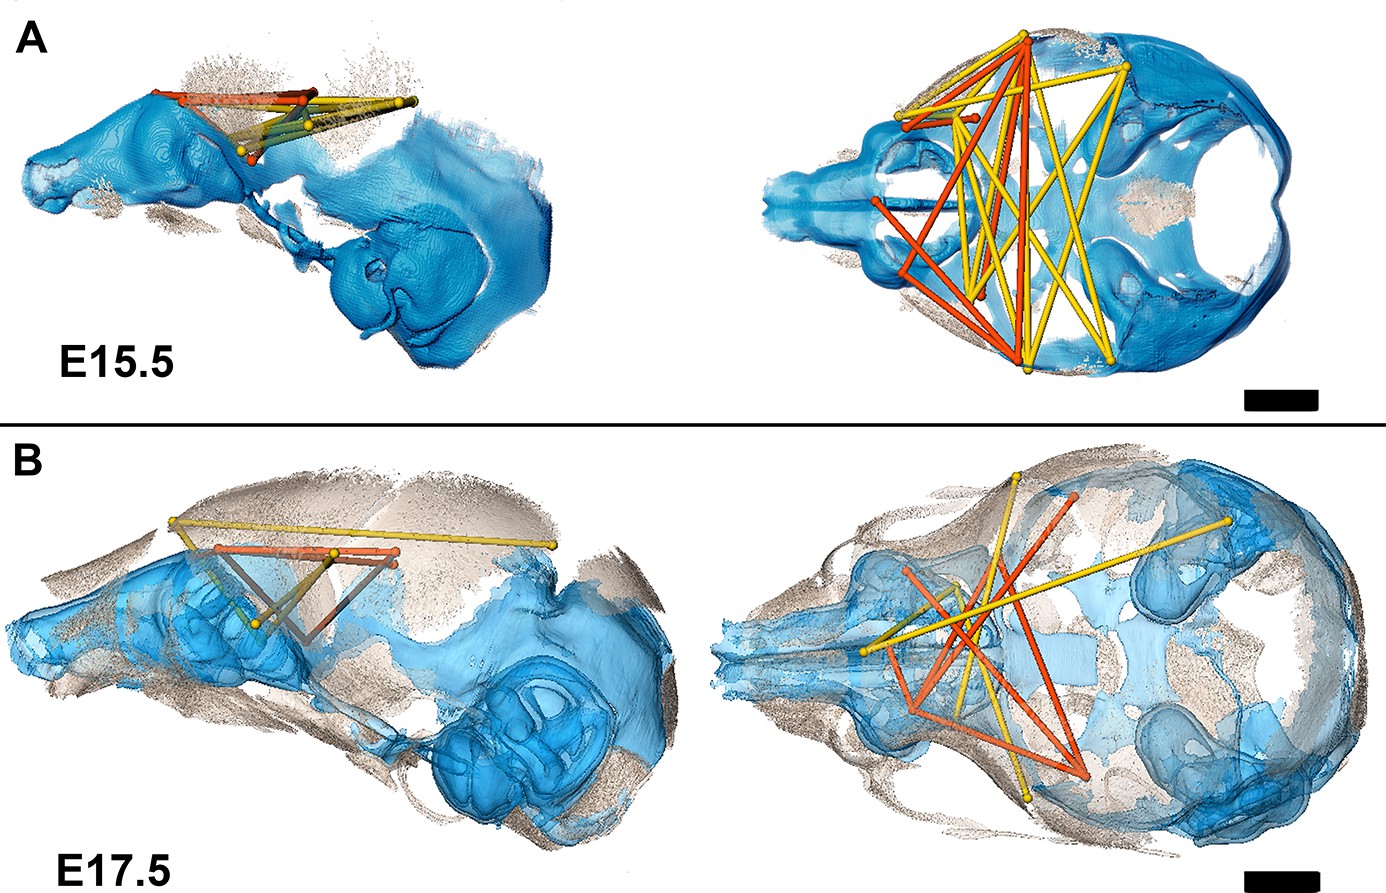
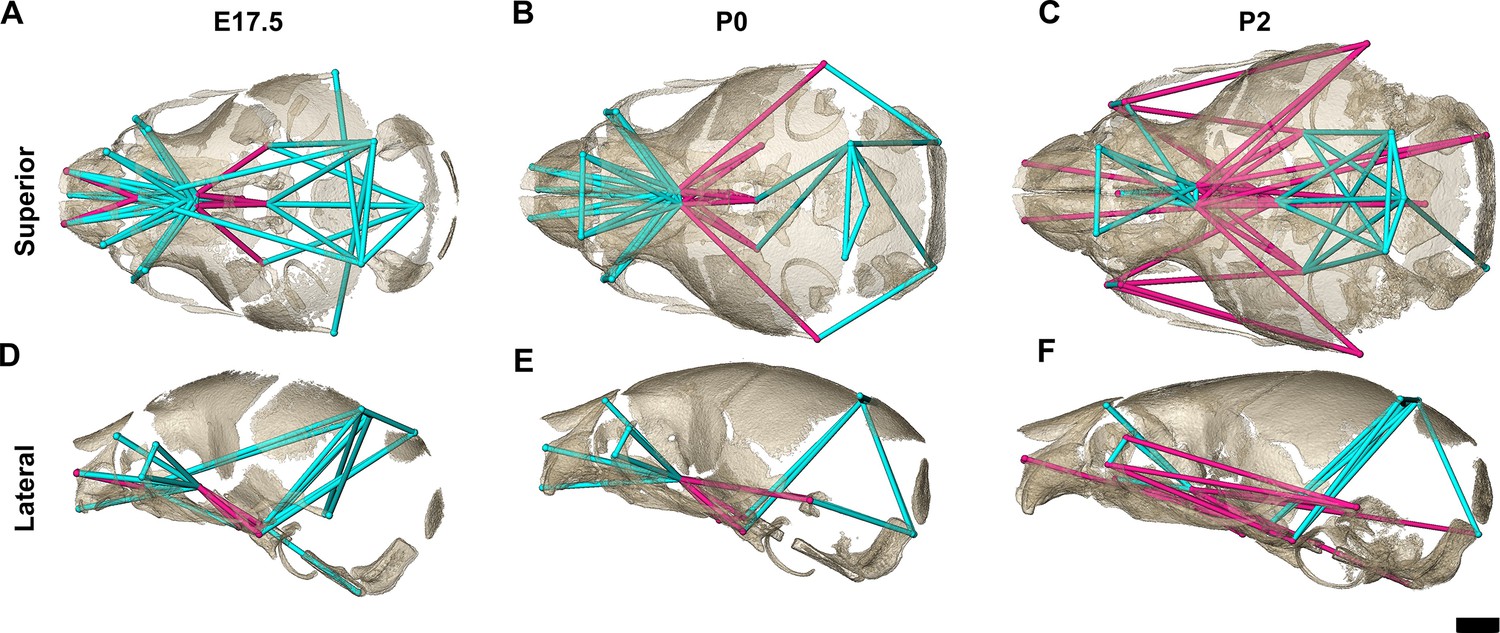
Summary of statistically significant differences in morphological integration of dermatocranium and chondrocranium between genotypes with two videos.
(A) Linear distance pairs from the dermatocranium (yellow) and chondrocranium (orange) whose association is statistically stronger (α=0.10) in Fgfr2cC342Y/+ mice relative to Fgfr2c+/+ mice at embryonic day 15.5 (E15.5) and (B) at E17.5. Left lateral (at left) and superior (at right) views shown. Scalebars = 1 mm.
Figure 6—video 1
Three-dimensional reconstruction of the superimposed isosurfaces of an embryonic day 15.5 (E15.5) Fgfr2c+/+ mouse chondrocranium and skull with linear distance pairs from the dermatocranium (yellow) and chondrocranium (orange) whose association is statistically stronger (α=0.10) in Fgfr2cC342Y/+ mice relative to Fgfr2c+/+ mice.
Scalebar = 1 mm.
Figure 6—video 2
Three-dimensional reconstruction of the superimposed isosurfaces of an embryonic day 17.5 (E17.5) Fgfr2c+/+ mouse chondrocranium and skull with linear distance pairs from the dermatocranium (yellow) and chondrocranium (orange) whose association is statistically stronger (α=0.10) in Fgfr2cC342Y/+ mice relative to Fgfr2c+/+ mice.
Scalebar = 1 mm.
Tables
Table 1
Anatomical definitions of chondrocranial landmarks used in EDMA comparisons and morphological integration analyses.
Landmark locations can be visualized on a 3D reconstruction of the embryonic mouse chondrocranium at https://getahead.la.psu.edu/landmarks/.
| Chondrocranium landmarks for specimens aged E14.5, E15.5, E16.5, and E17.5 | |||||
|---|---|---|---|---|---|
| Landmark description | Anatomical region of interest | ||||
| Landmark abbreviation | Landmark definition | Olfactory capsule landmarks used in euclidean distance matrix analysis (EDMA) | Braincase floor landmarks used in EDMA | Lateral wall and roof of preoccipital and occipital region landmarks used in EDMA | Lateral wall and roof of preoccipital region landmarks used in Morpholog-ical Integration analysis |
| asep | Most anterior point of the septum nasi | x | |||
| lao | Most superolateral point on the ala orbitalis, left side | x | |||
| laottr | Most superior point of the intersection of the ala orbitalis and tectum transversum, left side | x | x | ||
| lapnc | Most anterior point of the paraseptal cartilage, left side | ||||
| lcsp | Intersection of the sphenocochlear comissure and pars cochlearis, left side | x | |||
| llpca | Most lateral point on the pars canalicularis, left side | x | |||
| llat | Most lateral point on the left ala temporalis, left side | x | |||
| lncse | Most superior anterior point where the nasal capsule (pars intermedia) intersects with the sphenethmoid commissure, left side | x | x | ||
| lppi | Most lateral point on the prominent pars intermedia, left side | x | |||
| lppnc | Most posterior point of the paraseptal cartilage, left side | x | |||
| ltpoa | Intersection of the tectum posterious and occiptal arch on the foramen magnum, left side | x | |||
| lttr | Most superior point on tectum transversum, left side | x | x | ||
| nct | Most posterior midoint at which the left and right nasal capsule connects with the trabecular cartilage | x | x | ||
| psep | Most posterior point of the septum nasi | x | x | ||
| rao | Most superolateral point on the ala orbitalis, right side | x | |||
| raottr | Most superior point of the intersection of the ala orbitalis and tectum transversum, right side | x | x | ||
| rapnc | Most anterior point of the paraseptal cartilage, right side | x | |||
| rcsp | Intersection of the sphenocochlear comissure and pars cochlearis, right side | x | |||
| rlpca | Most lateral point on the pars canalicularis, right side | x | |||
| rlat | Most lateral point on the ala temporalis, right side | x | |||
| rncse | Most superior anterior point where the nasal capsule (pars intermedia) intersects with the sphenethmoid commissure, right side | x | x | ||
| rppi | Most lateral point on the prominent pars intermedia, right side | x | |||
| rppnc | Most posterior point of the paranasal cartilage, right side | x | |||
| rtpoa | Intersection of the tectum posterious and occiptal arch on the foramen magnum, right side | x | |||
| rttr | Most superior point on tectum transversum, right side | x | x | ||
Table 2
Bone volume summary statistics at embryonic day 17.5 (E17.5) and postnatal day 0 (P0) for Fgfr2cC342Y/+ mice and their Fgfr2c+/+ littermates.
Sample size (N) varied by availability of individual bone for analysis. Interfrontal and ethmoid bones develop relatively late and were not present in many specimens.
| Bone | E17.5 Fgfr2cC342Y/+ | E17.5 Fgfr2c+/+ | P0 Fgfr2cC342Y/+ | P0 Fgfr2c+/+ | ||||||||
|---|---|---|---|---|---|---|---|---|---|---|---|---|
| N | Mean | S.D. | N | Mean | S.D. | N | Mean | S.D. | N | Mean | S.D. | |
| Interparietal | 14 | 0.16 | 0.06 | 13 | 0.18 | 0.06 | 10 | 0.40 | 0.07 | 10 | 0.40 | 0.10 |
| Squamous occipital | 13 | 0.16 | 0.11 | 13 | 0.13 | 0.09 | 10 | 0.63 | 0.10 | 10 | 0.58 | 0.11 |
| Left lateral occipital | 14 | 0.43 | 0.06 | 13 | 0.42 | 0.05 | 10 | 0.65 | 0.06 | 10 | 0.59 | 0.07 |
| Right lateral occipital | 14 | 0.42 | 0.06 | 13 | 0.41 | 0.05 | 10 | 0.64 | 0.07 | 10 | 0.58 | 0.07 |
| Basioccipital | 14 | 0.58 | 0.08 | 13 | 0.53 | 0.06 | 10 | 0.88 | 0.09 | 10 | 0.74 | 0.10 |
| Left parietal | 14 | 0.34 | 0.08 | 13 | 0.36 | 0.09 | 10 | 0.71 | 0.09 | 10 | 0.68 | 0.14 |
| Right parietal | 13 | 0.35 | 0.09 | 13 | 0.37 | 0.08 | 10 | 0.73 | 0.09 | 10 | 0.69 | 0.15 |
| Left squamous temporal | 14 | 0.13 | 0.03 | 13 | 0.13 | 0.03 | 10 | 0.30 | 0.03 | 10 | 0.30 | 0.06 |
| Right squamous temporal | 14 | 0.12 | 0.03 | 13 | 0.12 | 0.03 | 10 | 0.32 | 0.04 | 10 | 0.30 | 0.06 |
| Left frontal | 14 | 0.74 | 0.16 | 13 | 0.66 | 0.12 | 10 | 1.30 | 0.13 | 10 | 1.14 | 0.19 |
| Right frontal | 14 | 0.74 | 0.16 | 13 | 0.65 | 0.12 | 10 | 1.28 | 0.13 | 10 | 1.13 | 0.18 |
| Interfrontal | 12 | 0.01 | 0.01 | 9 | 0.00 | 0.00 | 10 | 0.03 | 0.01 | 0 | 0 | 0 |
| Left maxilla | 14 | 0.48 | 0.10 | 13 | 0.48 | 0.08 | 10 | 0.93 | 0.14 | 10 | 0.82 | 0.15 |
| Right maxilla | 14 | 0.48 | 0.10 | 13 | 0.47 | 0.08 | 10 | 0.92 | 0.14 | 10 | 0.82 | 0.15 |
| Left jugal | 14 | 0.03 | 0.01 | 13 | 0.02 | 0.01 | 10 | 0.05 | 0.01 | 10 | 0.05 | 0.01 |
| Right jugal | 14 | 0.03 | 0.01 | 13 | 0.02 | 0.01 | 10 | 0.06 | 0.01 | 10 | 0.05 | 0.01 |
| Left nasal | 14 | 0.07 | 0.04 | 13 | 0.08 | 0.03 | 10 | 0.21 | 0.04 | 10 | 0.18 | 0.04 |
| Right nasal | 14 | 0.08 | 0.04 | 13 | 0.08 | 0.03 | 10 | 0.23 | 0.04 | 10 | 0.19 | 0.04 |
| Left premaxilla | 14 | 0.26 | 0.08 | 13 | 0.27 | 0.07 | 10 | 0.67 | 0.12 | 10 | 0.65 | 0.12 |
| Right premaxilla | 14 | 0.26 | 0.08 | 13 | 0.27 | 0.07 | 10 | 0.69 | 0.12 | 10 | 0.64 | 0.11 |
| Vomer | 14 | 0.09 | 0.02 | 13 | 0.07 | 0.01 | 10 | 0.16 | 0.04 | 10 | 0.13 | 0.03 |
| Left palatine | 14 | 0.23 | 0.05 | 13 | 0.20 | 0.03 | 10 | 0.42 | 0.07 | 10 | 0.36 | 0.06 |
| Right palatine | 14 | 0.23 | 0.05 | 13 | 0.20 | 0.04 | 10 | 0.42 | 0.06 | 10 | 0.36 | 0.05 |
| Presphenoid | 14 | 0.02 | 0.02 | 13 | 0.03 | 0.02 | 10 | 0.24 | 0.05 | 10 | 0.20 | 0.03 |
| Left sphenoid ala | 14 | 0.16 | 0.04 | 13 | 0.15 | 0.04 | 10 | 0.38 | 0.06 | 10 | 0.35 | 0.07 |
| Right sphenoid ala | 14 | 0.15 | 0.04 | 13 | 0.14 | 0.03 | 10 | 0.38 | 0.06 | 10 | 0.34 | 0.06 |
| Sphenoid body | 14 | 0.27 | 0.06 | 13 | 0.27 | 0.05 | 10 | 0.57 | 0.06 | 10 | 0.51 | 0.08 |
| Left petrous temporal | 14 | 0.03 | 0.01 | 13 | 0.03 | 0.01 | 10 | 0.25 | 0.10 | 10 | 0.31 | 0.11 |
| Right petrous temporal | 14 | 0.03 | 0.01 | 13 | 0.03 | 0.01 | 10 | 0.25 | 0.10 | 10 | 0.30 | 0.11 |
| Left mandible | 14 | 1.20 | 0.28 | 13 | 1.24 | 0.23 | 10 | 2.34 | 0.34 | 10 | 2.17 | 0.33 |
| Right mandible | 14 | 1.22 | 0.29 | 13 | 1.27 | 0.22 | 10 | 2.34 | 0.34 | 10 | 2.18 | 0.33 |
| Ethmoid | 0 | 0 | 0 | 0 | 0 | 0 | 8 | 0.02 | 0.02 | 10 | 0.03 | 0.02 |
Table 3
Anatomical definitions of bony skull (dermal bone and endochondral bone) landmarks used in Euclidean Distance Matrix Analysis (EDMA) and morphological integration analyses.
Landmark locations can be visualized on 3D reconstructions of the mouse skull at embryonic day 17.5 (E17.5) and postnatal day 0 (P0) https://getahead.la.psu.edu/landmarks/.
| Bony skull landmarks for ages E15.5, E17.5, P0, and P2 | ||||||
|---|---|---|---|---|---|---|
| Landmark description | Anatomical region of interest | |||||
| Landmark abbreviation | Landmark definition | Olfactory capsule landmark set used in EDMA of E15.5–P2 | Braincase floor landmark set used in EDMA of E15.5–P2 | Lateral wall and roof of pre-occipital and occipital region landmark set used in EDMA of E15.5–P2 | Lateral wall and roof of pre-occipital region landmark set used in Morphological Integration analysis | Global skull landmark set used in EDMA of E17.5, P0, and P2 |
| amsph | Most anterior-medial point on the body of the sphenoid | x | ||||
| bas | Mid-point on the anterior margin of the foramen magnum, taken on basioccipital | x | x | |||
| ethma | Anterior most point on the body of the vomer, taken on the ventral surface | x | ||||
| intpar | Most anterior point on the ectocranial surface of the interparietal on the midsagittal plane | x | ||||
| laif | Most anteroinferior point on the frontal bone, left side | x | x | |||
| lalf | Most anteromedial point on the frontal bone, left side | x | ||||
| lalp | Most anterolateral point on the palatine plate, left side | |||||
| lasph | Posteromedial point of the inferior portion of the left alisphenoid | x | ||||
| lflac | Intersection of frontal process of maxilla with frontal and lacrimal bones, left side | x | ||||
| lfppm | Most superoposterior point of the premaxilla accounting for the lateral part of the nasal aperature, left side | x | x | |||
| liohd | Most distal point of the infraorbital hiatus, left side | x | x | |||
| lnasapl | Most superoanterior point of the premaxilla accounting for the lateral part of the nasal aperture, left side | x | x | |||
| loci | The superior posterior point on the ectocranial surface of occipital lateralis on the foramen magnum, left side | x | x | x | ||
| lpfl | Most lateral intersection of the frontal and parietal bones, taken on the parietal, left side | x | x | |||
| lplpp | Most posterolateral point on the palatine plate, left side | x | ||||
| lpsq | Most posterior point on the posterior extension of the forming squamosal, left side | x | x | |||
| lpto | Most posteromedial point on the parietal, left side | x | x | x | ||
| lva | Most posterior point on the left ala of the vomer | x | ||||
| raif | Most anteroinferior point on the frontal bone, right side | x | x | |||
| ralf | Most anteromedial point on the frontal bone, right side | x | ||||
| ralp | Most anterolateral point on the palatine plate, right side | |||||
| rasph | Posteromedial point of the inferior portion of the right alisphenoid | x | ||||
| rflac | Intersection of frontal process of maxilla with frontal and lacrimal bones, right side | x | ||||
| rfppm | Most supero-posterior point of the premaxilla accounting for the lateral part of the nasal aperture, right side | x | x | |||
| riohd | Most distal point of the infraorbital hiatus, right side | x | x | |||
| rmaxi | The midline point on the premaxilla between the incisor and the nasal cavity just anterior of the incisive foramen, right side | x | x | |||
| rnasapl | Most supero-anterior point of the premaxilla accounting for the lateral part of the nasal aperture, right side | x | x | |||
| roci | The supero posterior point on the ectocranial surface of occipital lateralis on the foramen magnum, right side | x | x | x | ||
| rpfl | Most lateral intersection of the frontal and parietal bones, located on the frontal, right side | x | x | |||
| rplpp | Most posterolateral point on the palatine plate, right side | x | ||||
| rpns | Most anterolateral indentation at the posterior edge of the palatine plate, right side | x | ||||
| rpsq | Most posterior point on the posterior extension of the forming squamosal, right side | x | x | |||
| rpto | Most posteromedial point on the parietal, right side | x | x | x | ||
| rva | Most posterior point on the right ala of the vomer | x | ||||
Table 4
Form difference of bony skulls.
Results (p values) of non-parametric null hypothesis tests for form differences euclidean distance matrix analysis (EDMA) of bony skull regions between Fgfr2cC342Y/+ mice and their Fgfr2c+/+ littermates using the expanded set of landmarks.
| Age | Olfactory capsule | Braincase floor | Lateral wall and roof of preoccipital and occipital region |
|---|---|---|---|
| Embryonic day 17.5 (E17.5) | 0.003 | 0.270 | 0.252 |
| Postnatal day 0 (P0) | 0.003 | 0.004 | 0.038 |
| Postnatal day 2 (P2) | 0.001 | 0.397 | 0.027 |
Table 5
Morphological integration of chondrocranium and dermatocranium.
Mean () and standard deviation (s) of the absolute value of correlation coefficients for all chondrocranium measures, all dermatocranium measures, and between all chondrocranium and dermatocranium measures for embryonic day 15.5 (E15.5) and E17.5 samples used in analysis.
| Dermatocranium | Chondrocranium | Dermatocranium andChondrocranium | |||||
|---|---|---|---|---|---|---|---|
| Age | Genotype | s | s | s | |||
| E15.5 | Affected | 0.62 | 0.33 | 0.73 | 0.25 | 0.65 | 0.30 |
| Unaffected | 0.68 | 0.31 | 0.53 | 0.29 | 0.42 | 0.25 | |
| E17.5 | Affected | 0.59 | 0.29 | 0.61 | 0.28 | 0.46 | 0.26 |
| Unaffected | 0.52 | 0.28 | 0.47 | 0.28 | 0.49 | 0.27 | |
Key resources table
| Reagent type (species) or resource | Designation | Source or reference | Identifiers | Additional information |
|---|---|---|---|---|
| Strain, strain background (Mus musculus, CD1) | Fgfr2cC342Y/+ | Eswarakumar et al., 2004 | Laboratory of Dr. Richtsmeier (Pennsylvania State University); craniosynostosis mouse model on a CD1 background | |
| Software, algorithm | Avizo | ThermoFisher Scientific | RRID:SCR_014431 | https://www.thermofisher.com/us/en/home/electron-microscopy/products/software-em-3d-vis/avizo-software.html |
| Software, algorithm | Code for automatic chondrocranium segmentation with very sparse annotation via uncertainty-guided self-training | Zheng et al., 2020. https://doi.org/10.1007/978-3-030-59710-8_78 | https://github.com/ndcse-medical/CartSeg_UGST | |
| Software, algorithm | Euclidean Distance Matrix Analysis (EDMA) | Lele and Richtsmeier, 2001; ISBN-13: 978–0849303197 ISBN-10: 0849303192 | https://getahead.la.psu.edu/resources/edma/ and https://github.com/psolymos/EDMAinR; Solymos, 2021 | |
| Software, algorithm | IBM SPSS Statistics | IBM | SCR_016479 | https://www.ibm.com/products/spss-statistics |
| Software, algorithm | Statistical Analysis System (SAS) | SAS | RRID:SCR_008567 | http://www.sas.com |
| Other | Weigert’s Iron Hematoxylin | Sigma | HT1079 | Per manufacturer’s protocol, 1:1 solution Parts A:B http://www.ihcworld.com/_protocols/special_stains/safranin_o.htm |
| Other | Safranin O | Sigma-Aldrich | 115980025 | 0.1% solution with distilled water http://www.ihcworld.com/_protocols/special_stains/safranin_o.htm |
| Other | Fast Green FCF | Sigma-Aldrich | F7252 | 0.05% solution with distilled water http://www.ihcworld.com/_protocols/special_stains/safranin_o.htm |
| Other | Acetic Acid | Fisher | A38SI-212 | 1% solution with distilled water http://www.ihcworld.com/_protocols/special_stains/safranin_o.htm |
Table 6
Sample sizes of embryonic mice used in analyses.
Specimen matched bone and phosphotungstic acid enhanced (PTA-e) scans were used for morphological integration (MI) analysis.
| Age | Genotype | Bone Scan | PTA Scan | MI | Histology | ||
|---|---|---|---|---|---|---|---|
| E15.5, E16.5, E17.5EDMA | E17.5, P0, P2EDMA | E17.5, P0Bone volumes | |||||
| E13.5 | Fgfr2c+/+ | 0 | 0 | 0 | 3 | 0 | 4 |
| Fgfr2cC342Y/+ | 0 | 0 | 0 | 3 | 0 | 4 | |
| E14.5 | Fgfr2c+/+ | 0 | 0 | 0 | 5 | 0 | 7 |
| Fgfr2cC342Y/+ | 0 | 0 | 0 | 5 | 0 | 7 | |
| E15.5 | Fgfr2c+/+ | 7 | 0 | 0 | 5 | 5 | 6 |
| Fgfr2cC342Y/+ | 4 | 0 | 0 | 4 | 4 | 6 | |
| E16.5 | Fgfr2c+/+ | 7 | 0 | 0 | 5 | 0 | 6 |
| Fgfr2cC342Y/+ | 7 | 0 | 0 | 5 | 0 | 5 | |
| E17.5 | Fgfr2c+/+ | 13 | 31 | 13 | 5 | 5 | 4 |
| Fgfr2cC342Y/+ | 13 | 18 | 14 | 5 | 5 | 5 | |
| P0 | Fgfr2c+/+ | 0 | 11 | 10 | 0 | 0 | 0 |
| Fgfr2cC342Y/+ | 0 | 11 | 10 | 0 | 0 | 0 | |
| P2 | Fgfr2c+/+ | 0 | 13 | 0 | 0 | 0 | 0 |
| Fgfr2cC342Y/+ | 0 | 16 | 0 | 0 | 0 | 0 | |
Additional files
Download links
A two-part list of links to download the article, or parts of the article, in various formats.
Downloads (link to download the article as PDF)
Open citations (links to open the citations from this article in various online reference manager services)
Cite this article (links to download the citations from this article in formats compatible with various reference manager tools)
A dysmorphic mouse model reveals developmental interactions of chondrocranium and dermatocranium
eLife 11:e76653.
https://doi.org/10.7554/eLife.76653


