Glycan processing in the Golgi as optimal information coding that constrains cisternal number and enzyme specificity
- Raman Research Institute, India
- Laboratoire Physico Chimie Curie, Institut Curie, CNRS UMR168, France
- Industrial Engineering and Operations Research, Columbia University, United States
- Simons Centre for the Study of Living Machines, National Centre for Biological Sciences, India
Figures
Figure 1
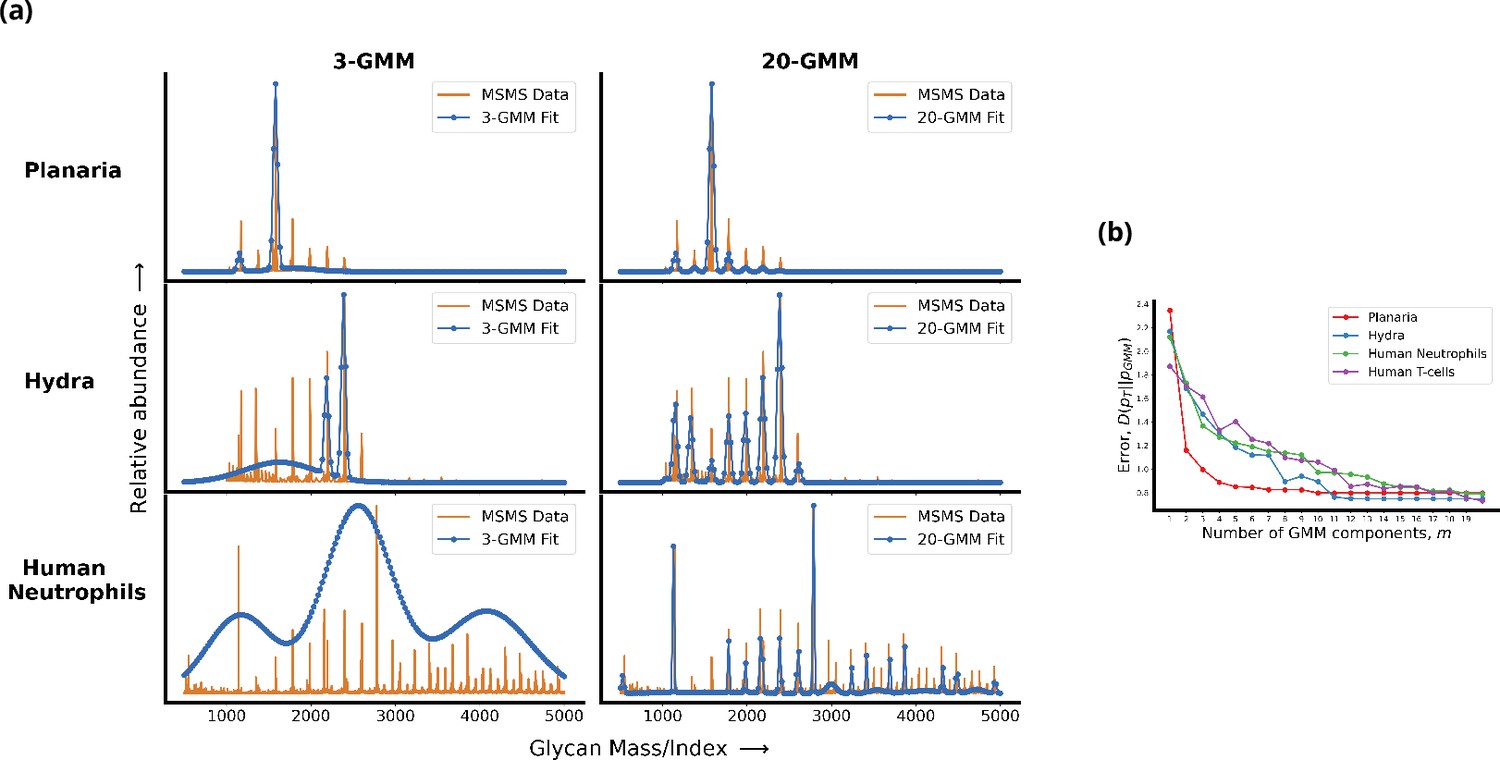
Living cells display a complex glycan distribution.
(a) 3-Gaussian mixture model (GMM) and 20-GMM approximation for the relative abundance of glycans taken from mass spectrometry coupled with determination of molecular structure (MSMS) data of planaria Schmidtea mediterranea, Hydra magnipapillata, and human neutrophils. (b) The change in the Kullback–Leibler (KL) divergence as a function of the number of GMM components . The KL divergence for planaria saturates at , for hydra at , and for human cells at . Thus, the number of components required to approximate the glycan profile correlates well with the complexity of the organism. Details are given in Appendix 1.
Figure 2

Enzymatic reaction and transport network in the secretory pathway.
Represented here is the array of Golgi cisternae (blue) indexed by situated between the endoplasmic reticulum (ER) and plasma membrane (PM). Glycan-binding proteins are injected from the ER to cisterna-1 at rate . Superimposed on the Golgi cisternae is the transition network of chemical reactions (column) – inter-cisternal transfer (rows), the latter with rates . denotes the acceptor substrate in compartment and the glycosyl donor is chemostated in each cisterna. This results in a distribution (relative abundance) of glycans displayed at the PM (red curve), which is representative of the cell type.
Figure 3
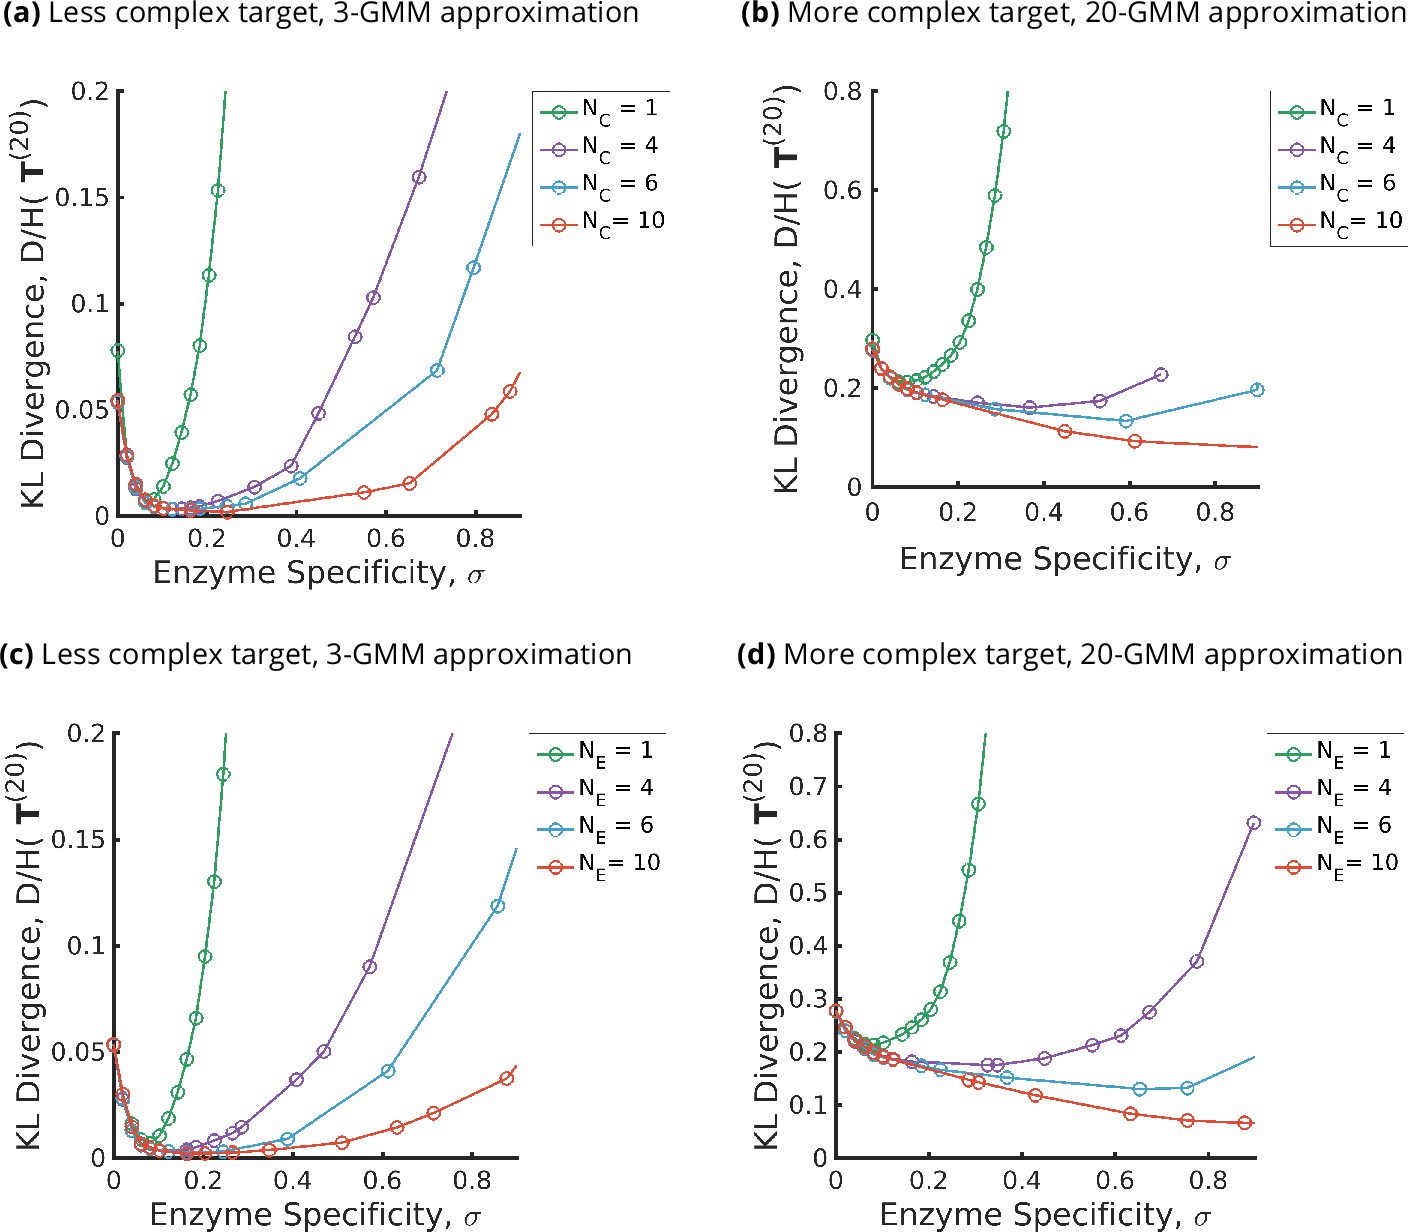
Trade-offs amongst the glycan synthesis parameters, enzyme specificity , cisternal number , and enzyme number to achieve a complex target distribution .
(a, b) Normalised Kullback–Leibler distance as a function of and (for fixed ), (c, d) as a function of and (for fixed ), with the target distribution set to the 3-Gaussian mixture model (GMM) (less complex) and 20-GMM (more complex) approximations for the human T-cell mass spectrometry coupled with determination of molecular structure (MSMS) data. is a convex function of for each , decreasing in for each , increasing in the complexity of for fixed . The specificity that minimizes the error for given is an increasing function of and the complexity of the target distribution .
Figure 4
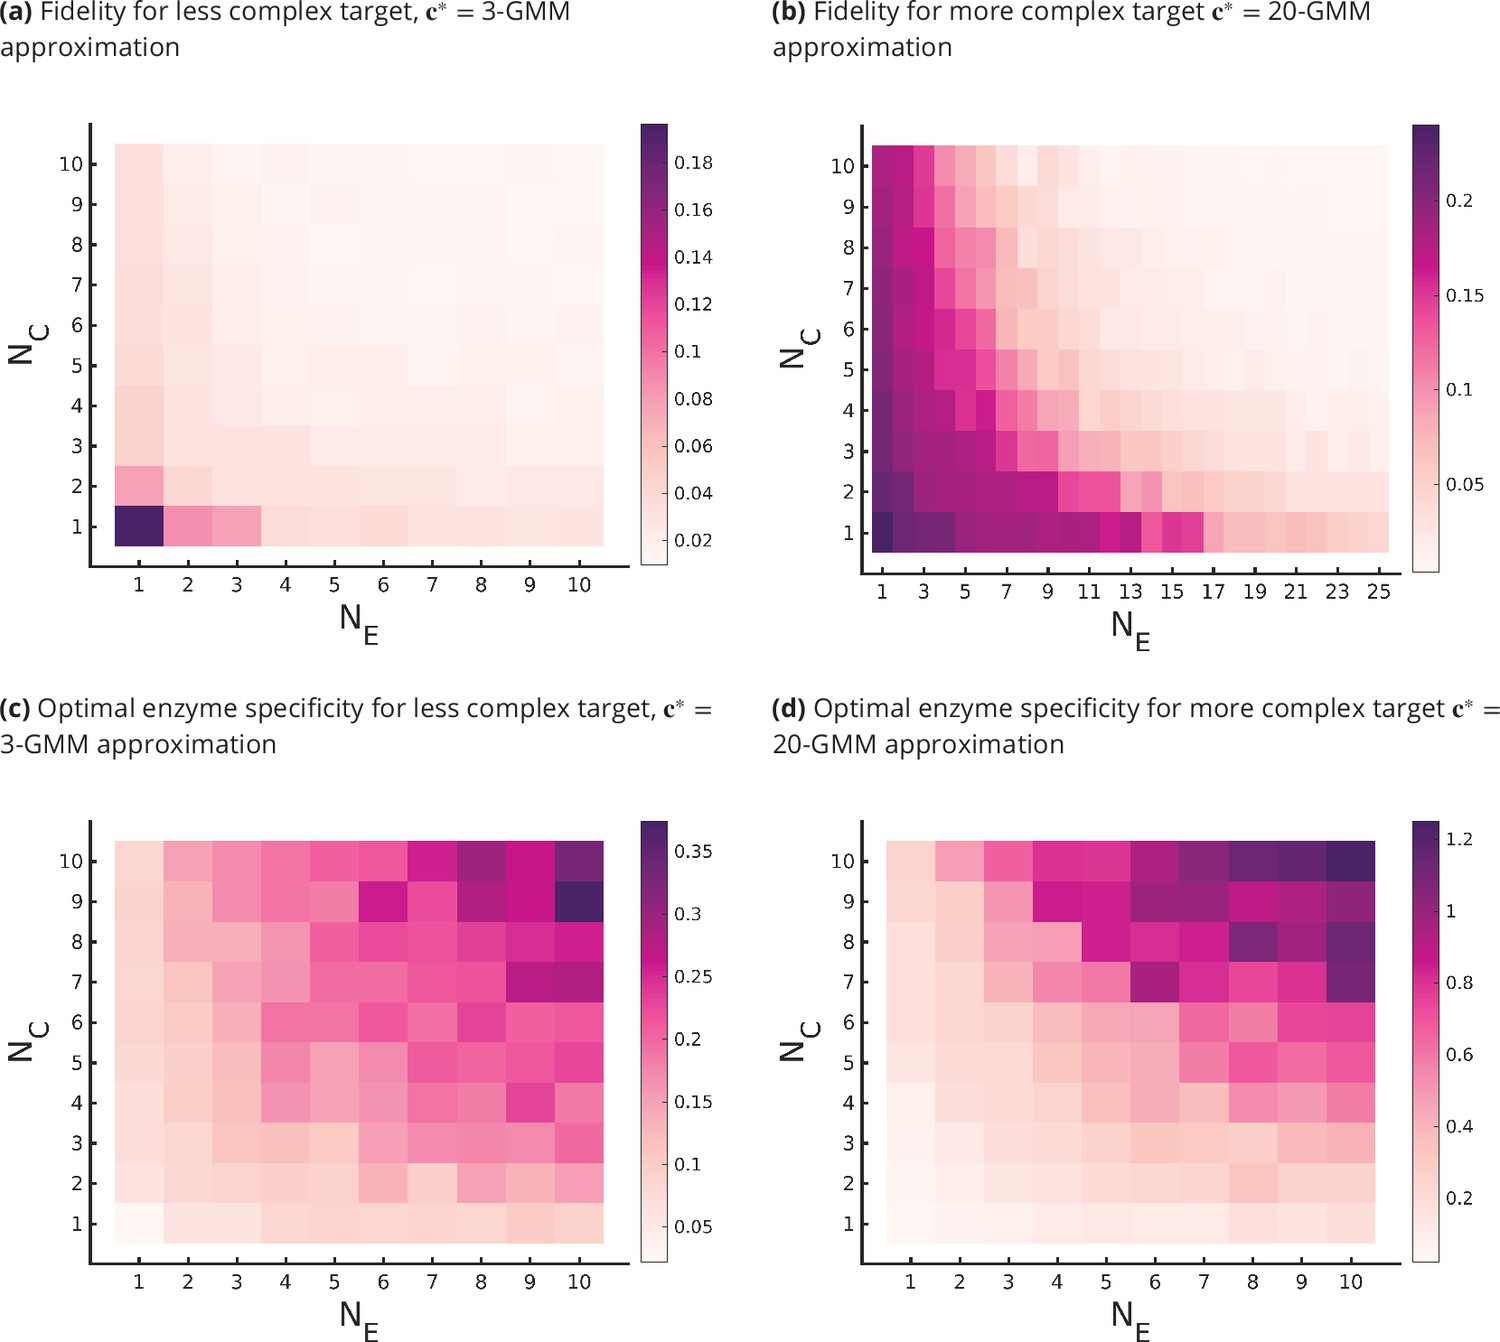
Fidelity of glycan distribution and optimal enzyme properties to achieve a complex target distribution.
The target is taken from 3-Gaussian mixture model (GMM) (less complex) and 20-GMM (more complex) approximations of the human T-cell mass spectrometry coupled with determination of molecular structure (MSMS) data. (a, b) Optimum fidelity as a function of . More complex distributions require either a larger or . The marginal impact of increasing and on the fidelity is approximately equal. (c, d) Enzyme specificity that achieves as a function of . increases with increasing or . To synthesize the more complex 20-GMM approximation with high fidelity requires enzymes with higher specificity compared to those needed to synthesize the broader, less complex 3-GMM approximation.
Figure 5
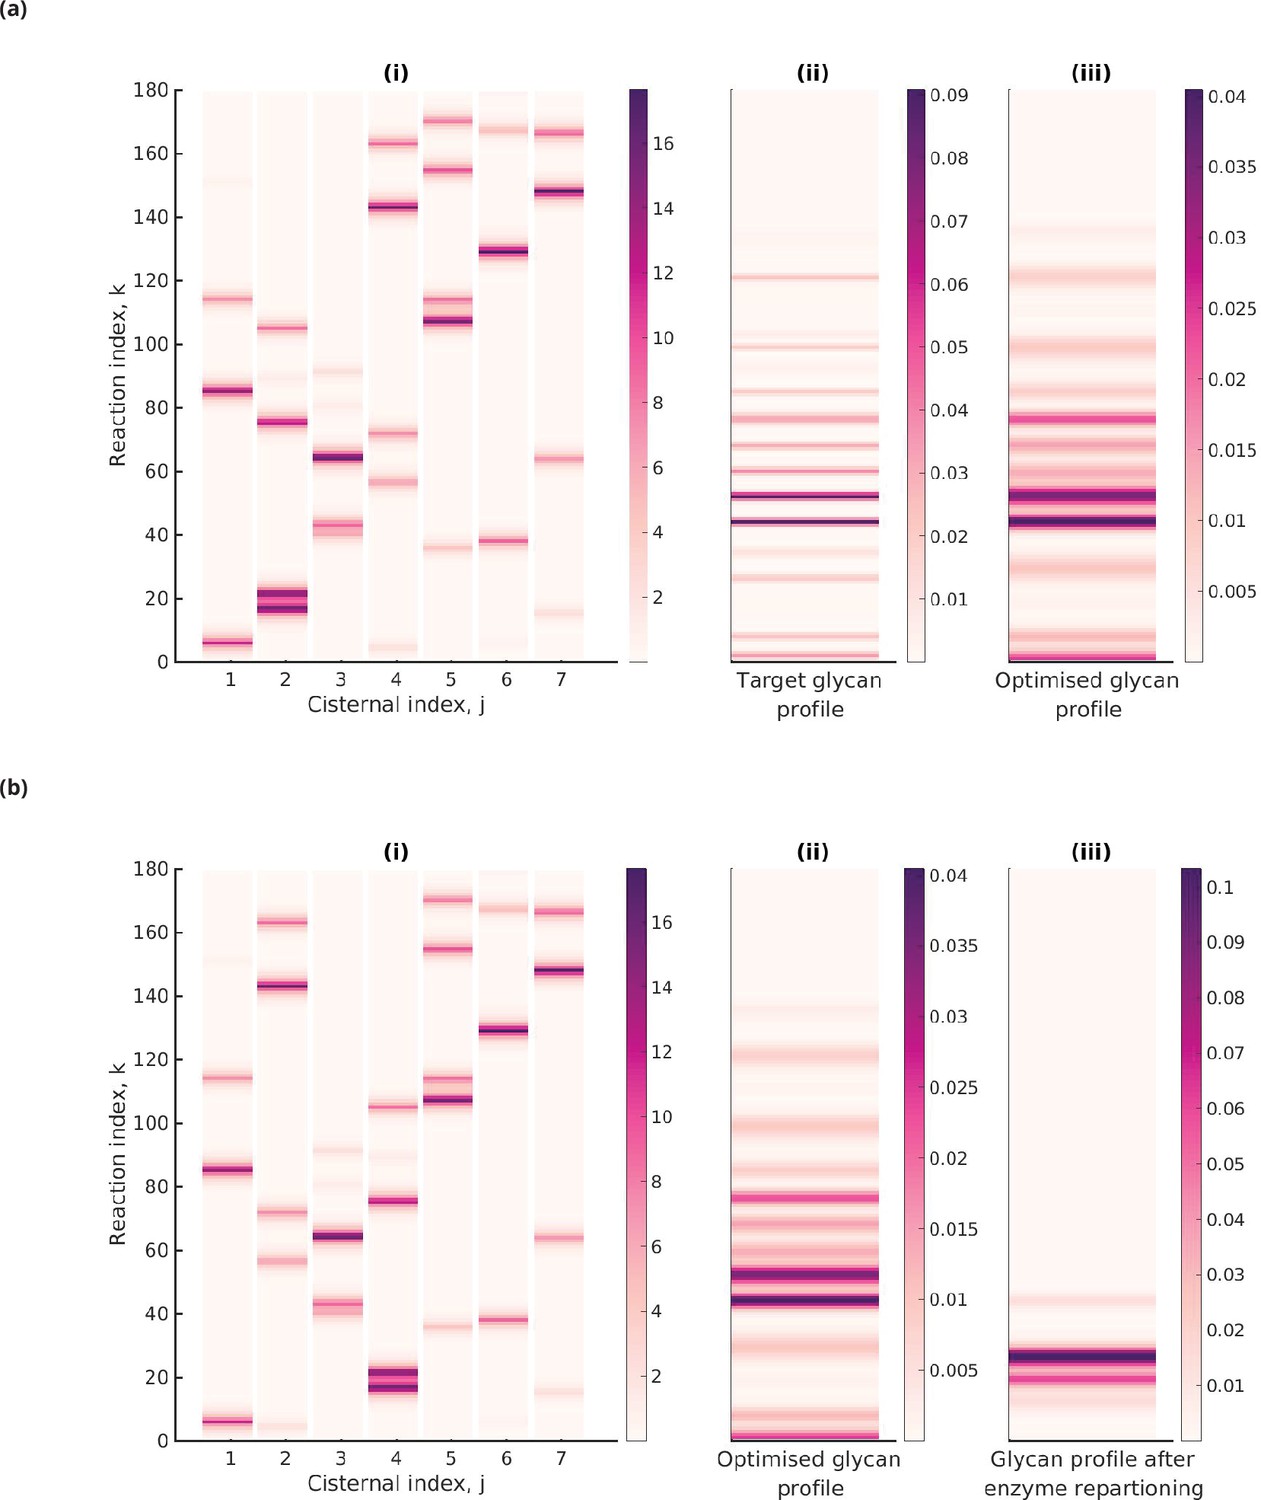
Optimal enzyme partitioning in cisternae.
(a) Heat map of the effective reaction rates in each cisterna (representing the optimal enzyme partitioning) and the steady-state concentration in the last compartment () for the 20-Gaussian mixture model (GMM) target distribution. Here, , , normalized . (b) Effective reaction rates after swapping the optimal enzymes of the fourth and second cisternae. The displayed glycan profile is considerably altered from the original profile.
Figure 6

Stiff and sloppy directions in the optimization parameters.
(a) Eigenvectors of the Hessian matrix for . The x-axis indexes the eigenvectors, the y-axis indexes the components of the eigenvectors, and the greyscale denotes the absolute value of the component in the range . The components are grouped according to (), and the eigenvectors are ordered according to the most dominant component in the eigenvector (, orange; , blue; , green; , purple). There is some mixing of the different components ( and or and ) but this is usually small. (b) The distribution of eigenvalues of the Hessian matrix . Each stripe represents an eigenvalue, and the location of the stripe on the x-axis represents whether the dominant component of the associated eigenvector belongs to , , , or direction. (c) The average stiffness along , , , or directions, defined by the log of the average of eigenvalues corresponding to the eigenvectors in the respective group, as a function of for fixed . (d) Total average stiffness as a function of .
Figure 7
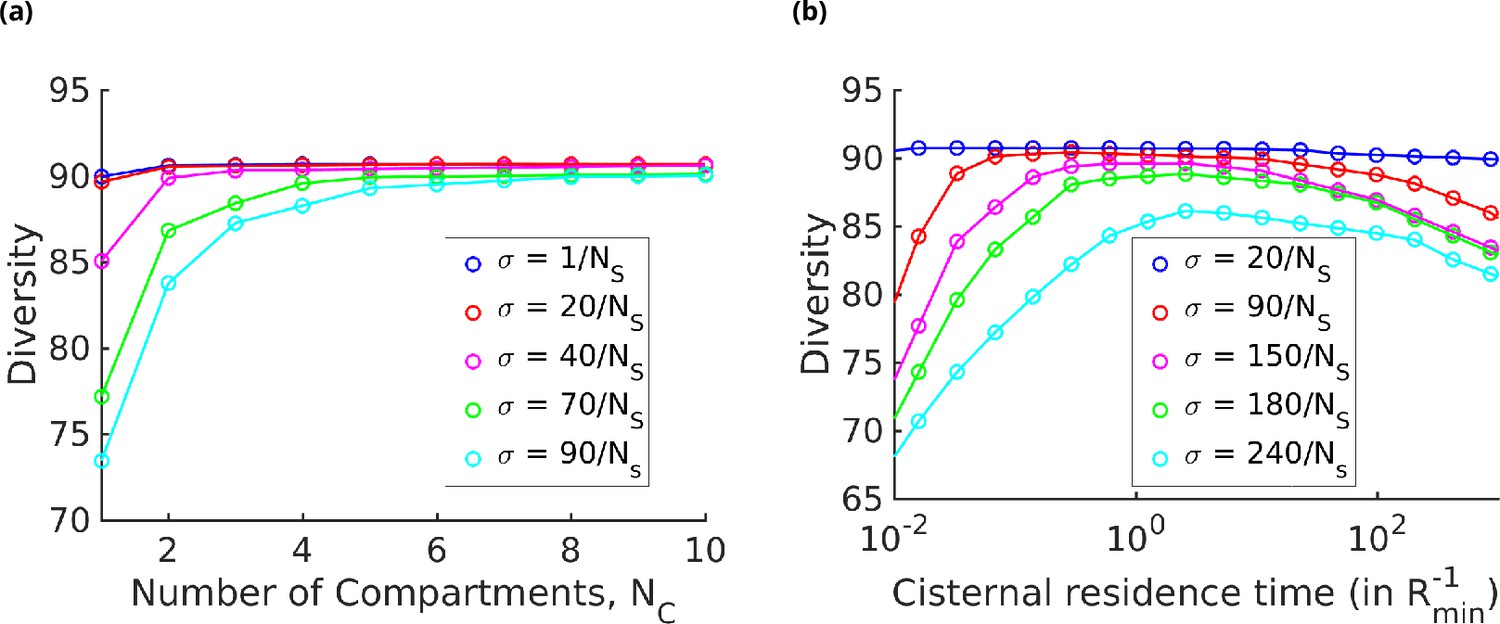
Strategies for achieving high glycan diversity.
Diversity versus and transport rate at various values of specificity for fixed . (a) Diversity vs. at optimal transport rate . Diversity initially increases with , but eventually levels off. The levelling off starts at a higher when is increased. These curves are bounded by the curve. (b) Diversity vs. cisternal residence time () in units of the reaction time () at various value of , for fixed and .
Appendix 1—figure 1
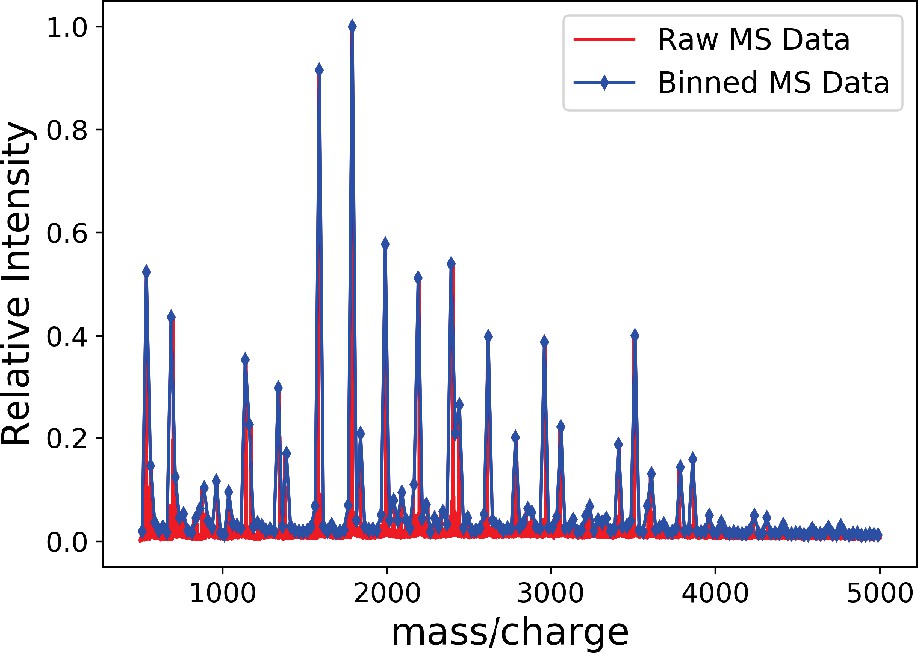
The binned mass spectroscopy (MS) data (blue) approximates the raw MS data (red) very well.
We use this binned data for Gaussian mixture model (GMM) approximation of the MS data.
Appendix 1—figure 2
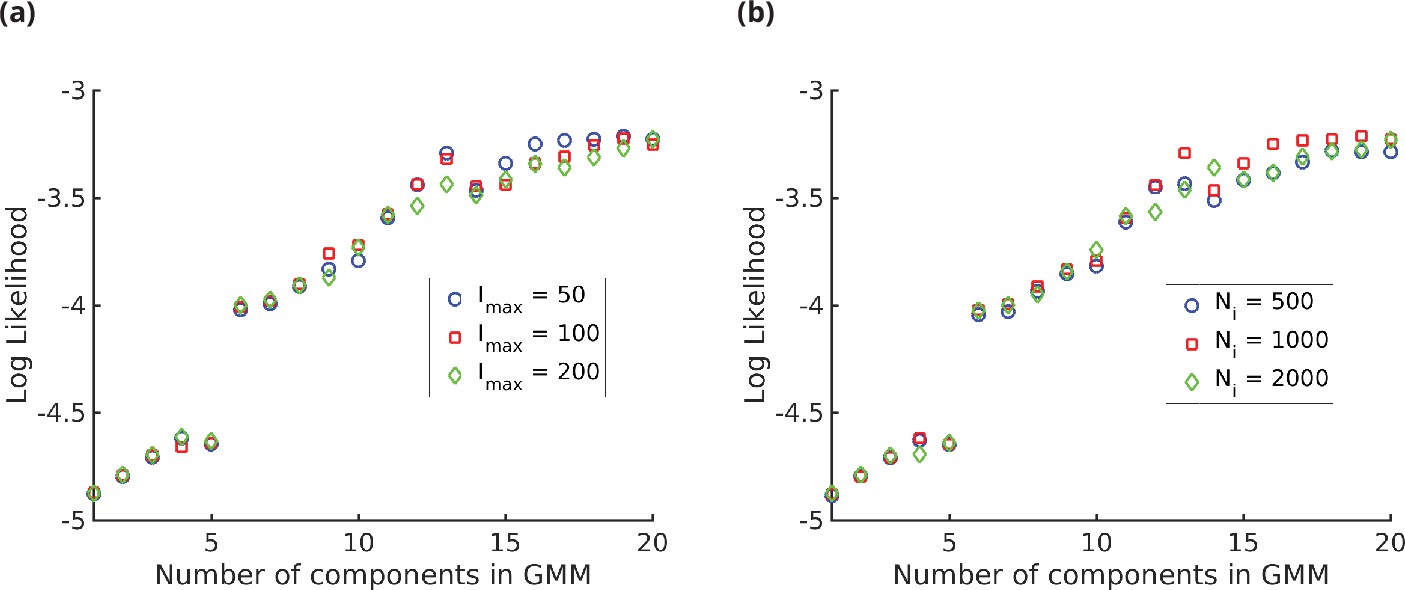
Log likelihood vs. number of components () in the Gaussian mixture model (GMM).
We see that the log likelihood saturates at around,, thus 20-GMM is a very good representation of the mass spectroscopy (MS) data from human T-cells. The different symbols are for (a) different values of the maximum intensity and (b) different values of the number of i.i.d. samples, showing the insensitivity of the log likelihood to the value of and.
Appendix 4—figure 1
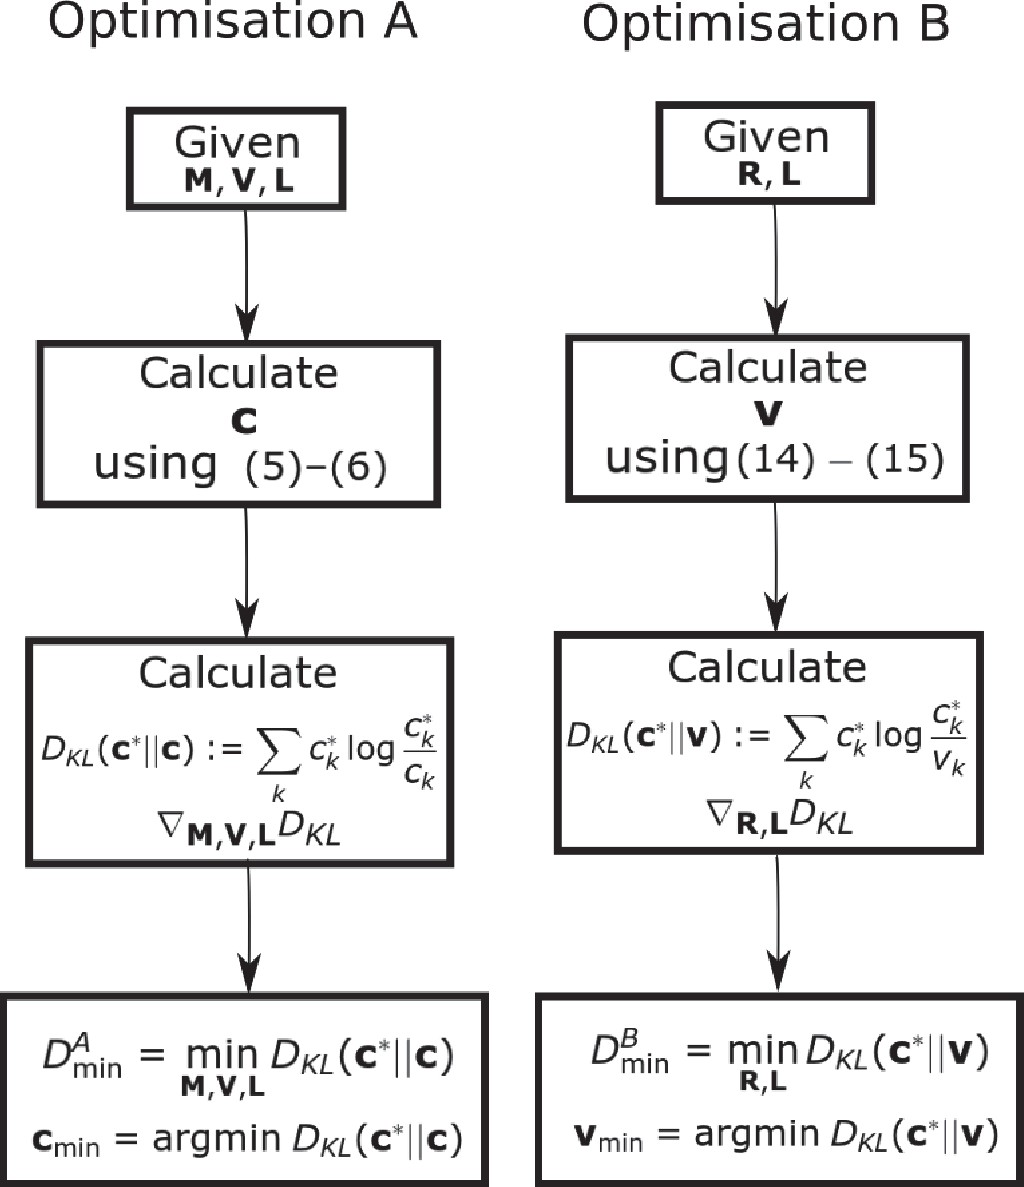
Flow chart showing the optimization schemes for Optimization A and B.
We prove that by showing the set of all is equal to the set of all . We additionally establish that the optimum .
Appendix 6—figure 1
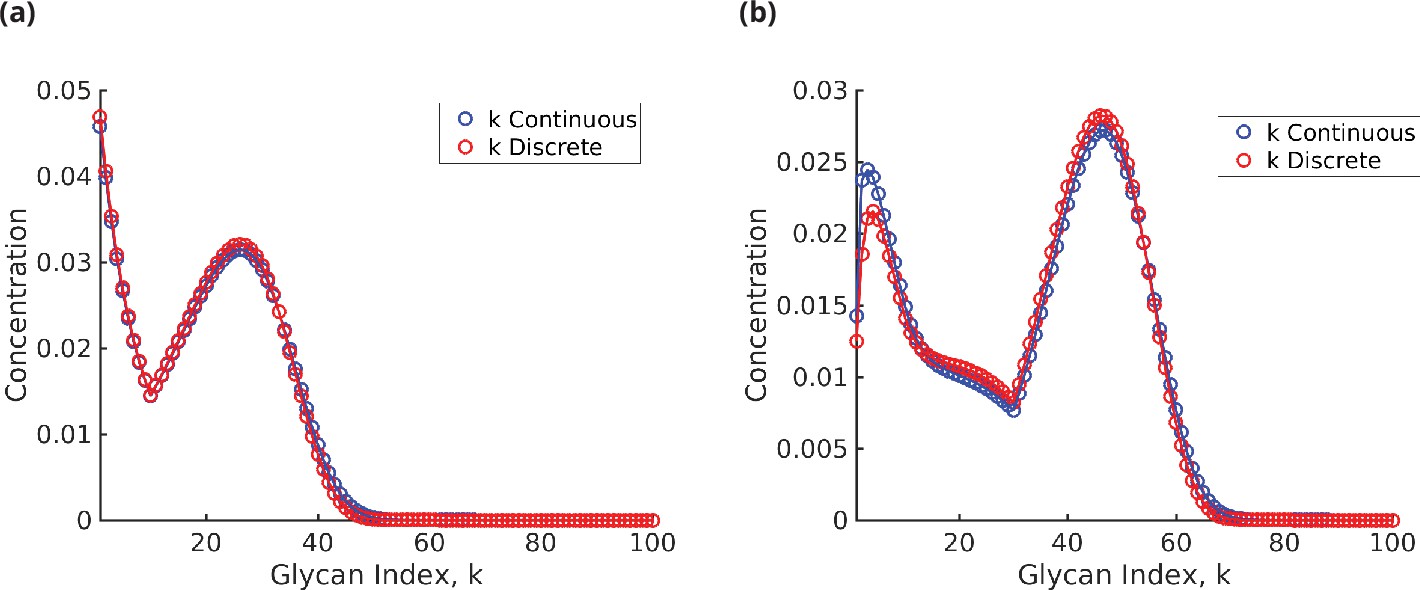
Glycan concentration profile calculated from the model using (a) formula (31) for and (b) formulae (32)–(36) for .
Appendix 6—figure 2
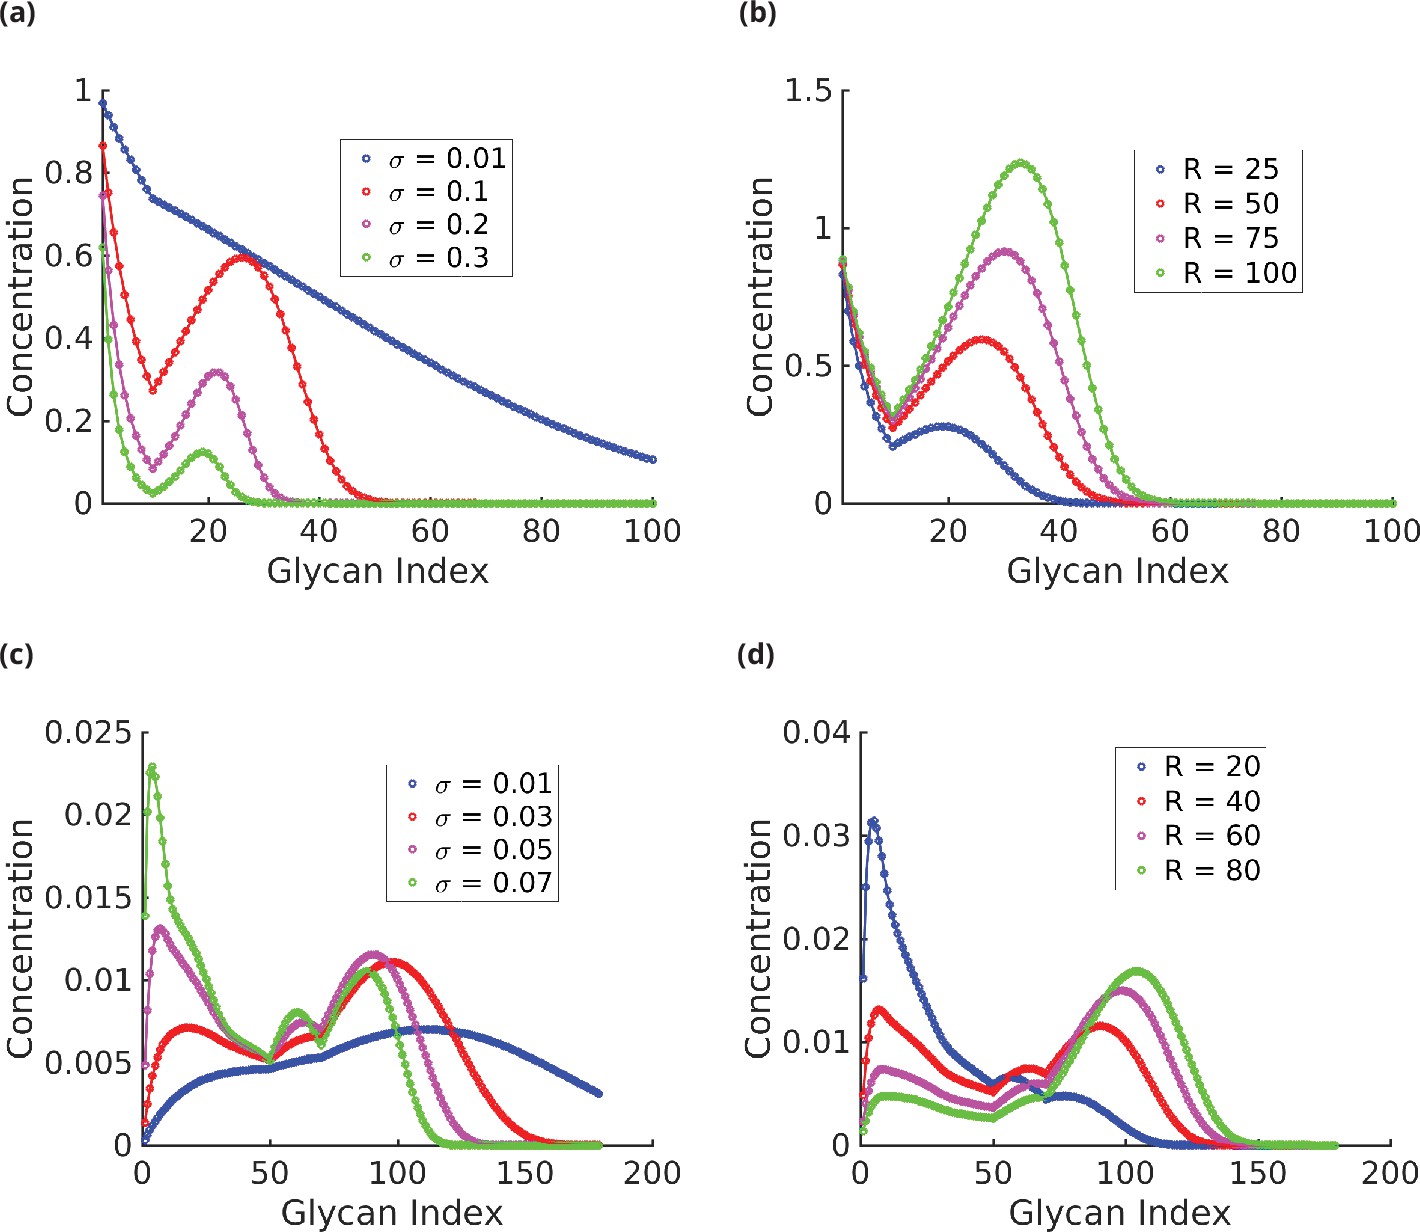
Glycan profile as a function of specificity (a, c) and reaction rates (b, d).
(a) . ck decreases exponentially with for very low and very high ; however, the decay rate is lower at low . For intermediate values of , the distribution has exactly two peaks, one of which is at , and eventually decays exponentially. The width of the distribution is a decreasing function of . (b) . At low , ck is concentrated at low . The proportion of higher index glycans in an increasing function of . (c) . As increases, the distribution becomes more complex – from a single-peaked distribution at low to a maximum of four-peaked distribution at high . The peaks gets sharper, and more well defined as increases. (d) . As in the plots in (b), increasing shifts the peaks towards higher index glycans and the proportion of higher index glycan increases.
Appendix 7—figure 1
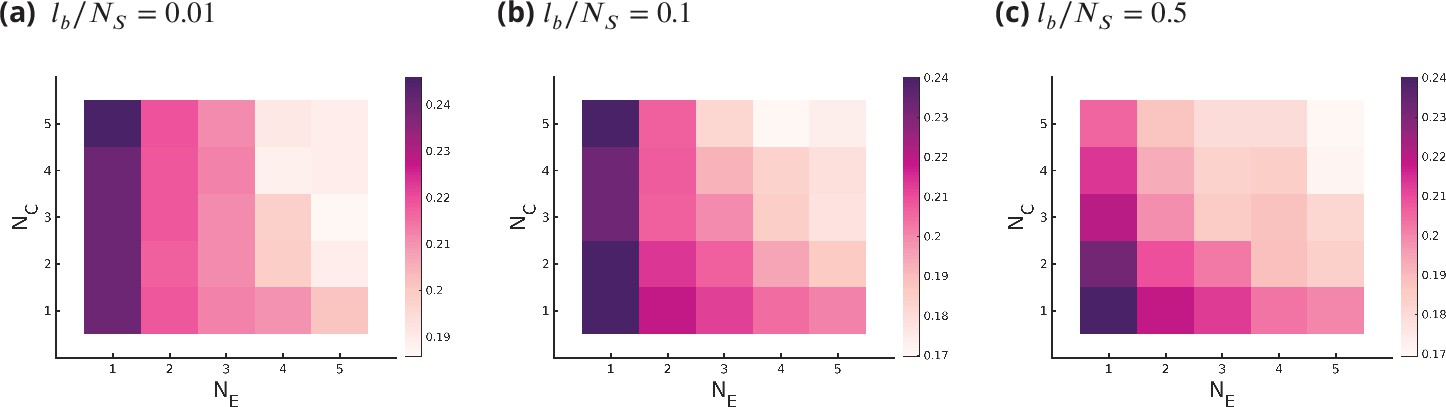
Optimum fidelity as a function of for different values of , where bounds the deformation in the ideal length of an enzyme .
Small values of restrict all enzymes from working in all cisternae and all substrates, where large value of removes this constraint.
Appendix 8—figure 1
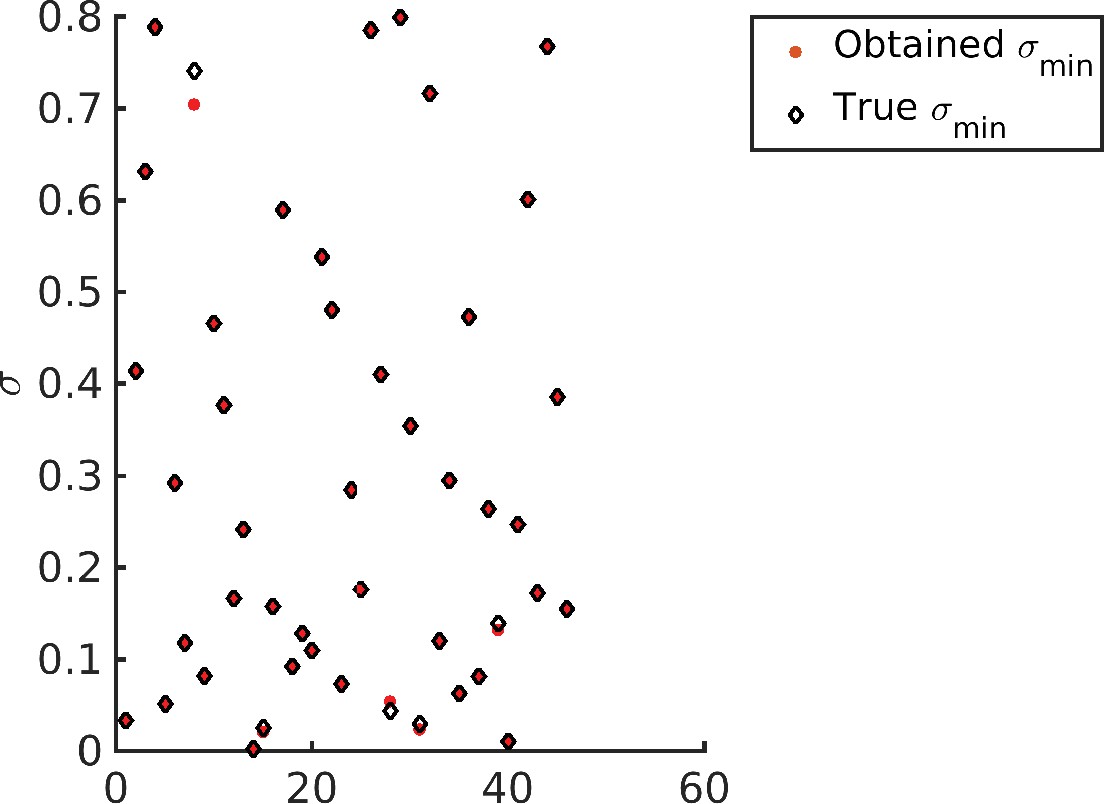
Recovering the values for different target distribution.
Note that barring four data points all other optimized values (red dots) exactly overlap with the corresponding target (diamonds).
Appendix 8—figure 2

for various initial conditions, sorted in increasing order for clarity.
This clearly shows the fraction of initial conditions for which the optimized is small (see Appendix 8—table 1).
Appendix 10—figure 1
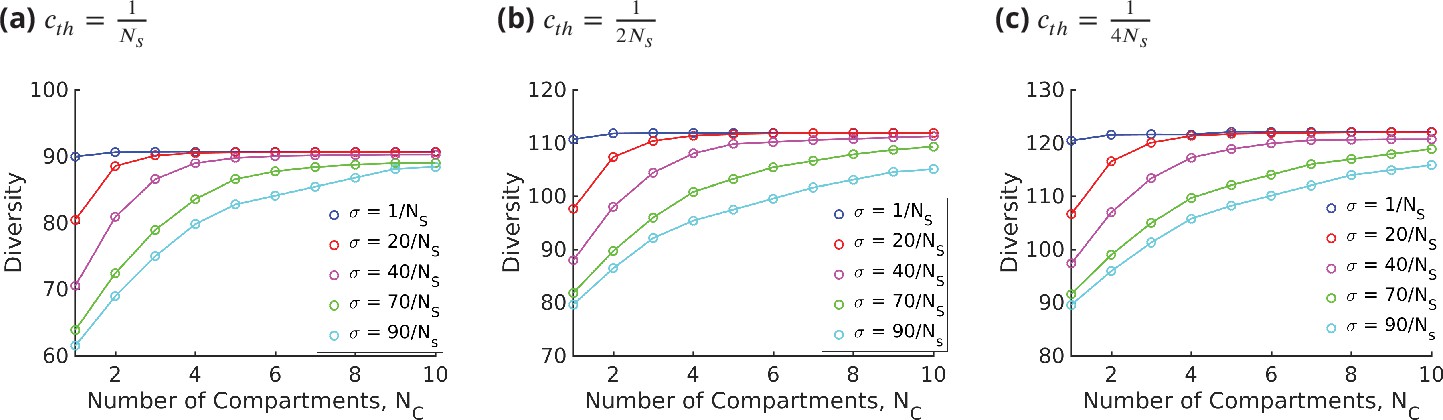
Diversity vs. for different values of keeping fixed, for three different values of the threshold, .
Changing the value of the threshold only changes the saturation value of the diversity curve.
Tables
Appendix 2—table 1
Enzyme parameters taken from Table 3 in Umaña and Bailey, 1997 that we use to calculate the bounds on the reaction rate .
Here, and denote the Michaelis constant and of the αth enzyme.
| (µmol) | (pmol/106 cell-min) | |
|---|---|---|
| 1 | 100 | 5 |
| 2 | 260 | 7.5 |
| 3 | 200 | 5 |
| 4 | 100 | 5 |
| 5 | 190 | 2.33 |
| 6 | 130 | .16 |
| 7 | 3400 | .16 |
| 8 | 4000 | 9.66 |
Appendix 8—table 1
Distribution of local minima.
| Fraction of initial conditions within | ||||
|---|---|---|---|---|
| 1 | 1 | 0.0228 | 0.44 | 0.56 |
| 2 | 1 | 0.0081 | 0.44 | 0.73 |
| 1 | 2 | 0.0051 | 0.29 | 0.70 |
| 2 | 2 | 1.17e-4 | 0.29 | 0.84 |
Appendix 11—table 1
Table of symbols and their definitions.
| Symbol | Definition |
|---|---|
| Concentration of th glycan in th compartment | |
| Transport rate from th to compartment | |
| Specificity of the enzymes | |
| Ideal substrate length for αth enzyme in th compartment | |
| Enzyme parameter related to the Michaelis constant | |
| Enzyme parameter related to | |
| Reaction parameter for Optimization B | |
| KL divergence between and | |
| Fidelity, KL divergence normalized by the entropy of the target | |
| Effective reaction rate of th reaction in th compartment |
Additional files
Download links
A two-part list of links to download the article, or parts of the article, in various formats.
Downloads (link to download the article as PDF)
Open citations (links to open the citations from this article in various online reference manager services)
Cite this article (links to download the citations from this article in formats compatible with various reference manager tools)
Glycan processing in the Golgi as optimal information coding that constrains cisternal number and enzyme specificity
eLife 11:e76757.
https://doi.org/10.7554/eLife.76757


