Male rat leukocyte population dynamics predict a window for intervention in aging
- Epigenetics and Stem Cell Unit, Translational Gerontology Branch, National Institute on Aging, United States
- Flow Cytometry Core, National Institute on Aging, United States
- Computational Biology and Genomics Core, Laboratory of Genetics & Genomics, National Institute on Aging, United States
- Comparative Medicine Section, National Institute on Aging, United States
Figures
Figure 1 with 2 supplements

Unsupervised clustering of all F344 rat peripheral blood cells.
Clustering of rat peripheral blood using a self-organizing map algorithm. For detailed clustering also see Figure 1—figure supplement 1. (a) Overall clustering of all leukocytes from 146 rats overlaid on a t-SNE map; each cluster is denoted as a different color (see legend). (b) Specific blood cell types illustrated on the same t-SNE map for three age groups (n = 10,000 cells from each age group; total 30,000 cells). For visualization purposes, rats were divided into age groups: young (3–4 months), middle-aged (15–23 months), and old (24+ months).
Figure 1—figure supplement 1
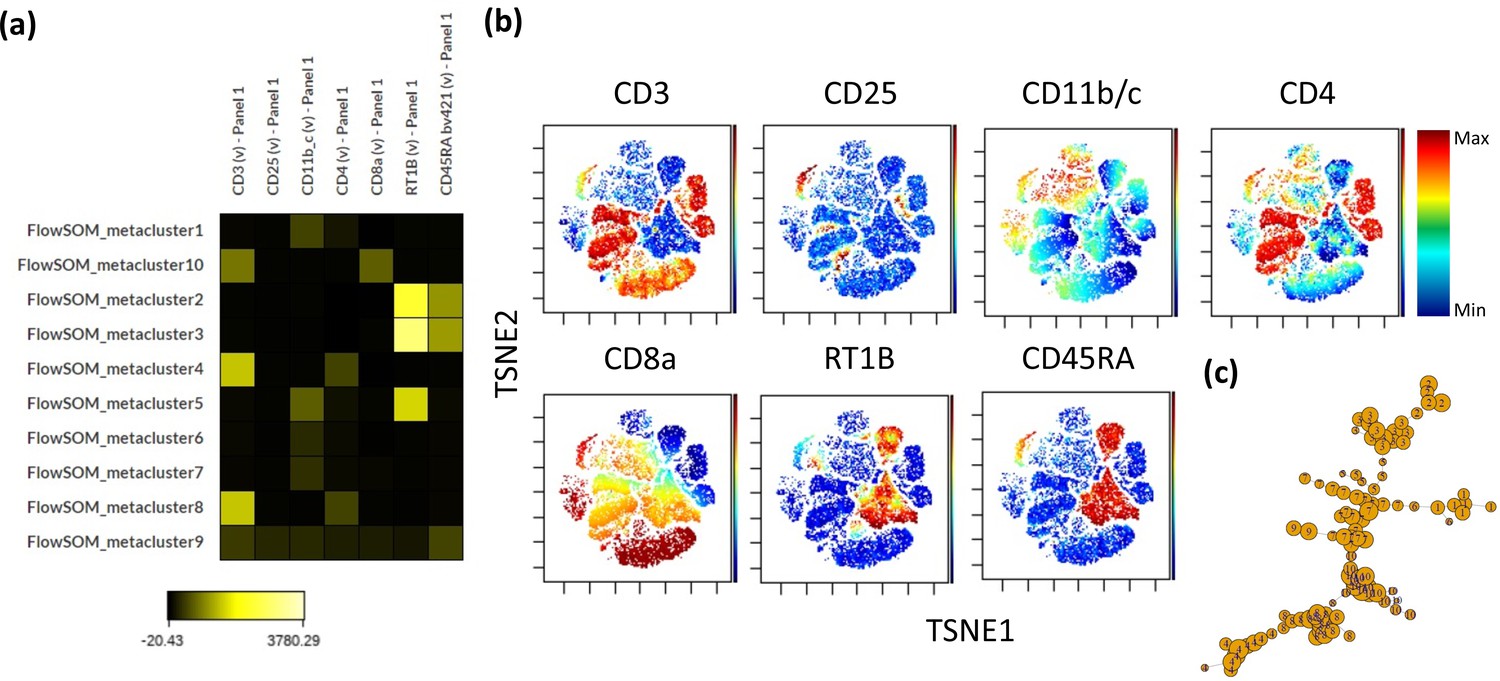
Self-organizing map clustering of F344 rat leukocytes.
1.3 million random cells from all samples were chosen to perform a self-organizing map analysis on the cytobank platform using default settings. (a) Heatmap of Ab fluorophore intensities per cluster. (b) Fluorophore intensities (blue = low intensity to red = high intensity) overlaid on a ViSNE plot generated on the same platform using default settings. (c) Divergence tree of clustering.
Figure 1—figure supplement 2
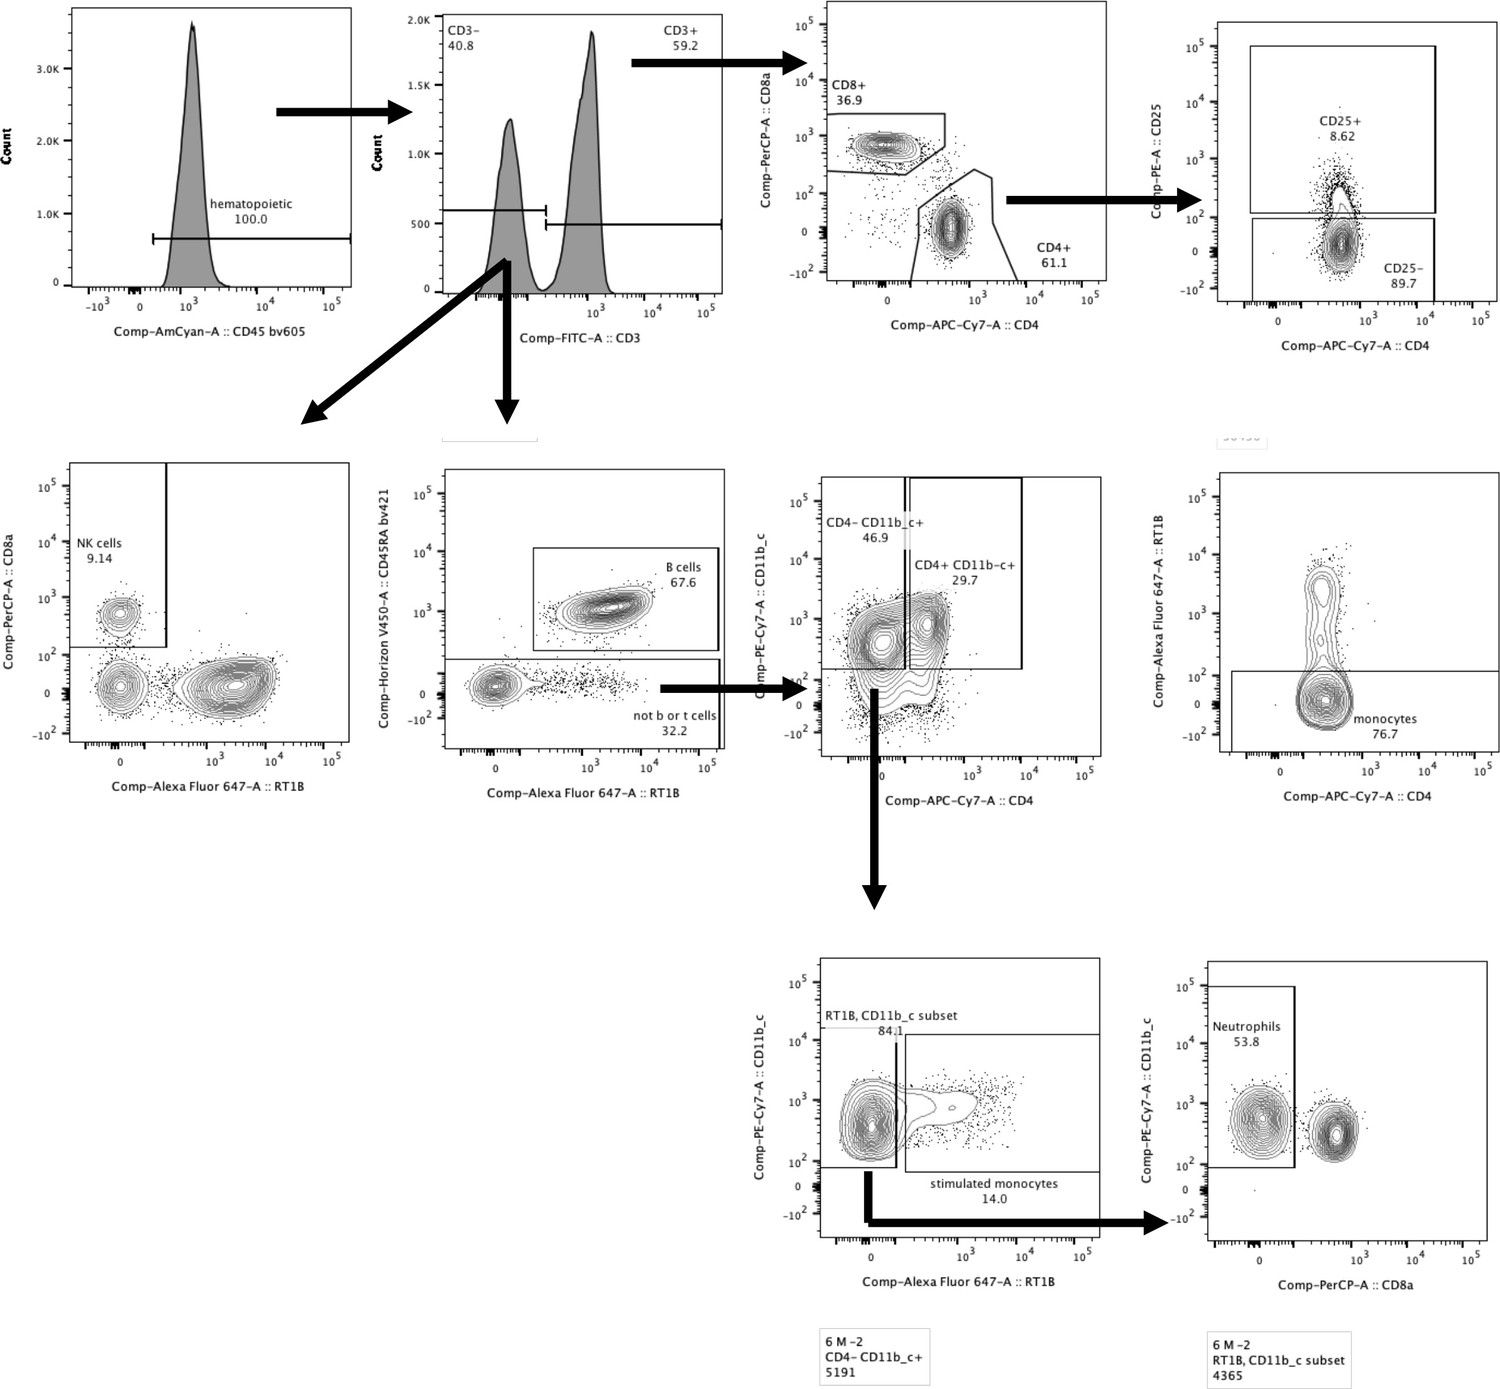
Gating strategy.
The staining panel was uniform for all samples and consisted of the following anti-rat Abs: CD45-BV605, CD3-FITC, CD8a-PerCP, CD4-APC.Cy7, CD25-PE, RT1B-AF647, CD45RA-BV421, and CD11b/c-PE.Cy7.
Figure 2
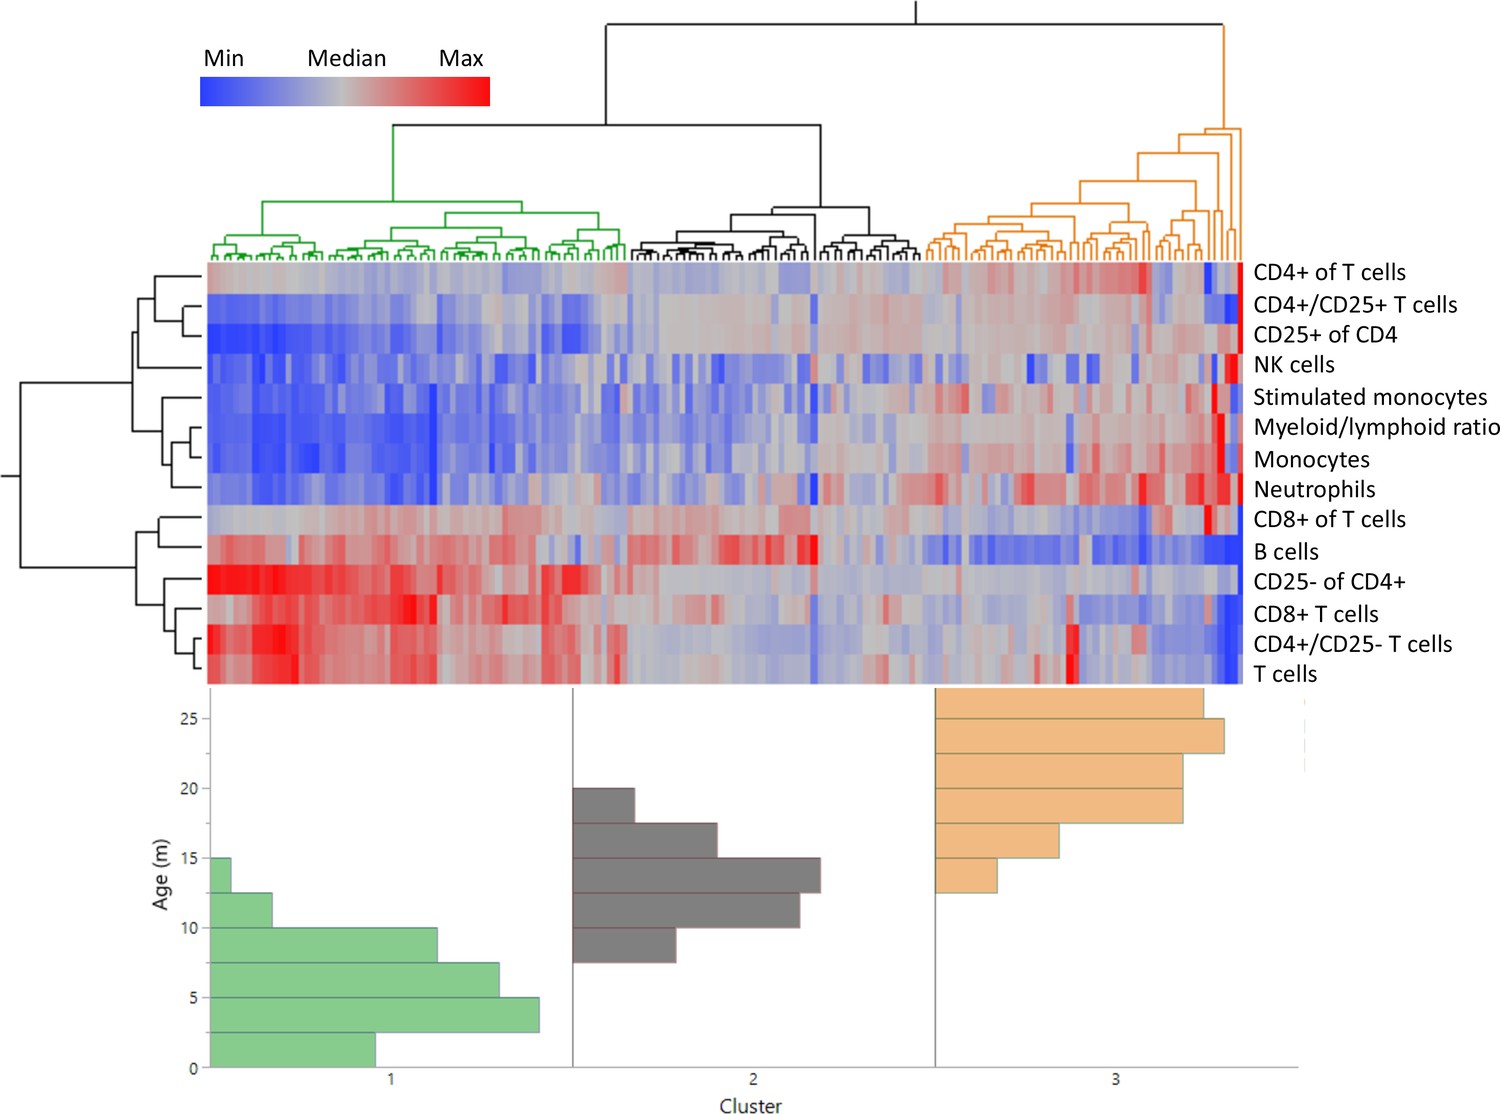
Distinct age clustering of rats based on white blood cell frequencies.
Hierarchical agglomerative clustering with distance matrix by Ward’s method. The top lines represent the distance matrix for the individual rats, and the three major branches are annotated by green, dark gray, and orange. The heatmap represents the normalized frequency of each population as indicated by the legend. The lines on the left indicate the distance matrix of the frequencies. The bottom histogram represents the age distribution for each of the major clusters in the same colors as above.
Figure 3 with 2 supplements
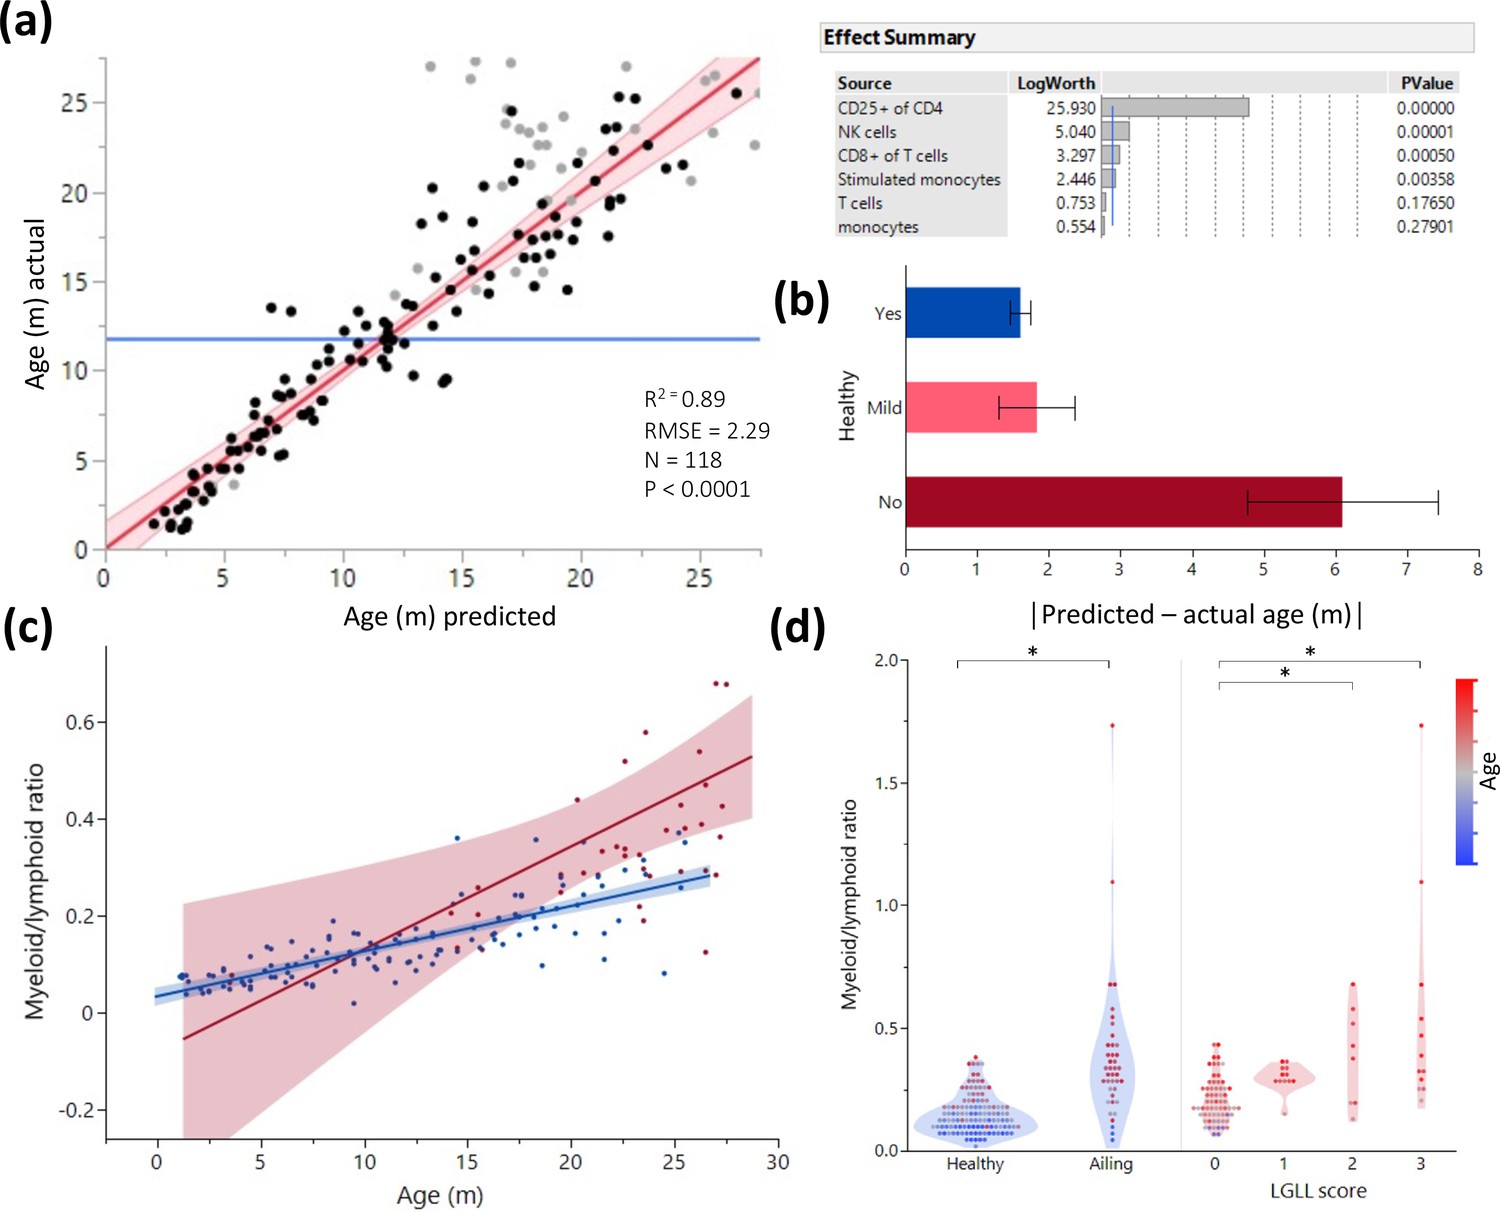
Age and illness prediction by blood leukocyte composition.
All blood cell population frequencies were used to create a standard least square model of age prediction. Variables that did not contribute to the model were removed in a backstep fashion. (a) Predicted age vs. actual age, the red line indicating the mean and fit. Animals excluded due to illness are depicted in light gray. The effect summary for the variables used is depicted in the right panel (ffect Summary) with the Logworth cutoff depicted by a blue line. (b) Residual age (i.e. the difference between actual age and predicted age) plotted as absolute mean values against assessment of health as determined by necropsy. Yes = no health issues; Mild = mild health problems (e.g. minor foot lesions); No = clear health issues found during necropsy (Source data 1). (c) The correlation between myeloid/lymphoid ratio and age in healthy (blue) and ill (red) animals. (d) Myeloid/lymphoid ratio in the peripheral blood plotted against health status (left panel) and large granular lymphocytic leukemia (LGLL) pathology score as detected in the liver and spleen. Each dot represents a single rat. Dot color denotes age.
Figure 3—figure supplement 1
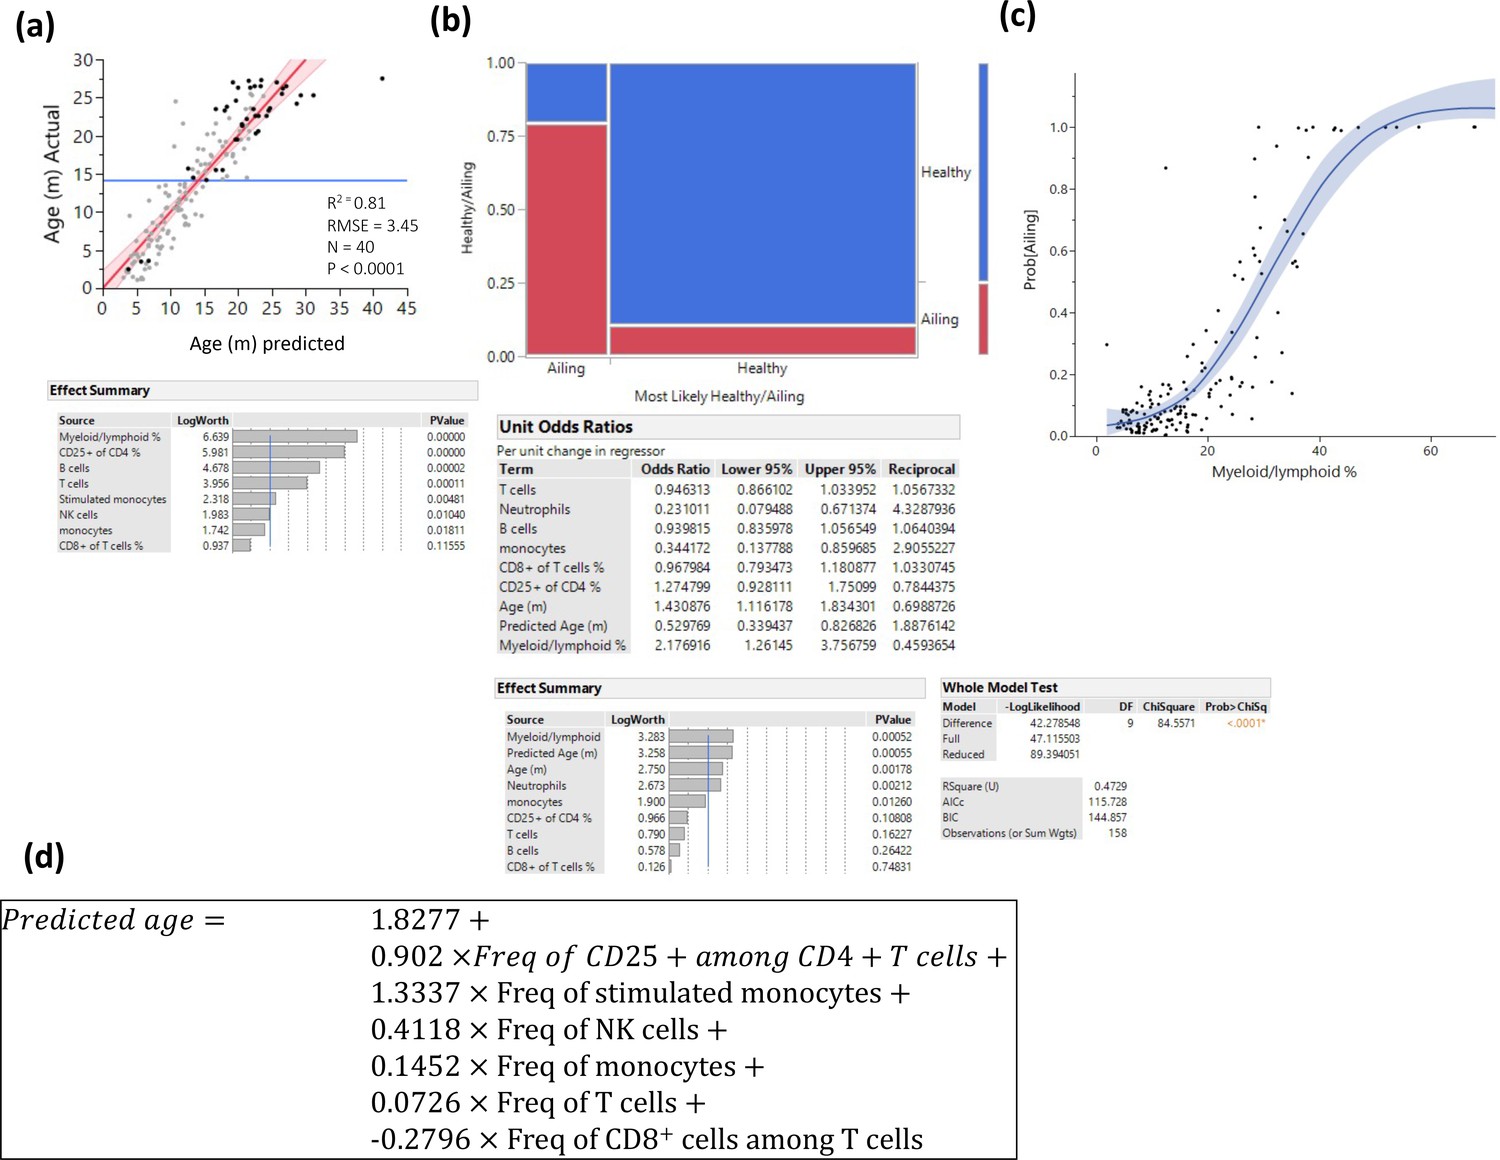
Prediction of pathology.
Several methods were used to identify myeloid/lymphoid ratio as a strong predictor of pathology. (a) Prediction of age only among animals with any kind of pathology by least square method. Statistics are depicted, and the variable contribution is depicted in the lower panel. (b) Visualization of a nominal regression model to predict pathology, the X-axis is divided into animals that were predicted to be healthy/ailing, and the proportions of actual health status are denoted in blue (healthy) and red (ill). The lower panels denote the nominal regression model statistics and parameter contributions and odd ratios. (c) Probability of being ill is plotted as a function of myeloid/lymphoid ratio (line denotes a spline regression with the colored area denoting the fit). (d) Prediction formula used to predict age based on a least square model constructed from healthy animals.
Figure 3—figure supplement 2
Fresh vs fixed samples.
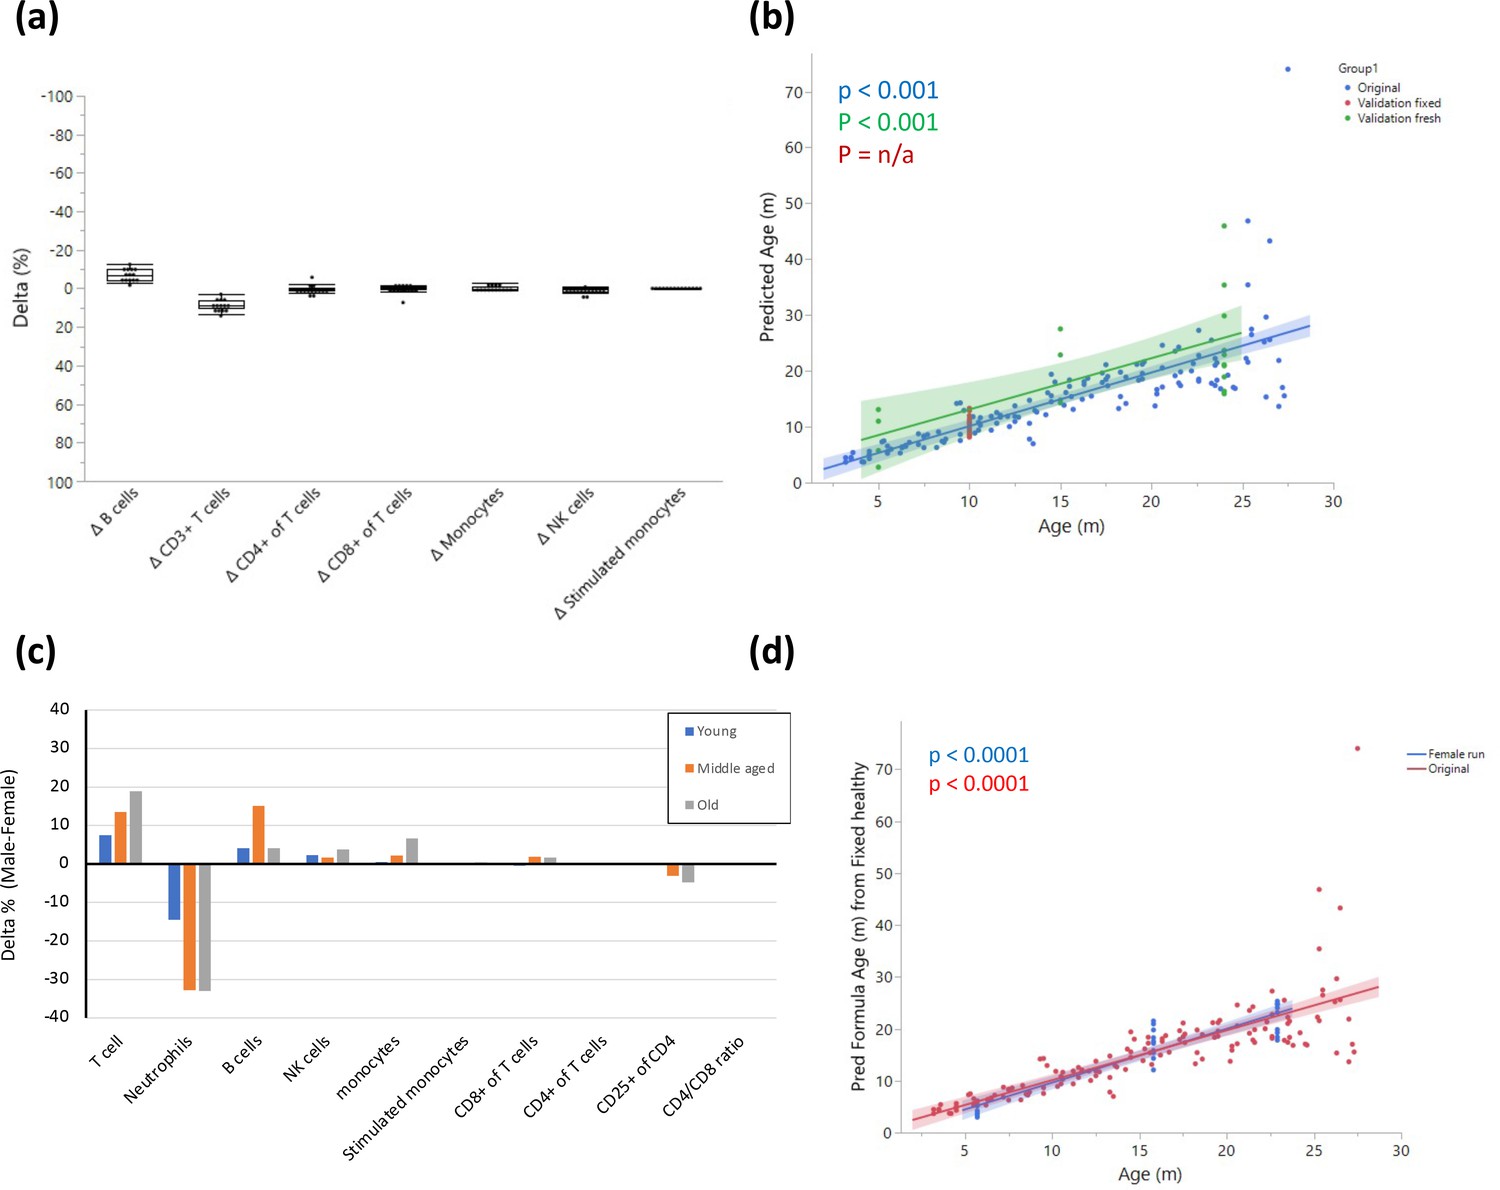
(a) Blood from the same rats (10 months old) was divided and stained after fixation and on fresh live cells. The cells were analyzed by flow cytometry, and the delta for each parameter was calculated as Fresh value – Fixed value. Each dot represents the delta for the given parameter in the same rat, and the box indicates the mean and quantiles. n = 14. (b) Validation of model on two independent datasets. The graph shows fitting of the model on the original dataset (blue); a single-age validation set of 14 adult (10 months) rats where samples were fixed prior to analysis (red); a validation set from 5 young (5 months), 5 middle-aged (15 months), and 11 old (24 months) rats that was analyzed without fixation (green). (c) Blood from 5 young (5 months), 5 middle-aged (15 months), and 5 old (23 months) female rats was collected and stained as in (a). The graph shows the delta (male-female) in average population frequencies between the indicated females and the males with corresponding age. (d) Fitting of the female validation data on the model constructed as in (b).
Figure 4 with 1 supplement
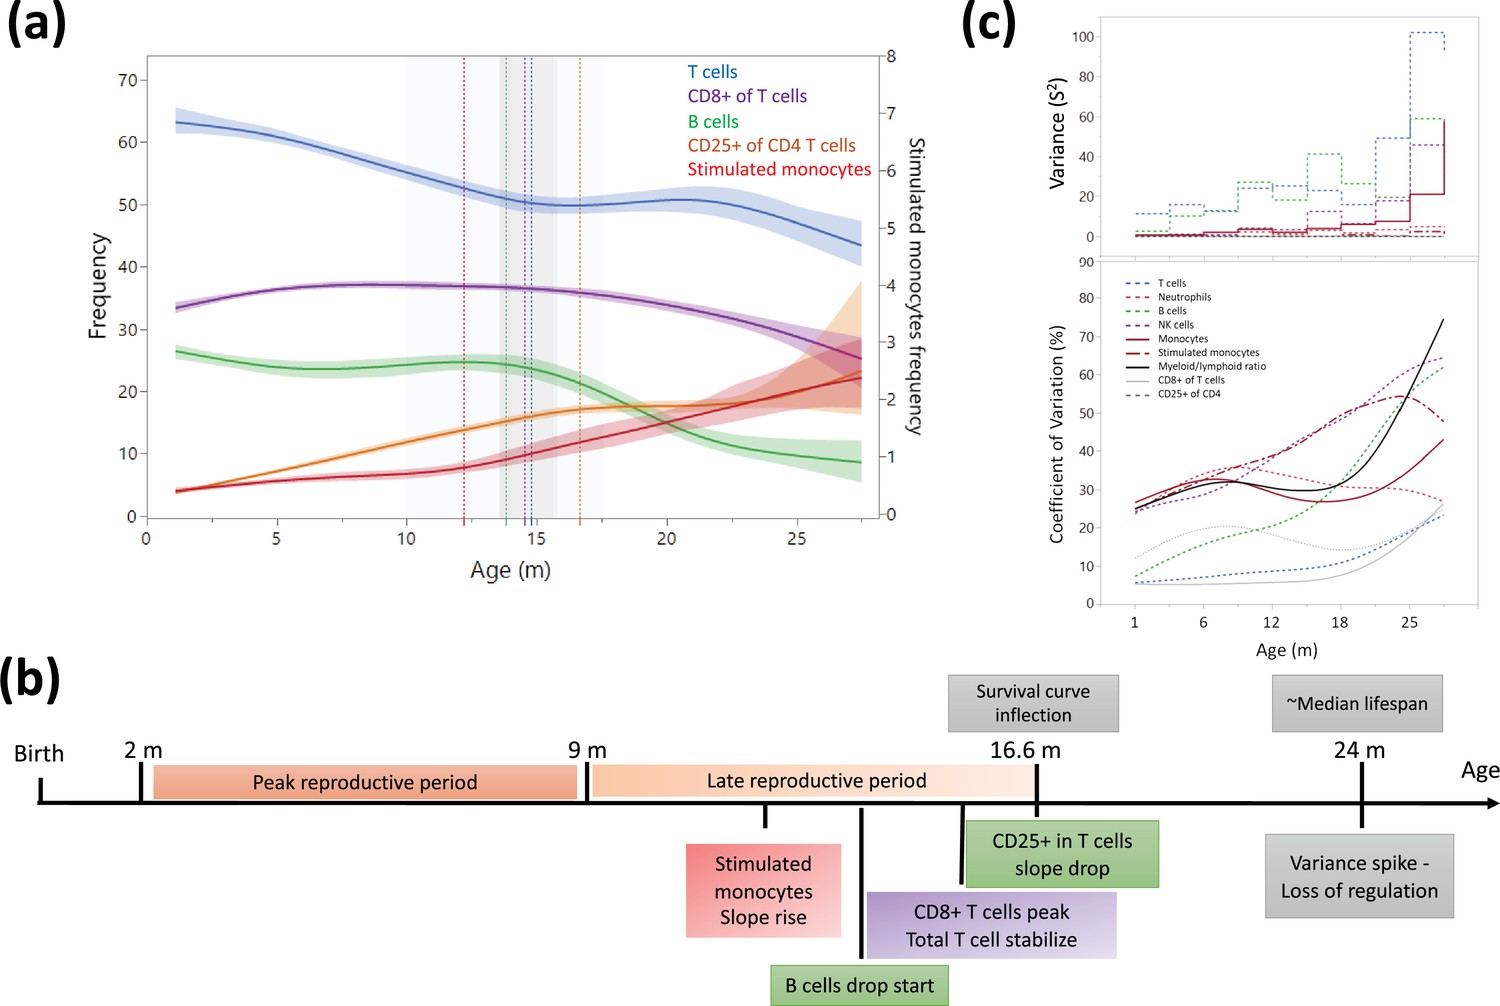
Dynamics of leukocyte frequencies during aging.
(a) Aging trends of variables with inflection points depicted by a cubic spline regression (λ = 0.521). Shaded colored areas indicate the fit. Inflection/breakpoints are depicted as dotted vertical lines with SE(Standard error) in shaded gray. (b) Summary of leukocyte critical aging points (color coded) in relation to reproductive capacity (orange) and survival curve points (gray) (Turturro et al., 1999). (c) Variance (S2) and coefficient of variation for each parameter as a function of age (in a sliding window of 3 months).
Figure 4—figure supplement 1
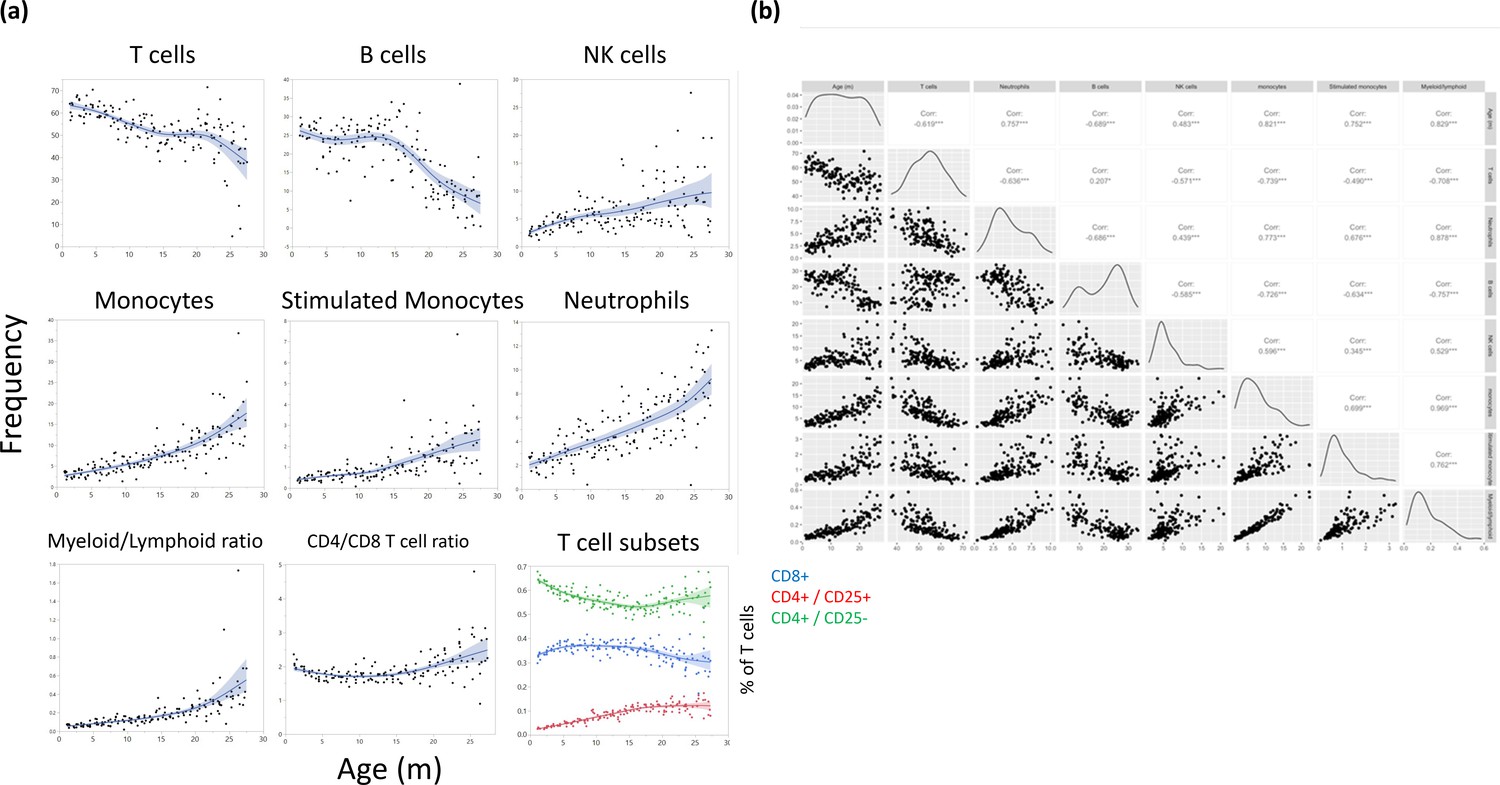
Major leukocyte population frequencies as a function of age.
(a) Each dot represents a reading from a single rat, and the cell type is indicated for each plot. The line represents a spline regression, and the colored area represents the fit. (b) Bivariate correlation matrix. The diagonal indicates the univariate distribution for the given variable.
Figure 5 with 1 supplement
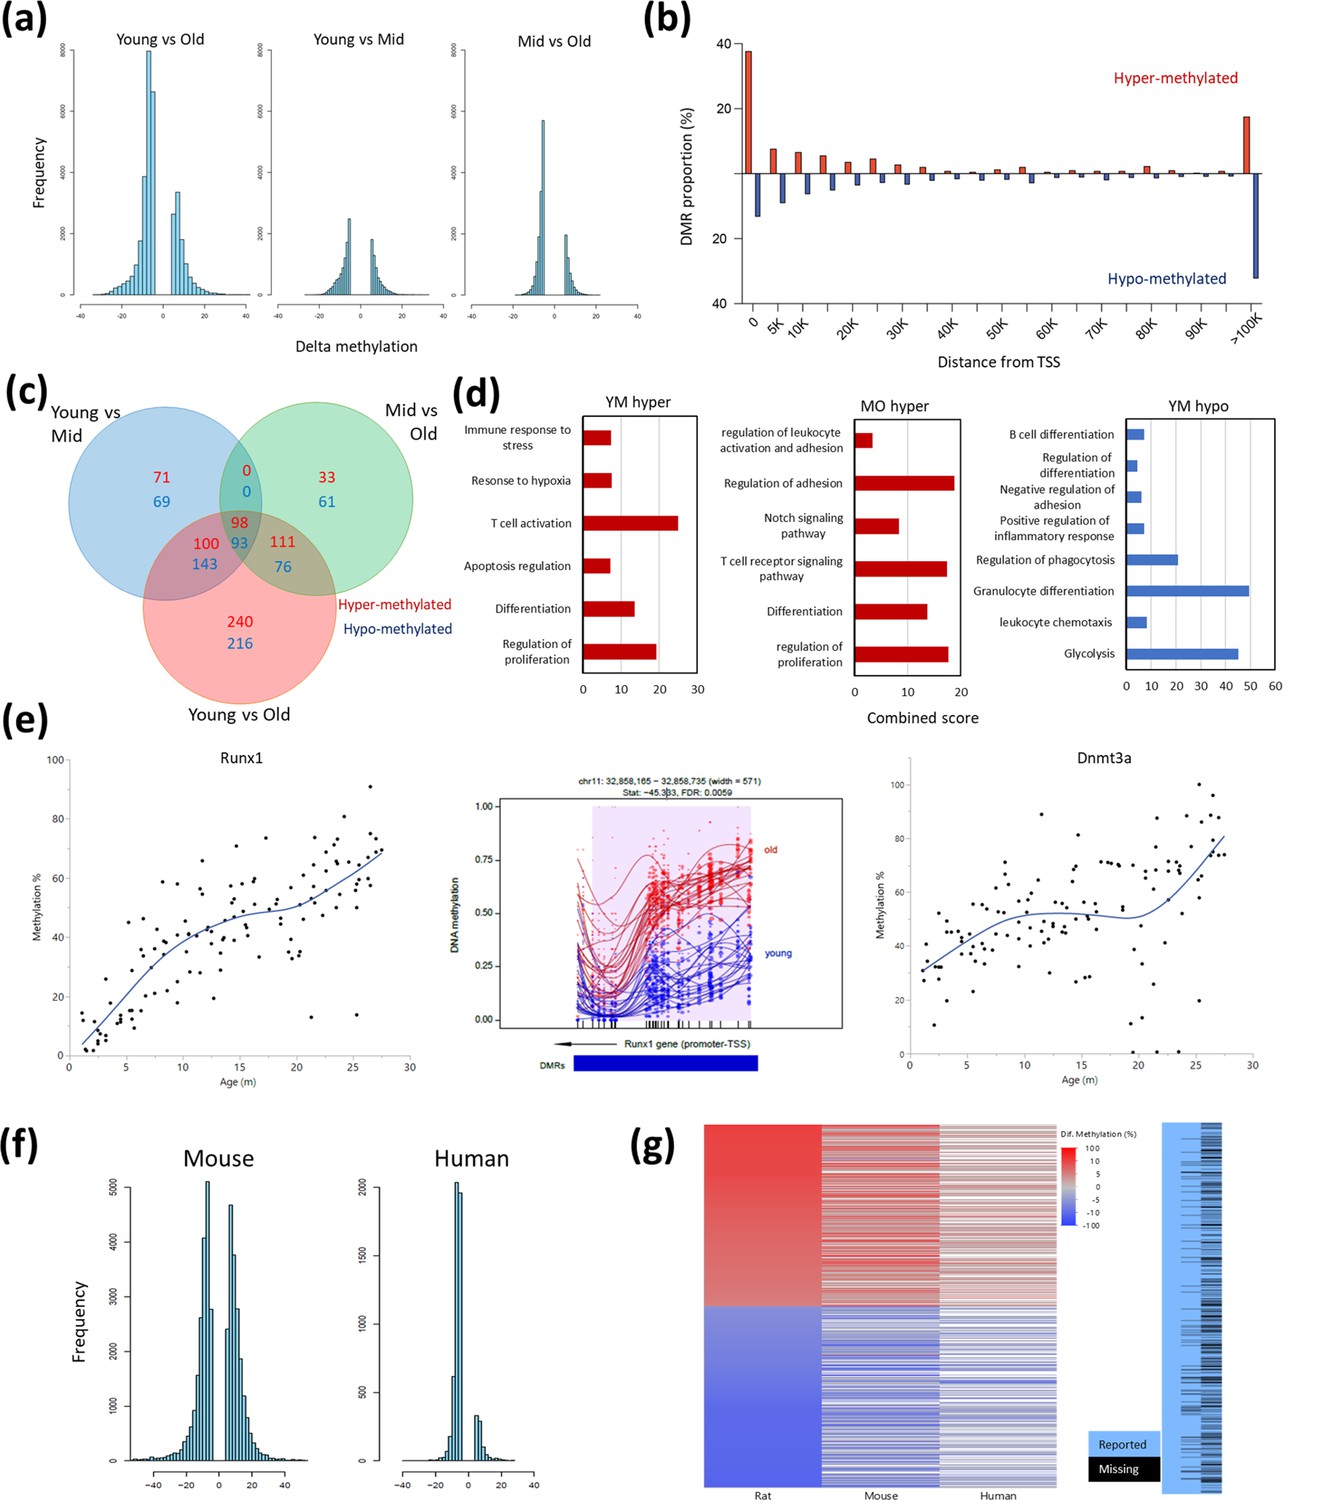
Differentially methylated regions (DMR) with rat aging.
(a) Global differential methylation histograms per age group comparison. A cutoff of 5% methylation difference was used. (b) Proportion of hypermethylated and hypomethylated regions (DMR) compared to distance from the closest transcription start site (TSS). (c) Venn diagram for the number of DMR within 20 k bp distance of the nearest TSS based on age group comparisons. A cutoff of false discovery rate (FDR) <0.05, >5% CpG mean change, and at least 3 CpG differential DMR site per block was used. Hypermethylated and hypomethylated changes are indicated by the noted colors. (d) Summary of gene set enrichment analysis for DMRs in proximity of TSSs (<20 k bp). Analysis was performed for three age groups: young (3–8 months), middle-aged (13–17 months), and old (22–27 months). Combined score was calculated as −log10(FDR) × fold enrichment. YM - young vs. middle-aged; MO - middle-aged vs. old; YO - young vs. old. The list of hypomethylated DMRs for the MO comparison had statistically significant enrichments. For a full enrichment analysis see Table S4. (e) Individual methylation levels of regions near the Runx1 and Dnmt3a genes. Left panel - Runx1; middle panel - methylation map in the Runx1 TSS; right panel - Dnmt3a. (f) Global differential methylation histograms of mouse (Sziráki et al., 2018) and human (Hannum et al., 2013). A cutoff of 5% methylation difference was used. (g) Heatmap depicting concordance of DMRs near orthologous gene sites between rat (left), mouse (center), and human (right) datasets. Only genes identified as differentially methylated in old rats are shown, the rightmost panel depicts the coverage for each dataset, where missing data is black.
Figure 5—figure supplement 1
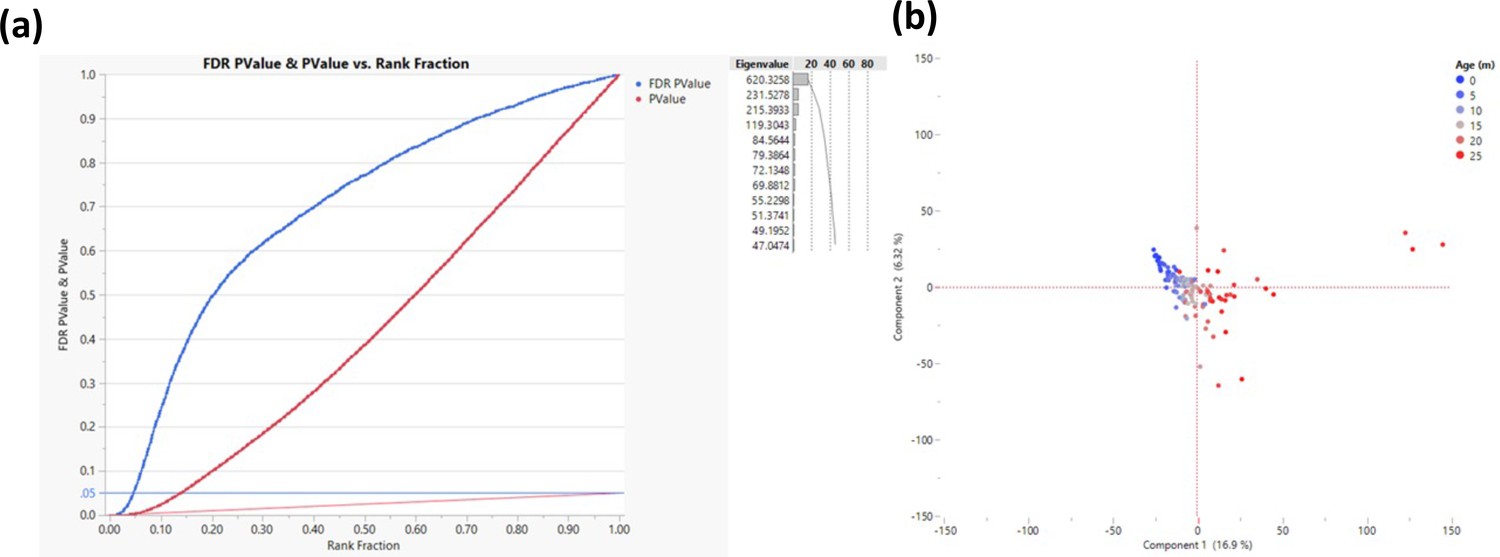
Response screening to determine transcription start sites that change their methylation as a function of age.
The response screening function (JMP - https://www.jmp.com) performs multiple correlation analyses and corrects for false discovery rate (FDR). The analysis was performed on 200 bp bins that are within 500 bp of transcription start site (TSS). (a) Correlation p-values are depicted in red and the FDR in blue where each TSS is a single dot. The horizontal blue line indicates the cutoff (FDR p-value <0.05, measured in >50 rats, n = 2311). Only sites that were successfully sequenced in >50 animals were included (n = 58,000). (b) Principal component analysis for all rats based on the genes that passed the cutoff; each dot represents a rat, and the color represents age as indicated.
Figure 6 with 1 supplement
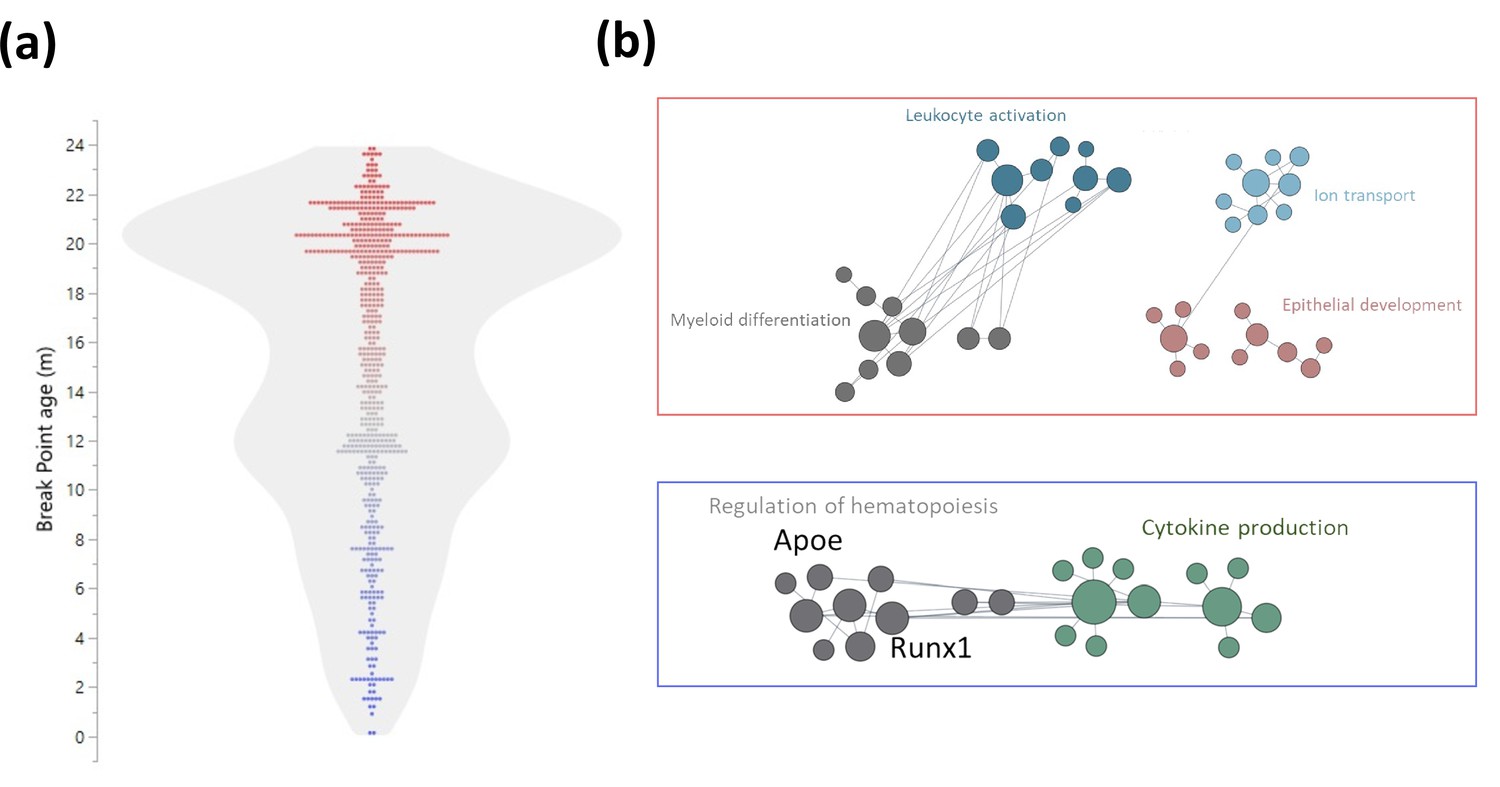
Early and late life methylation breakpoints.
(a) Distribution of breakpoints by age. Each dot represents the breakpoint of a single gene transcription start site; color scales by age from young (blue) to old (red). Contour violin plot of the distribution is displayed in gray. (b) Functional module networks of the genes with breakpoints before (bottom - blue) and after (top - red) 15 months of age. Each dot represents a single gene with size corresponding to its connectivity in the network. The lines indicate interactions (edges). The networks were built for blood tissue, with human orthologs as input. The interaction network is built using the closest gene neighbors and then clustered based on enrichment in GO(Gene Ontology) categories. Networks were generated using HumanBase (https://hb.flatironinstitute.org).
Figure 6—figure supplement 1
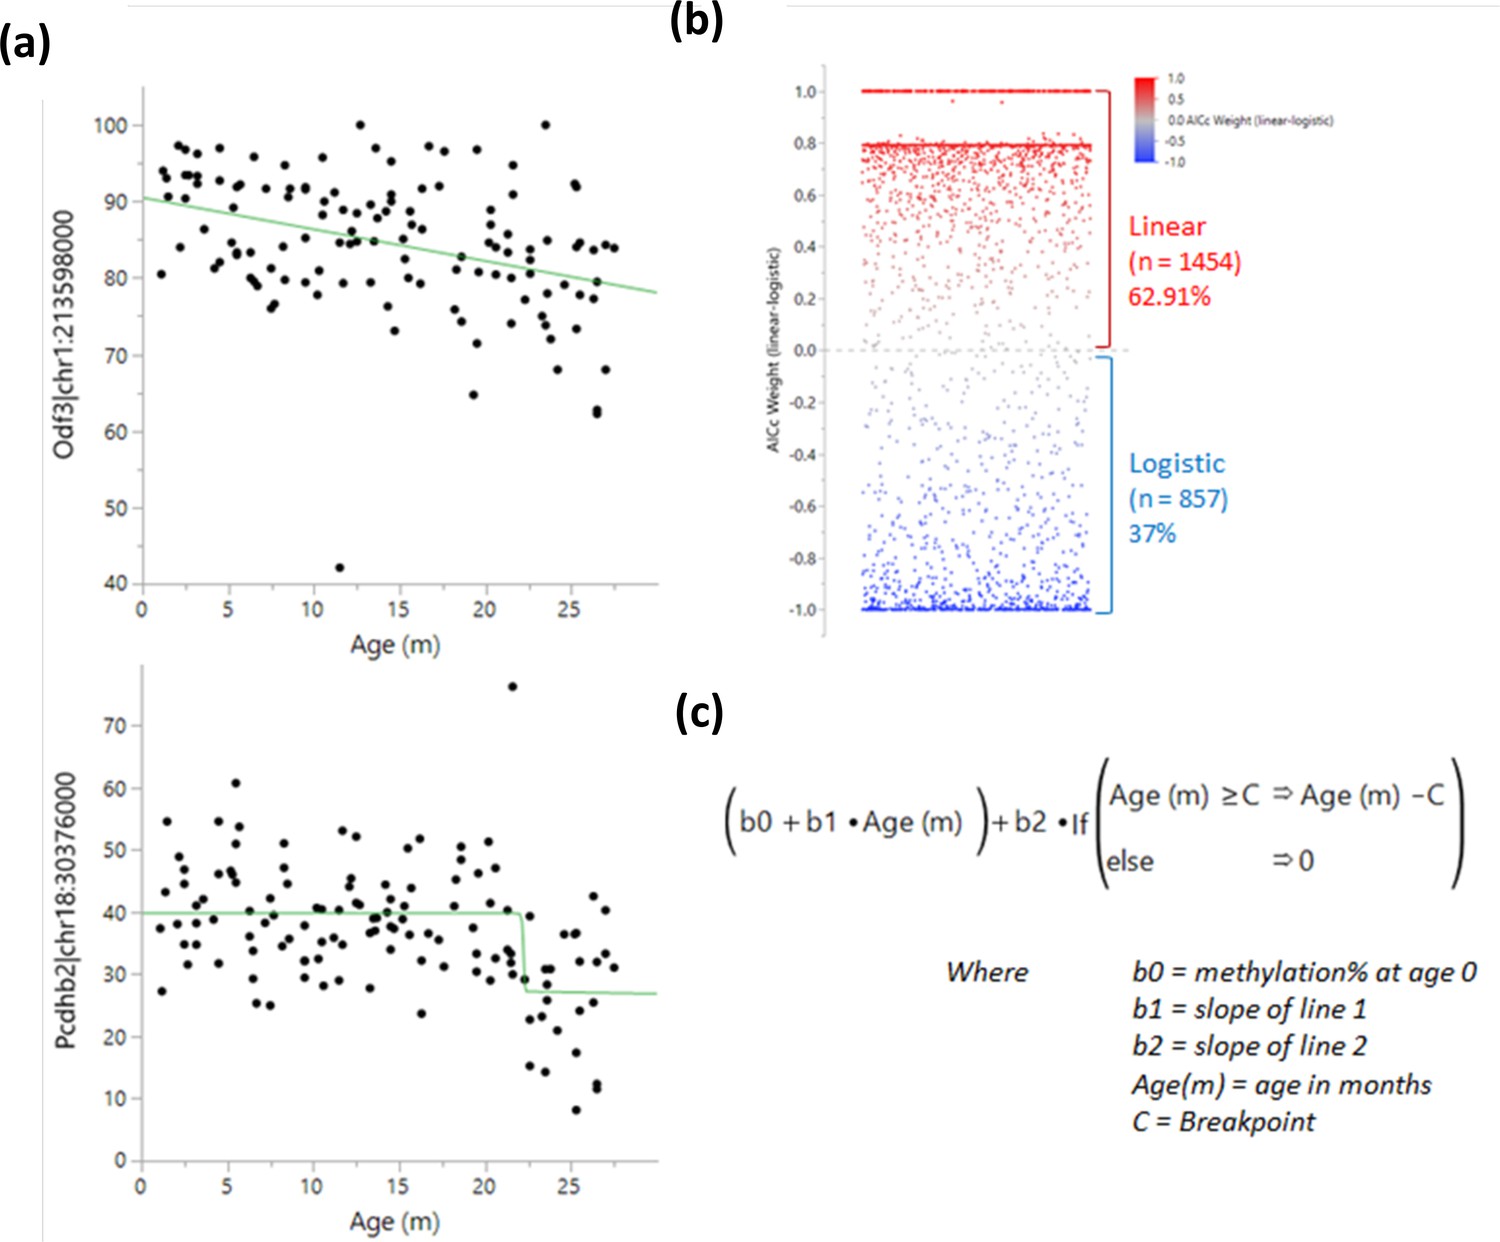
Determination of methylation changes ‘switch’ points.
A logistic 4 P and linear regression were both tested for each bin near a transcription start site, and the results were compared using the Bayesian Information Criterion and Corrected Akaike Information Criterion (AICc). (a) Example of a linear (top) and a logistic (bottom) regression. (b) Comparison of weighted AICc delta (linear-logistic). Each dot represents a site. Values over 0 (red) indicate a linear regression fits better than a logistic one and vice versa for values under 0 (blue). (c) Breakpoint analysis formula used to determine the optimal switch point.
Author response image 1
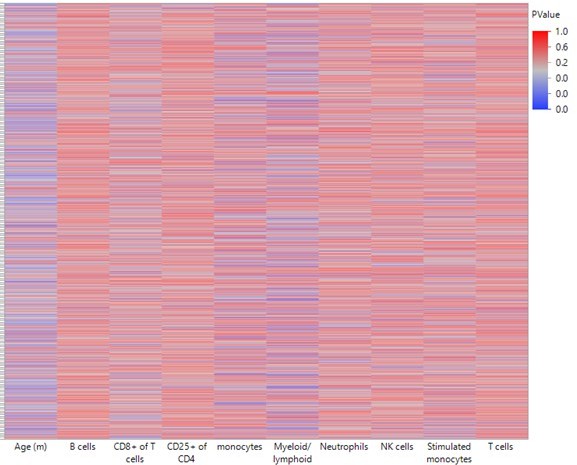
Heatmap summarizing the impact of each leukocyte population on predicting DNA methylation by least-square model.
A least square model was constructed for each DMR of the 2311 top hits using age and leukocyte frequencies as predictive variables. Each row in the heatmap indicates a single DMR. Each column indicates the parameter as indicated. The color corresponds to the P value where blue is < 0.05.
Author response image 2
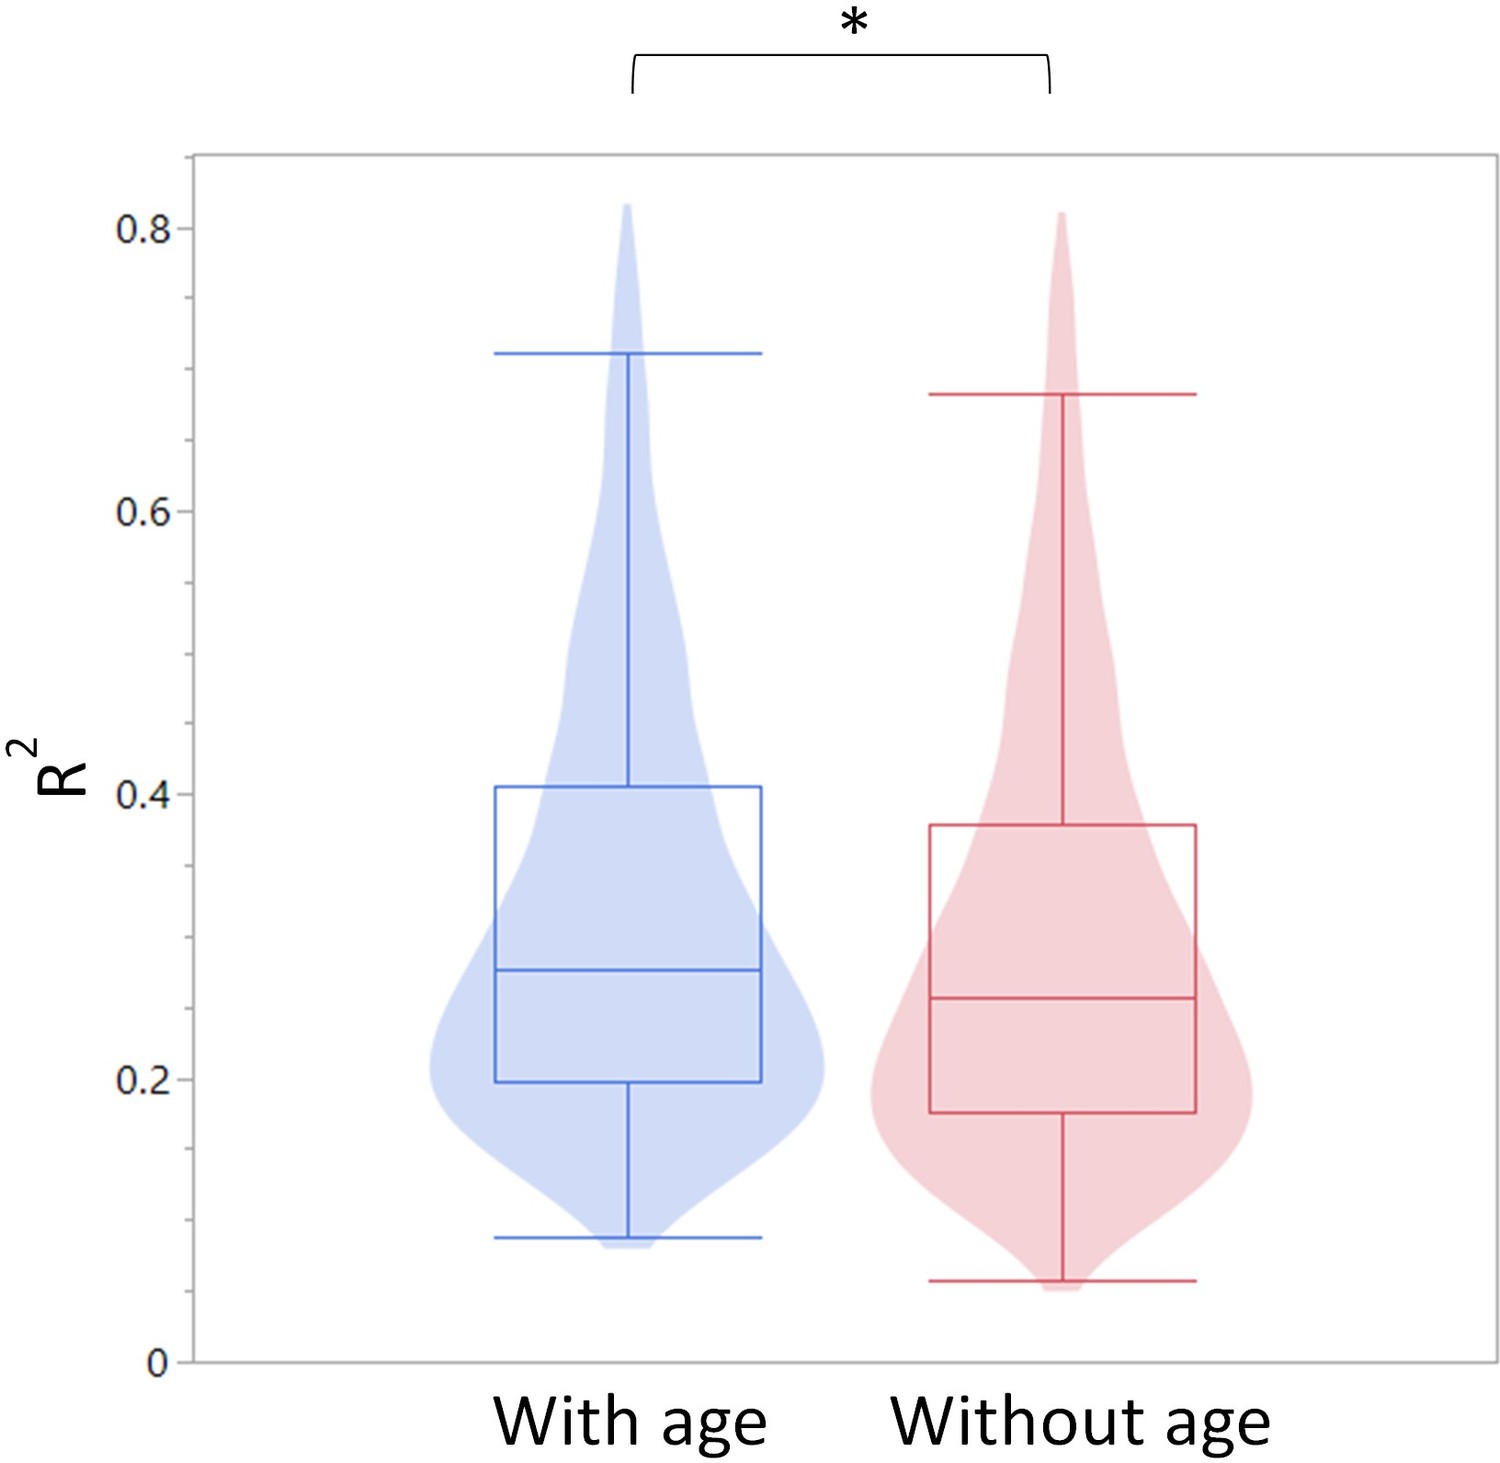
Summary of R-square values for the models constructed with and without age as a predictor.
The R-square values are summarized as a violin plot overlayed with a box blot. Left (blue) are the R-square values with age and right (red) without age.
Tables
Key resources table
| Reagent type (species) or resource | Designation | Source or reference | Identifiers | Additional information |
|---|---|---|---|---|
| Strain, strain background (Rattus Norvegicus) | Fischer 344 male and female (F344-cdf) | NIA aging colony | F344-cdf | Housed at the Charles River Laboratories (Frederick, MD) |
| Antibody | (Mouse monoclonal) Anti-rat CD3-FITC, Clone 1F4 | BioLegend | Cat#201,403 | (1:200) |
| Antibody | (Mouse monoclonal) anti-rat CD25-PE, clone OX-39 | BioLegend | Cat#202,105 | (1:200) |
| Antibody | (Mouse monoclonal) anti-rat CD8a-PerCP, clone OX-8 | BioLegend | Cat#201,712 | (1:200) |
| Antibody | (Mouse monoclonal) anti-rat CD11b/c-PE-Cy7, clone OX-42 | BioLegend | Cat#201,818 | (1:200) |
| Antibody | (Mouse monoclonal) anti-rat CD4-APC-Cy7, clone W3/25 | BioLegend | Cat#201,518 | (1:200) |
| Antibody | (Mouse monoclonal) anti-rat RT1B- AF647, clone OX-6 | BD Biosciences | Cat#562,223 | (1:200) |
| Antibody | (Mouse monoclonal) anti-rat CD45RA-BV421, clone OX-33 | BD Biosciences | Cat#740,043 | (1:200) |
| Antibody | (Mouse monoclonal) Anti-rat CD45-BV605, clone OX-1 | BD Biosciences | Cat#740,515 | (1:200) |
| commercial assay or kit | IMMUNOPREP Reagent System | Beckman Coulter | Cat# 7546999 | Compatible with the COULTER TQ-Prep workstation |
| software, algorithm | Trim Galore | Babraham Bioinformatics, Krueger et al., 2021 | https://github.com/FelixKrueger/TrimGalore | |
| software, algorithm | CutAdapt | National Bioinformatics Infrastructure Sweden, Martin, 2022 | https://github.com/marcelm/cutadapt | |
| software, algorithm | Bismark | Babraham Bioinformatics | https://www.bioinformatics.babraham.ac.uk/projects/bismark/ | |
| software, algorithm | MethylKit | Bioconductor | https://www.bioconductor.org/packages/release/bioc/html/methylKit.html | |
| software, algorithm | DMRseq | Bioconductor | https://www.bioconductor.org/packages/release/bioc/html/dmrseq.html | |
| software, algorithm | ClusterProfiler | Bioconductor | https://bioconductor.org/packages/release/bioc/html/clusterProfiler.html | |
| software, algorithm | Homer package | UCSD | http://homer.ucsd.edu/homer/ | |
| software, algorithm | JMP | JMP-SAS | Ver16 | https://www.jmp.com |
| software, algorithm | FlowJo | BD Life Sciences | Ver10.8 | https://www.flowjo.com/ |
| software, algorithm | Cytobank | Beckman-Coulter | https://www.beckman.com/flow-cytometry/software/cytobank-premium |
Additional files
-
Transparent reporting form
- https://cdn.elifesciences.org/articles/76808/elife-76808-transrepform1-v2.docx
-
Source data 1
Animal pathology report.
- https://cdn.elifesciences.org/articles/76808/elife-76808-data1-v2.xlsx
-
Source data 2
List of rats and detailed peripheral blood leukocyte populations.
- https://cdn.elifesciences.org/articles/76808/elife-76808-data2-v2.xlsx
-
Source data 3
List of differentially methylated regions (DMRs) that are located <20 kb from a transcription start site (TSS).
- https://cdn.elifesciences.org/articles/76808/elife-76808-data3-v2.xlsx
-
Source data 4
Gene Ontology enrichment analysis report.
- https://cdn.elifesciences.org/articles/76808/elife-76808-data4-v2.xlsx
Download links
A two-part list of links to download the article, or parts of the article, in various formats.
Downloads (link to download the article as PDF)
Open citations (links to open the citations from this article in various online reference manager services)
Cite this article (links to download the citations from this article in formats compatible with various reference manager tools)
Male rat leukocyte population dynamics predict a window for intervention in aging
eLife 11:e76808.
https://doi.org/10.7554/eLife.76808


