Stereotyped behavioral maturation and rhythmic quiescence in C. elegans embryos
- Department of Molecular Biology, Massachusetts General Hospital, United States
- Department of Neurobiology, Harvard Medical School, United States
- National Institute of Biomedical Imaging and Bioengineering, National Institutes of Health, United States
- Department of Mathematics, University of Maryland, United States
- Fellows Program, Marine Biological Laboratory, United States
- Janelia Research Campus, Howard Hughes Medical Institute, United States
Figures
Figure 1 with 2 supplements
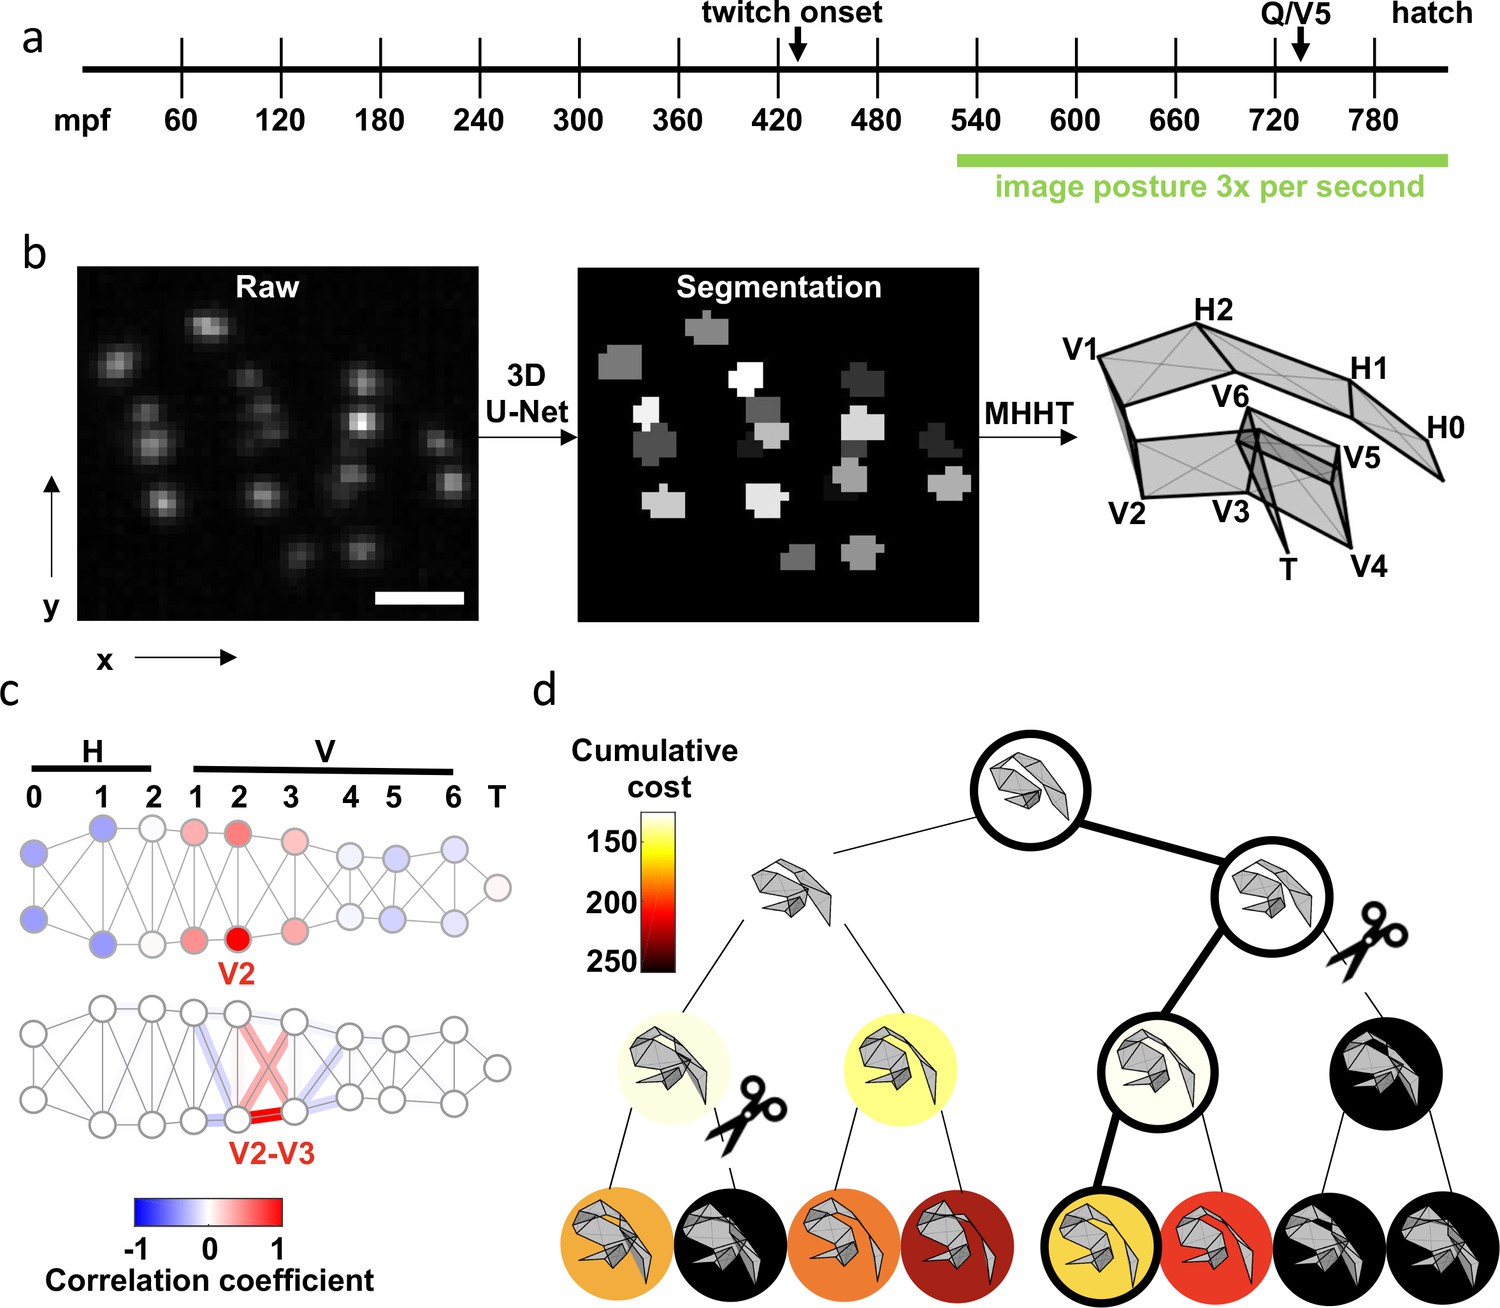
Tracking seams cells with Multiple Hypothesis Hypergraph Tracking (MHHT).
(a) A timeline of embryo development is shown with the imaging window highlighted. mpf: minutes post fertilization. (b) The scheme utilized for seam cell identification is shown. Left: A representative image of hypodermal seam cell nuclei (XY maximum intensity projection). Scale bar, 10 . Middle: Output of the 3D U-Net segmentation. Right: Seam cell identifications made by MHHT. See Figure 1—video 1. (c) To illustrate the interdependence of seam cell movement, correlation in X-axis (labelled in b) motion of the V2 seam cell with all other seam cells is shown (top). To illustrate local constraints on the distance between neighboring seam cells, correlation of V2-V3 distance with indicated edge lengths is shown (bottom). See Figure 1—figure supplement 1 for full correlation matrices. (d) A posture assignment search tree with width K=2 and depth N=3. Physically impossible body contortions (self-intersections) are pruned (scissors). The path accruing the least cost is highlighted (outlined circles).
Figure 1—figure supplement 1
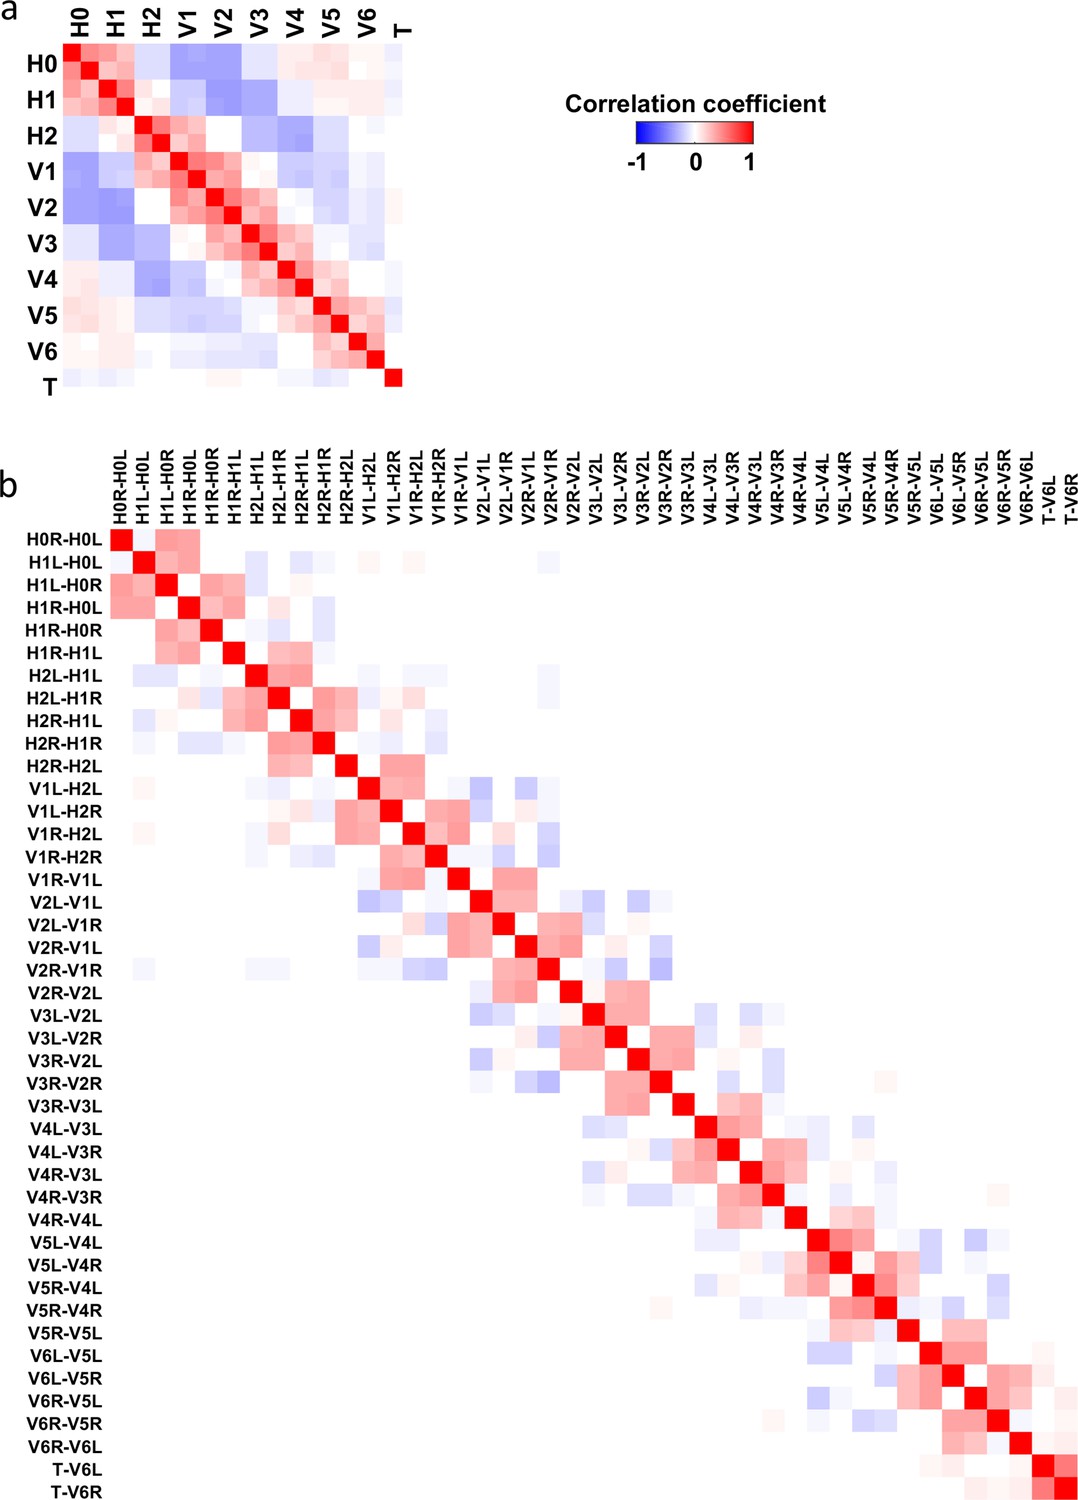
Correlations used by MHHT.
(a) Correlation matrix for seam cell displacement along the X-axis of the image (Figure 1b). (b) Correlation matrix for changes in edge length.
Figure 1—video 1
An embryo at 540 mpf expressing GFP in hypodermal seam cell nuclei.
XY maximum intensity projection (left) with segmented (center) and identified seam cell nuclei (right). Original data acquired at 3 Hz.
Figure 2
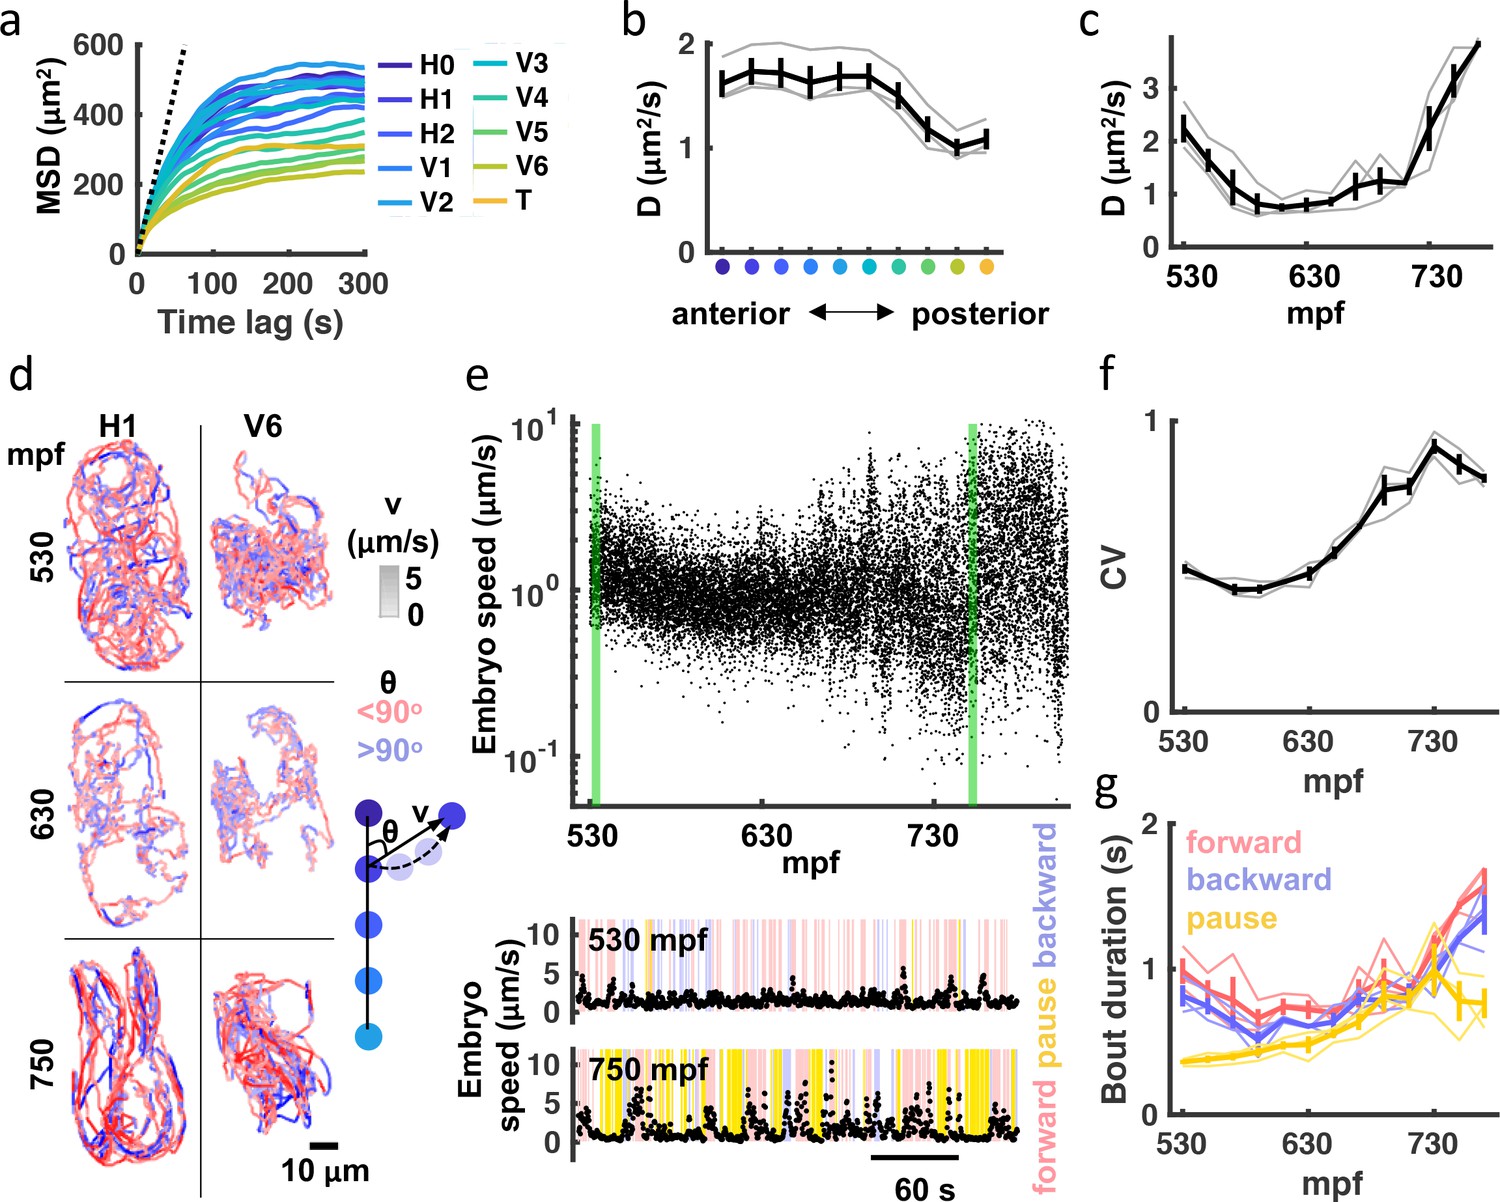
Transition to punctuated and directed movement ahead of hatching.
(a) Mean square displacement (MSD) for each seam cell nucleus is plotted. Dotted line indicates predicted unconfined Brownian motion for the H1 seam cell. (b) Mean diffusion coefficient (D) over the entire recording is plotted for each seam cell pair. X-axis label colored as in (a). Individual embryo values (grey) and mean +/-SEM (black) are shown. (c) Diffusion coefficients for all seam cells were computed over 20 minute bins. Individual embryo values (grey) and mean +/-SEM (black) are shown. (d) 20 minute trajectories are shown for the H1 and V6 seam cell at the indicated ages (left). Cell velocity (‘v’) is indicated by the shade of tracks (see velocity LUT). Direction of motion along the anteroposterior axis (‘θ’) is indicated by pink and blue. A schematic illustrating how ‘v’ and ‘θ’ are defined is shown (right). (e) Embryo speed is plotted from 530 to 808 mpf. Forward, reverse, and pausing bouts are highlighted in 5-min embryo speed traces (bottom). Forward and backward movement were defined as less than 45° and greater than 135o, respectively. Pauses were defined as speed< 0.5 μm/s. (f) Coefficient of variation in embryo speeds for 20-min bins are plotted. Individual embryo values (gray) and mean +/-SEM (black) are shown. (g) Mean duration of forward, backward, and pausing bouts in 20-min bins are plotted. Individual embryo values (faint traces) and mean +/-SEM (bold traces) are shown.
Figure 3 with 2 supplements
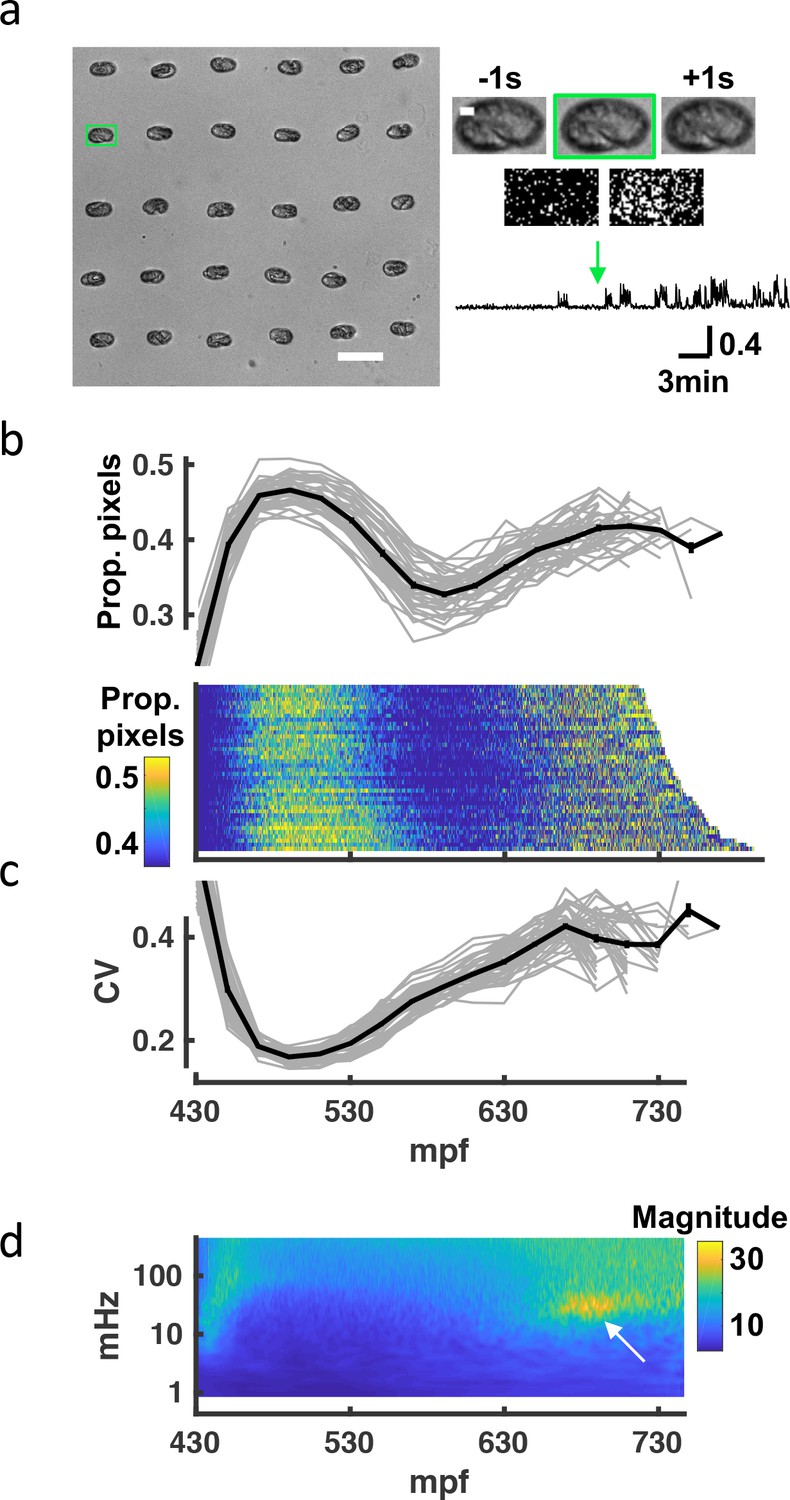
A brightfield motility assay reveals a stereotyped pattern of embryonic behavior maturation.
To independently assess embryo behavior, we developed a brightfield motility assay. Motion of each embryo is estimated by the fraction of pixels changing intensity between frames. The ‘twitch profiles’ only report crude motion and are unable to distinguish more detailed aspects of behavior (e.g., direction or posture). (a) Embryos arrayed for a brightfield assay are shown (left). Scale bar, 100 μm. Higher magnification views of the highlighted embryo (scale bar, 10μm) over three consecutive frames and frame subtraction images are shown (right). A representative twitch trace illustrating proportion of pixels changing at twitch onset (≈430 mpf) is shown (bottom). Figure 3—video 1 shows a representative brightfield recording. (b) Top: Average pixel changes aligned at twitch onset are plotted (in 20-min bins). Individual embryo values (gray) and mean +/-SEM (black) are shown for n=40 embryos. Bottom: Brightfield twitch profile, with each line corresponding to a single embryo. Proportion of pixels changing intensity (smoothed over 10 s) is indicated by the color LUT. (c) Coefficient of variation of pixel changes aligned at twitch onset (in 20-min bins) are plotted. Individual embryo values (gray) and mean +/-SEM (black) are shown. (d) Mean twitching scalogram is shown. The signal in the 20–40 mHz frequency band around 670–710 mpf (arrow) represents the SWT behavior.
Figure 3—figure supplement 1

Time from twitch to SWT versus twitch to hatch for 31 brightfield recordings of wild-type embryos.
Sorted by time to hatch. SWT identified as peak relative power in the 20–40 mHz frequency band. Each dot represents an embryo, with mean +/-SEM.
Figure 3—video 1
An embryo array for the brightfield assay.
Original data acquired at 1 Hz.
Figure 4 with 2 supplements
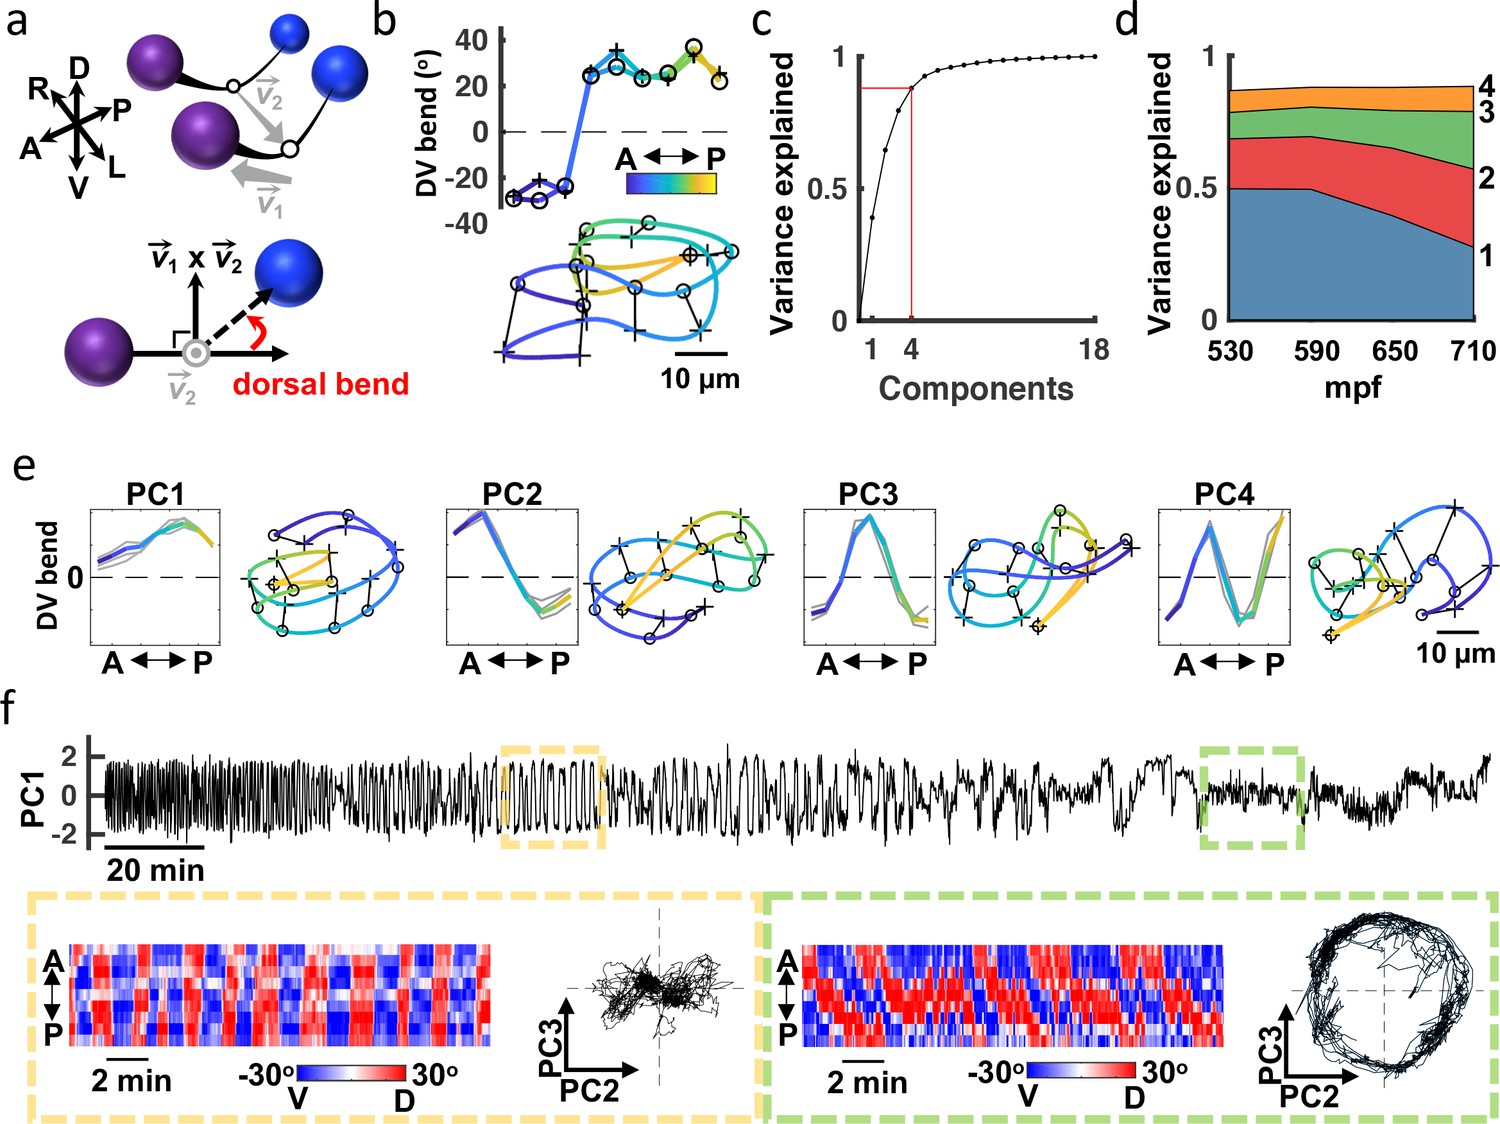
Eigen-embryos compactly describe behavioral maturation.
(a) A schematic illustrating how dorsoventral (DV) bends are defined. Top: Seam cell nuclei on each side of the body are fit with a natural cubic spline (black line). Vector links the midpoints between adjacent seam cell nuclei (open circles). Bottom: View looking down 2 to highlight a DV bend angle on one side of the body (red arrow). (b) DV bend angles between all adjacent seam cells are used to define an embryo’s posture. DV bends along the left (+) and right (o) sides of an embryo (top) are plotted (top). The posture model for this embryo is shown (bottom). Position along the anteroposterior axis is indicated by the color gradient. (c) The fraction of the total variance captured by reconstructing postures using 1 through all 18 principal components is plotted. (d) Fraction of the total variance captured by the first 4 principal components is plotted as a function of embryo age (mpf). (e) Eigen-embryos (i.e. eigenvectors for the first 4 PCs) derived from the three individual embryos in grey and from pooled datasets in color (left). Sample postures drawn from the 95th percentile of amplitudes are shown for the indicated PCs (right). See Figure 4—figure supplement 1 for supplemental embryos. (f) A representative PC1 amplitude trace is shown for an embryo from 530 mpf until hatch (top). DV bend profiles in two 20 min windows are compared (bottom). At 610 mpf (yellow), motion is dominated by flipping between all dorsal and all ventral body bends. At 750 mpf (green), motion is dominated by dorsoventral bend propagation along the A/P axis. The corresponding PC2 and PC3 amplitudes for these time windows are shown. At 750 mpf, travelling waves are captured by phase-shifted cycling of PC2 and PC3. See Figure 4—figure supplement 2 for more embryos.
Figure 4—figure supplement 1

Eigen-embryos derived from a supplemental dataset of 16 animals.
(a) Distribution of PC1 amplitudes early (blue, 530–668 mpf) versus late (red, 669–807 mpf). Seam cell identity was assigned for each embryo to match the late positive skew seen in (b). (b) Distribution of PC1 amplitudes for 16 embryos with known left and right seam cell identities. (c) Eigen-embryos, that is, eigenvectors for the first four PCs, derived from the 16 embryos with known seam cell identities.
Figure 4—figure supplement 2
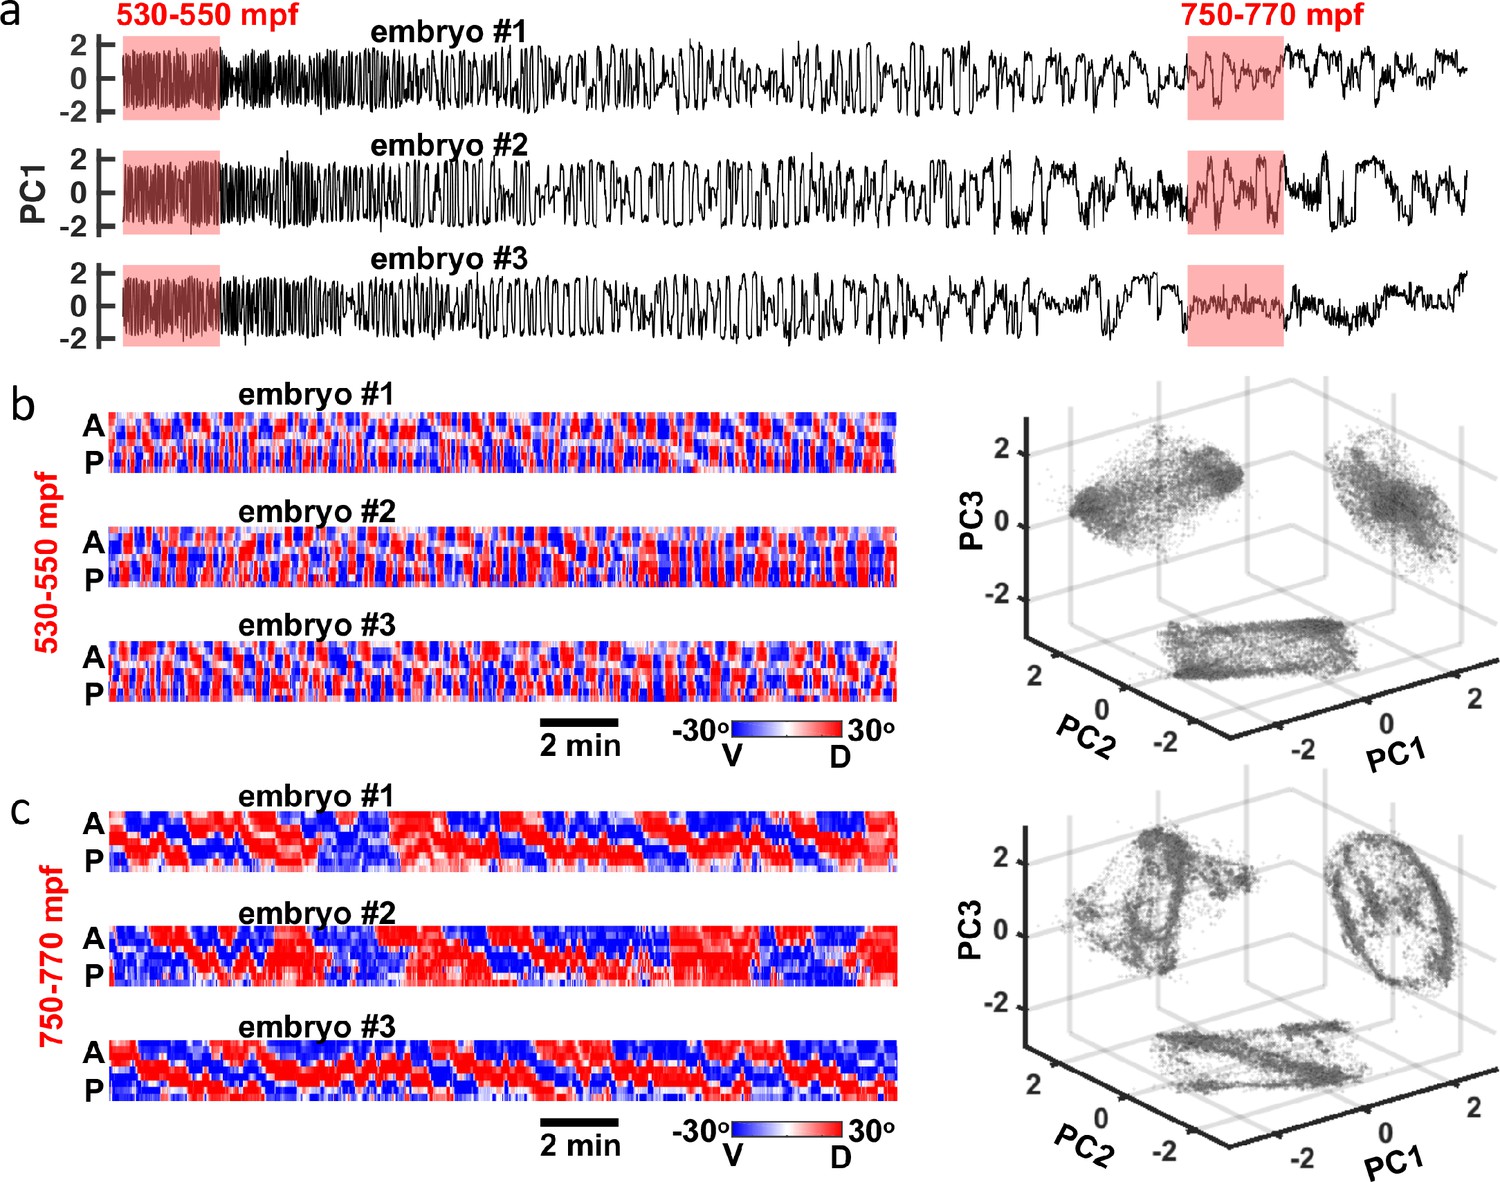
PC amplitudes and DV bends for 3 control embryos.
(a) PC1 amplitude for three embryos from 530 mpf until hatch. (b) DV bend profiles for three embryos from 530 to 550 mpf (left). Projection of these profiles onto three planes in PC space (right). (c) Same as (b) for 750–770 mpf.
Figure 5
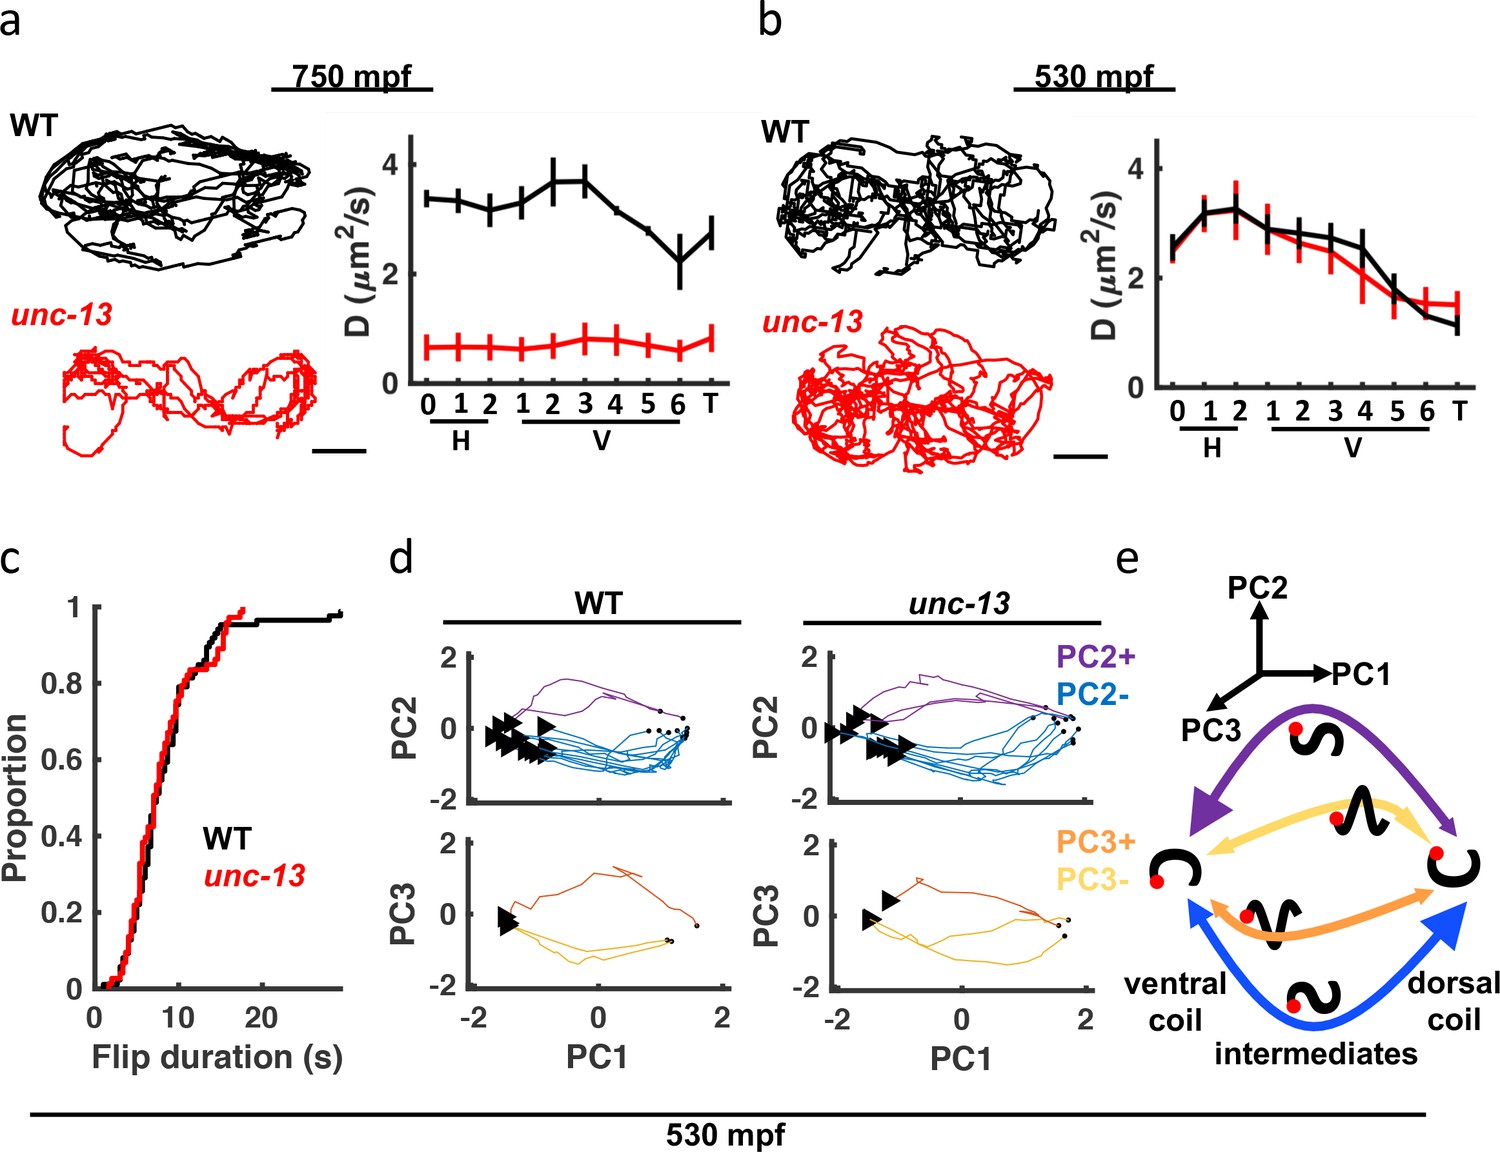
unc-13 mutants have a late-stage motility defect.
(a–b) Seam cell motions are compared in WT and unc-13 mutant embryos at 750 mpf (a) and 530 mpf (b). Representative 10 min trajectories for the H1 seam cell (left) and mean diffusion coefficients for all seam cell pairs (right; mean +/-SEM) are shown. Scale bar, 10 . Sample sizes, 750 mpf (3 WT, 3 unc-13); 530 mpf (3 WT, 2 unc-13). (c) Cumulative distribution functions are shown for duration of transitions between dorsal and ventral coils (i.e. flips) from 530 to 540 mpf. Flip durations observed in WT and unc-13 mutants cannot be distinguished. (d) Posture transitions during flipping were unaltered in unc-13 mutants. An embryo’s transitions through posture space during flipping is compared in WT and unc-13 mutants (530–540 mpf; only transitions executed in ≤10 s are plotted). Flips were categorized into four motifs based on the mean amplitude of PC2 and PC3 during the transition (PC2+, PC2-, PC3+, and PC3-). The start (arrowhead) and end (dot) of each flip is indicated. (e) Summary of coiling transition trajectories in posture space at 530–540 mpf, with arrowhead sizes indicating the frequency of occurrence. Color-code same as in (d). Schematized worms (black squiggles) are shown with ventral down and head (red dot) to the left.
Figure 6 with 1 supplement
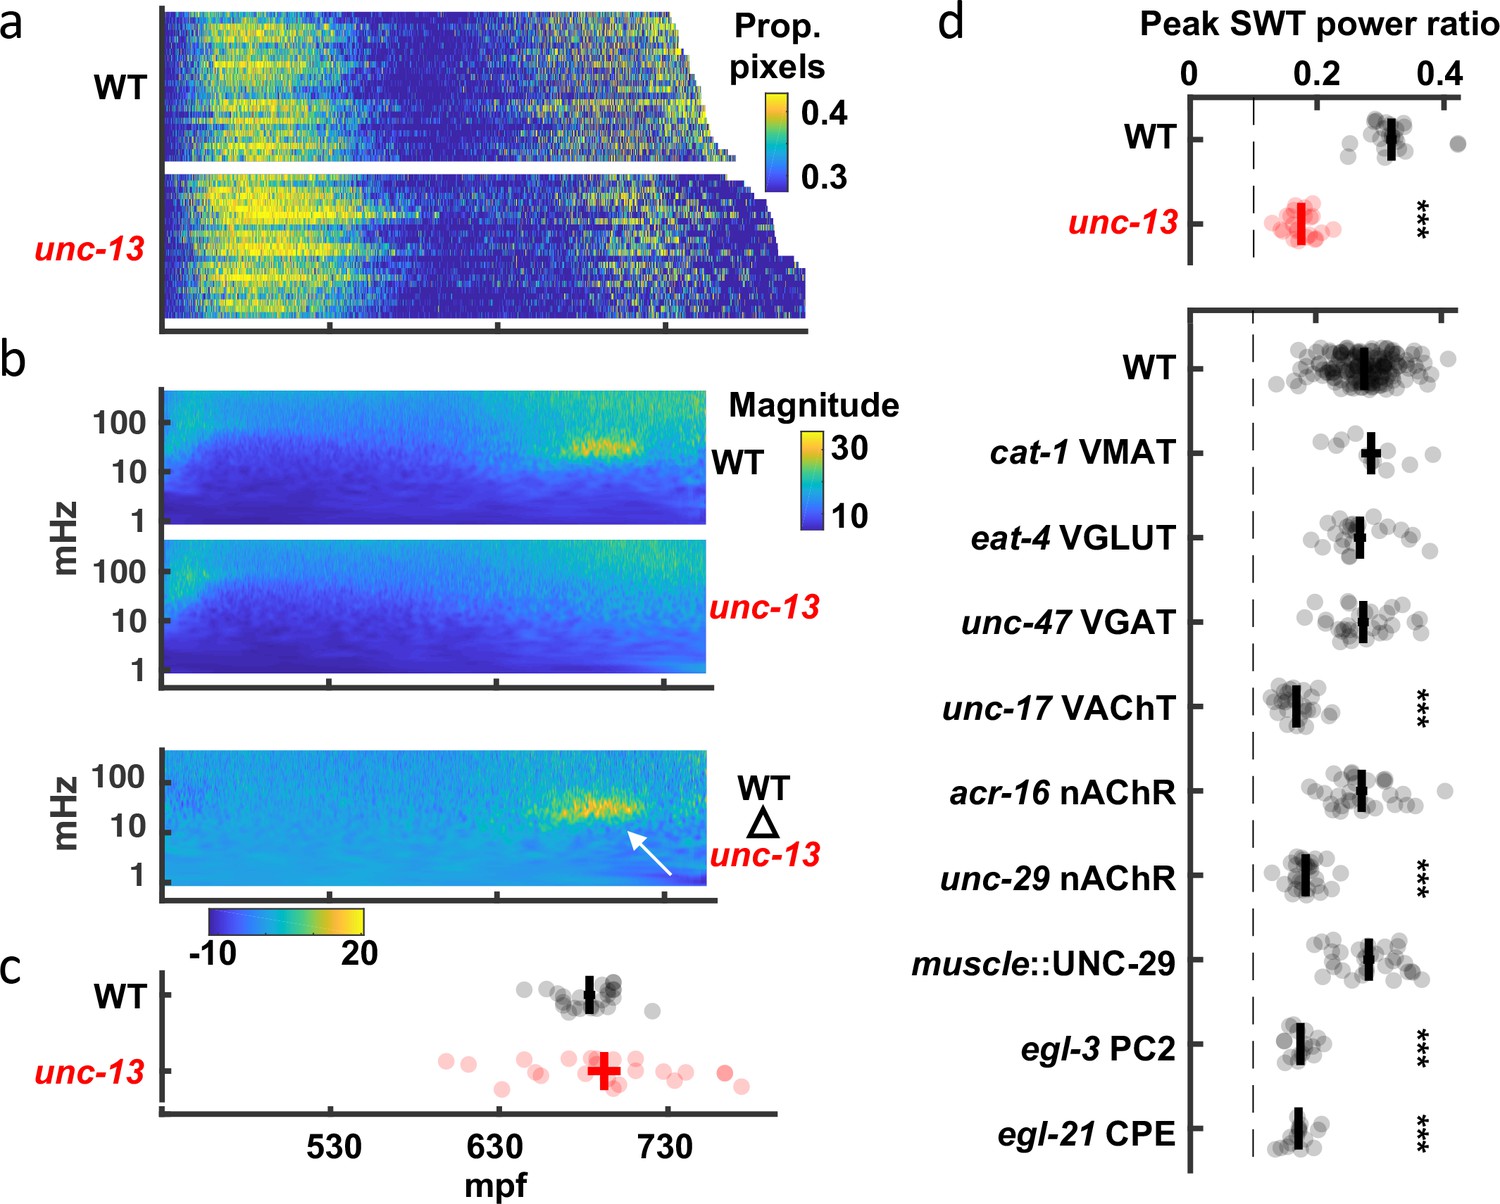
Slow wave twitch (SWT) requires cholinergic and neuropeptide signaling.
(a) Brightfield twitch profiles are shown for wild-type (WT; n=24) and unc-13 mutants (n=23). Each line corresponds to a single embryo. All embryos are aligned at twitch onset (430 mpf). Proportion of pixels changing intensity (smoothed over 10 s) is indicated by the color LUT. (b) SWT behavior is absent in unc-13 mutants. Mean twitching scalograms for wild-type and unc-13 mutants and the difference scalogram (WT – unc-13) are shown. The signal in the 20–40 mHz frequency band around 660–720 mpf (arrow) is SWT behavior. (c) The timing of peak relative power in the SWT frequency band (20–40 mHz) is plotted (mean +/-SEM, with each dot corresponding to an embryo). (d) SWT behavior requires cholinergic and neuropeptide signaling. Peak SWT power ratios compared for several synaptic signaling mutants. Mean +/-SEM are shown, with each dot corresponding to an embryo. Sample sizes are as follows: WT, n=156; cat-1 VMAT, n=11; eat-4 VGLUT, n=24; unc-47 VGAT, n=30; unc-17 VAChT, n=26; acr-16 nAChR, n=31; unc-29 nAChR, n=29; muscle::UNC-29, n=31; egl-3 PC2, n=17; egl-21 CPE, n=16. One-way ANOVA and Tukey’s honestly significant difference criterion were used to compare strains. Significant differences from wild-type are indicated (***, p < 0.001). The dashed line indicates the peak SWT power ratio derived from shuffled wild-type data. Figure 6—figure supplement 1 shows the full twitch profiles for strains with SWT defects.
Figure 6—figure supplement 1
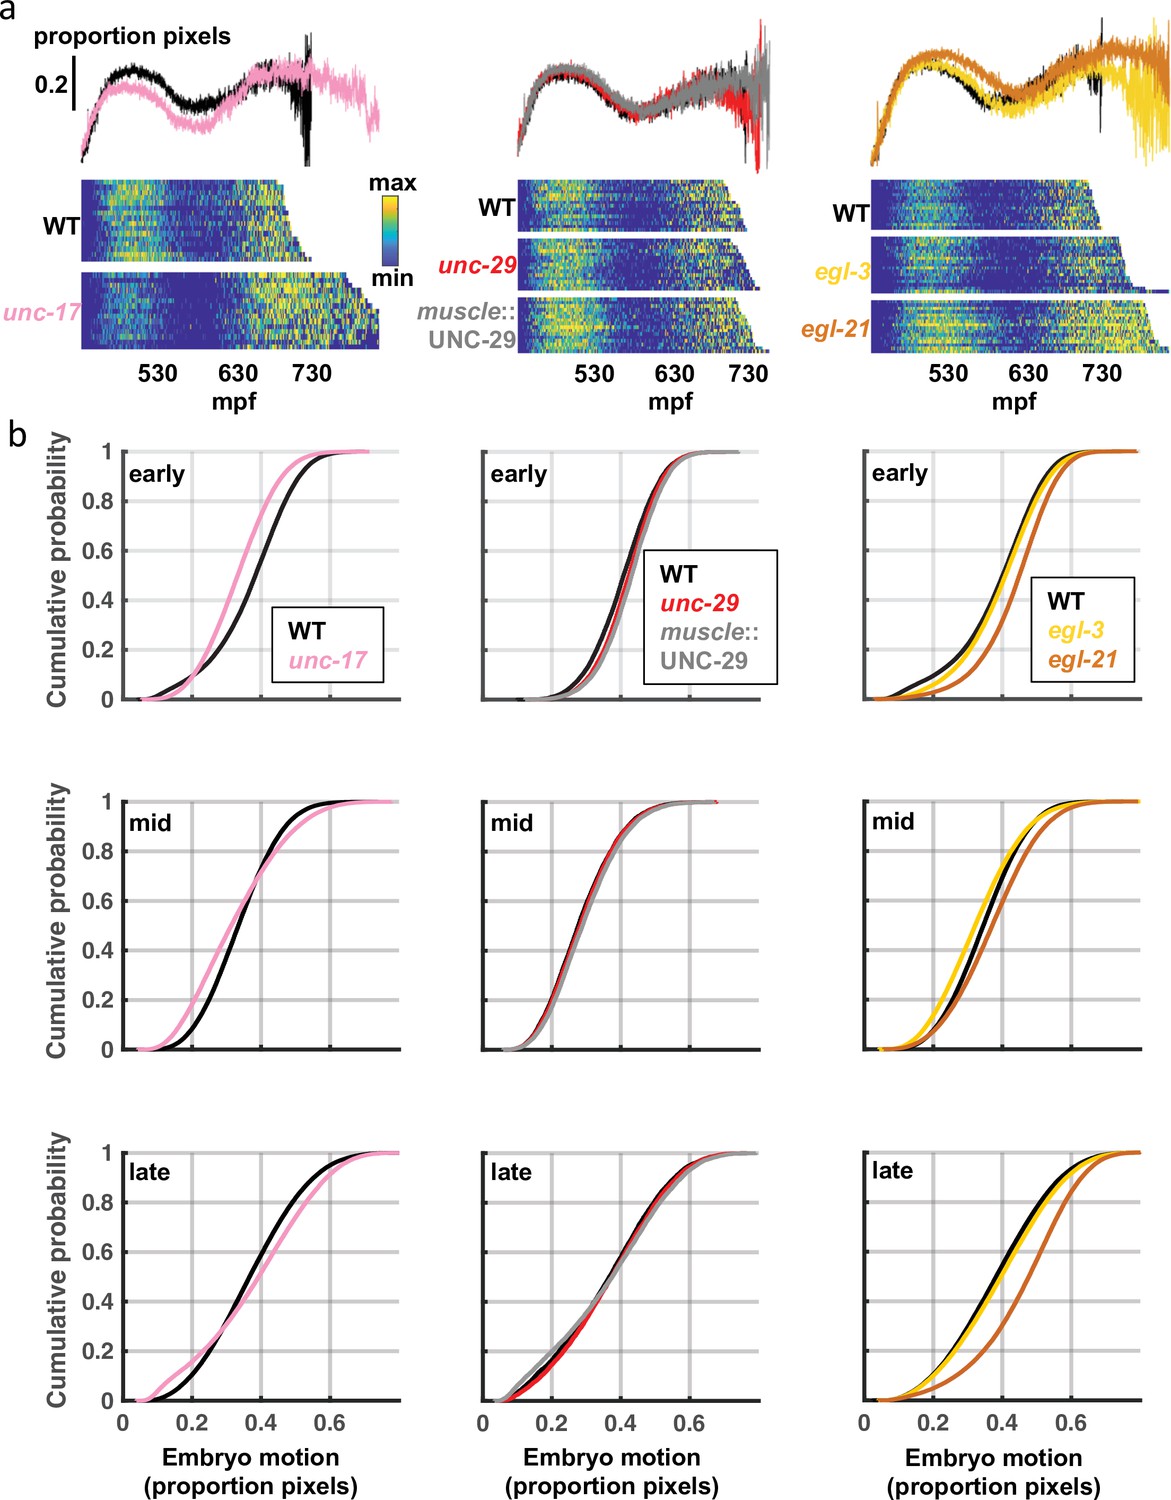
Full twitch profile for SWT mutants.
(a) Sample twitch profiles for indicated genotypes and their contemporaneous wild-type control. Top: Mean proportion of pixels changing intensity as a function of age. Bottom: Proportion of pixels changing intensity as a function of age, with each line corresponding to an embryo and aligned at twitch onset (smoothed over 10 s). (b) Cumulative probability histograms of embryo motion (assessed by proportion of pixels changing intensity) are plotted for the indicated genotypes. To control for day-to-day differences in developmental timing, embryo age was normalized (0=twitch onset; 1=hatching). Motion histograms are shown for early, mid, and late embryos, which refer to blocks of 100 min centered on 0.2, 0.5, and 0.8 of normalized embryo age.
Figure 7 with 1 supplement
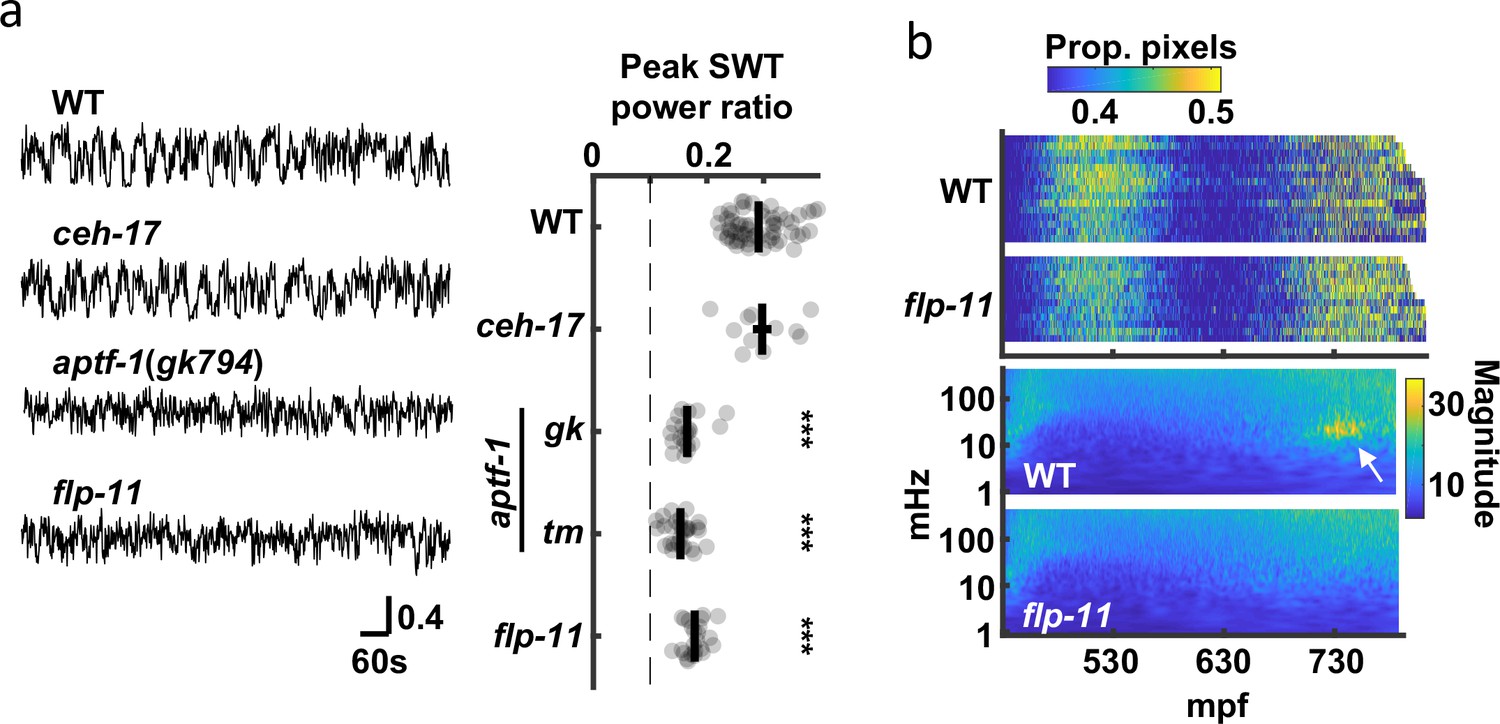
SWT behavior requires function of the RIS neuron.
(a) The contribution of two quiescence promoting neurons (RIS and ALA) to SWT behavior is evaluated. SWT behavior is deficient in mutants lacking RIS function (aptf-1 and flp-11) but is unaffected in those lacking ALA function (ceh-17). Left: Representative twitch traces at peak SWT power ratio are shown. Amplitudes indicate the proportion of pixels changing intensity. Right: Peak relative power in the SWT frequency band (20–40 mHz) is plotted for the indicated genotypes. Mean +/-SEM, with each dot corresponding to an embryo. The dashed line denotes peak SWT power ratio derived from shuffled data. Two aptf-1 alleles (gk794 and tm3287) were analyzed. One-way ANOVA and Tukey’s honestly significant difference criterion were used to compare strains. Significant differences from wild-type are indicated (***, p < 0.001). (b) Top: Brightfield twitch profiles are shown for wild-type (WT) and flp-11 mutants. Each line corresponds to an individual embryo aligned at twitch onset (430 mpf). The proportion of pixels changing intensity (smoothed over 10 seconds) is indicated by the color LUT. See Figure 7—figure supplement 1 for cumulative distribution functions. Bottom: Wild-type and flp-11 scalograms. Note the SWT signature in WT (arrow) is missing in flp-11 mutants.
Figure 7—figure supplement 1

Cumulative probability histograms of embryo motion (assessed by proportion of pixels changing intensity) are plotted for the indicated genotypes.
To control for day to day differences in developmental timing, embryo age was normalized (0=twitch onset; 1=hatching). Motion histograms are shown for early, mid, and late embryos, which refer to blocks of 100 min centered on 0.2, 0.5, and 0.8 of normalized embryo age.
Figure 8 with 1 supplement
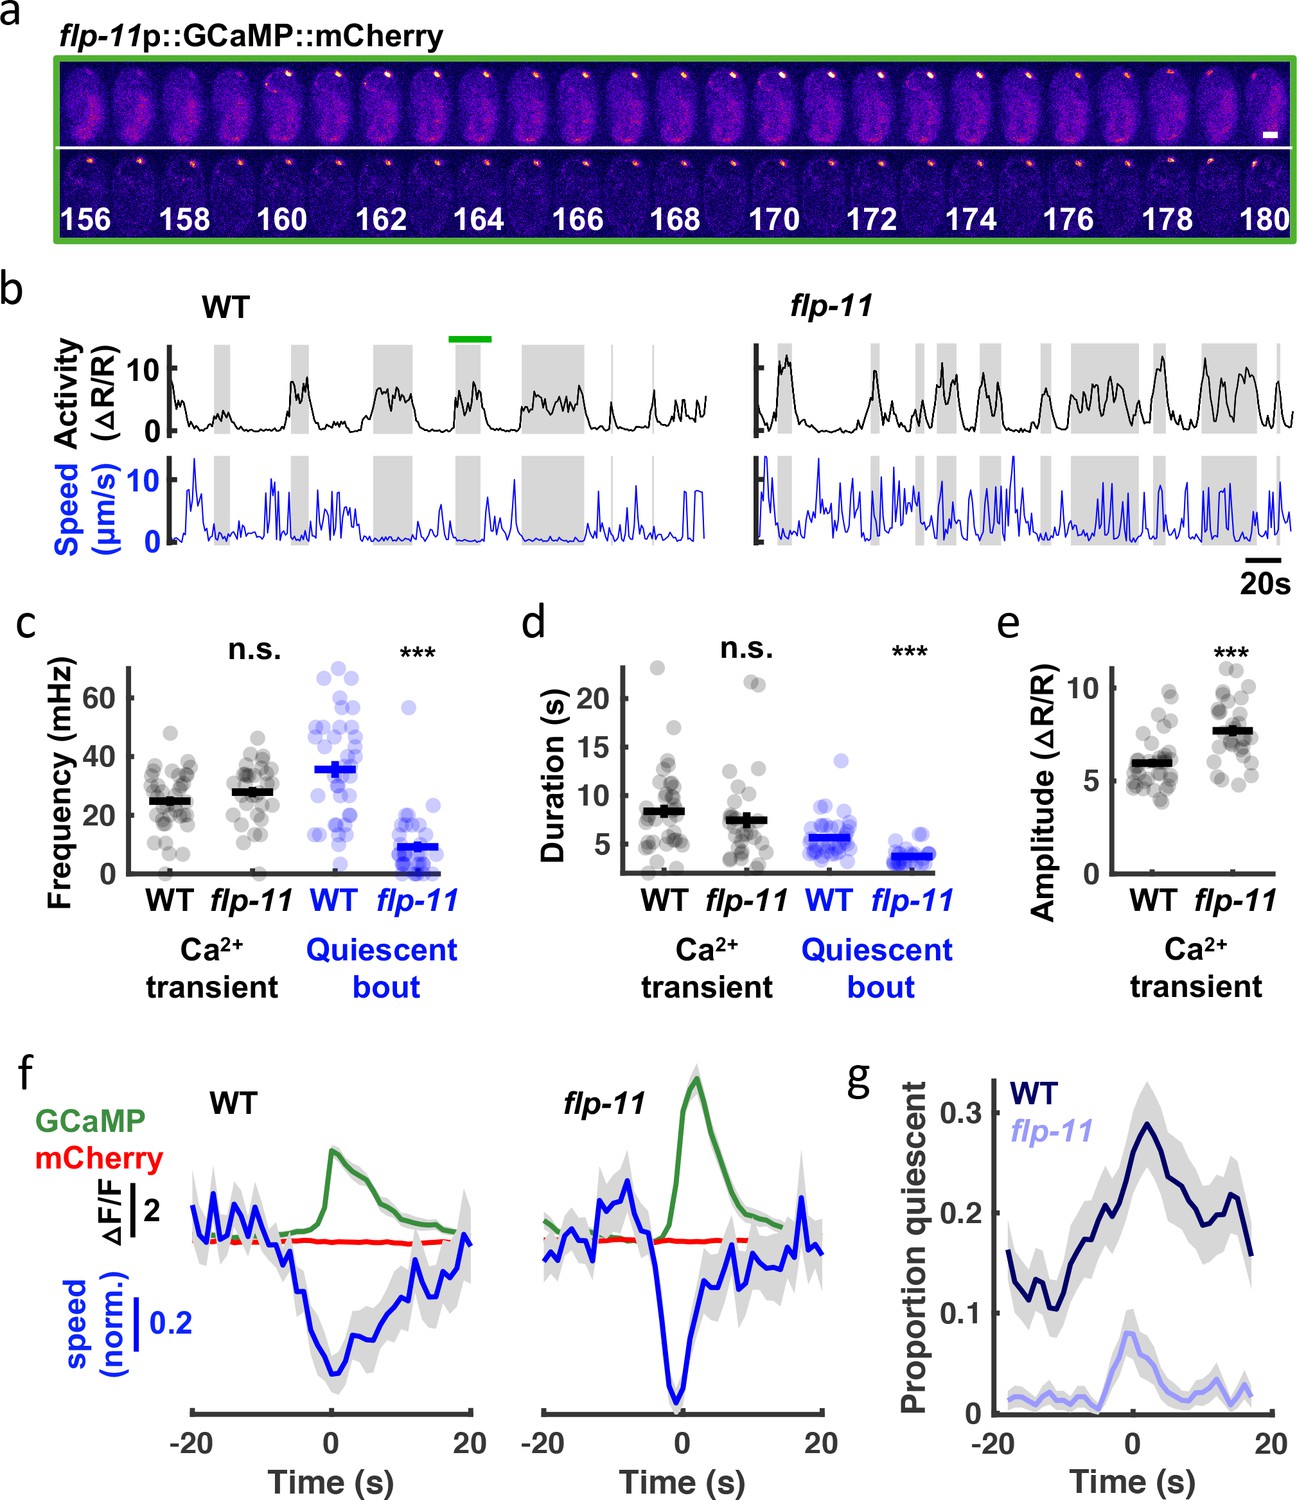
SWT behavior correlates with rhythmic RIS activity.
(a) Time lapse images of a WT embryo expressing GCaMP (top) fused to mCherry (bottom) in RIS. A single confocal plane is shown. Time stamp, s. Scale bar, 10 μm (b-g) RIS activity (assessed by cell body GCaMP) and embryo motion (assessed by RIS cell body displacement) were simultaneously recorded in individual embryos. (b) Representative activity (top) and motion (bottom) traces are shown for WT and flp-11 mutants. Gray bands indicate calcium transient durations (defined by widths at half peak amplitude). The green bar spans the period shown in (a). Calcium transient and quiescent bout frequency (c) and durations (d), and calcium transient amplitudes (e) are plotted. Mean +/- SEM are indicated. Each dot represents an individual embryo. Significant differences from WT (***, p < 0.001) were determined by an unpaired two-sample t-test. (f) Traces of median normalized speed and GCaMP and mCherry intensity are aligned to calcium transient onset (Time = 0 s defined as the time of half peak GCaMP/mCherry ratio). Behavioral slowing was more transient in flp-11 mutants. Behavioral slowing was not correlated with mCherry intensity, suggesting that motion artifacts cannot explain the correlation with GCaMP intensity. (g) Quiescent fraction traces aligned to RIS calcium transient onset are plotted. Quiescence was defined as RIS displacement less than or equal to 0.5 μm per second for at least 3 s. In panels f and g, colored lines and grey shading correspond to mean +/- SD of the sampling distribution estimated by hierarchical bootstrapping for n=269 (WT) and n=261 (flp-11) calcium transients from n=38 and n=32 embryos, respectively. See Figure 8—figure supplement 1 for unc-25 GAD mutant data.
Figure 8—figure supplement 1
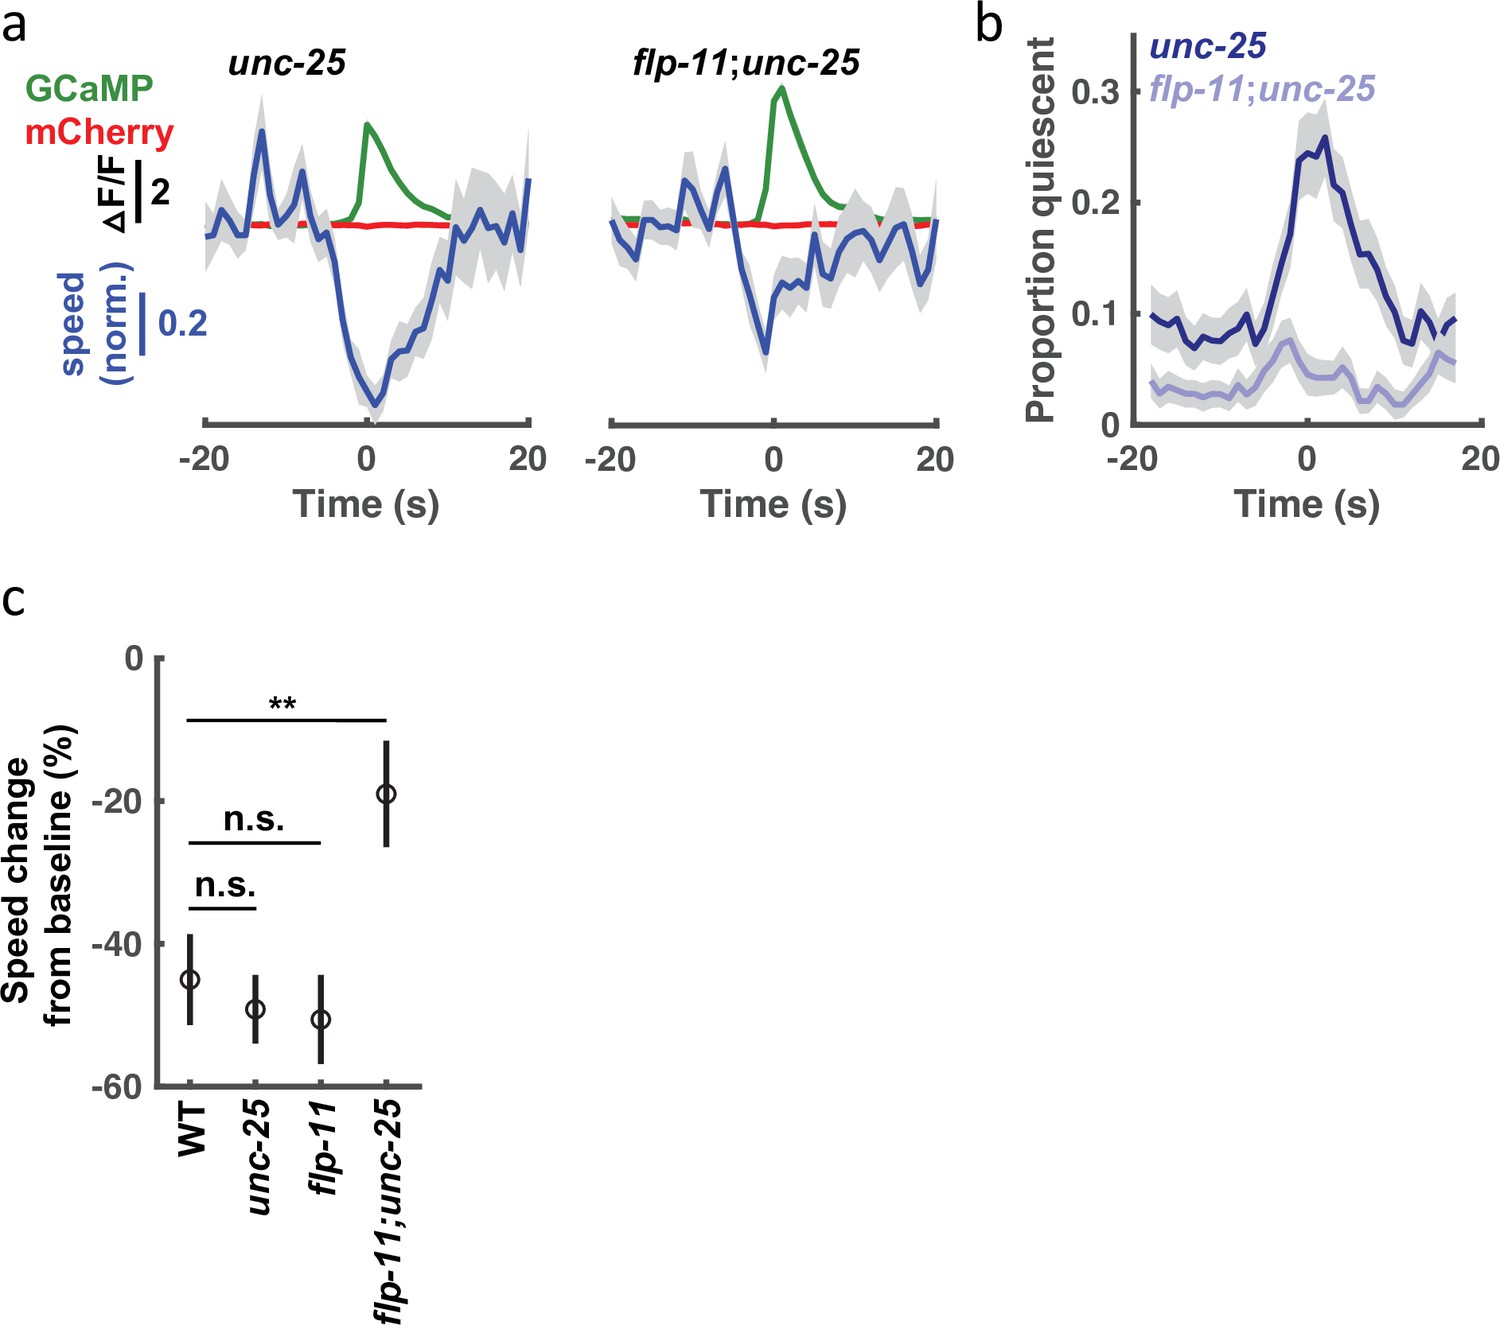
GABA and FLP-11 promote behavioural slowing and pausing.
(a) Traces of median normalized speed and GCaMP and mCherry intensity aligned to calcium transient onset are shown for unc-25 GAD mutants (Time = 0 seconds defined as the time of half peak GCaMP/mCherry ratio). (b) Quiescent fraction traces aligned to RIS calcium transient onset are shown. Quiescence was defined as RIS displacement less than or equal to 0.5 /s for at least 3 s. (c) Median speed change from baseline at the onset of RIS calcium transients (baseline defined as median speed over the preceding 20 s). In panels a-c, mean +/-SD of the sampling distribution estimated by hierarchical bootstrapping for n=327 (unc-25) and n=358 (unc-25;flp-11) calcium transients from n=46 and n=34 embryos, respectively. In panel (c), asterisks indicate a group difference beyond the 99% confidence interval estimated by hierarchical bootstrapping.
Figure 9 with 1 supplement
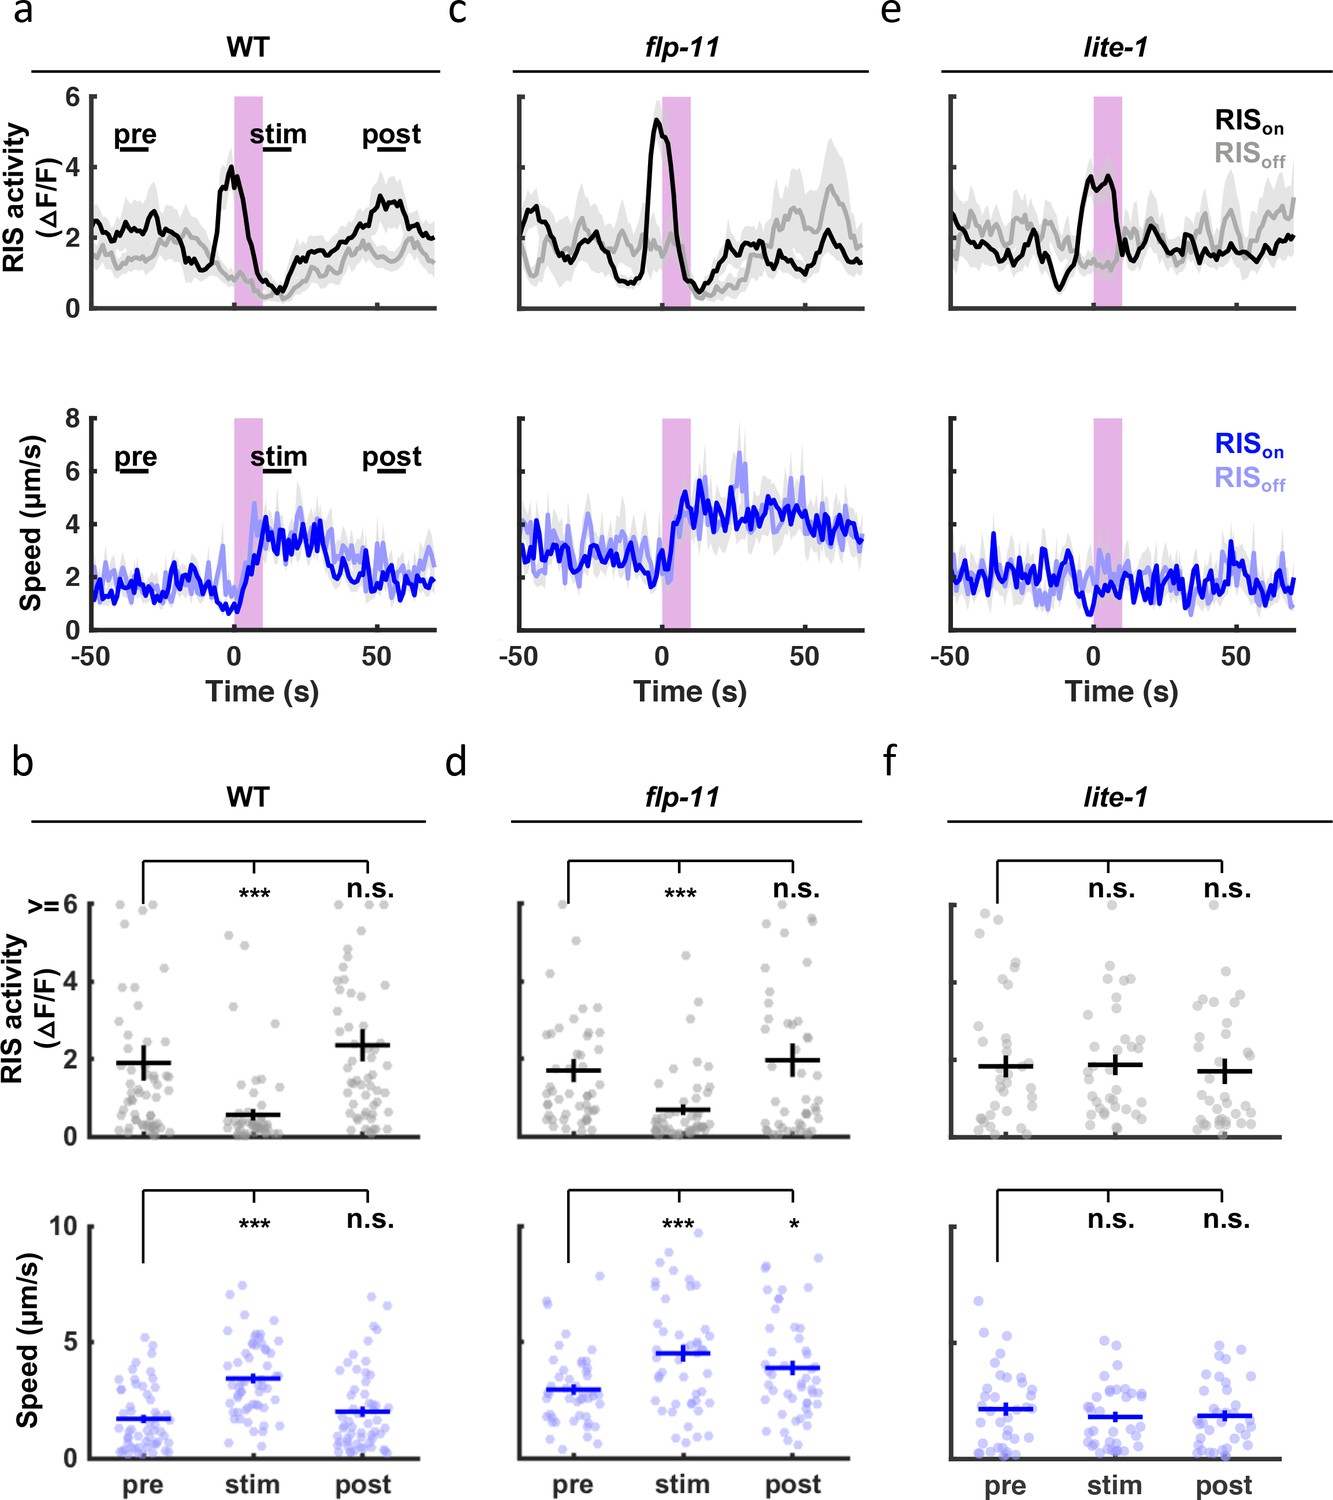
SWT quiescent bouts are reversible, but arousal responses are dampened by FLP-11.
A brief (10 second) UVB light stimulus transiently inhibits RIS activity and evokes aroused embryo motion. UVB evoked RIS inhibition and aroused motion were both eliminated in lite-1 mutants, which lack the endogenous light receptor. The arousal response is apparent even when the stimulus occurs during a quiescent bout (i.e. during an RIS transient), indicating that SWT quiescence is reversible. The arousal response is prolonged in flp-11 mutants, suggesting that light responses are dampened by RIS during SWT. Normalized GCaMP intensity and speed of the RIS cell body were simultaneously recorded in individual embryos of the indicated genotypes before, during, and after a UVB stimulus (purple bar). Trials were categorized based on the state of RIS at the onset of the stimulus (RISon and RISoff). (a, c, e) Traces of RIS activity and speed are plotted (mean +/-SEM). Sample sizes are as follows: WT RISon, n=34; WT RISoff, n=22; flp-11 RISon, n=32; flp-11 RISoff, n=15; lite-1 RISon, n=22; lite-1 RISoff, n=14 embryos. (b, d, f) Mean RIS activity and speed for the time points labeled in (a) (‘pre’, ‘stim’, ‘post’) are plotted. Each dot indicates an embryo. Mean +/-SEM. Data are shown for WT (a, b), flp-11 (c, d), and lite-1 mutants (e, f).'Pre’, ‘stim’, and ‘post’ time points were compared using a non-parametric repeated measures test (Friedman), followed by a Dunn’s multiple comparison test. Asterisks denote statistically distinguishable groups at p < 0.001 (***) or p < 0.05 (*). See Figure 9—figure supplement 1 for data from brightfield recordings.
Figure 9—figure supplement 1
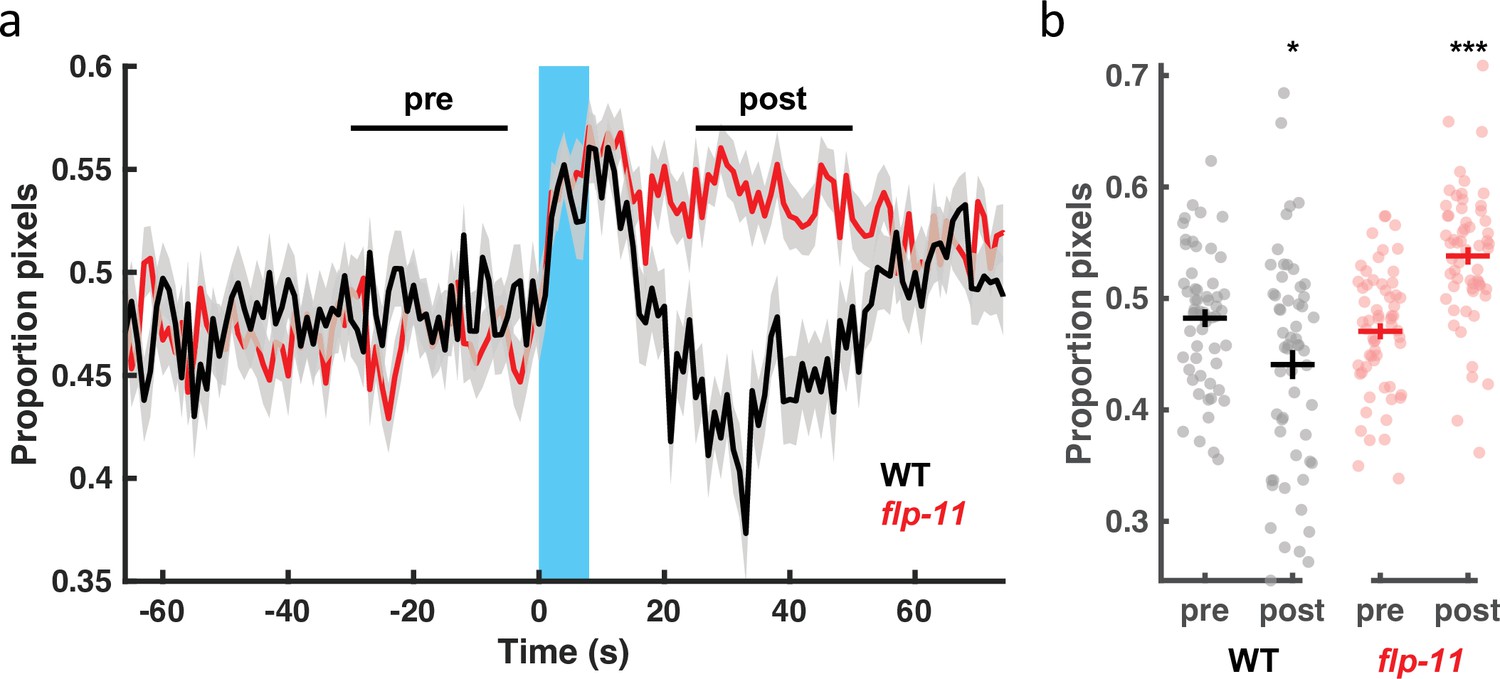
Arousal elicited by short-wavelength visible light.
(a) Brightfield recording before, during, and after a single multi-wavelength light pulse (blue bar; 395 nm, 440 nm, and 470 nm peaks measured at the objective as 5.6 mW, 14.9 mW, and 13.4 mW, respectively). Lines and gray shading correspond to mean +/-SEM. n=57 (WT) and n=60 (flp-11) embryos. (b) Mean pixel changes over the time points labeled in (a) are plotted. Each dot indicates an embryo. Mean +/-SEM. Significant differences between ‘pre’ and ‘post’ time points (***, p < 0.001; *, p < 0.05) were determined by a non-parametric repeated measures test (Friedman).
Figure 10
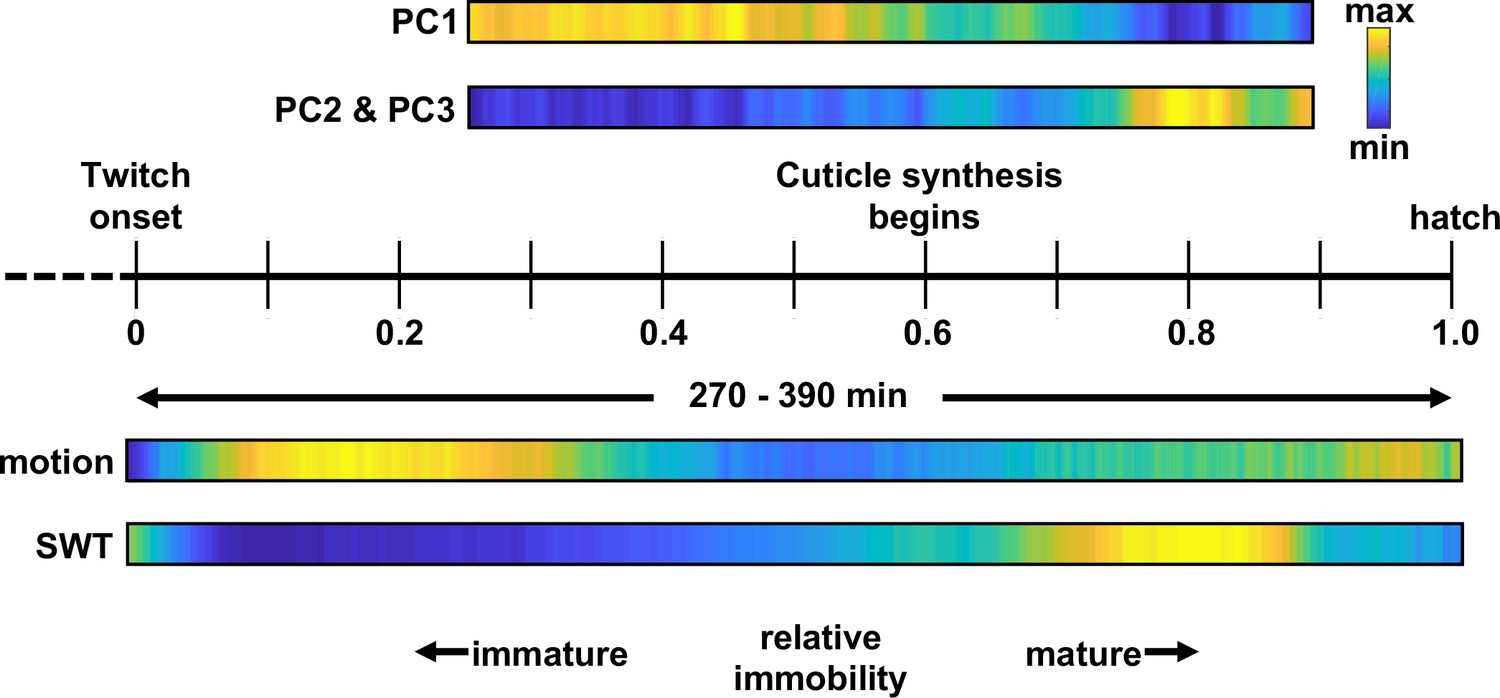
C. elegans embryonic behavioral maturation.
Posture (top) and movement (bottom) data derived from seam cell tracking and brightfield recordings, respectively. Temporal scaling is shown along a relative timeline to account for day-to-day differences in developmental rate (Figure 3—figure supplement 1).
Videos
Video 1
Seam cell nuclei fit with a natural cubic spline from H0 (blue) to tail (yellow; left).
Scale bar, 10 . Projection of postures onto three planes in PC space, with red x’s denoting pauses (right). Original data acquired at 3 Hz.
Tables
Table 1
Seam cell nuclei detection results on a held out test set.
The variance in apparent size, shape, proximity, and intensity patterns make seam cell nuclei detection challenging. A held-out test set of image volumes was annotated by an expert; centers of seam cell nuclei were used as reference to compare automatic detection methods. A variety of methods were compared, with recent deep learning based methods yielding the most accurate detections, on average (across 46 held-out test image volumes). The large kernel 3D U-Net trained on both the dice coefficient (Dice) and binary cross-entropy (BCE) yields both the highest precision and recall. However, even the 3D U-Net cannot reliably detect all seam cell nuclei in an image volume.
| Model | Precision | Recall | F1 | Citation | Implementation |
|---|---|---|---|---|---|
| IFT-Watershed | 0.81 | 0.80 | 0.80 | Falcão et al., 2004 | Lombardot, 2017 |
| LoG-GSF | 0.95 | 0.90 | 0.92 | Lindeberg, 1998; Lowe, 2004 | Tinevez et al., 2017 |
| Wavelet | 0.88 | 0.86 | 0.87 | Olivo-Marin, 2002 | de Chaumont et al., 2012 |
| Mask-RCNN | 0.93 | 0.89 | 0.91 | He et al., 2017 | Waleed, 2017 |
| 3D U-Net Dice | 0.94 | 0.91 | 0.92 | Çiçek et al., 2016 | Chollet, 2021 |
| 3D U-Net Dice/BCE | 0.95 | 0.92 | 0.93 | Çiçek et al., 2016 | Chollet, 2021 |
| Stardist 3D | 0.91 | 0.88 | 0.89 | Weigert et al., 2020 | Weigart, 2021 |
Key resources table
| Reagent type (species) or resource | Designation | Source or reference | Identifiers | Additional information |
|---|---|---|---|---|
| Strain, strain background, (C. elegans) | wls51 | https://cgc.umn.edu/ | KP10922 | wls51 [SCMp::GFP +unc-119(+)] |
| Strain, strain background, (C. elegans) | unc-13(s69); wls51 | This paper | KP9135 | Figure 5 |
| Strain, strain background, (C. elegans) | N2 Bristol | https://cgc.umn.edu/ | N2 | Wild-type reference |
| Strain, strain background, (C. elegans) | unc-47(e307) | https://cgc.umn.edu/ | CB307 | |
| Strain, strain background, (C. elegans) | unc-17(e245) | https://cgc.umn.edu/ | CB933 | |
| Strain, strain background, (C. elegans) | acr-16(ok789) | https://cgc.umn.edu/ | RB918 | |
| Strain, strain background, (C. elegans) | unc-29(x29) | Lewis et al., 1980 | KP7858 | |
| Strain, strain background, (C. elegans) | eat-4(ky5) | https://cgc.umn.edu/ | MT6308 | |
| Strain, strain background, (C. elegans) | cat-1(e1111) | https://cgc.umn.edu/ | CB1111 | |
| Strain, strain background, (C. elegans) | egl-3(n150) | https://cgc.umn.edu/ | MT150 | |
| Strain, strain background, (C. elegans) | egl-21(n476) | https://cgc.umn.edu/ | MT1071 | |
| Strain, strain background, (C. elegans) | ceh-17(np1) | https://cgc.umn.edu/ | IB16 | |
| Strain, strain background, (C. elegans) | aptf-1(gk794) | https://cgc.umn.edu/ | HBR227 | |
| Strain, strain background, (C. elegans) | aptf-1(tm3287) | https://cgc.umn.edu/ | HBR232 | |
| Strain, strain background, (C. elegans) | flp-11(tm2706) | https://cgc.umn.edu/ | HBR507 | |
| Strain, strain background, (C. elegans) | unc-29(x29); nuTi233 | This paper | KP9744 | nuTi233[pat-10 p::NLS-wCherry-NLS::SL2::UNC-29] |
| Strain, strain background, (C. elegans) | nuTi580 | This paper | KP10749 | nuTi580[flp-11 p::GCaMP6f:: mCherry] |
| Strain, strain background, (C. elegans) | goeEx737 | https://cgc.umn.edu/ | HBR2256 | goeEx737[flp-24 p::SL1:: GCaMP3.35:: SL2::mKate2 +unc-119(+)] |
| Strain, strain background, (C. elegans) | flp-11(tm2706); nuTi580 | This paper | KP10763 | Figure 8 |
| Strain, strain background, (C. elegans) | unc-25(e156); nuTi580 | This paper | KP10964 | Figure 8—figure supplement 1 |
| Strain, strain background, (C. elegans) | unc-25(e156); flp-11(tm2706); nuTi580 | This paper | KP10965 | Figure 8—figure supplement 1 |
| Strain, strain background, (C. elegans) | lite-1(ce314); nuTi580 | This paper | KP10762 | Figure 9 |
| Strain, strain background, (E. coli) | OP50 | Brenner, 1974 | OP50 | Worm food |
| Recombinant DNA reagent | pat-10 p::NLS-wCherry-NLS::SL2::UNC-29 | This paper | KP#4524 | UNC-29 expression in muscle |
| Recombinant DNA reagent | flp-11 p::GCaMP6f:: mCherry | This paper | KP#4525 | GCaMP expression in RIS |
| Chemical compound, drug | poly-L-lysine | Sigma-Aldrich | P2636 | |
| Software, algorithm | MATLAB | MathWorks | MATLAB R2018a | |
| Software, algorithm | MHHT | This paper, Lauziere, 2022 | https://github.com/lauziere/MHHT | |
| Other | UVB LED | Marktech Optoelectronics | MTSM285 | Figure 9 |
Additional files
Download links
A two-part list of links to download the article, or parts of the article, in various formats.
Downloads (link to download the article as PDF)
Open citations (links to open the citations from this article in various online reference manager services)
Cite this article (links to download the citations from this article in formats compatible with various reference manager tools)
Stereotyped behavioral maturation and rhythmic quiescence in C. elegans embryos
eLife 11:e76836.
https://doi.org/10.7554/eLife.76836


