Palatal morphology predicts the paleobiology of early salamanders
- School of Earth and Space Sciences, Peking University, China
- State Key Laboratory of Palaeobiology and Stratigraphy (Nanjing Institute of Geology and Palaeontology, CAS), China
- Department of Comparative Biology and Experimental Medicine, University of Calgary, Canada
- Department of Microbiology, Immunology, and Tropical Medicine, The George Washington University, United States
Figures
Figure 1 with 26 supplements
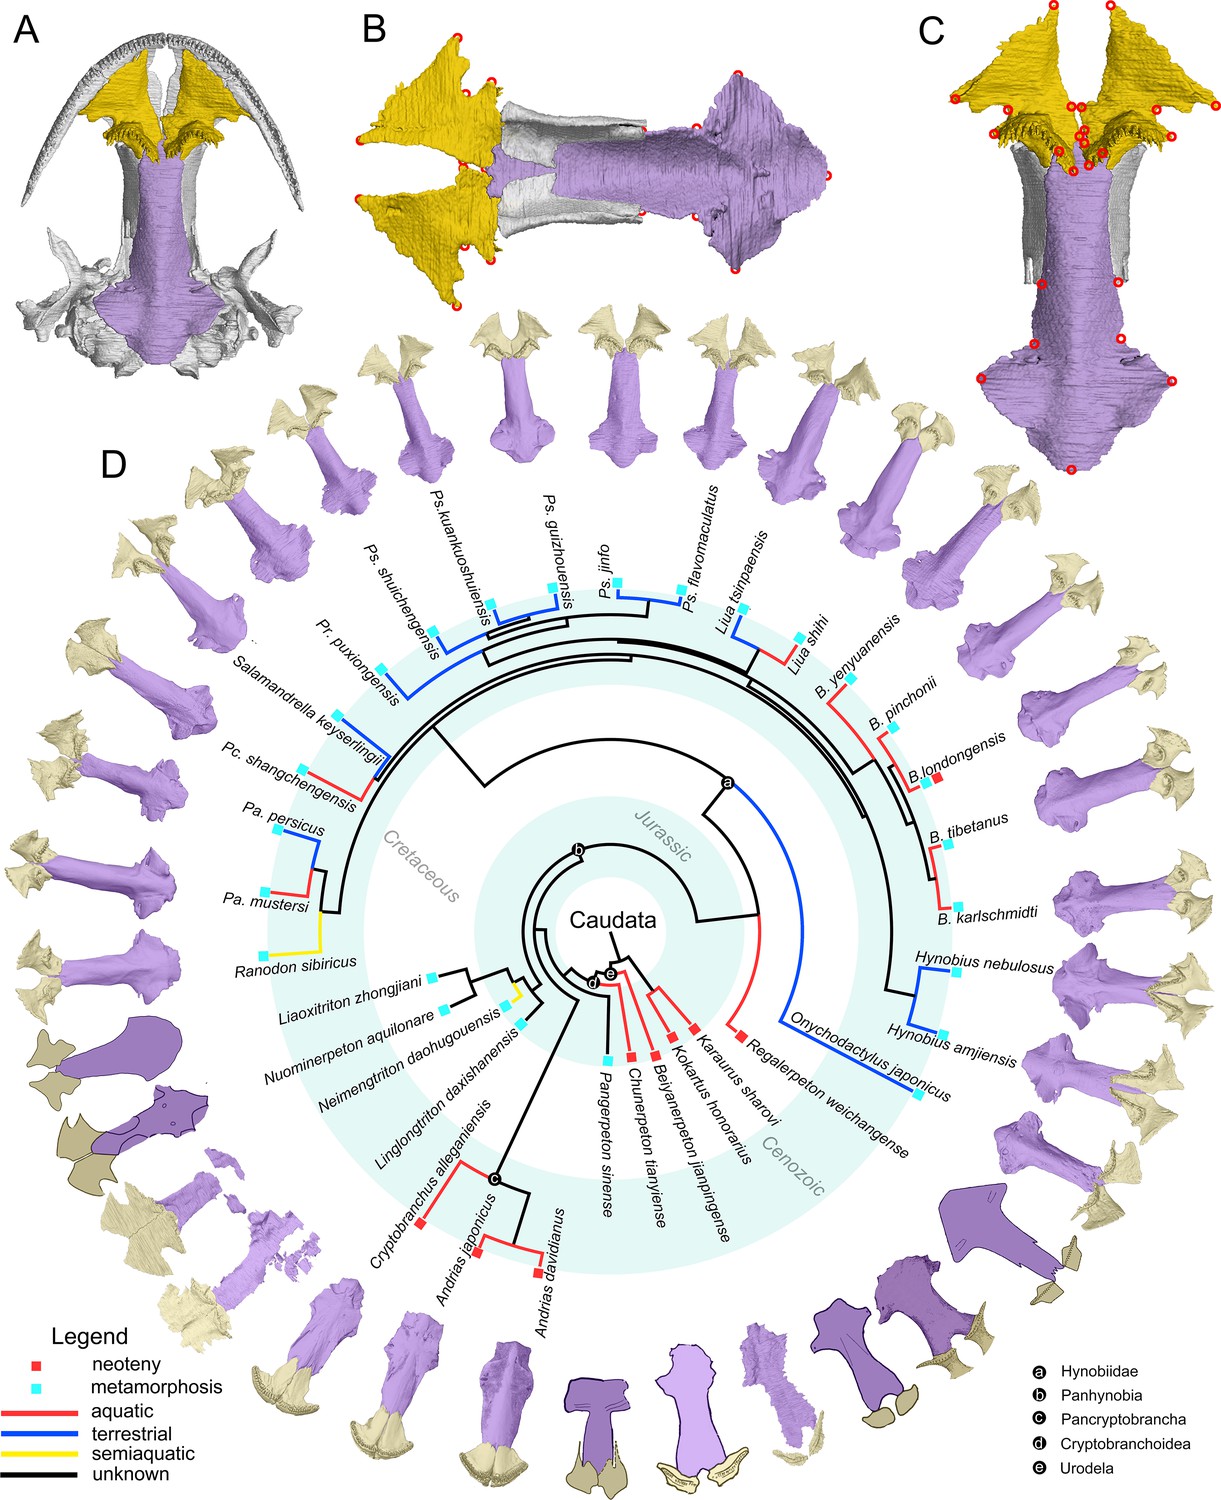
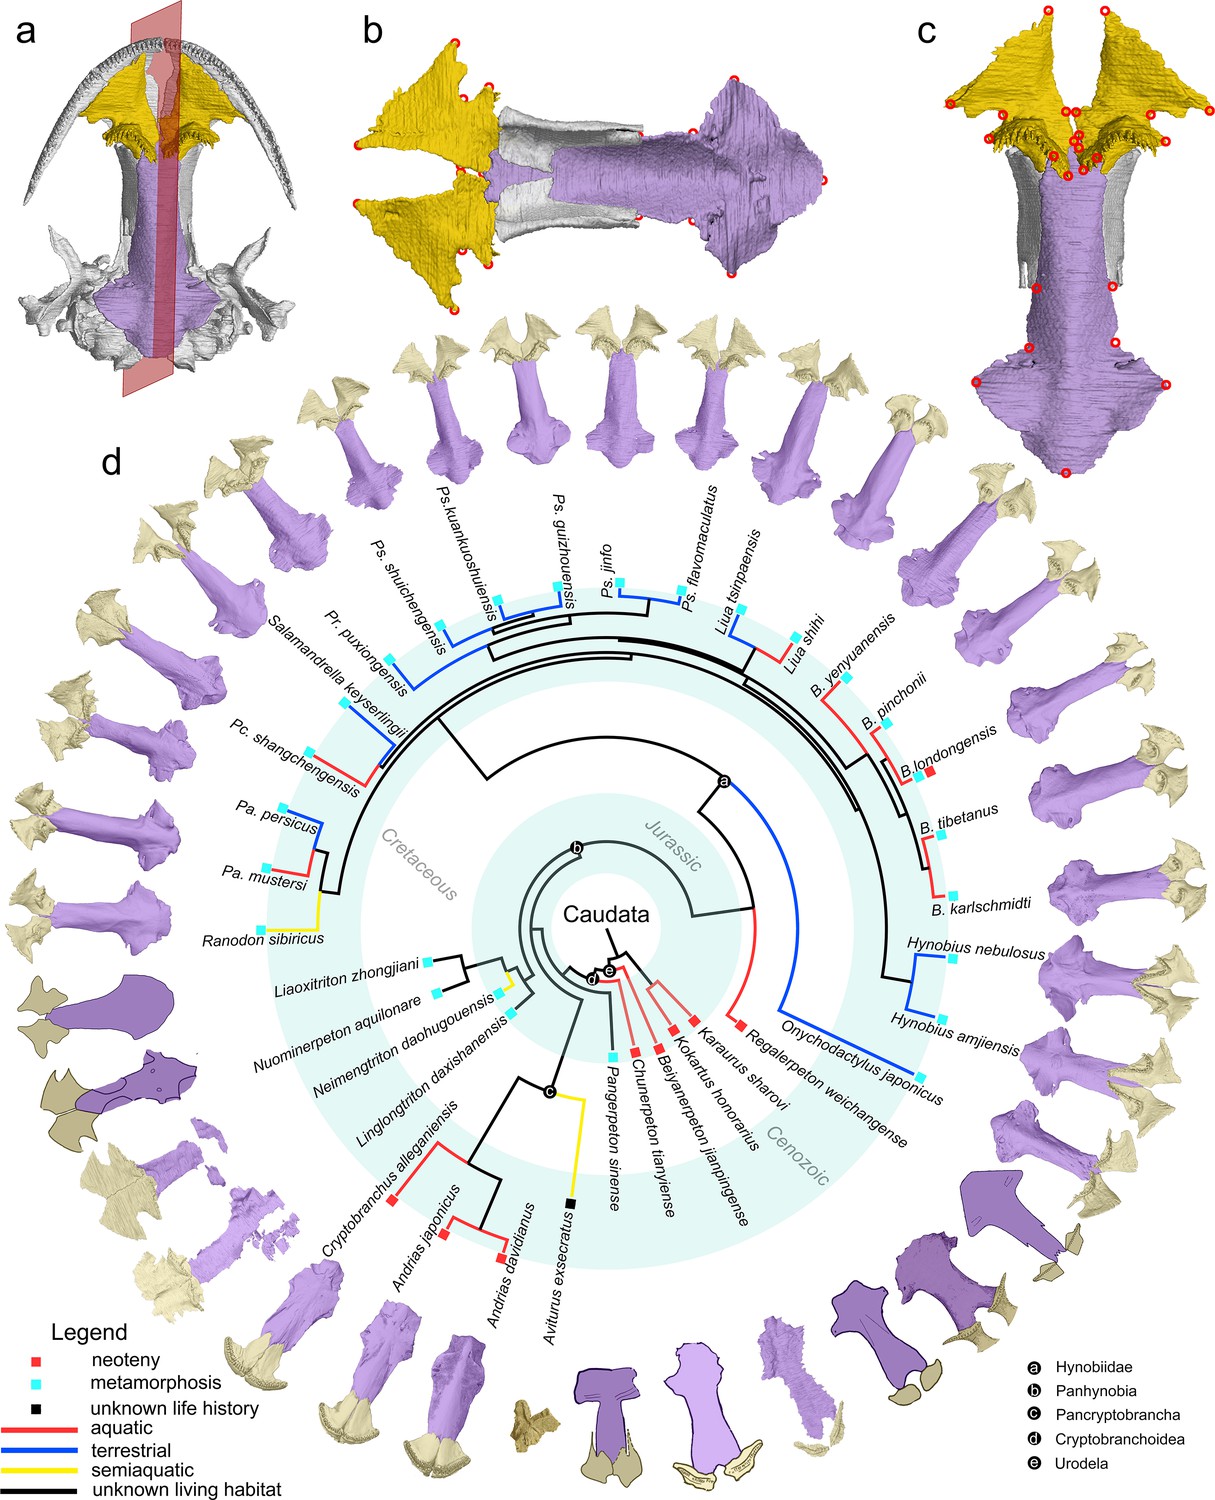
The palate and phylogenic relationships of early salamanders.
(A) The vomer (gold) and parasphenoid (purple) of the palate in ventral view of the skull in living hynobiid Pseudohynobius flavomaculatus. (B) Dorsal view of the palate showing the articulation patterns with the paired orbitosphenoid (whitish). (C) Enlarged view of the palate in ventral view with red circles corresponding to the 24 landmarks used for the geometric morphometric analysis. (D) Palatal configurations of early salamanders in ventral view, with color-coded life history strategies (square block) and ecological preferences (line) plotted on the time-calibrated tree modified from Jetz and Pyron, 2018 and Jia et al., 2021a.
Figure 1—figure supplement 1
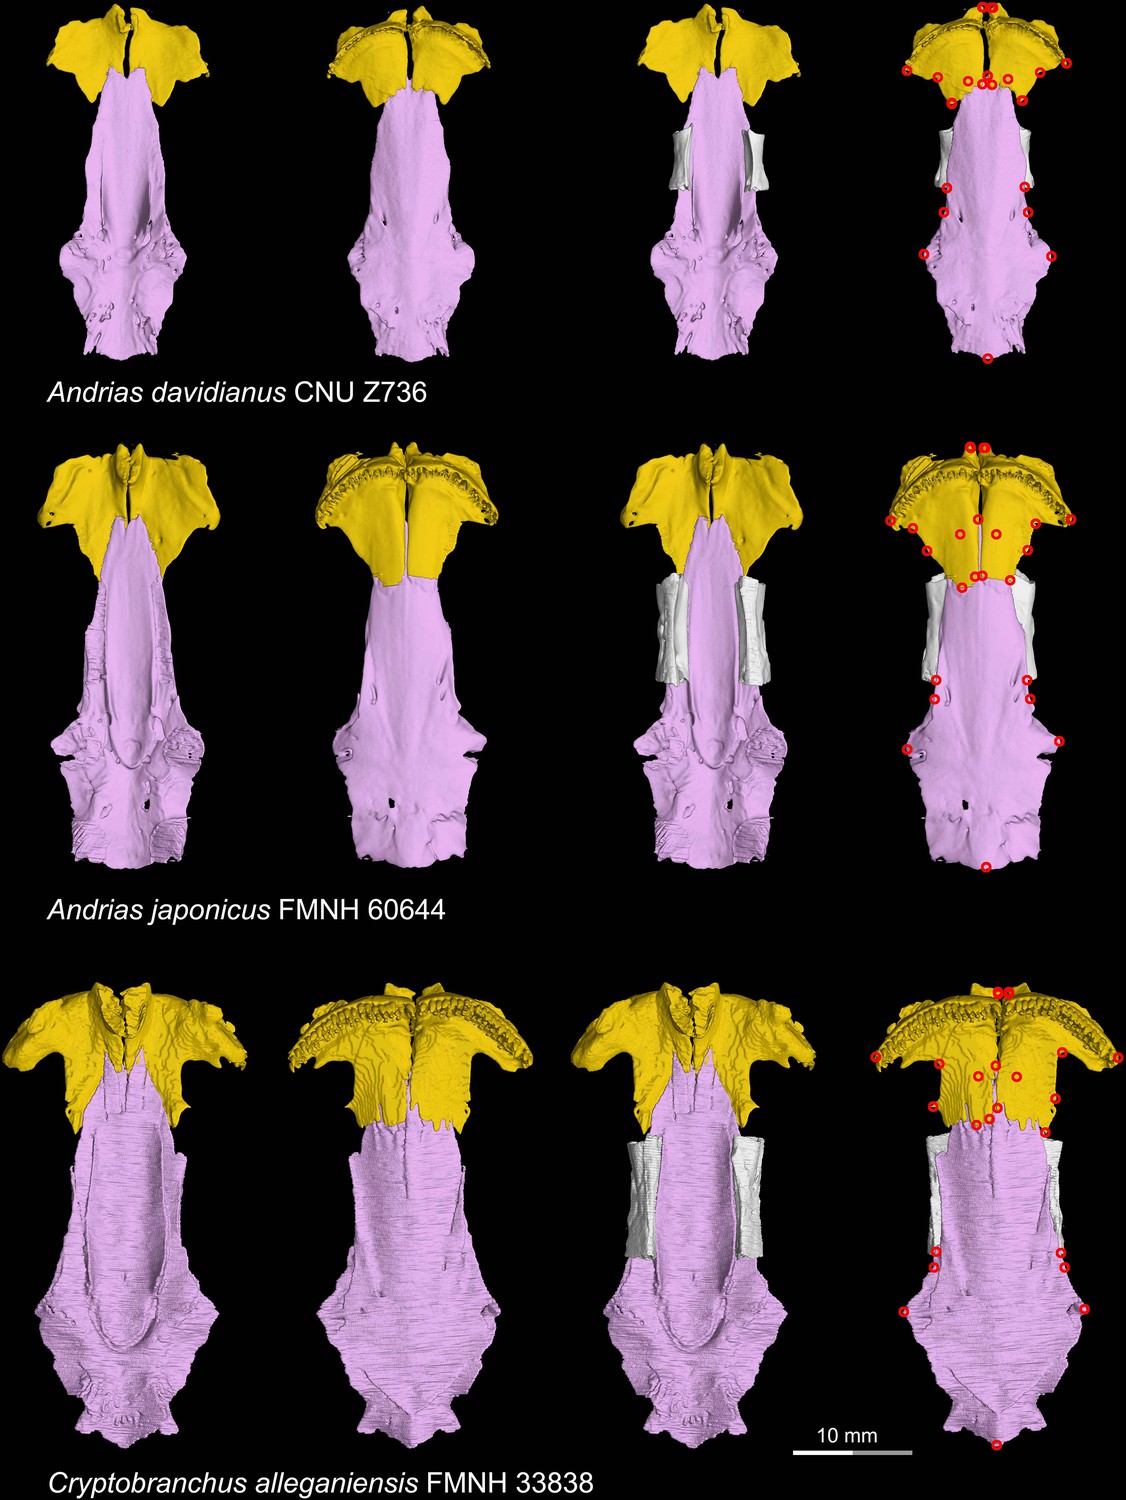
CT rendering of the palate and orbitosphenoid of extant cryptobranchids in dorsal (first and third columns) and ventral (second and fourth columns) views.
Landmarks are represented by red circles in the last column. CNU, Capital Normal University, Beijing, China; FMNH, Field Museum of Natural History, Chicago, Illinois, USA.
Figure 1—figure supplement 2
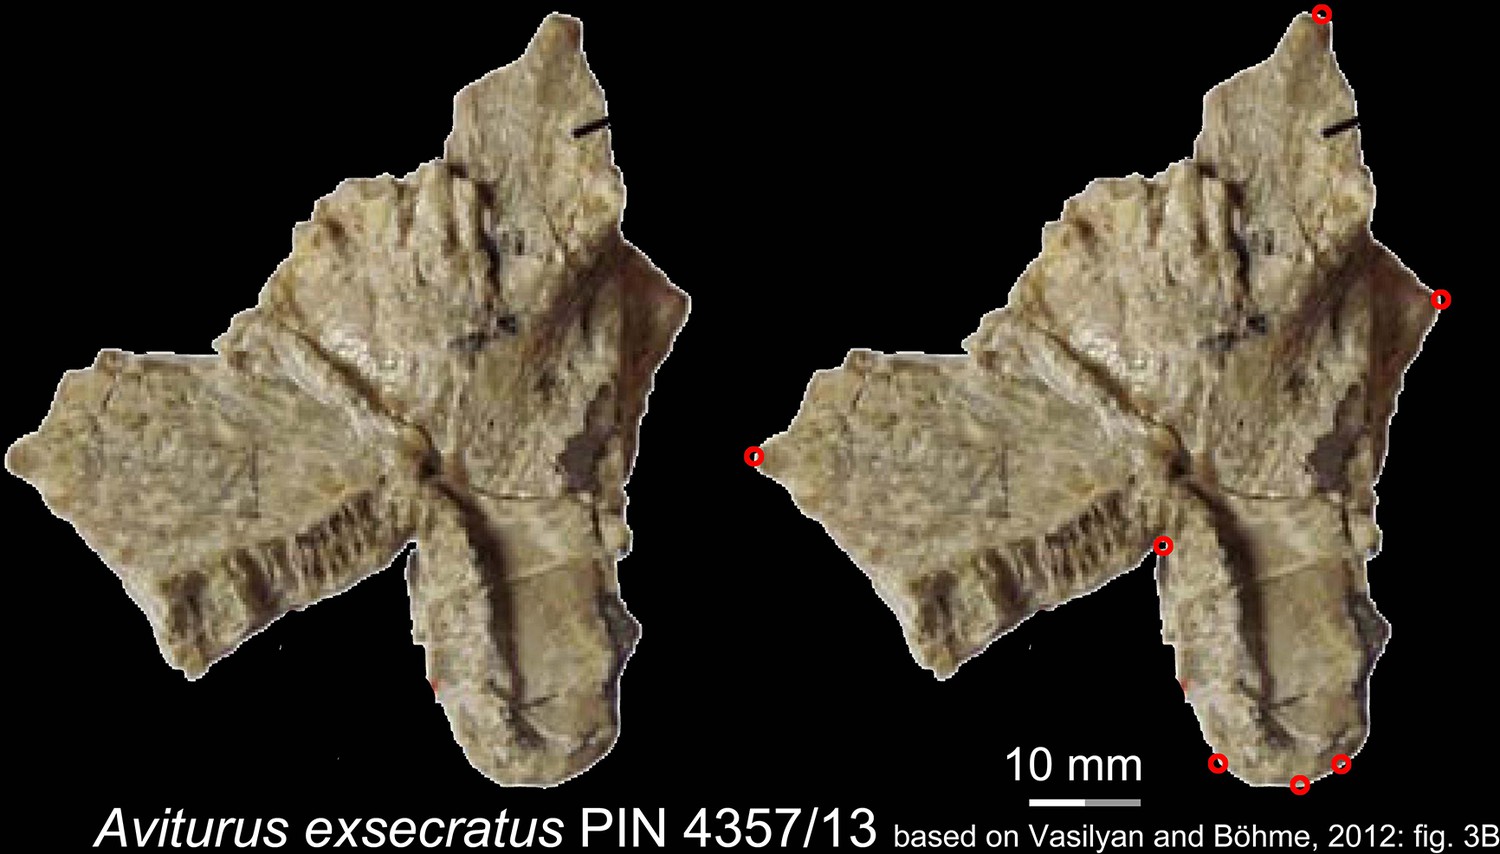
Images showing the ventral view of the right vomer (PIN 4357/13) of the Paleocene pancryptobranchan Aviturus exsecratus, with landmarks represented by red circles.
Modified from Vasilyan and Böhme, 2012. PIN, Paleontological Institute, Russian Academy of Sciences, Moscow, Russia.
Figure 1—figure supplement 3
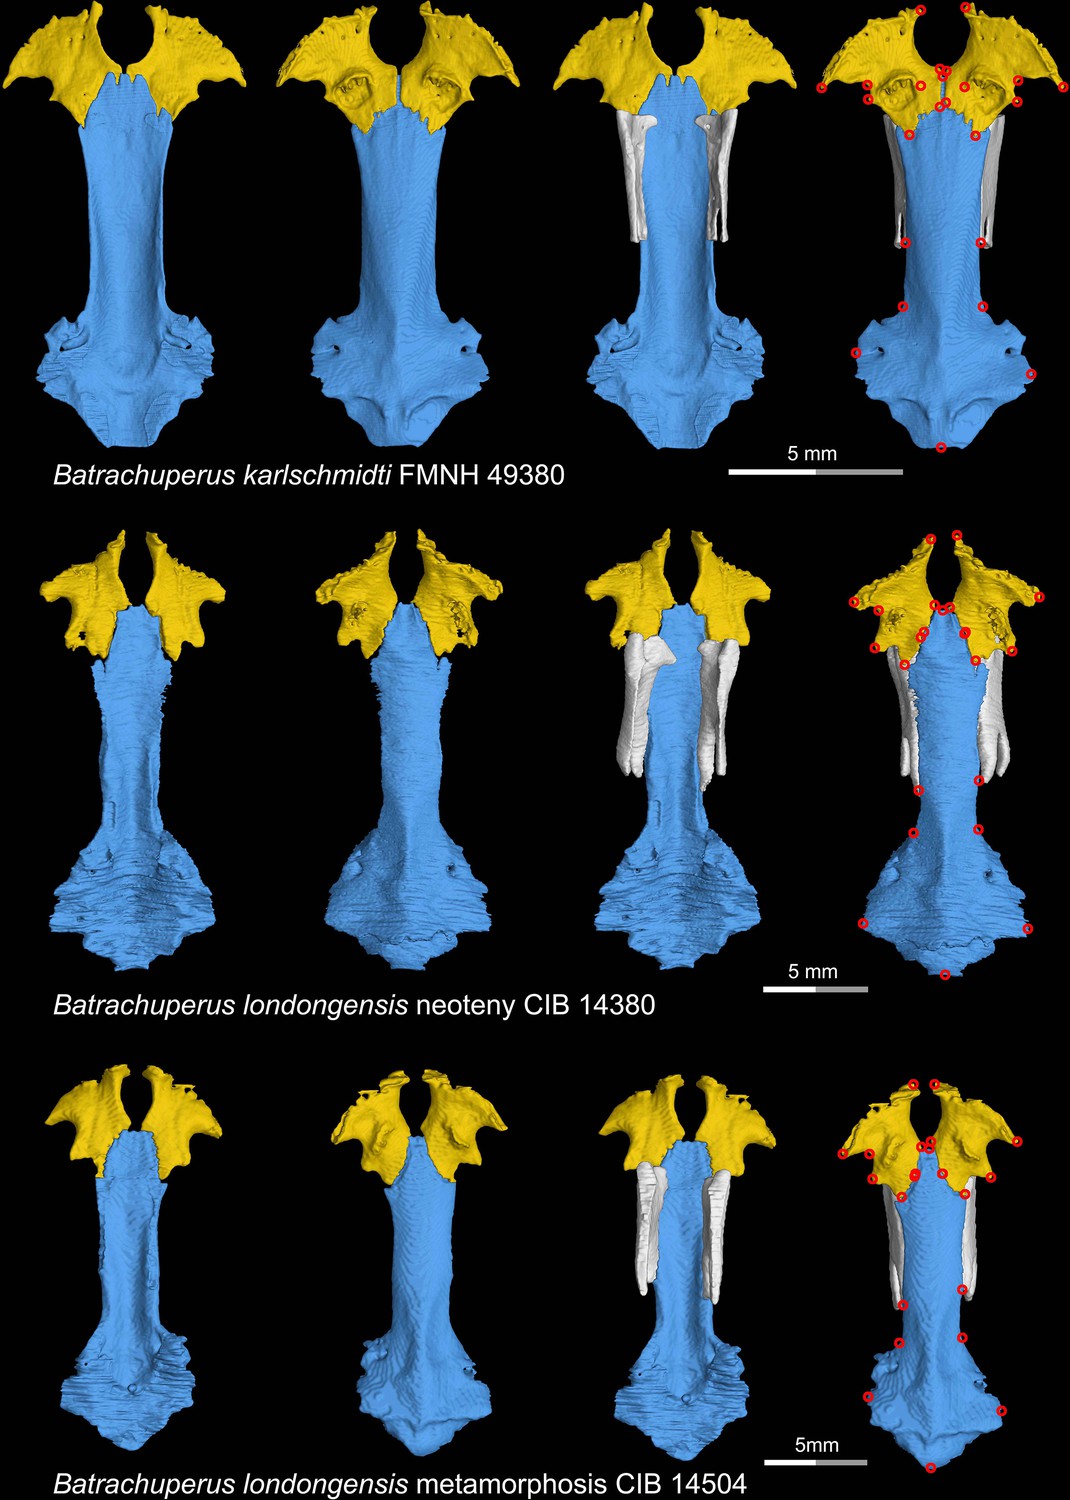
CT rendering of the palate and orbitosphenoid of two species of living hynobiid Batrachuperus in dorsal (first and third columns) and ventral (second and fourth columns) views.
Landmarks are represented by red circles in the last column. Note that representative specimens of both neotenic (middle row) and metamorphosed (lower row) Batrachuperus londongensis are included in this study. CIB, Chengdu Institute of Biology, Chinese Academy of Sciences, Chengdu, Sichuan Province, China; FMNH, Field Museum of Natural History, Chicago, Illinois, USA.
Figure 1—figure supplement 4
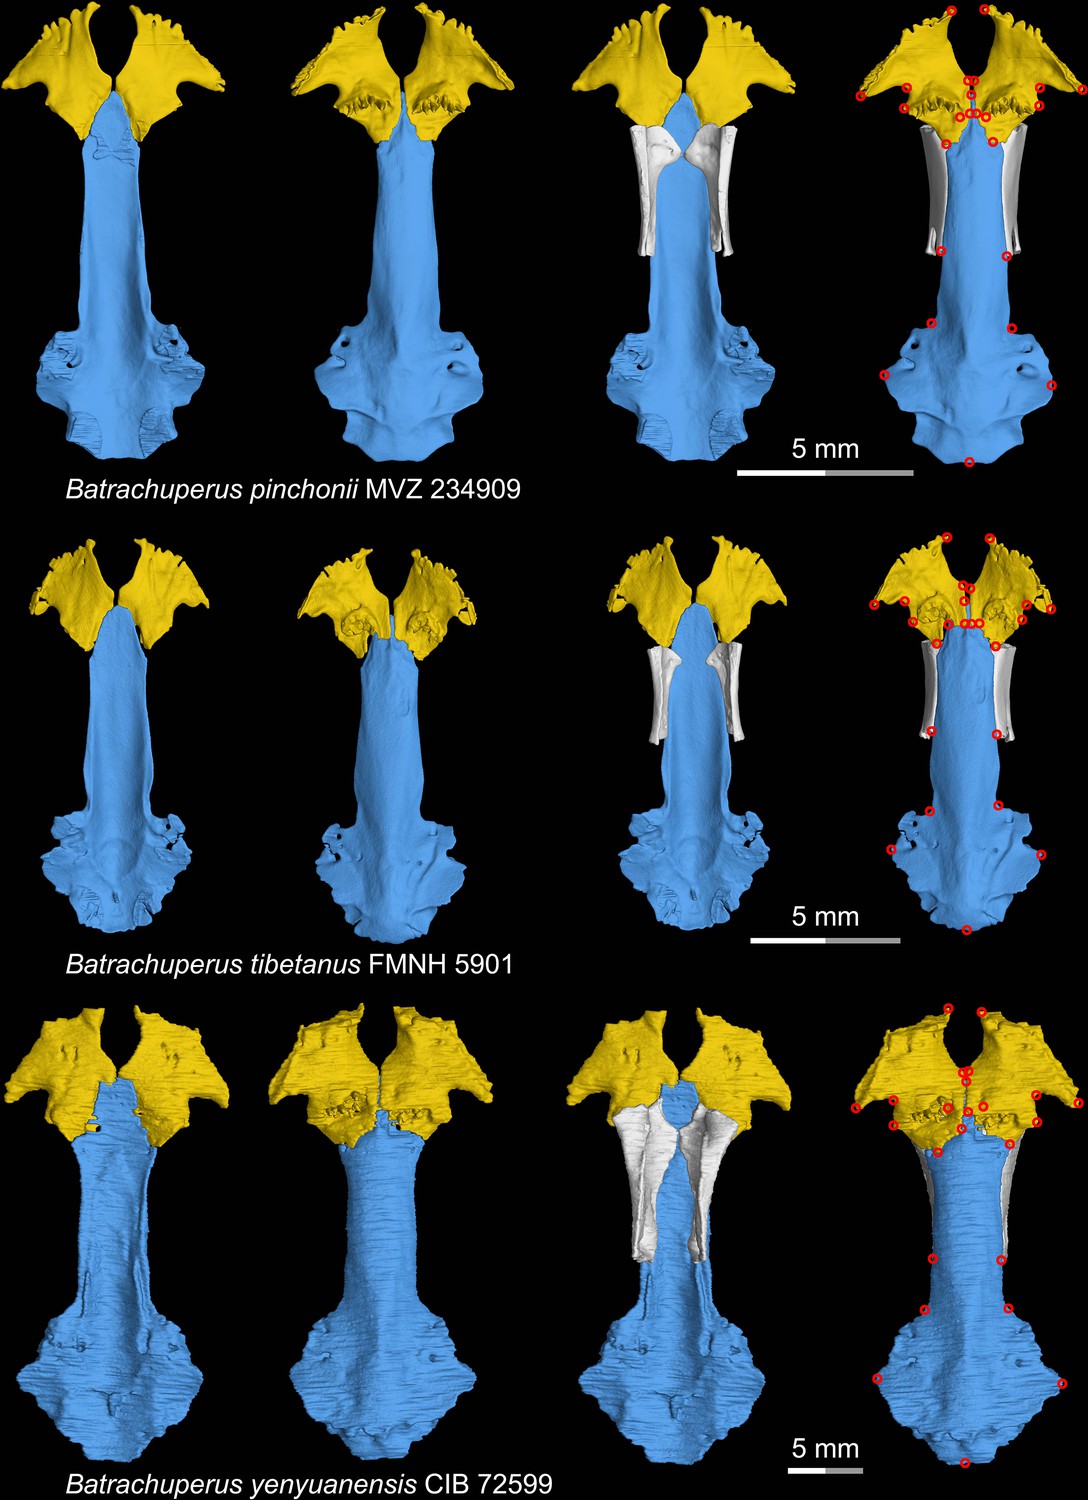
CT rendering of the palate and orbitosphenoid of three species of living hynobiid Batrachuperus in dorsal (first and third columns) and ventral (second and fourth columns) views.
Landmarks are represented by red circles in the last column. CIB, Chengdu Institute of Biology, Chinese Academy of Sciences, Chengdu, Sichuan Province, China; FMNH, Field Museum of Natural History, Chicago, Illinois, USA; MVZ, Museum of Vertebrate Zoology, Berkeley, California, USA.
Figure 1—figure supplement 5
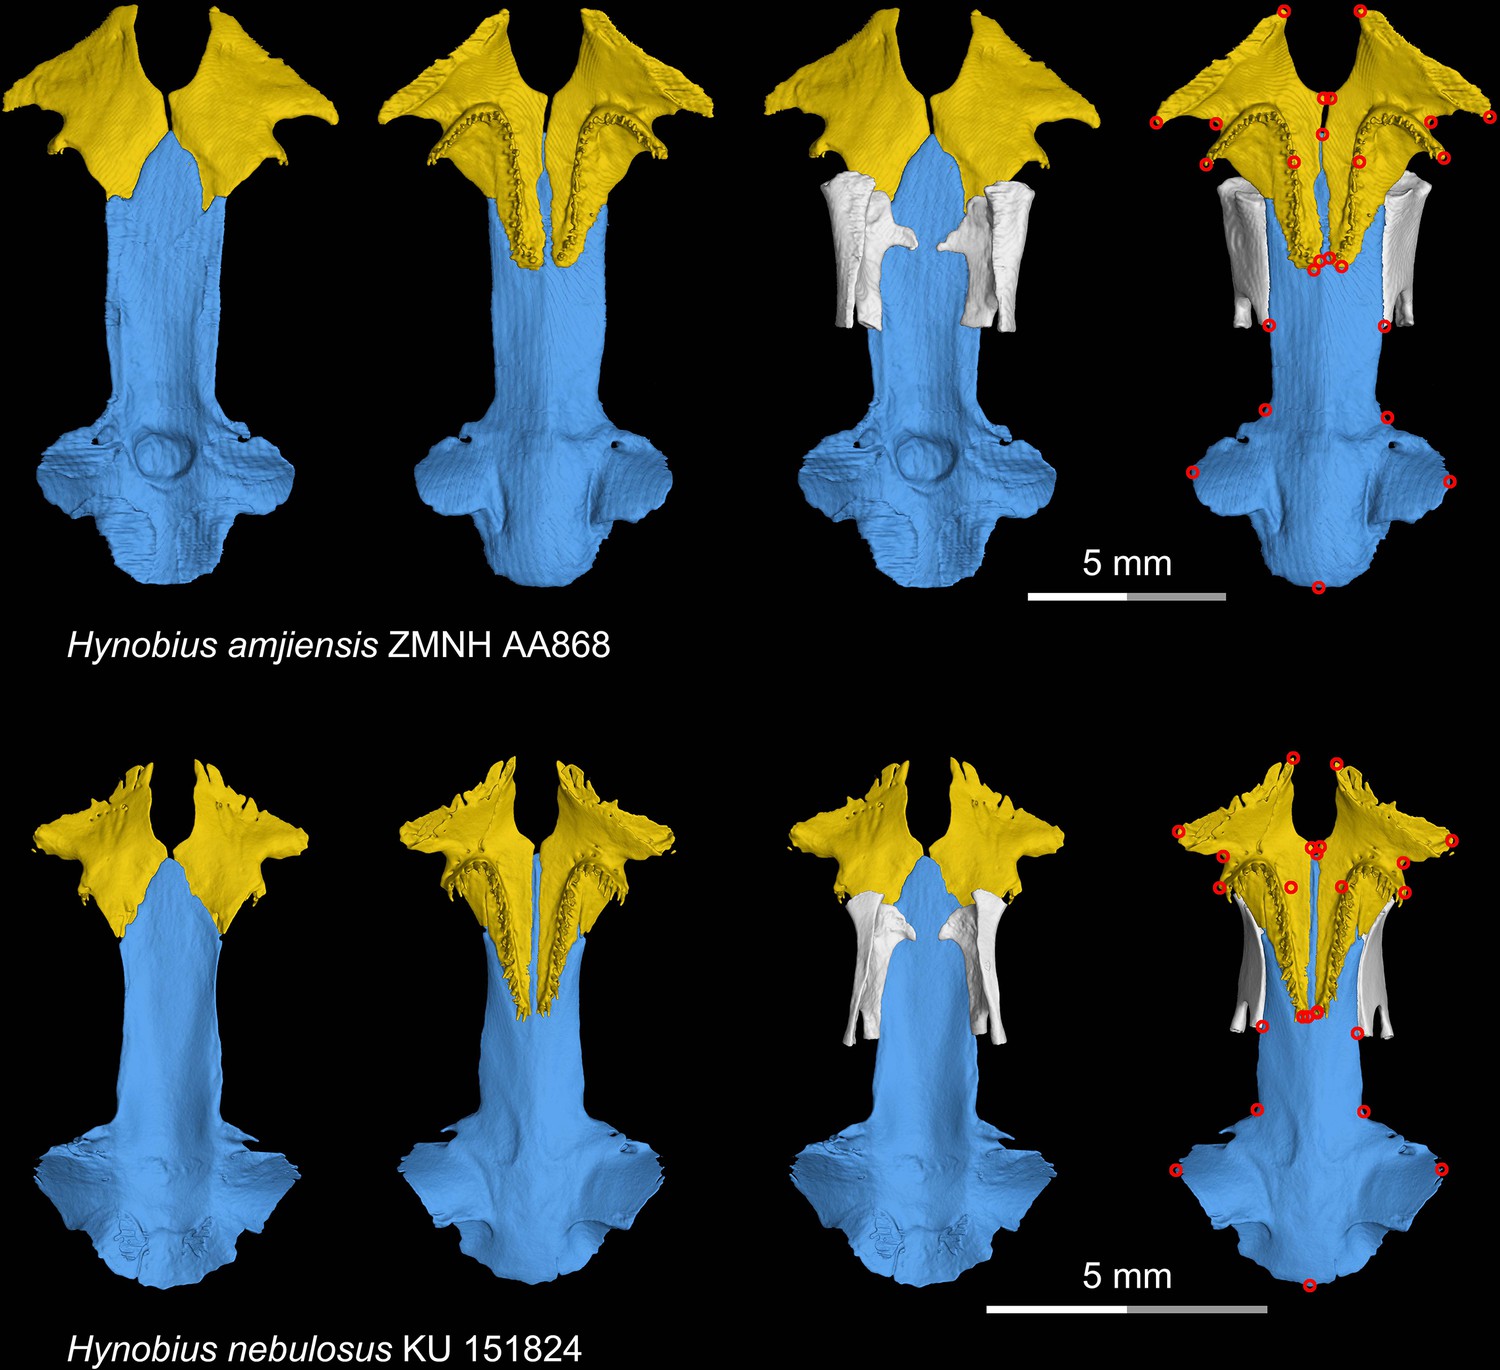
CT rendering of the palate and orbitosphenoid of two species of living hynobiid Hynobius in dorsal (first and third columns) and ventral (second and fourth columns) views.
Landmarks are represented by red circles in the last column. ZMNH, Zhejiang Museum of Natural History, Hangzhou, Zhejiang Province, China; KU, University of Kansas Center for Research Inc, Lawrence, Kansas, USA.
Figure 1—figure supplement 6

CT rendering of the palate and orbitosphenoid of two species of living hynobiid Liua in dorsal (first and third columns) and ventral (second and fourth columns) views.
Landmarks are represented by red circles in the last column. CIB, Chengdu Institute of Biology, Chinese Academy of Sciences, Chengdu, Sichuan Province, China.
Figure 1—figure supplement 7
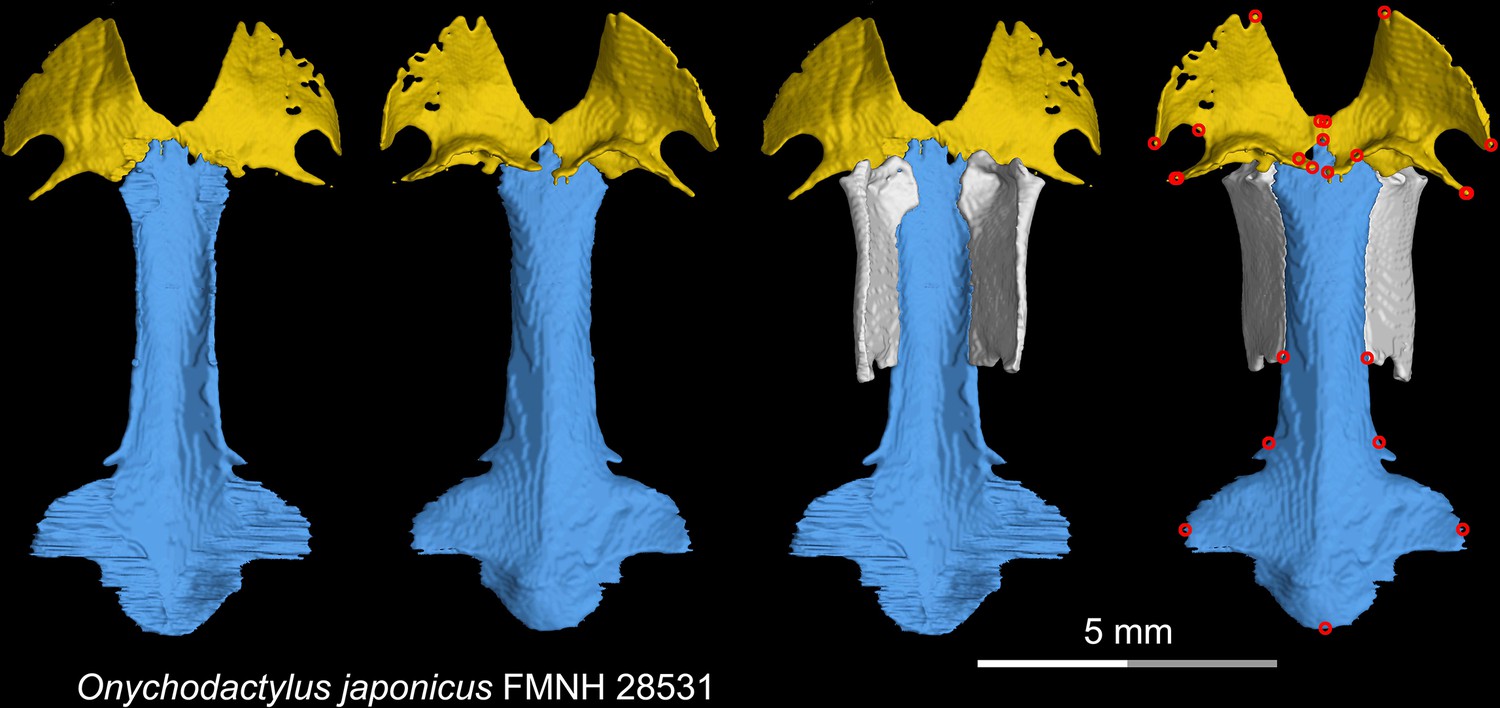
CT rendering of the palate and orbitosphenoid of the living hynobiid Onychodactylus japonicus in dorsal (first and third columns) and ventral (second and fourth columns) views.
Landmarks are represented by red circles in the last column. FMNH, Field Museum of Natural History, Chicago, Illinois, USA.
Figure 1—figure supplement 8
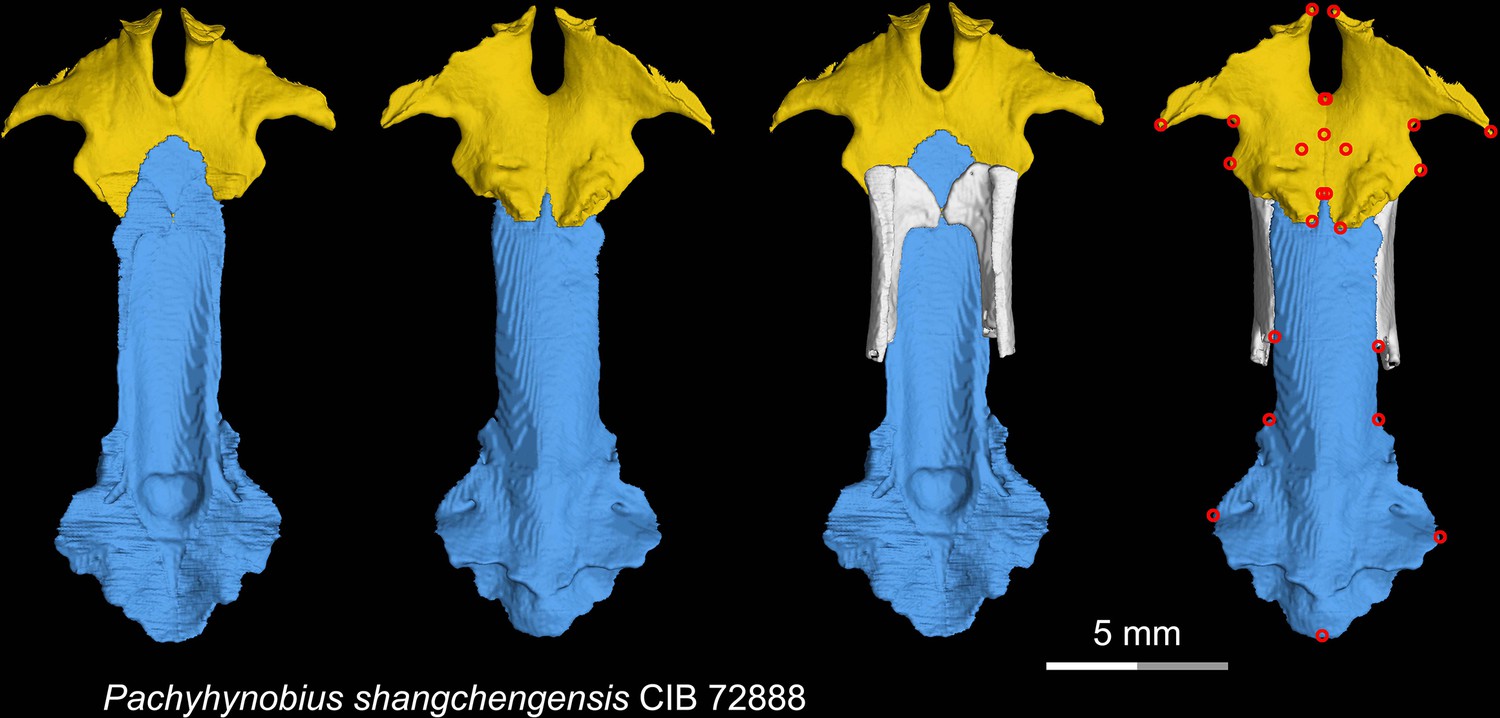
CT rendering of the palate and orbitosphenoid of the living hynobiid Pachyhynobius shangchengensis in dorsal (first and third columns) and ventral (second and fourth columns) views.
Landmarks are represented by red circles in the last column. CIB, Chengdu Institute of Biology, Chinese Academy of Sciences, Chengdu, Sichuan Province, China.
Figure 1—figure supplement 9
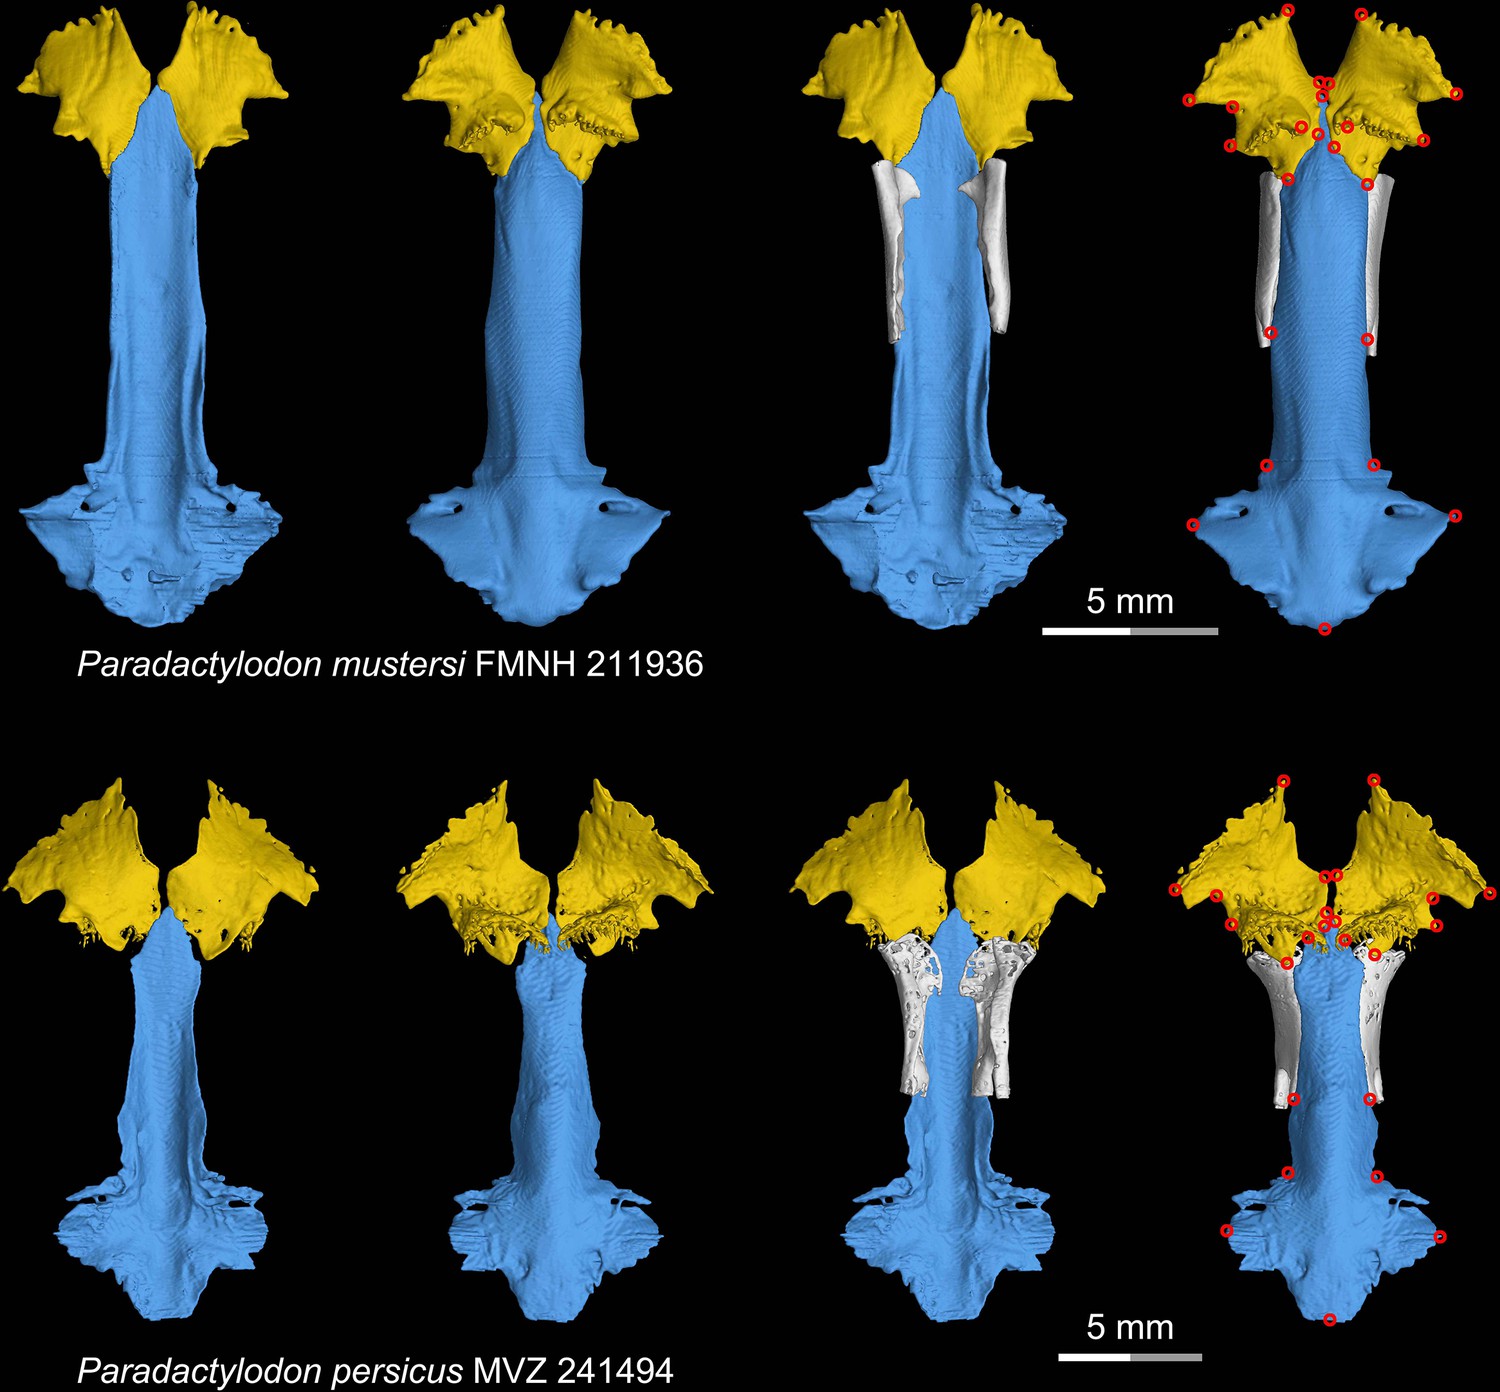
CT rendering of the palate and orbitosphenoid of two species of the living hynobiid Paradactylodon in dorsal (first and third columns) and ventral (second and fourth columns) views.
Landmarks are represented by red circles in the last column. FMNH, Field Museum of Natural History, Chicago, Illinois, USA; MVZ, Museum of Vertebrate Zoology, Berkeley, California, USA.
Figure 1—figure supplement 10
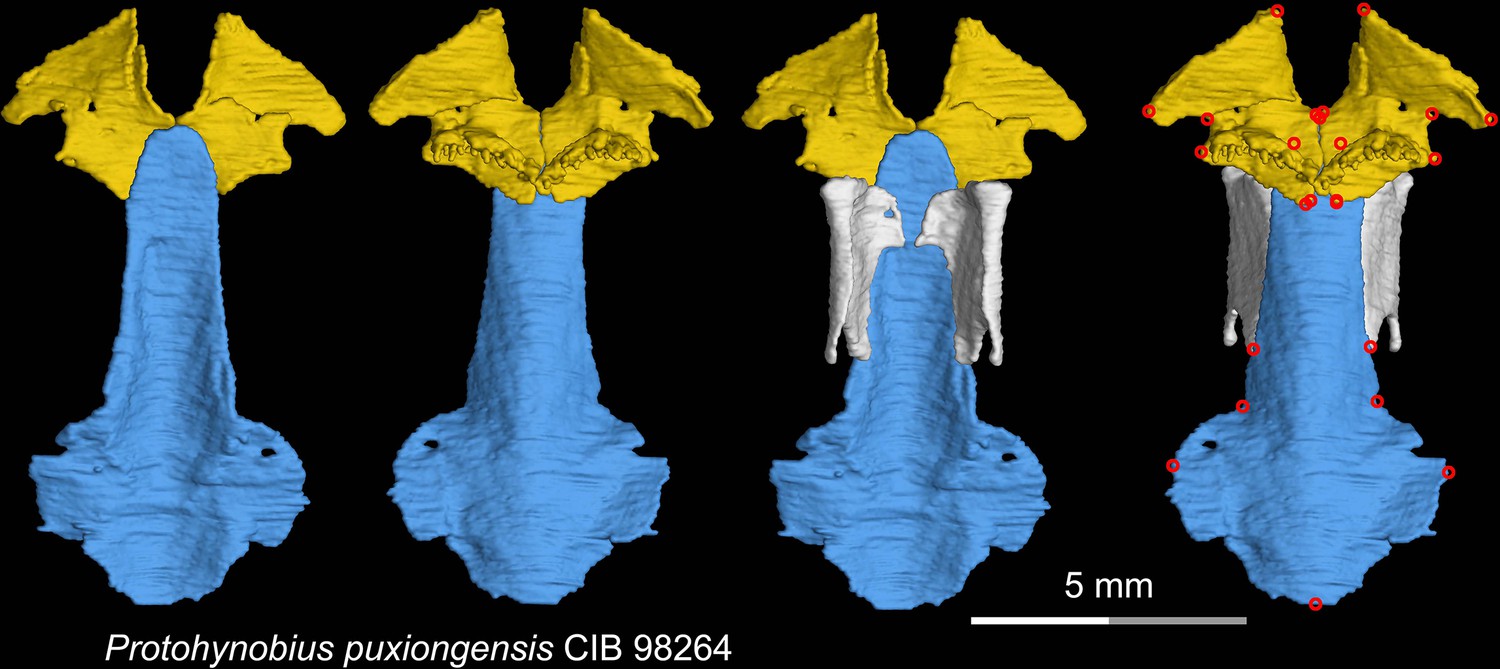
CT rendering of the palate and orbitosphenoid of the living hynobiid Protohynobius puxiongensis in dorsal (first and third columns) and ventral (second and fourth columns) views.
Landmarks are represented by red circles in the last column. CIB, Chengdu Institute of Biology, Chinese Academy of Sciences, Chengdu, Sichuan Province, China.
Figure 1—figure supplement 11
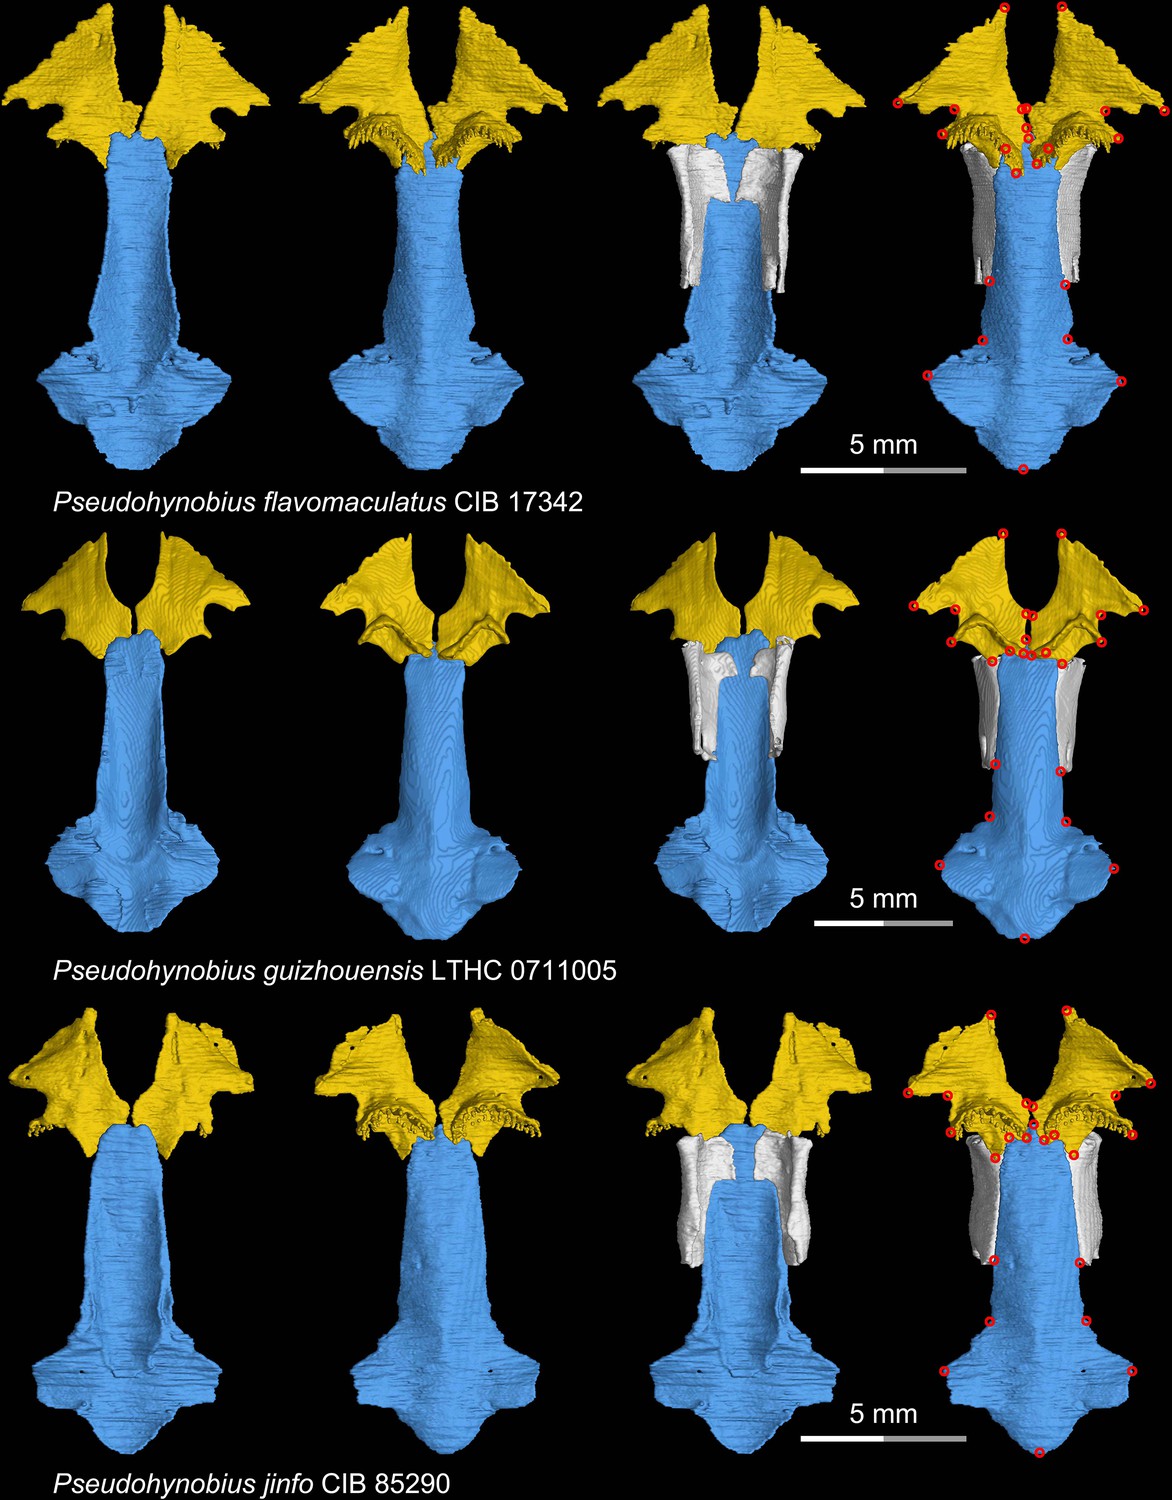
CT rendering of the palate and orbitosphenoid of three species of the living hynobiid Pseudohynobius in dorsal (first and third columns) and ventral (second and fourth columns) views.
Landmarks are represented by red circles in the last column. CIB, Chengdu Institute of Biology, Chinese Academy of Sciences, Chengdu, Sichuan Province, China; LTHC, Liupanshui Normal University, Liupanshui, Guizhou Province, China.
Figure 1—figure supplement 12

CT rendering of the palate and orbitosphenoid of two species of the living hynobiid Pseudohynobius in dorsal (first and third columns) and ventral (second and fourth columns) views.
Landmarks are represented by red circles in the last column. LTHC, Liupanshui Normal University, Liupanshui, Guizhou Province, China; ZMU, Zunyi Medical University, Zunyi, Guizhou Province, China.
Figure 1—figure supplement 13

CT rendering of the palate and orbitosphenoid of the living hynobiid Ranodon sibiricus in dorsal (first and third columns) and ventral (second and fourth columns) views.
Landmarks are represented by red circles in the last column. FMNH, Field Museum of Natural History, Chicago, Illinois, USA.
Figure 1—figure supplement 14
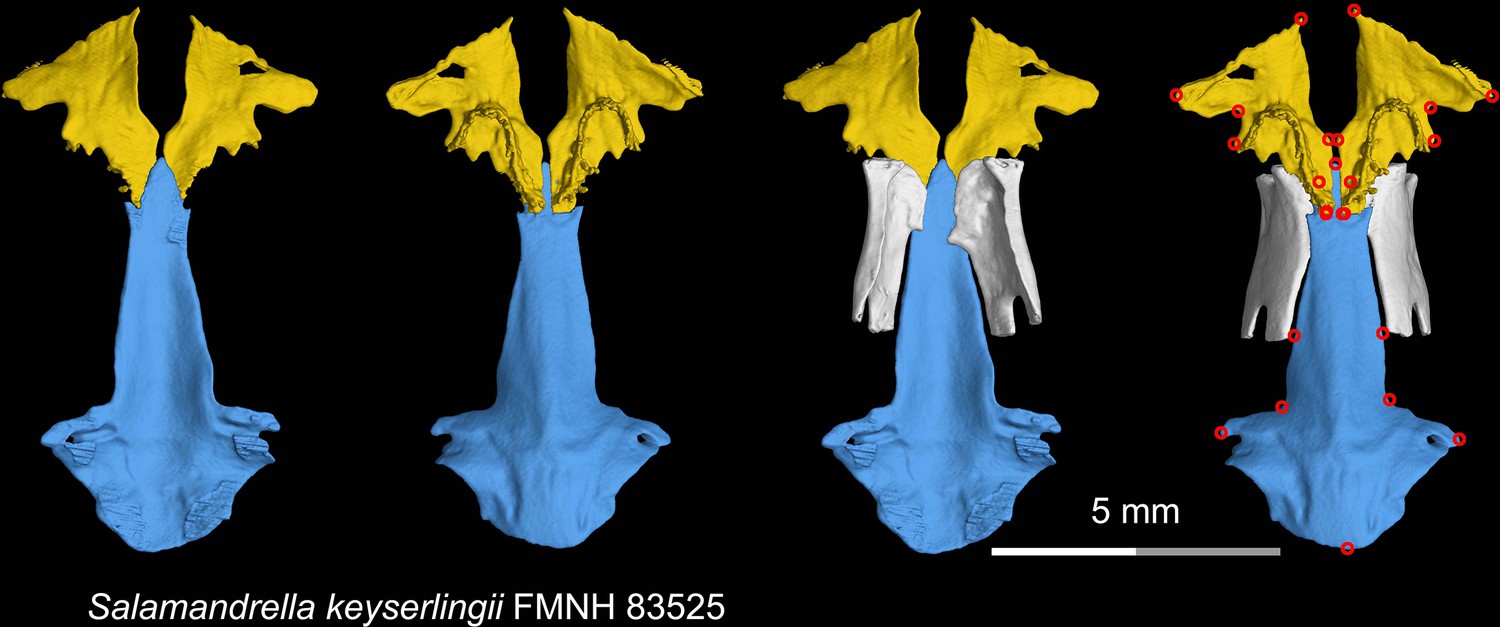
CT rendering of the palate and orbitosphenoid of the living hynobiid Salamandrella keyserlingii in dorsal (first and third columns) and ventral (second and fourth columns) views.
Landmarks are represented by red circles in the last column. FMNH, Field Museum of Natural History, Chicago, Illinois, USA.
Figure 1—figure supplement 15
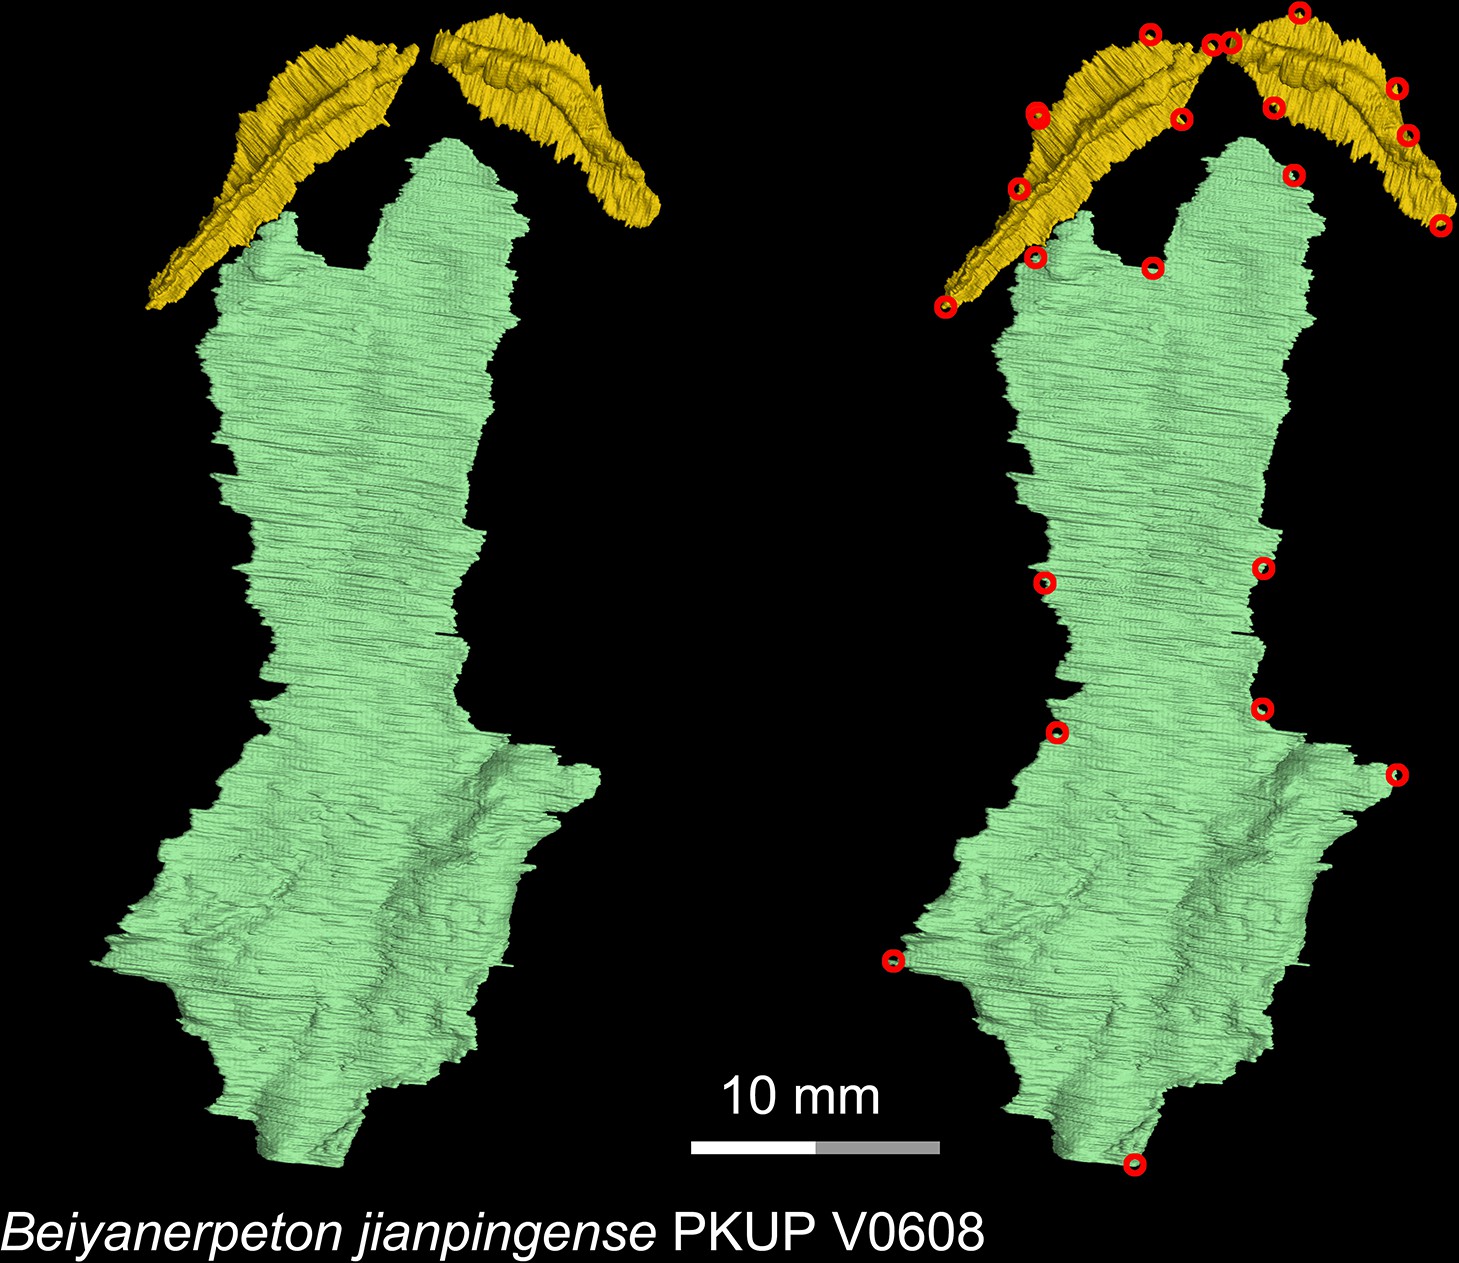
CT rendering of the palate of the Late Jurassic basal salamandroid Beiyanerpeton jianpingense in ventral view.
Landmarks are represented by red circles in the second column. PKUP, Peking University Paleontological Collections, Beijing, China.
Figure 1—figure supplement 16
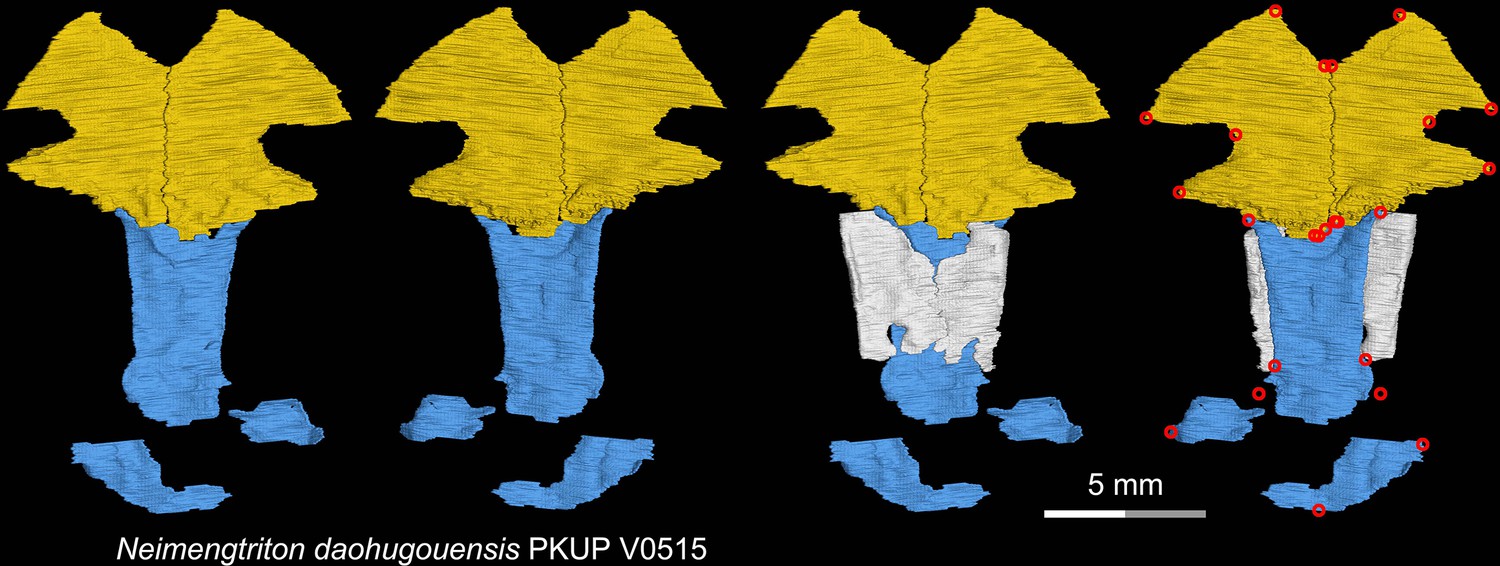
CT rendering of the palate and orbitosphenoid of the Middle Jurassic stem hynobiid Neimengtriton daohugouensis in dorsal (first and third columns) and ventral (second and fourth columns) views.
Landmarks are represented by red circles in the last column. PKUP, Peking University Paleontological Collections, Beijing, China.
Figure 1—figure supplement 17
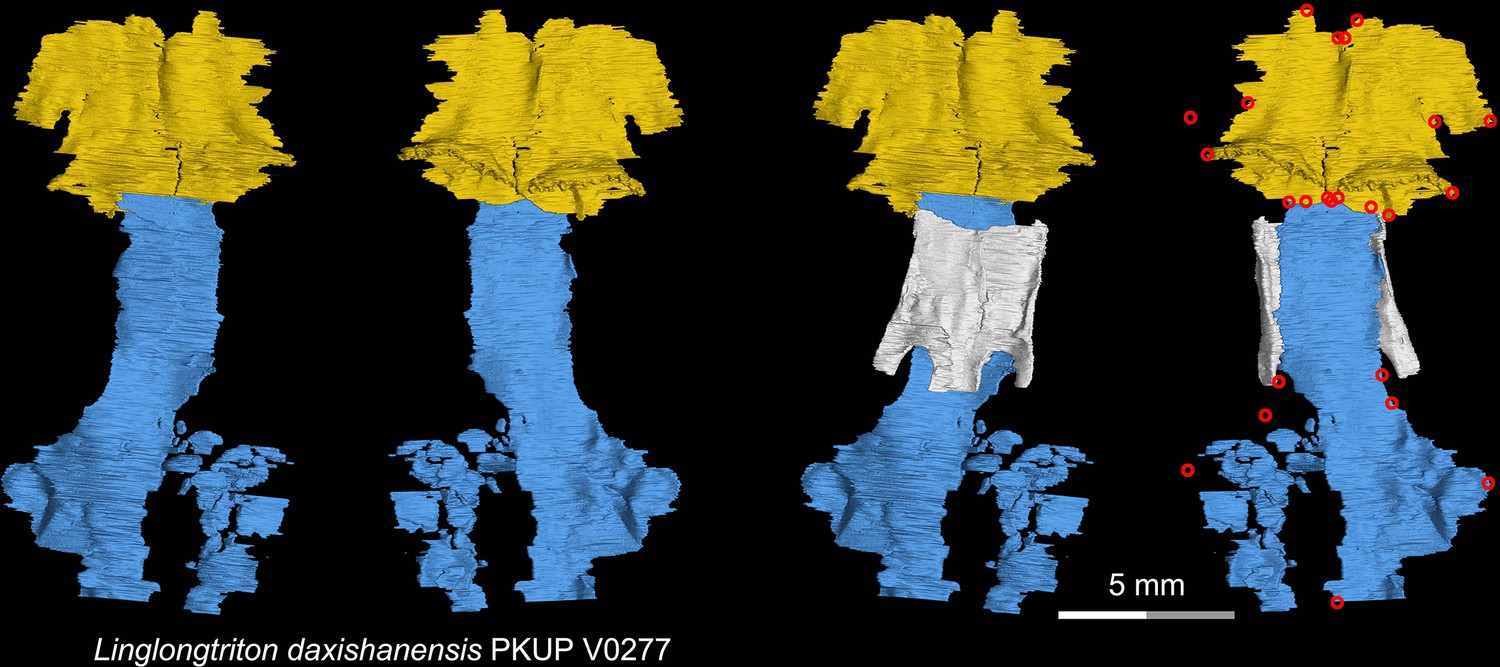
CT rendering of the palate and orbitosphenoid of the Late Jurassic stem hynobiid Linglongtriton daxishanensis in dorsal (first and third columns) and ventral (second and fourth columns) views.
Landmarks are represented by red circles in the last column. PKUP, Peking University Paleontological Collections, Beijing, China.
Figure 1—figure supplement 18
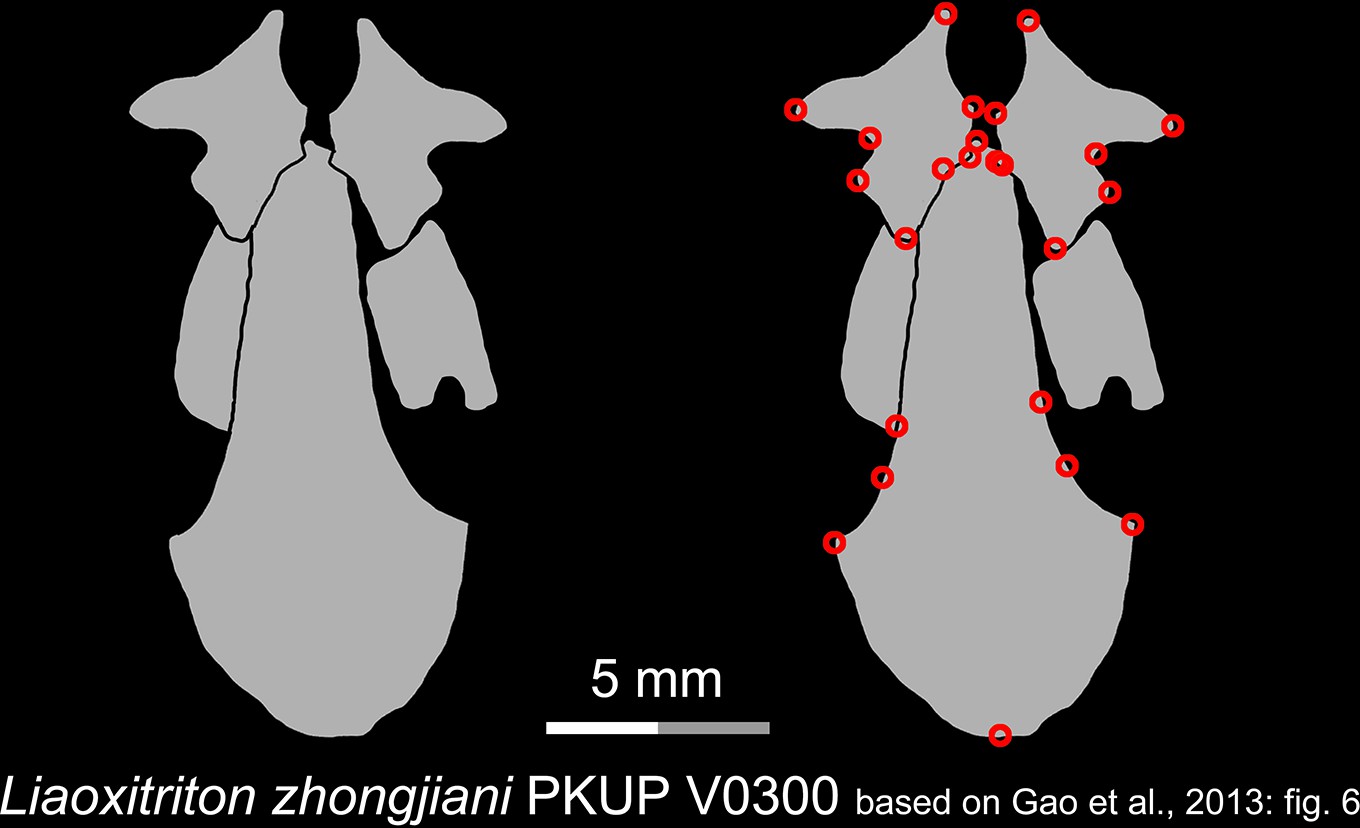
Line drawings of the palate and orbitosphenoid of the Early Cretaceous stem hynobiid Liaoxitriton zhongjiani in ventral view.
Landmarks are represented by red circles in the second column. PKUP, Peking University Paleontological Collections, Beijing, China. Modified from Gao et al., 2013.
Figure 1—figure supplement 19
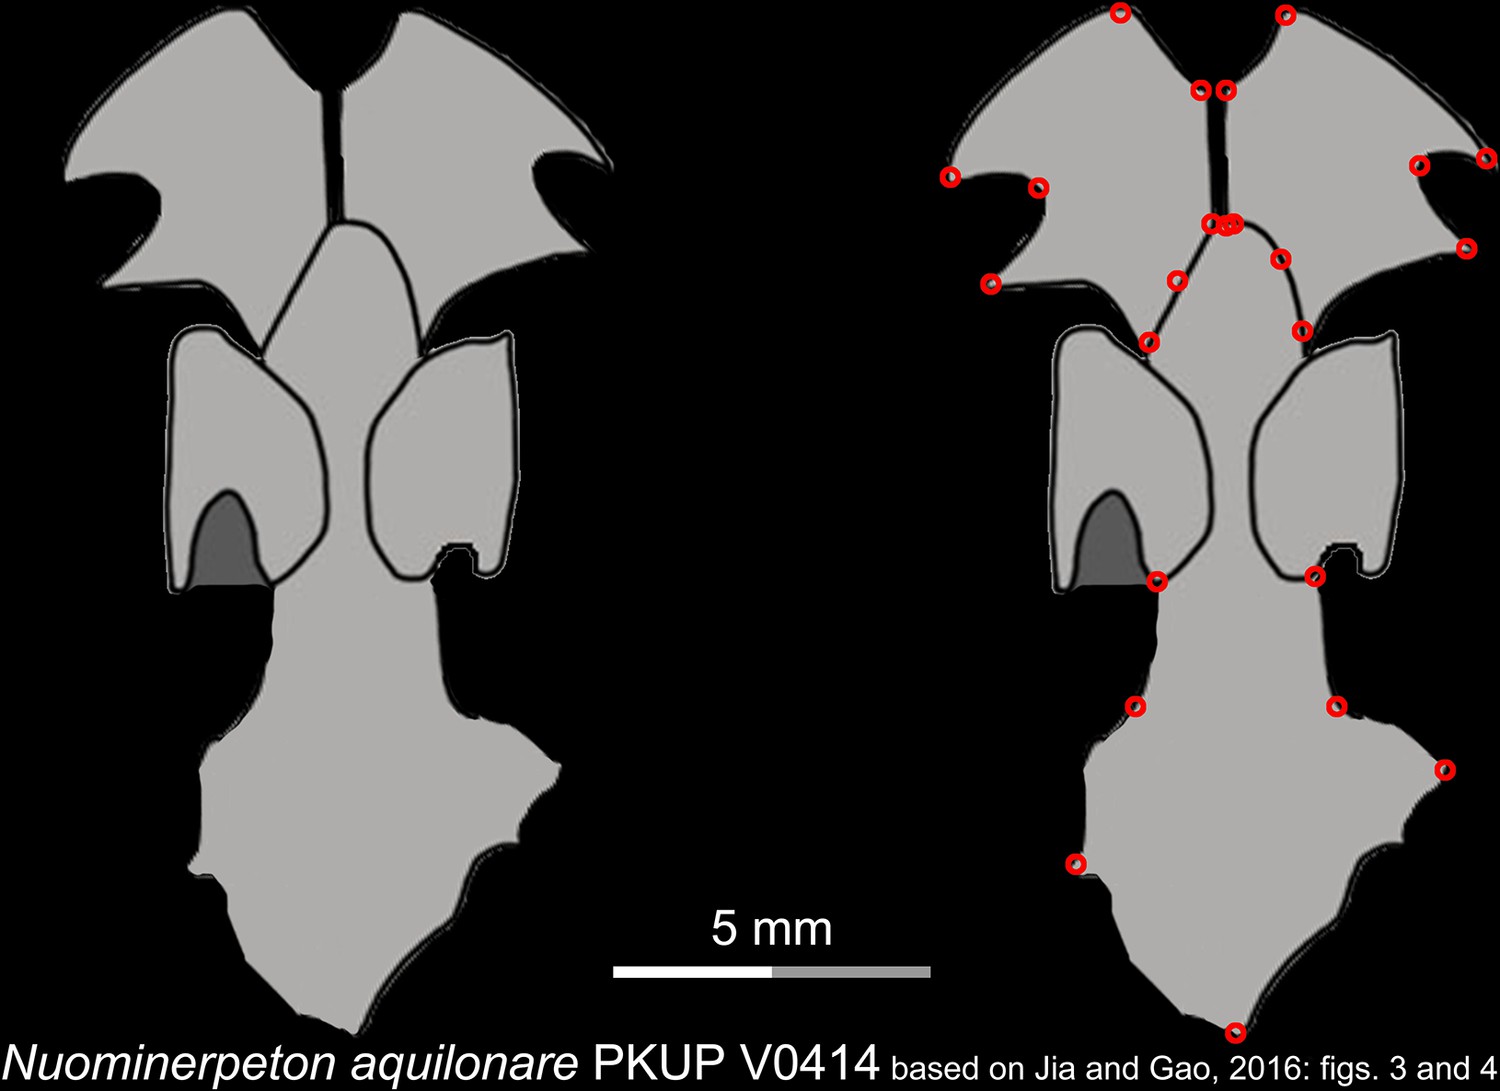
Line drawings of the palate and orbitosphenoid of the Early Cretaceous stem hynobiid Nuominerpeton aquilonare in ventral view.
Landmarks are represented by red circles in the second column. PKUP, Peking University Paleontological Collections, Beijing, China. Modified from Jia and Gao, 2016.
Figure 1—figure supplement 20
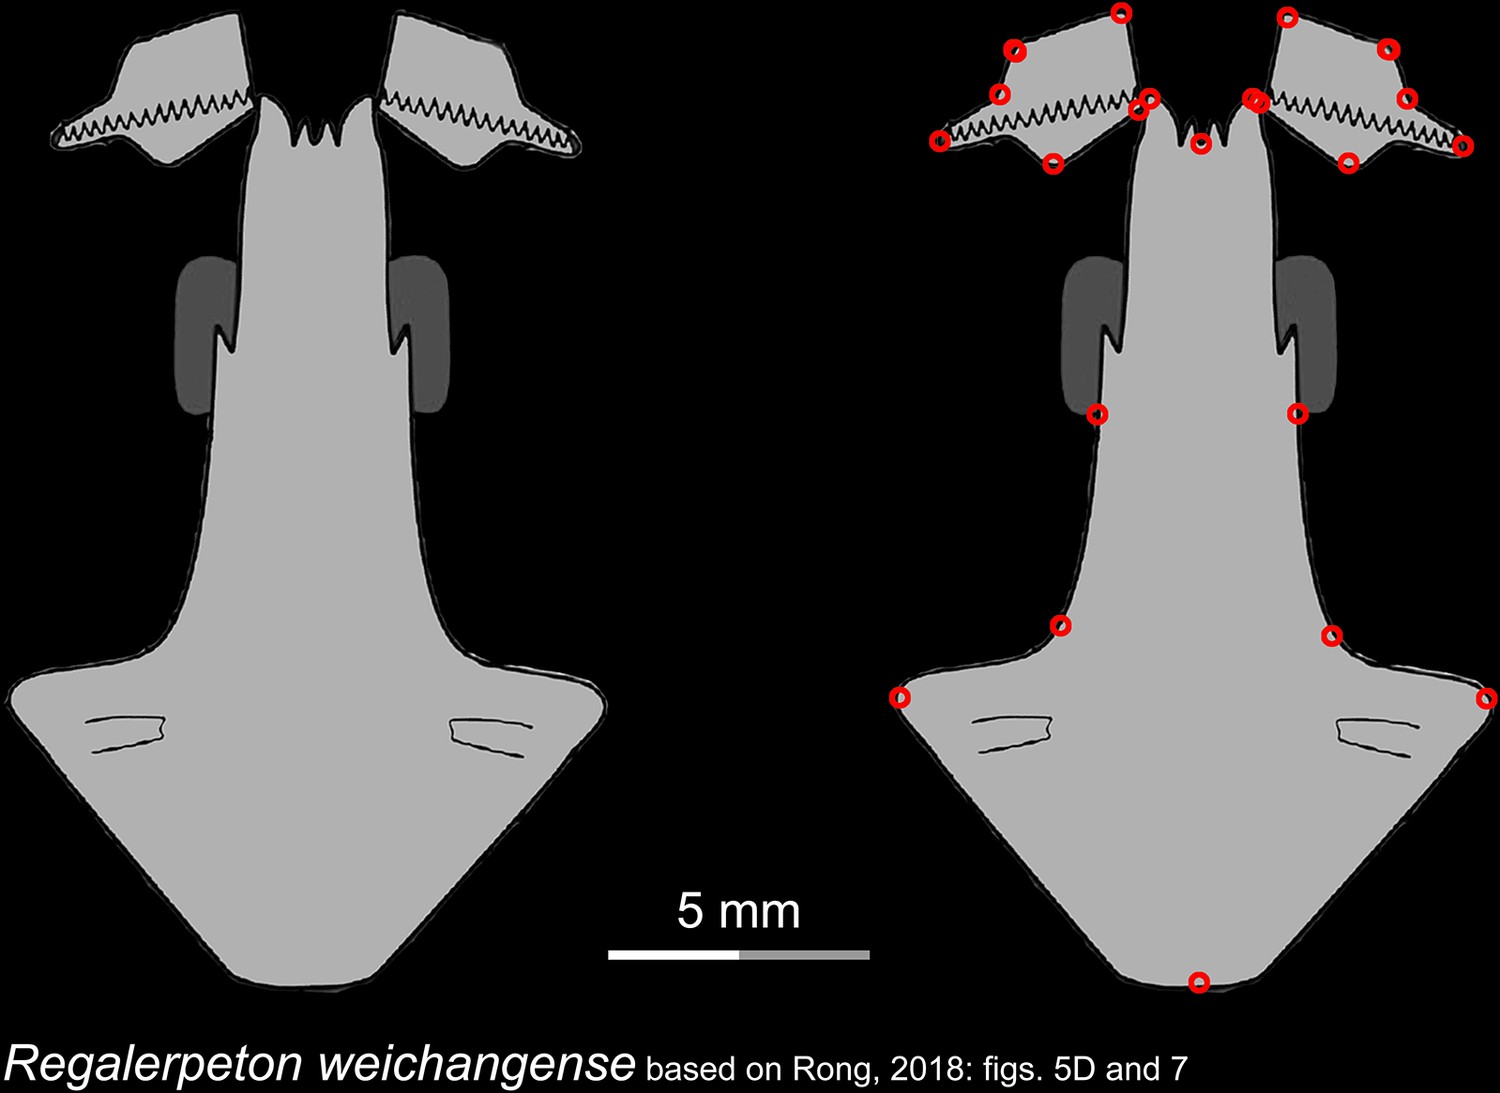
Line drawings of the palate and orbitosphenoid of the Early Cretaceous stem hynobiid Regalerpeton weichangense in ventral view.
Landmarks are represented by red circles in the second column. IVPP, Institute of Vertebrate Paleontology and Paleoanthropology, Chinese Academy of Sciences, Beijing, China. Modified from Rong, 2018.
Figure 1—figure supplement 21
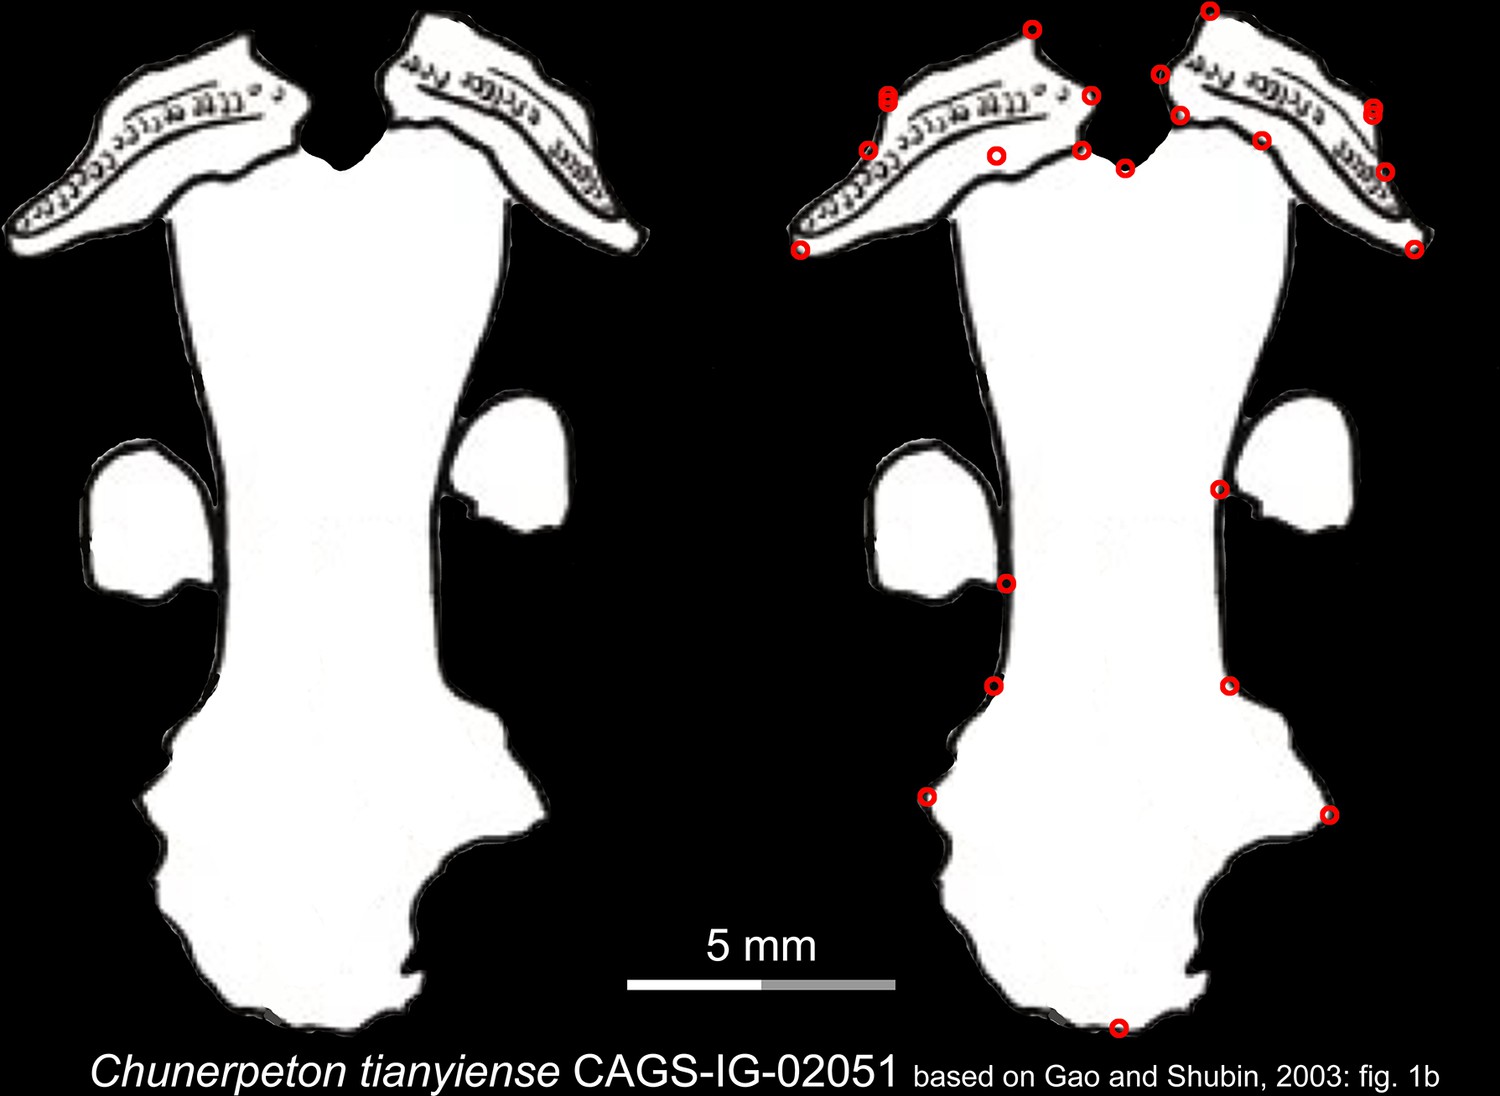
Line drawings of the palate and orbitosphenoid of the Middle Jurassic basal cryptobranchoid Chunerpeton tianyiense in ventral view.
Landmarks are represented by red circles in the second column. CAGS, Chinese Academy of Geological Sciences, Beijing, China. Modified from Gao and Shubin, 2003.
Figure 1—figure supplement 22
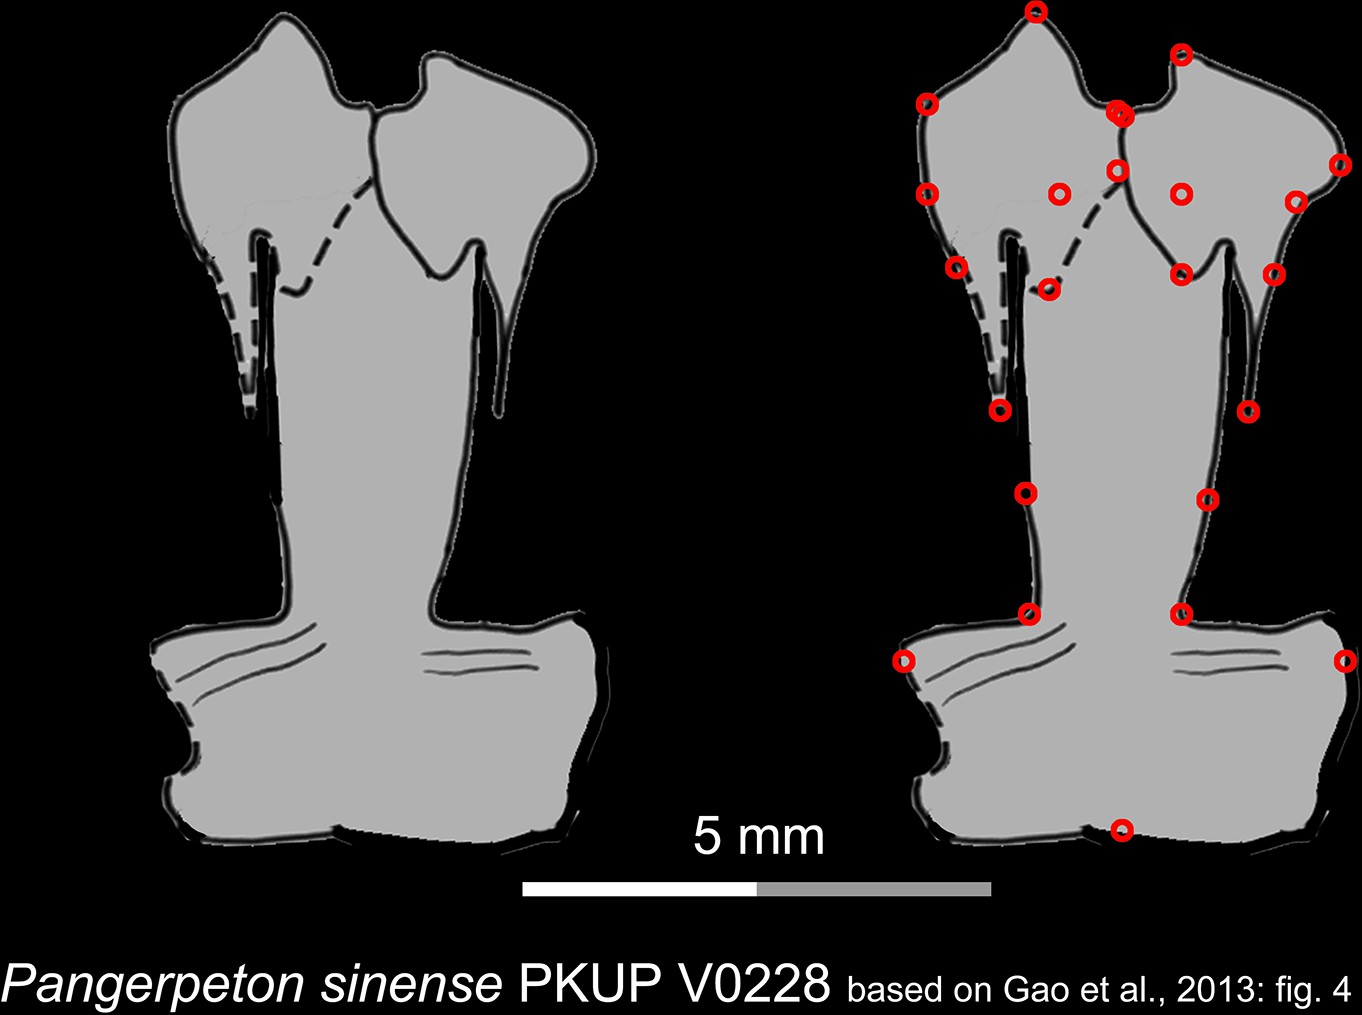
Line drawings of the palate of the Late Jurassic basal cryptobranchoid Pangerpeton sinense in ventral view.
Landmarks are represented by red circles in the second column. PKUP, Peking University Paleontological Collections, Beijing, China. Modified from Gao et al., 2013.
Figure 1—figure supplement 23
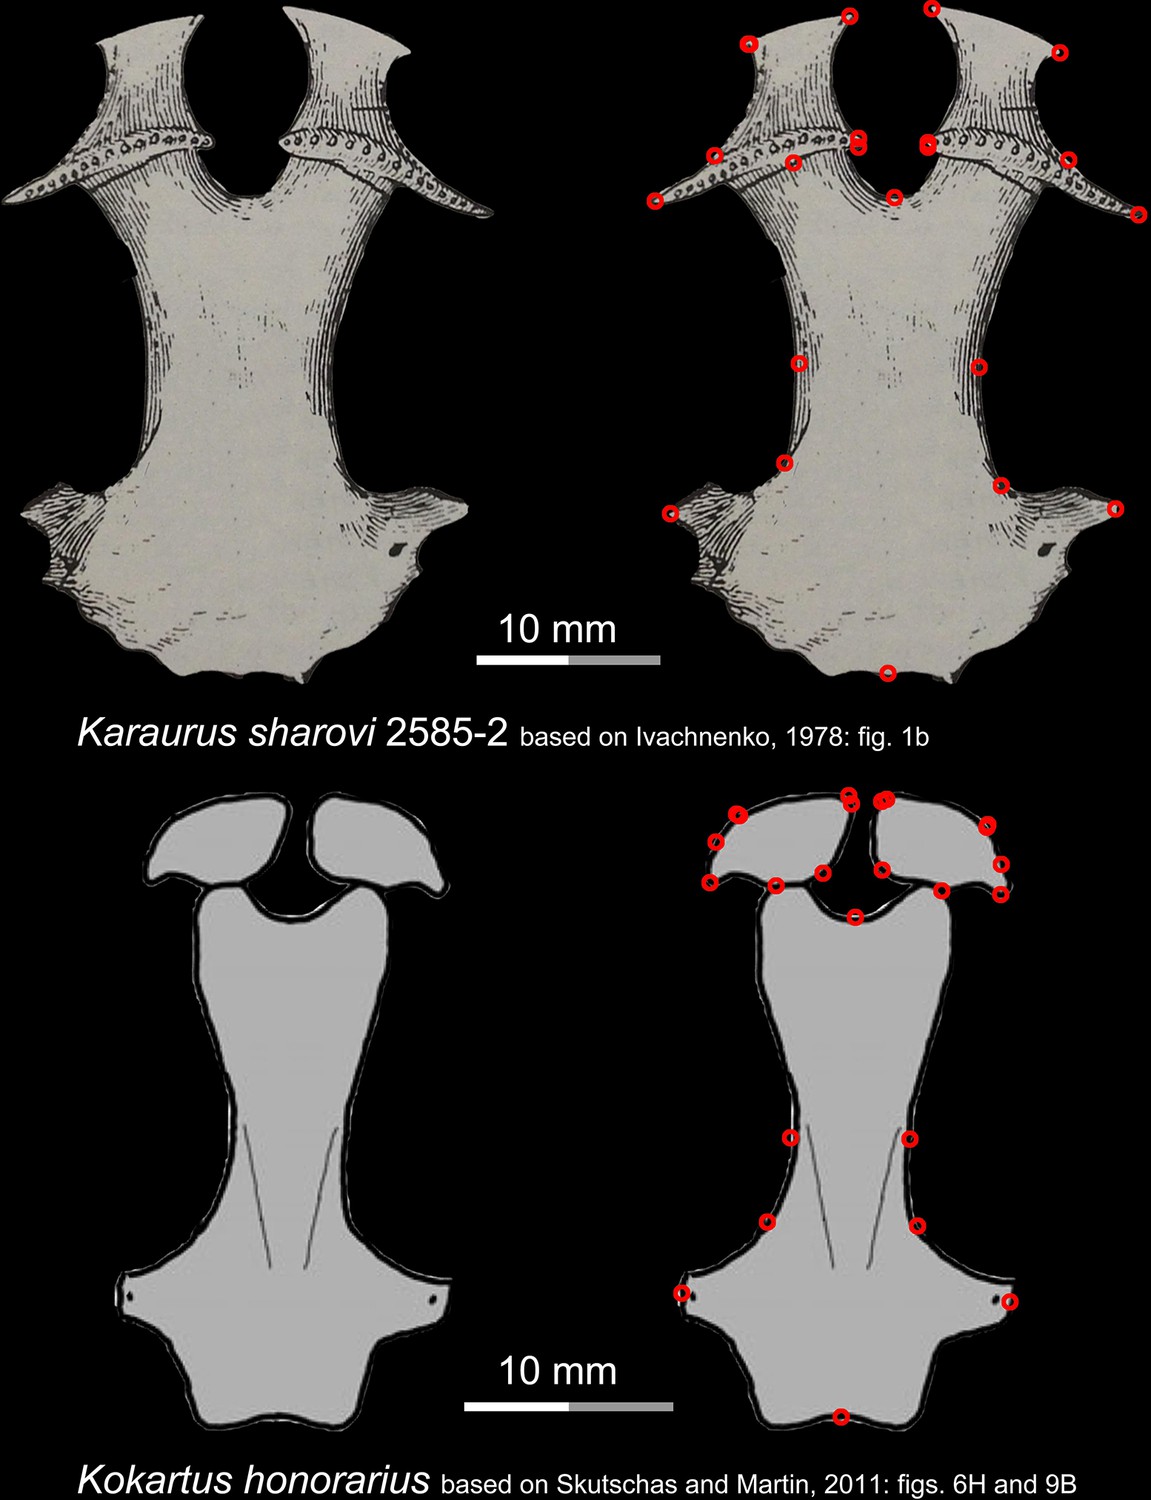
Ventral view of the palate of two stem urodeles, the Late Jurassic Karaurus sharovi (upper row) and the Middle Jurassic Kokartus honorarius (lower row).
Landmarks are represented by red circles in the second column. Modified from Ivachnenko, 1978; Skutschas and Martin, 2011.
Figure 1—figure supplement 24
The palate and phylogenic relationships of early salamanders with the inclusion of Aviturus.
(a) The vomer (gold) and parasphenoid (purple) of the palate in ventral view of the skull in living hynobiid Pseudohynobius flavomaculatus, with the object symmetry reflected by the mid-sagittal plane (red, semi-transparent); (b) dorsal view of the palate showing the articulation patterns with the paired orbitosphenoid (whitish); (c) enlarged view of the palate in ventral view with red circles corresponding to the 24 landmarks used for our geometric morphometric analysis; (d) palatal configurations of early salamanders in ventral view, with color-coded life history strategies (square block) and ecological preferences (line) plotted on the time-calibrated tree with the inclusion of Aviturus modified from Jetz and Pyron, 2018 and Jia et al., 2021a.
Figure 1—figure supplement 25

Configuration and superimposition of the 24 landmarks of the palate resulted from generalized Procrustes analyses across 70 specimens (a) and 34 species (b).
The wireframes connecting the landmarks represent the mean shape of the terminal taxa.
Figure 1—figure supplement 26

Time calibrated cladograms used in this study with both terminal and internal taxa numerically labeled.
(a) The cladogram of 34 species; (b) the cladogram of 35 species with the inclusion of Aviturus.
Figure 2 with 5 supplements
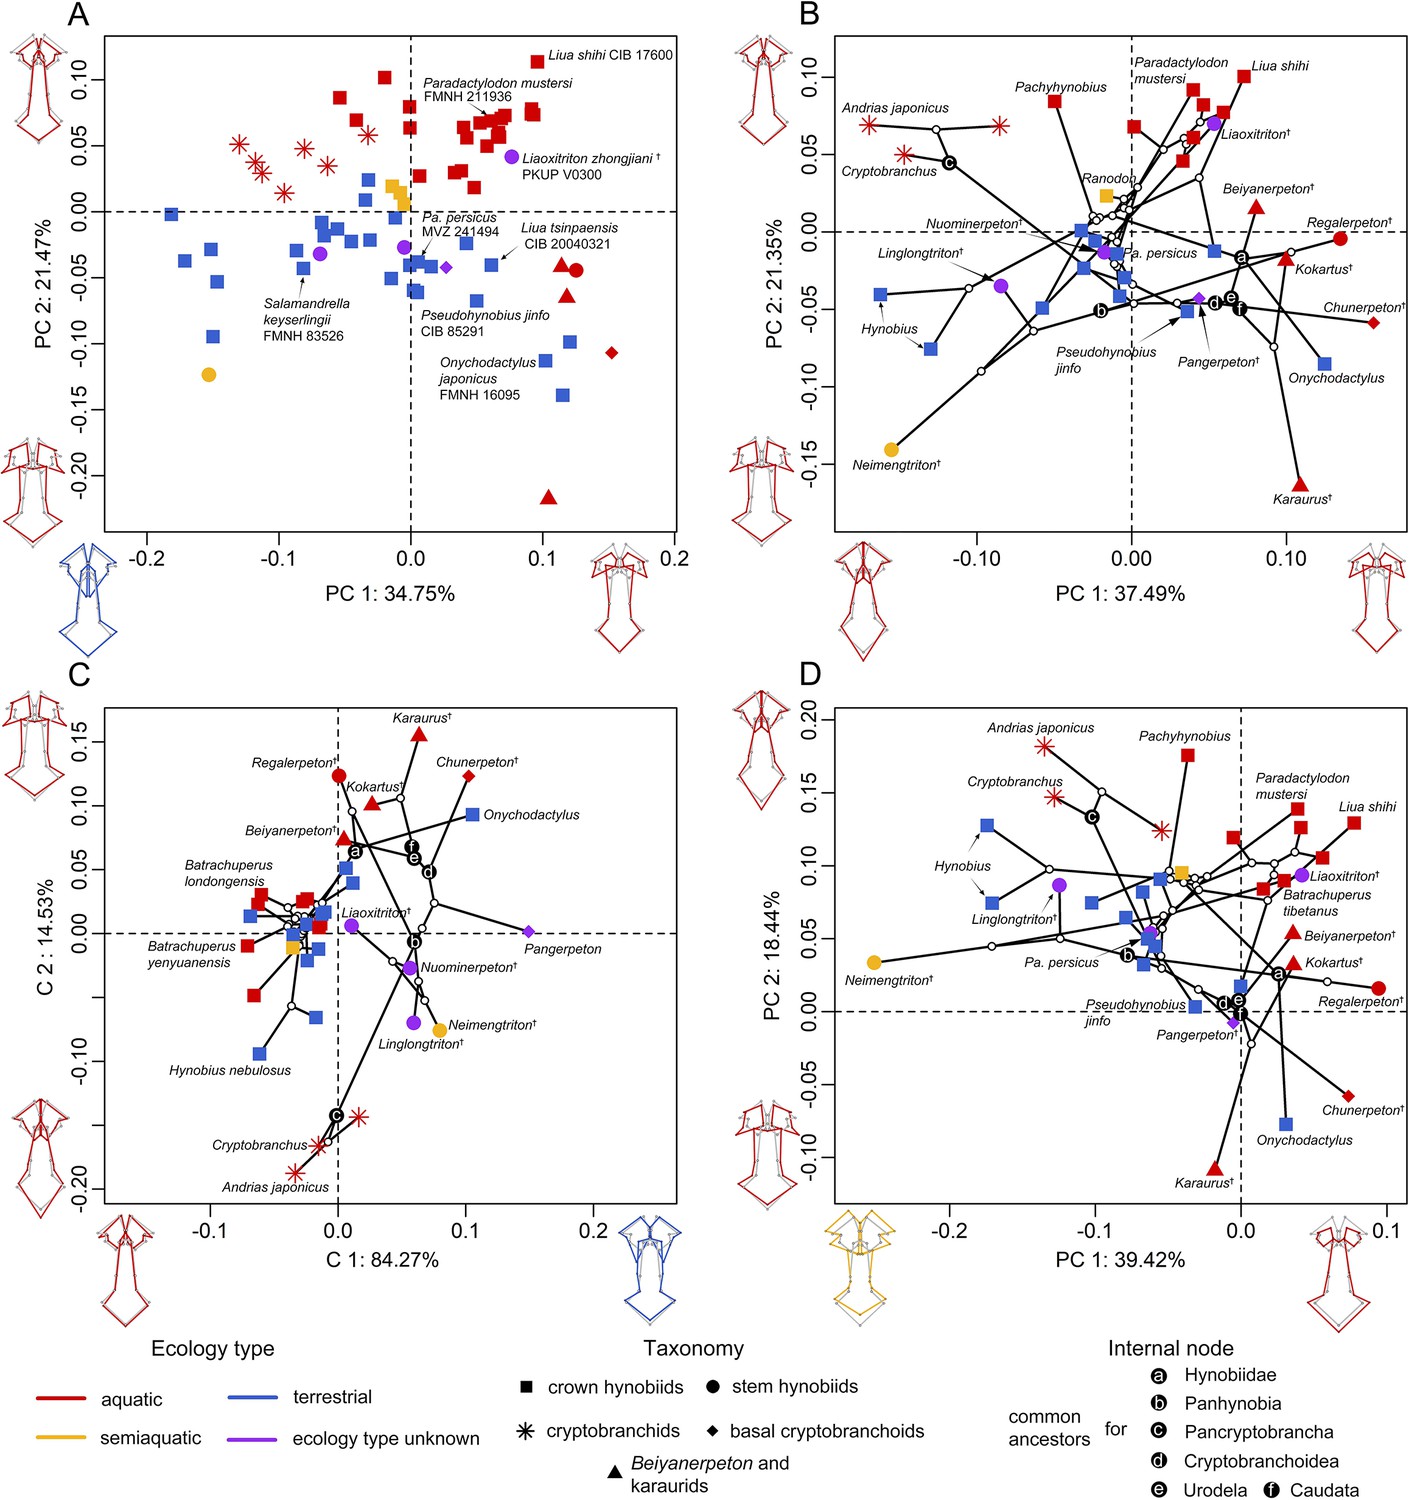
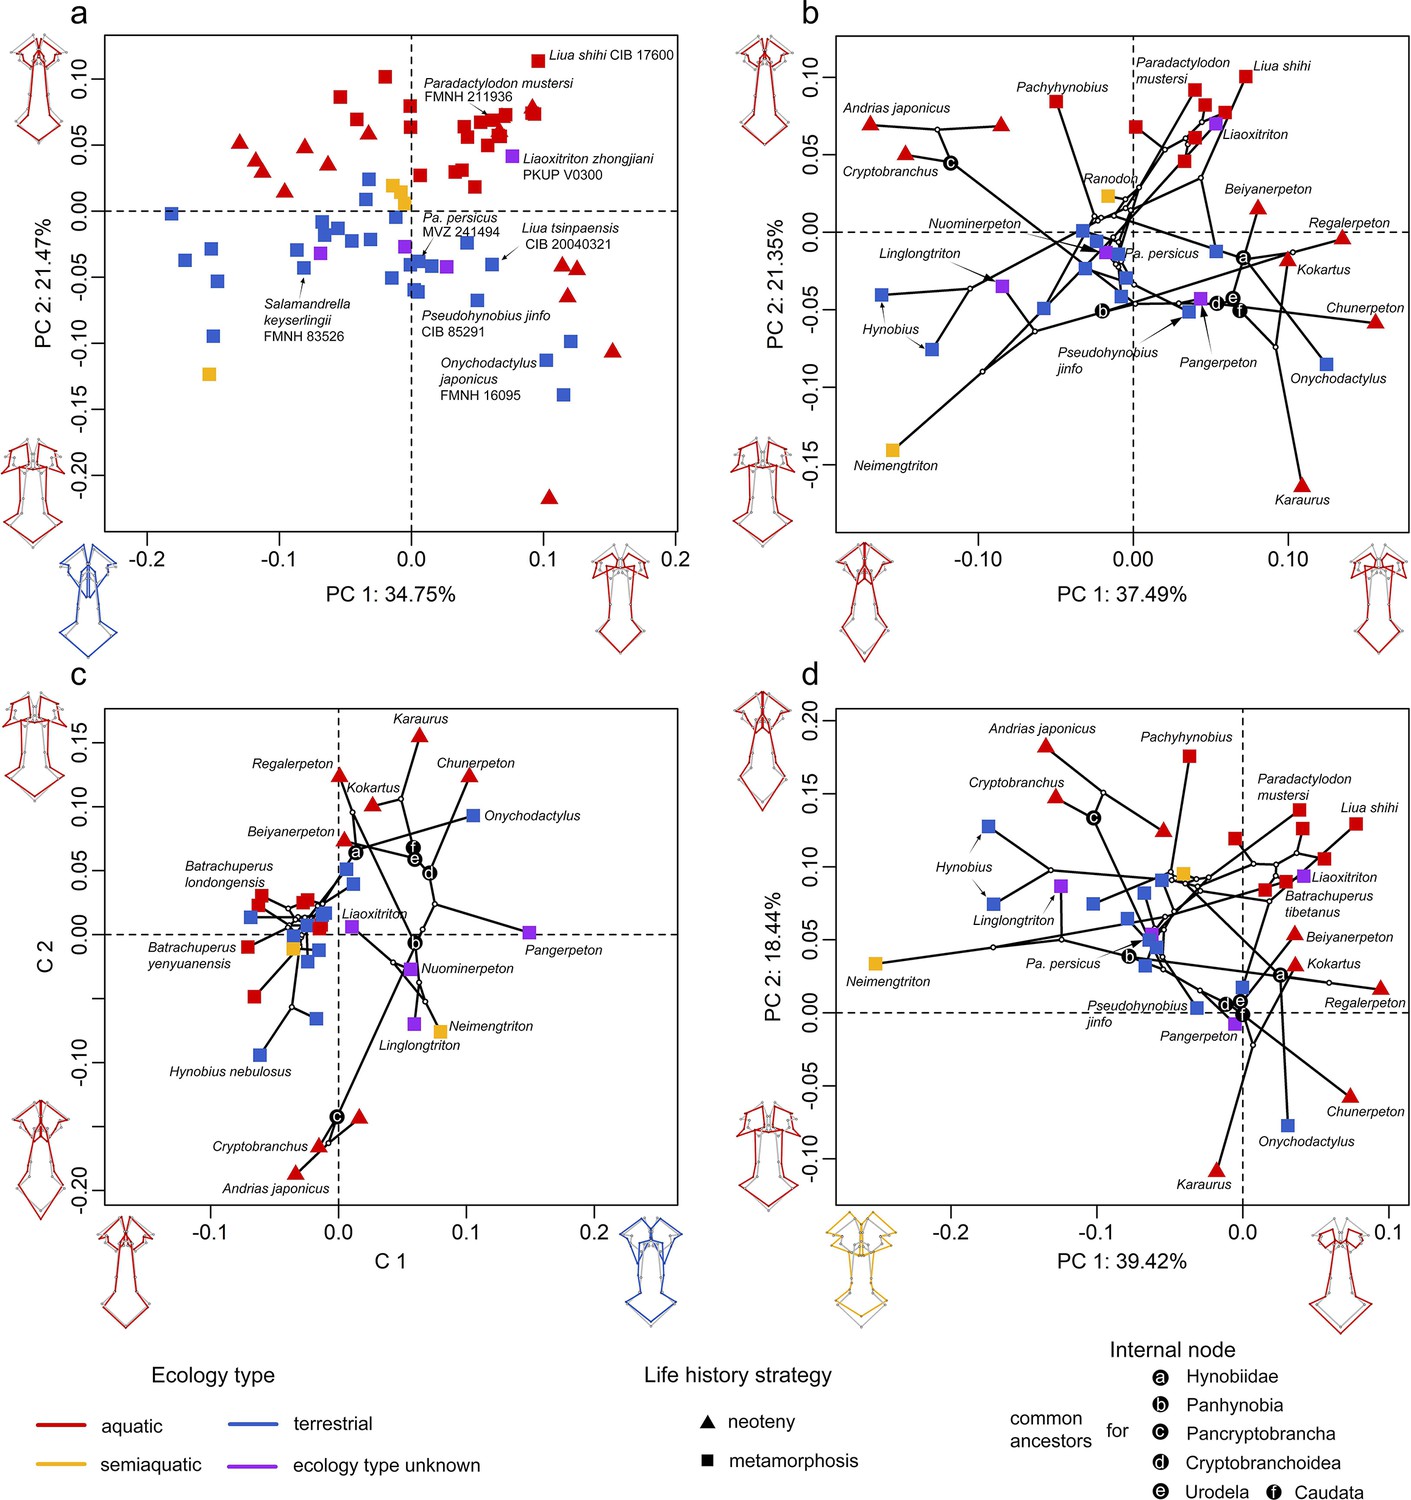
Spatial patterns of the palatal shape in the morphospace defined by the first two components generated from four principal component analyses (PCA).
(A) Standard PCA across 70 specimens, (B) phylomorphospace analysis, (C) phylogenetically aligned components analysis, and (D) phylogenetic PCA across 34 species with ancestral states for internal nodes (open circles) and phylogenetic relationships (black lines) plotted in the morphospace. The color and shape of each point represent the ecological type and taxonomic affiliation, respectively. Extreme values of the palatal shape along both principal components (PCs) 1 and 2 are represented by wireframes color-coded to ecological types against the mean shape (gray) of both terminal and internal taxa.
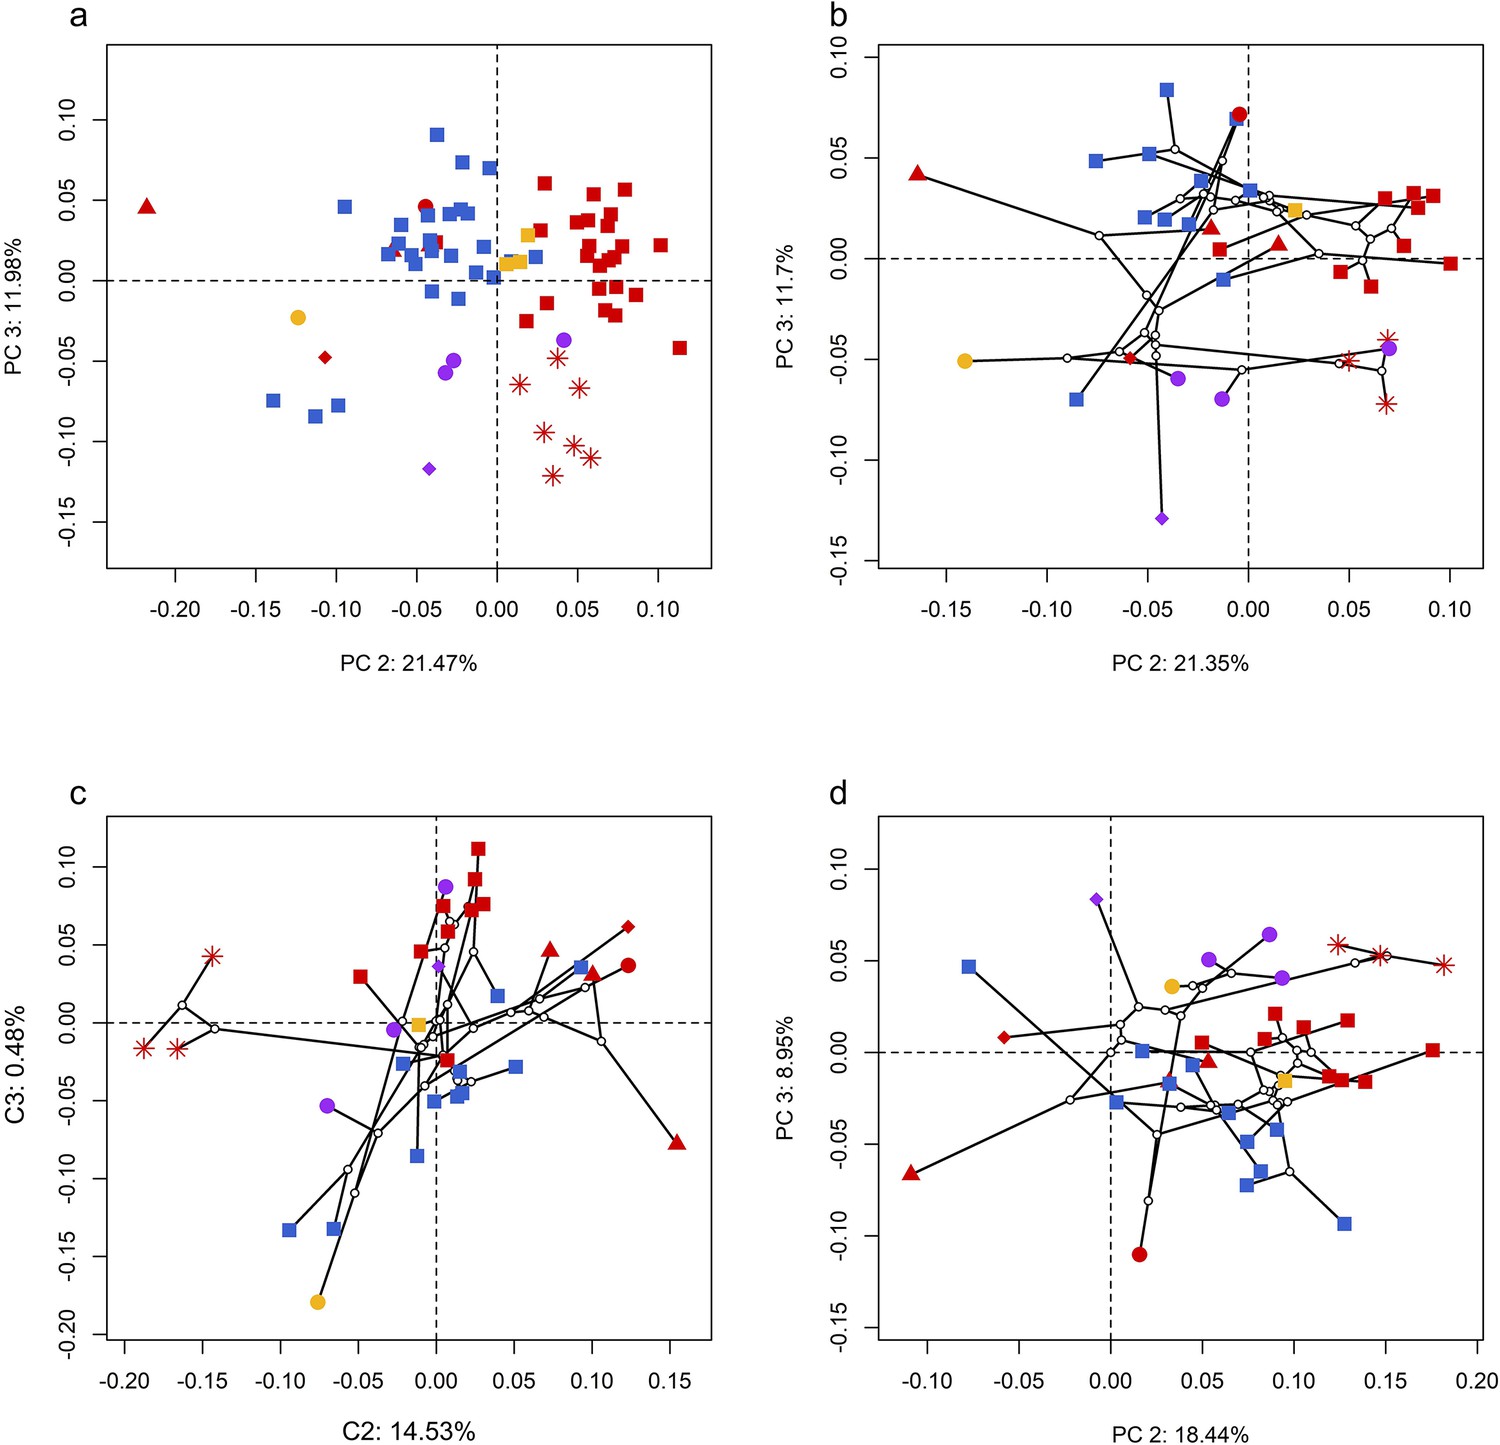
Figure 2—figure supplement 1
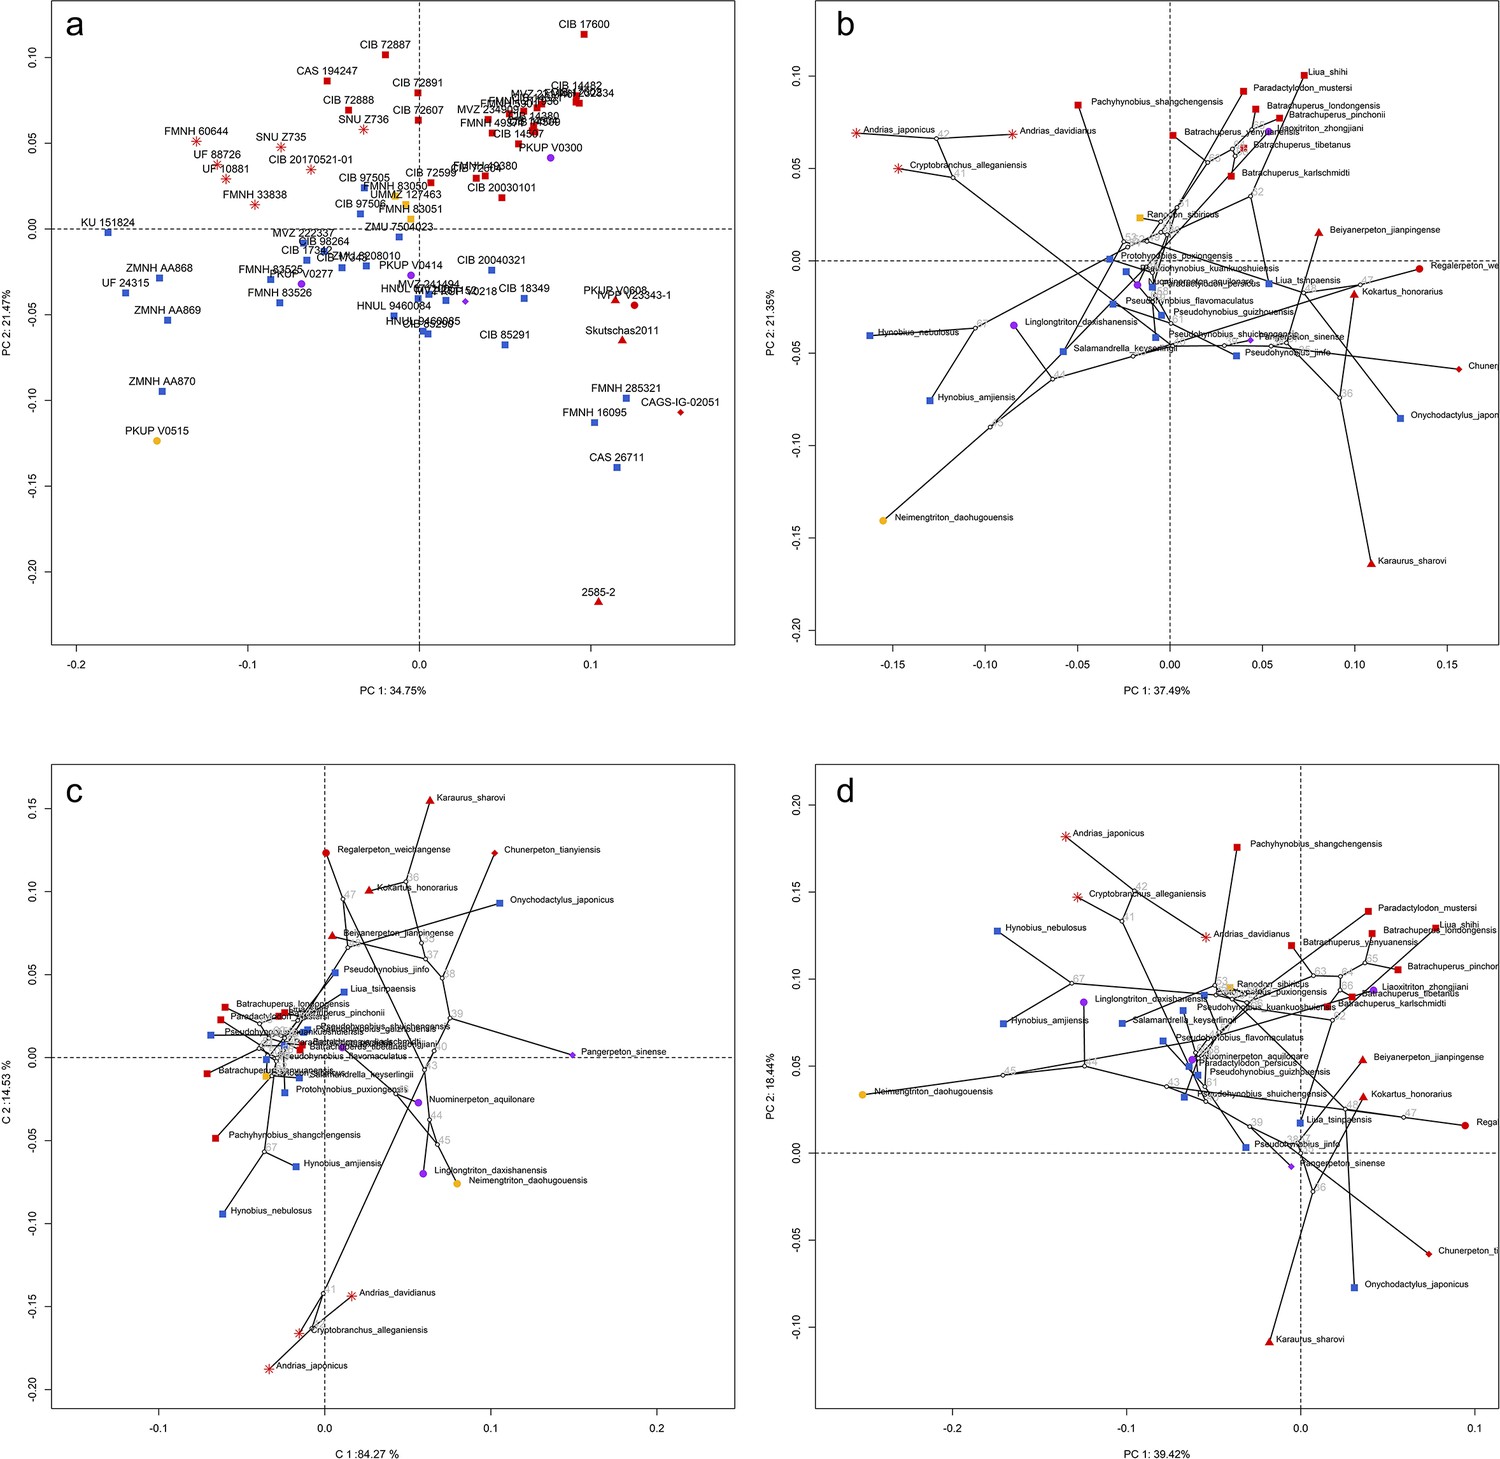
Spatial patterns of the palatal shape in the morphospace defined by the first two components generated from four principal component analyses (PCA).
(a) Standard PCA across 70 specimens labeled by specimen catalogue numbers; (b) phylomorphospace analysis, (c) phylogenetically aligned components analysis, and (d) phylogenetic PCA across 34 species (labeled by species names) with ancestral states (labeled by internal node numbers as in Figure 1—figure supplement 26a) for internal nodes (open circles) and phylogenetic relationships (black lines) plotted in the morphospace. The color and shape of each point represent the ecological type and taxonomic affiliation, respectively. Extreme values of the palatal shape along both principal components (PCs) 1 and 2 are represented by wireframes color-coded to ecological types against the mean shape (gray) of both terminal and internal taxa.
Figure 2—figure supplement 2
Spatial patterns of the palatal shape in the morphospace defined by principal components (PCs) 1 and 3 generated from 4 principal component analyses (PCA).
(a) Standard PCA across 70 specimens; (b) phylomorphospace analysis, (c) phylogenetically aligned components analysis, and (d) phylogenetic PCA across 34 species with ancestral states for internal nodes (open circles) and phylogenetic relationships (black lines) plotted in the morphospace. The color and shape of each point represent the types (refer to Figure 2) of ecology and taxonomy, respectively.
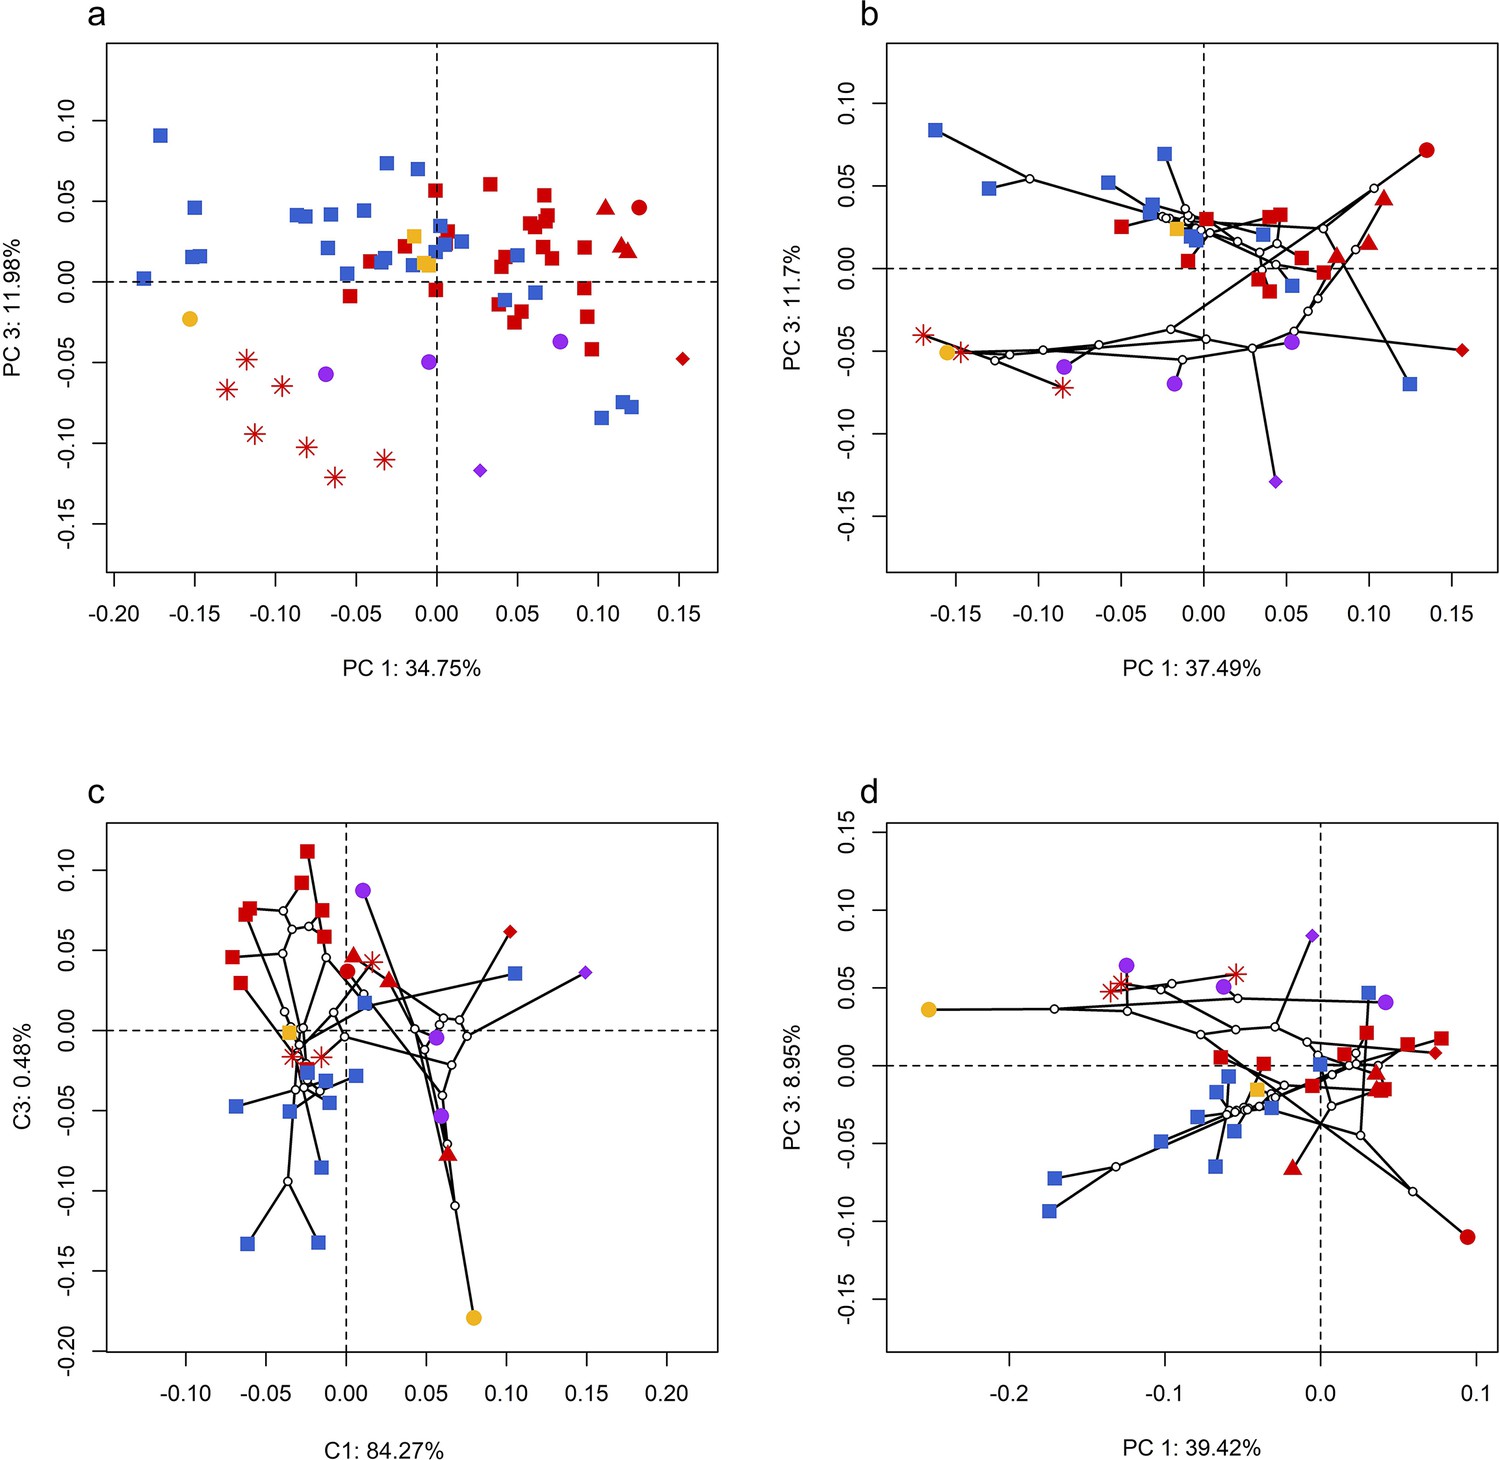
Figure 2—figure supplement 3
Spatial patterns of the palatal shape in the morphospace defined by principal components (PCs) 2 and 3 generated from four principal component analyses (PCA).
(a) Standard PCA across 70 specimens; (b) phylomorphospace analysis, (c) phylogenetically aligned components analysis, and (d) phylogenetic PCA across 34 species with ancestral states for internal nodes (open circles) and phylogenetic relationships (black lines) plotted in the morphospace. The color and shape of each point represent the types (refer to Figure 2) of ecology and taxonomy, respectively.
Figure 2—figure supplement 4
Spatial patterns of the palatal shape in the morphospace defined by the first two components generated from four principal component analyses (PCA).
(a) Standard PCA across 70 specimens; (b) phylomorphospace analysis, (c) phylogenetically aligned components analysis, and (d) phylogenetic PCA across 34 species with ancestral states for internal nodes (open circles) and phylogenetic relationships (black lines) plotted in the morphospace. The color and shape of each point represent the ecological type and life history strategy, respectively. Extreme values of the palatal shape along both principal components (PCs) 1 and 2 are represented by wireframes color-coded to ecological types against the mean shape (gray) of both terminal and internal taxa.
Figure 2—figure supplement 5
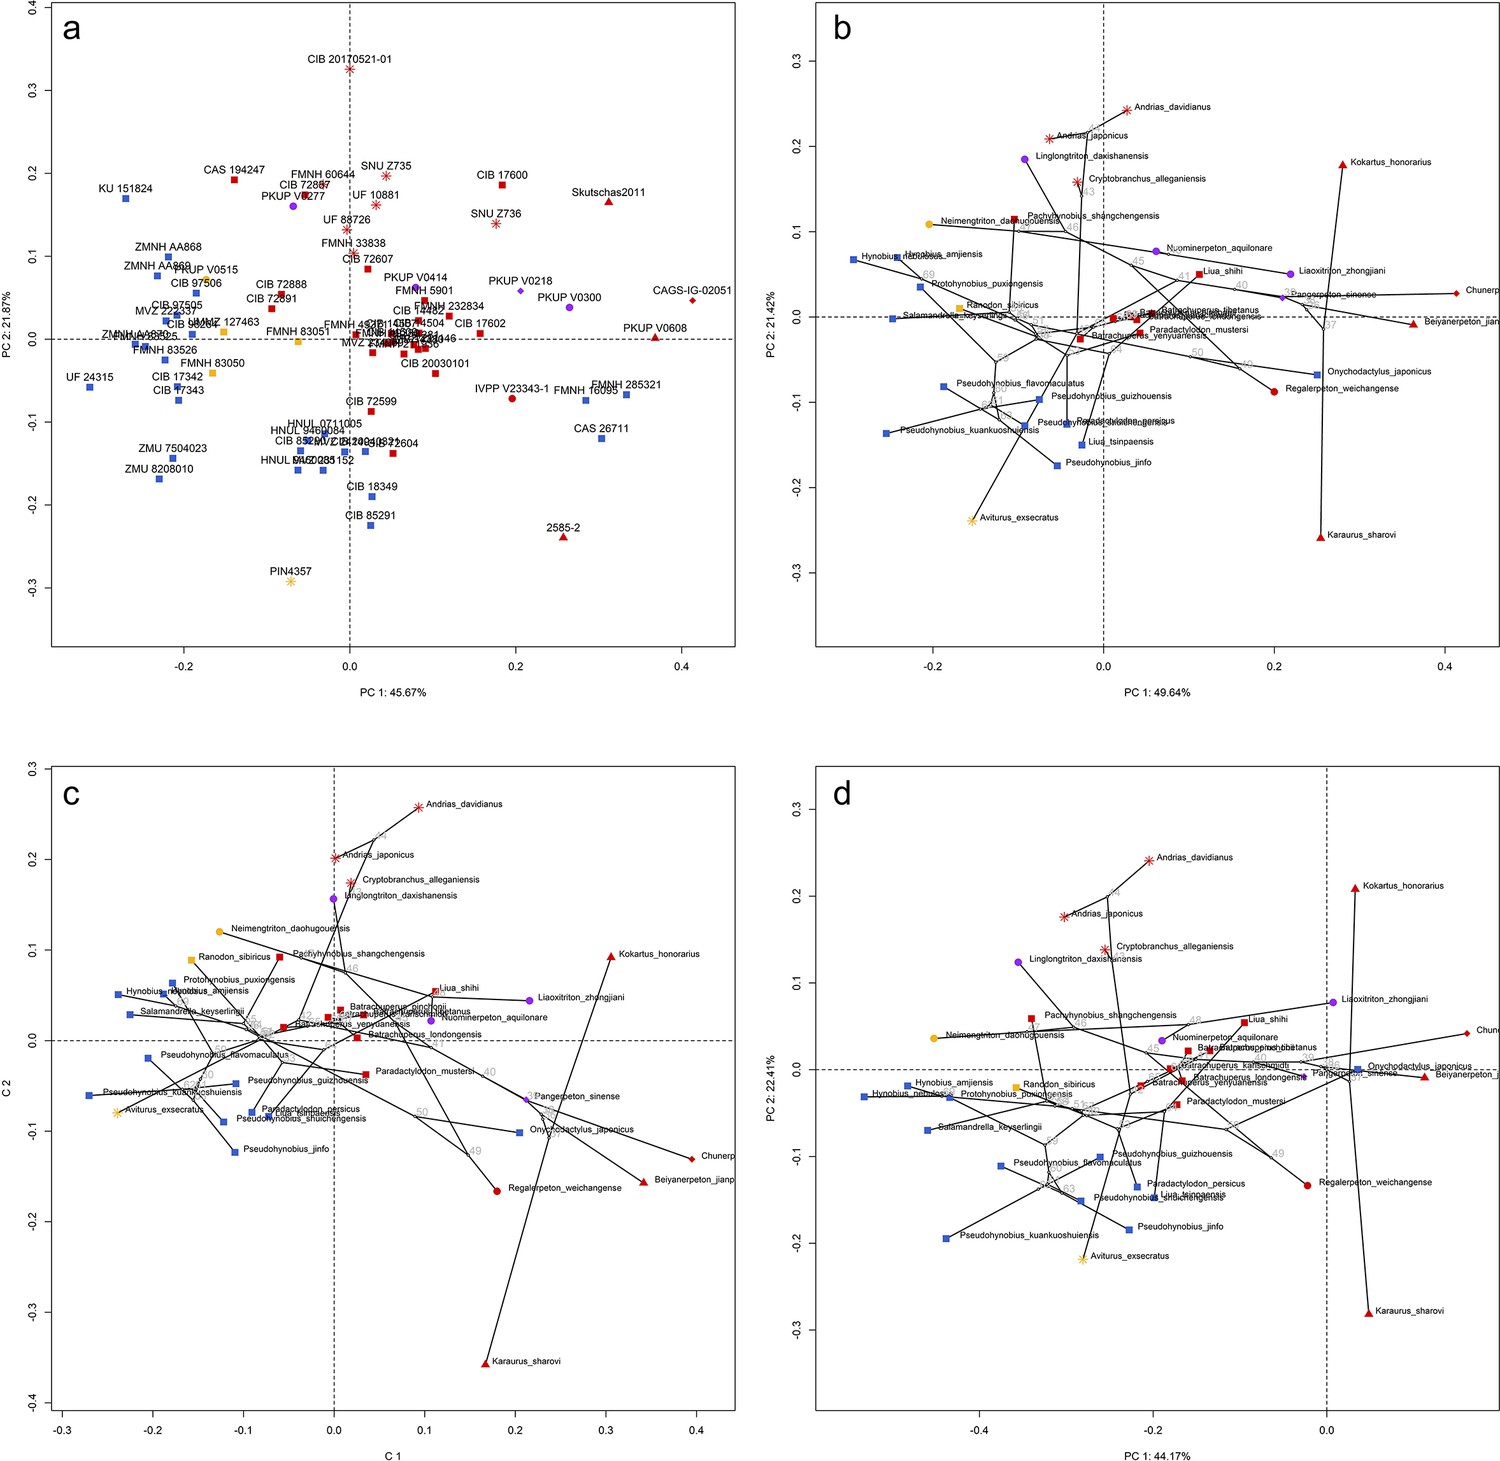
Spatial patterns of the shape of the right vomer in the morphospace defined by first two principal components (PCs) generated from four principal component analyses (PCA).
(a) Standard PCA across 71 specimens labeled by catalogue numbers, (b) phylomorphospace analysis, (c) phylogenetically aligned components analysis, and (d) phylogenetic PCA across 35 species (labeled in species names) with ancestral states for internal nodes (open circles; numbered according to Figure 1—figure supplement 26b) and phylogenetic relationships (black lines) plotted in the morphospace. The color and shape of each point represent the types (refer to Figure 2) of ecology and taxonomy, respectively.
Figure 3 with 2 supplements

Evolutionary patterns of both the shape and non-shape covariates of the palate and their association with ecological disparity in early salamanders.
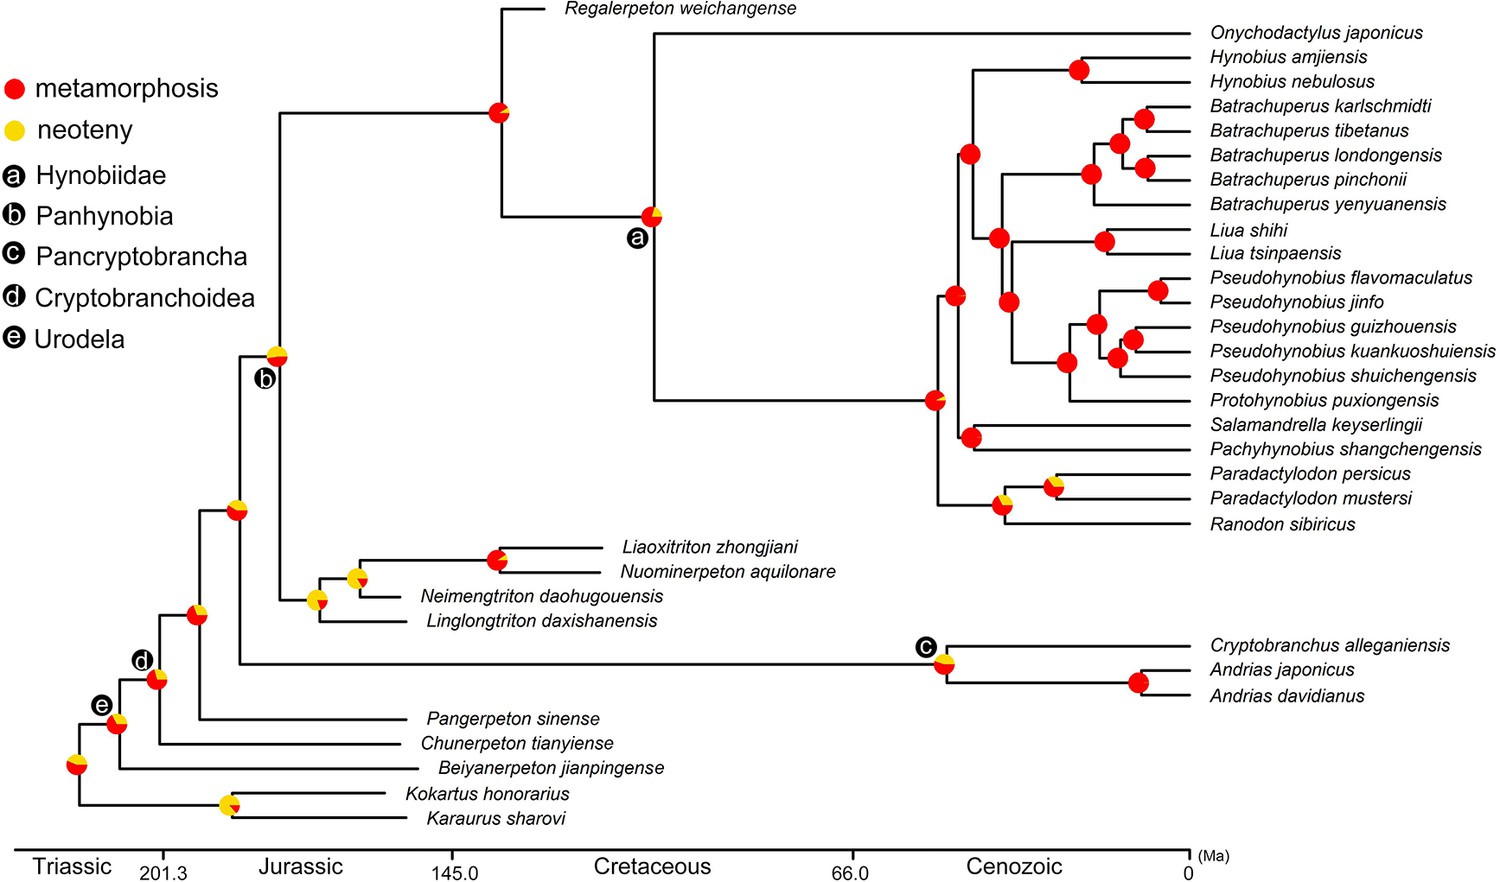
Ancestral shape (wireframes color-coded to ecological types superimposed with mean shape [gray]) and vomerine tooth row (zigzag black lines) configurations are reconstructed for respective last common ancestors of Hynobiidae, Panhynobia, Pancryptobrancha, Cryptobranchoidea, Urodela, and Caudata. A complete list of evolutionary rates for each of the 24 landmarks, the vomer, parasphenoid, the palate and the continuous covariates of the vomer across 34 species is available in Supplementary file 1GH and J. The two pie charts at each internal node of the time-calibrated cladogram are likelihoods of the position (left) and arrangement (right) of the vomerine tooth row reconstructed in this study. Continuous covariates of the vomer were subjected to Mann-Whitney U test for their association with the three ecological groups with corresponding p values labeled above the boxplots.
Figure 3—figure supplement 1
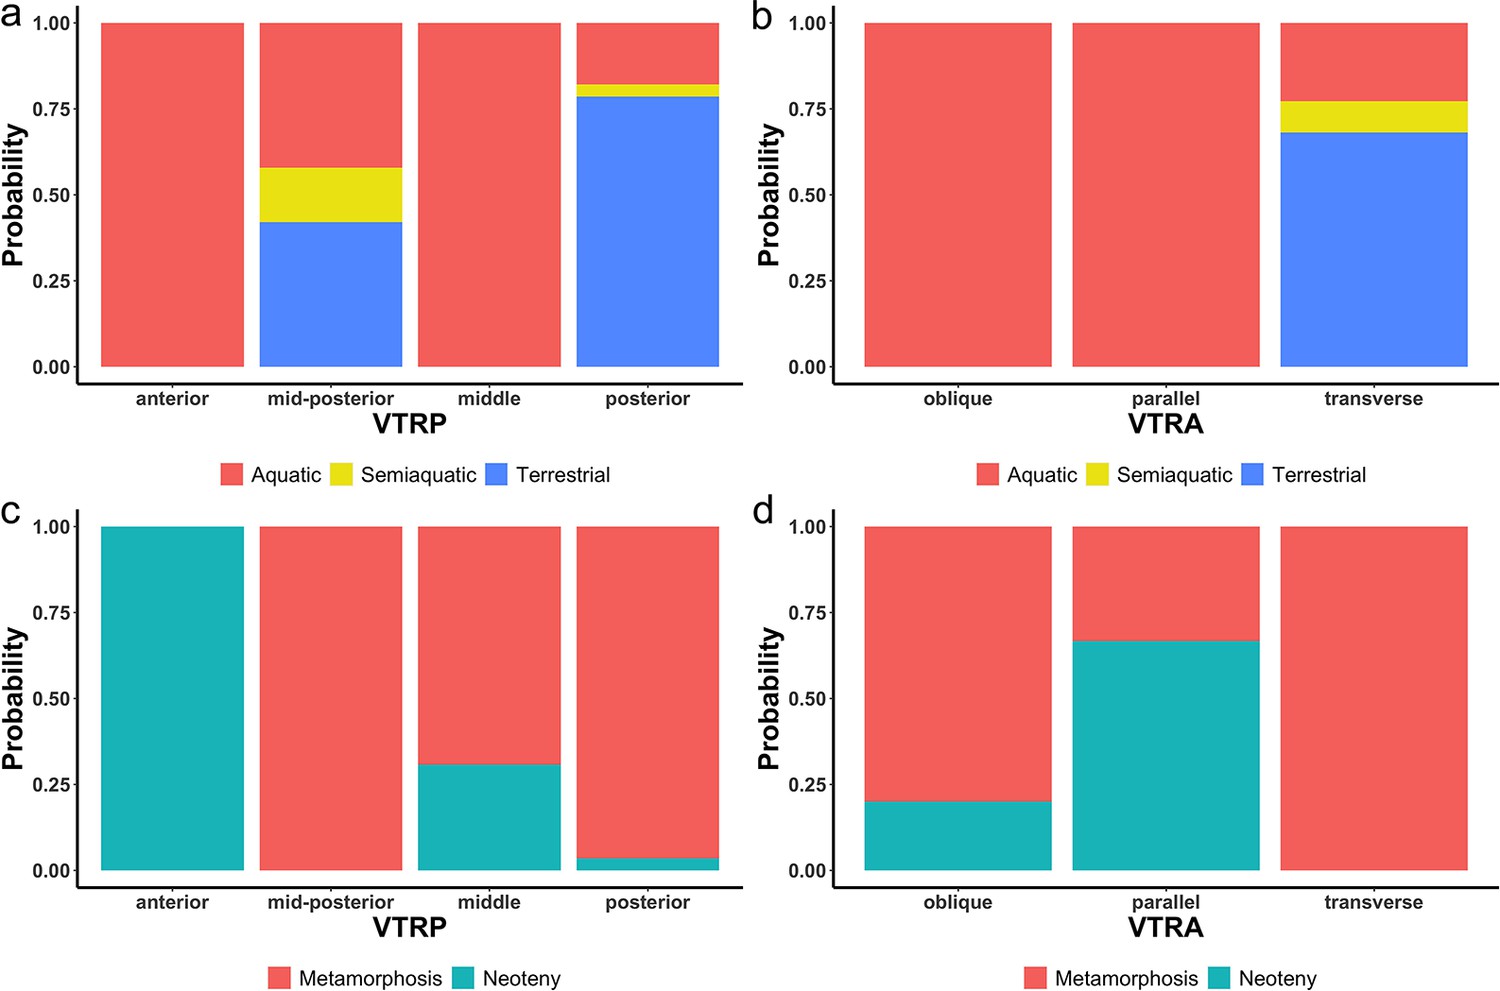
Probability of the indicativeness of ecological preference (a, b) and life history strategy (c, d) from two discrete characters of the vomerine tooth row, the position (VTRP) and arrangement (VTRA) based on contingency table (Supplementary file 1I).
Figure 3—figure supplement 2
Time-calibrated cladogram of 34 species showing the ancestral states of the life history strategy for internal nodes reconstructed by maximum likelihood.
Figure 4
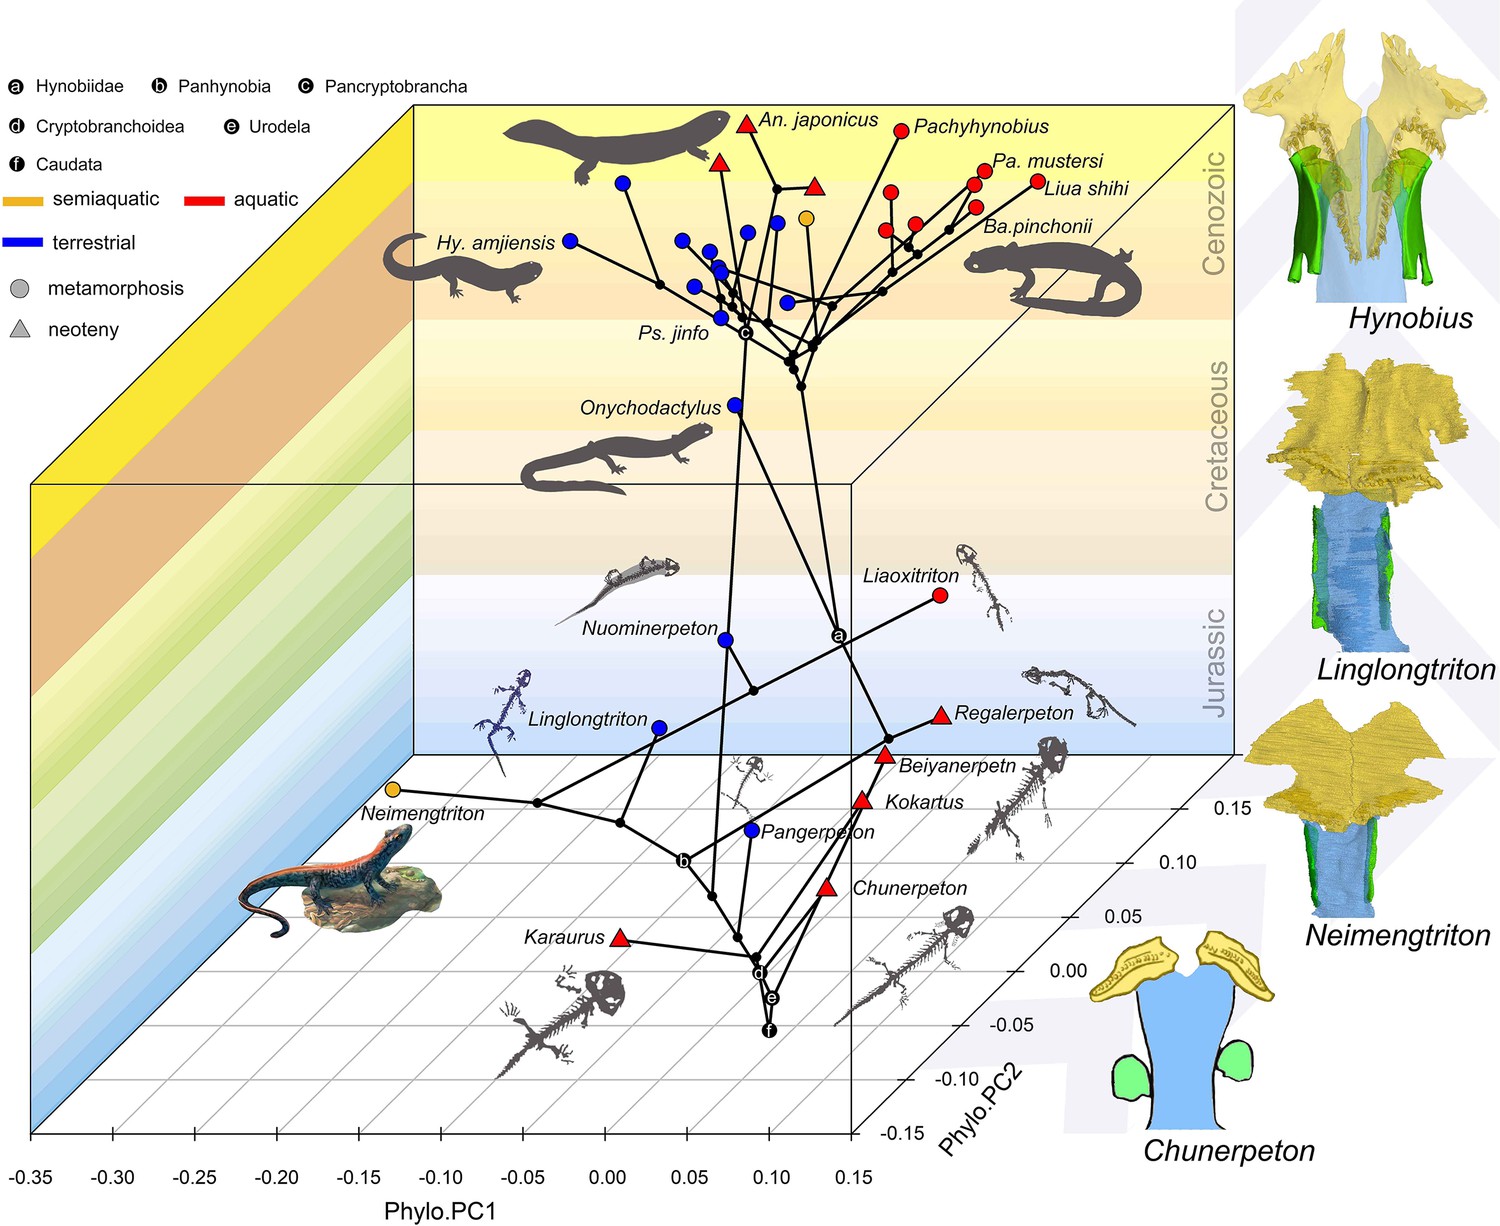
Spatial-temporal patterns of phenotypic diversities of the palate and their associations with ecological preference and life history strategy in early salamanders and the stepwise evolutionary patterns at the sutural area of vomer, parasphenoid, and orbitosphenoid.
The morphospace of the palate is defined within a space formed by geological time scale (Z-axis) and principal components (PCs) 1 (X-axis) and 2 (Y-axis) derived from phylogenetic principal component analysis across 34 species. All silhouettes and images of salamander species are original.
Additional files
-
Supplementary file 1
(A) Scores of the principal components generated from the standard principal component analysis (PCA) on the 24-landmark-dataset across 70 specimens, and the phylomorphospace analysis (PA), the phylogenetically aligned component analysis (PaCA), and the phylogenetic principal component analysis (Phylo-PCA) across 34 species. Abbreviations: Cumu. RV, Cumulative RV; Cumu. P., Cumulative Proportion; Eigenva., Eigenvalue; Prop. Co., Proportion of Covariance; Prop. V., Proportion of Variance; RV by Co., RV by Component; Sing. V., Singular Value. (B) Pairwise comparison and corresponding p-values of morphological disparity of the palate calculated as Procrustes variances for 34 species grouped by ecological preference, life history strategy and taxonomic affiliation. *, <i>p-value ≤ 0.05. Abbreviations: cryptobran., cryptobranchoids. (C) Pairwise comparison and corresponding p-values of single landmark point of the palate calculated as Procrustes variances (×E-4) for 34 species grouped by ecological preference. *, p≤0.05; **, p≤0.01; ***, p≤0.001. (D) Pairwise comparison and corresponding p-values of single landmark point of the palate calculated as Procrustes variances (×E-5) for 34 species grouped by life history strategy. *, p≤0.05. (E) Pairwise comparison and corresponding p-values of single landmark point of the palate calculated as Procrustes variances (×E-5) for 34 species grouped by taxonomic affiliation. *, p≤0.05; **, p≤0.01. (F) Absolute morphological disparity of the palate calculated as Procrustes variances for 34 species grouped by ecology, life history strategy and taxonomic affiliations. (G) Absolute morphological disparity calculated as Procrustes variances and evolutionary rates for each landmark point of the palate across 34 species grouped by ecology, life history and taxonomic affiliations. (H) Comparison of evolutionary rates of the palate and centroid size for 34 species grouped by ecology, life history and taxonomic affiliations. *, p≤0.05; **, p≤0.01; ***, p≤0.001. (I) Contingency table showing the association between ecological preference and life history strategy and two discrete characters of vomerine tooth row (position and arrangement pattern) across 34 species represented by 70 specimens. (J) non-shape covariates of the palate of 35 species and the ancestral states for internal nodes reconstructed by the “Rphylopars” R package. (K) Definition of the 24 landmarks for the palate (vomer and parasphenoid) used in this study.
- https://cdn.elifesciences.org/articles/76864/elife-76864-supp1-v2.docx
-
Transparent reporting form
- https://cdn.elifesciences.org/articles/76864/elife-76864-transrepform1-v2.docx
Download links
A two-part list of links to download the article, or parts of the article, in various formats.
Downloads (link to download the article as PDF)
Open citations (links to open the citations from this article in various online reference manager services)
Cite this article (links to download the citations from this article in formats compatible with various reference manager tools)
Palatal morphology predicts the paleobiology of early salamanders
eLife 11:e76864.
https://doi.org/10.7554/eLife.76864


