Hypertrophic chondrocytes serve as a reservoir for marrow-associated skeletal stem and progenitor cells, osteoblasts, and adipocytes during skeletal development
- Department of Cell Biology, Duke University School of Medicine, United States
- Department of Orthopaedic Surgery, Duke University School of Medicine, United States
- Department of Pharmacology and Cancer Biology, Duke University School of Medicine, United States
- Program of Developmental and Stem Cell Biology, Duke University School of Medicine, United States
- Division of Laboratory Animal Resources, Duke University School of Medicine, United States
- School of Biomedical Sciences, University of Hong Kong, Hong Kong
Figures
Figure 1 with 1 supplement
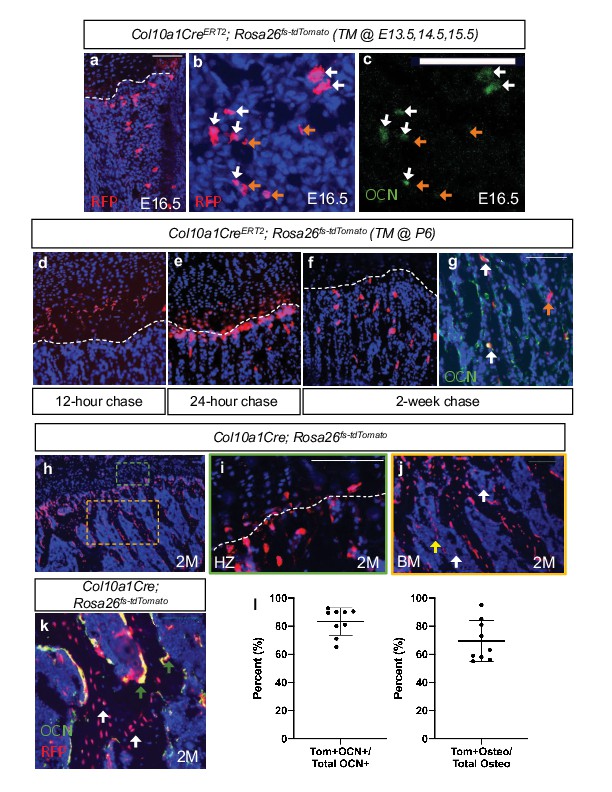
Hypertrophic chondrocytes are the primary source of osteoblasts/osteocytes in trabecular bone.
Tibia sections of Col10a1CreERT2; Rosa26fs-tdTomato mice injected with tamoxifen at E13.5, 14.5, and 15.5 and subsequently sectioned at E16.5 and stained for (a) DAPI/RFP. (b–c) Higher magnification with OCN+/tdTOMATO+ descendants marked with white arrows and tdTOMTATO+ descendants not associated with bone (OCN-) are indicated by orange arrows. Tibia sections of Col10a1CreERT2; Rosa26fs-tdTomato mice injected with tamoxifen at P6 and subsequently sectioned at (d) 12 hour chase, (e) 24 hr chase, and (f) 2 week chase. (g) OCN immunostaining of Col10a1CreERT2; Rosa26fs-tdTomato bone sections following 2 week chase of TM. OCN+/tdTOMATO+ descendants marked with white arrows. tdTOMATO+ descendants not associated with bone (OCN-) are indicated by orange arrows. (h) Section of 2 M old Col10a1Cre; Rosa26fs-tdTomato tibia with higher magnifications of (i) hypertrophic zone (green box) and (j) bone marrow cavity (orange box). Non-bone lining TOMATO+ descendants marked with white arrows and potential vessel associated tdTOMATO+ descendants indicated by yellow arrow. (k) OCN and RFP immunostaining of 2 M Col10a1Cre; Rosa26fs-tdTomato tibia. OCN+/tdTOMATO+ osteoblasts represented by green arrows and tdTOMATO+ osteocytes with white arrows with quantifications shown in (l – Figure 1—source data 1). Scale bars = 100 um. N = 3 slides from three biologic replicates, SD ±9.7% for OCN stain, SD ±14.8% for osteocytes. Dotted line demarks the chondro-osseous junction.
-
Figure 1—source data 1
Osteoblast and osteocyte quantification on Col10a1Cre;Rosa26fs-tdTomato 2M old mice.
- https://cdn.elifesciences.org/articles/76932/elife-76932-fig1-data1-v2.xlsx
Figure 1—figure supplement 1
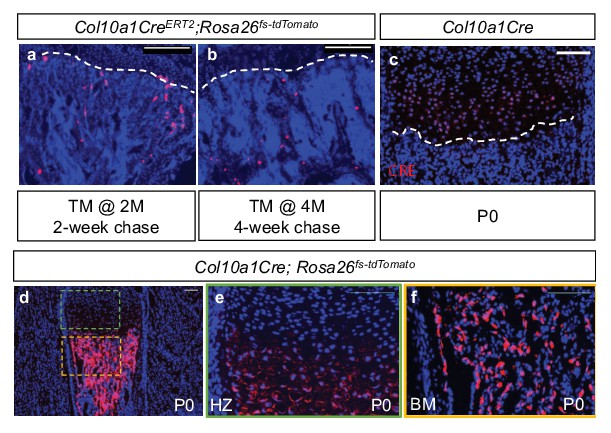
Contribution of hypertrophic chondrocytes to the bone marrow are observed into skeletal maturity and CRE expression is restricted to hypertrophic chondrocytes in Col10a1Cre mice.
(a) Tibia sections of Col10a1CreERT2; Rosa26fs-tdTomato mice injected with tamoxifen at 2 M of age and subsequently sectioned at 2-week chase. (b) Tibia sections of Col10a1CreERT2; Rosa26fs-tdTomato mice injected at 4 months of age and subsequently sectioned at 1-month chase. (c) CRE immunostaining of P0 bone sections from Col10a1Cre mouse line. (d) Section of P0 Col10a1Cre; Rosa26fs-tdTomato mouse tibia with higher magnifications regions of (e) hypertrophic zone (green box) and (f) bone marrow cavity (orange box). Chondro-osseous junction represented by white dotted line. Scale bar = 100 um.
Figure 2 with 2 supplements
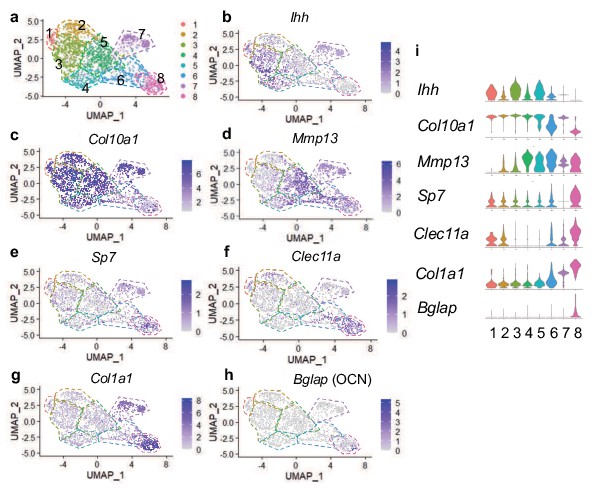
Single cell transcriptomics at E16.5 captures hypertrophic chondrocytes and osteoblasts.
(a) UMAP shown in two-dimensional space produced using Seurat 4 package of R from single-cell RNA-sequencing of cleaned skeletal rudiments from Col10Cre; Rosa26fs-tdTomato mice at E16.5. (b–d) Feature plots of hypertrophic chondrocyte associated genes identified in clusters 1–7. (e–h) Feature plots of osteoprogenitor/osteoblast specific genes identified in clusters 7–8. (i) Violin plot representing the relative level of chondrocyte and osteoblast associated gene expression (b–h).
Figure 2—figure supplement 1
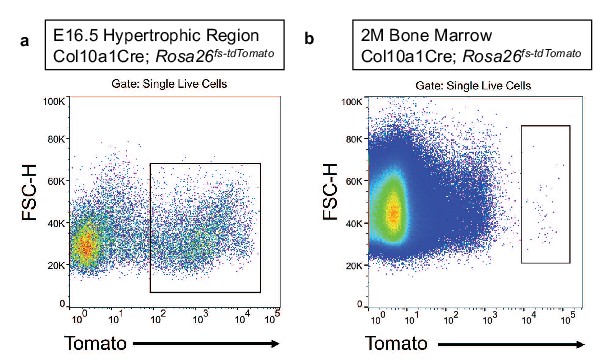
FACS plots for isolation of tdTOMATO+ cells at E16.5 and 2 M for scRNA-sequencing.
(a) E16.5 FACS plot identified tdTOMATO+ expressing cells isolated by total bone digestion and utilized for 10 X Genomics scRNA-sequencing represented in Figure 2. (b) 2 M FACS plot identified tdTOMATO+ expressing cells isolated by bone marrow flush and digestion and utilized for 10 X Genomics scRNA-sequencing represented in Figure 3.
Figure 2—figure supplement 2
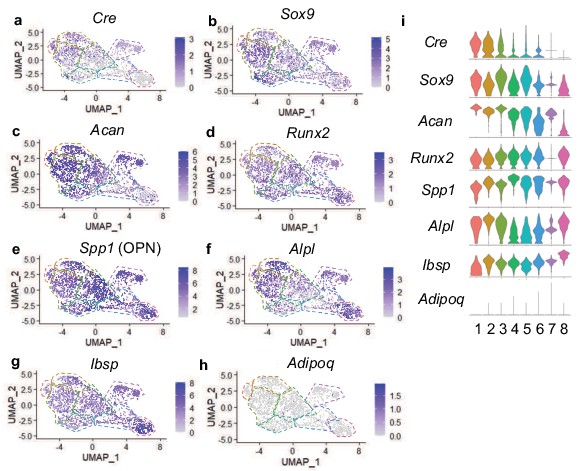
Additional genes of interest expressed in hypertrophic chondrocytes and descendants at E16.5.
(a) Feature plot of Cre expression was enriched in clusters 1–2 at E16.5. (b–c) Feature plot of genes associated with chondrocytes were observed enriched in clusters 1–7. (d-g) Feature plot of genes associated with hypertrophic and osteoblast differentiation were observed throughout all clusters. (h) Feature plot of Adipoq had very limited expression in any cluster. (i) Violin plot of genes of interest (a–h).
Figure 3 with 1 supplement
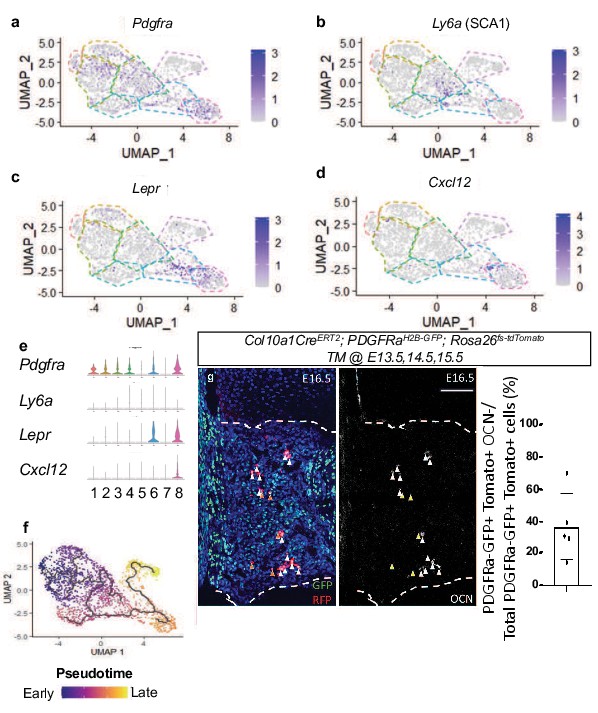
Single-cell transcriptomics of E16.5 hypertrophic chondrocytes and descendants reveals an intermediate SSPC upstream of osteoblasts.
(a–d) Feature plot of SSPC-associated genes identified between hypertrophic chondrocyte and osteoblast clusters (e) Violin plot representing the relative level of SSPC associated gene expression (a–d). (f) Monocle three trajectory analysis throughout pseudotime. (g) E16.5 tibia sections of Col10a1CreERT2; Rosa26fs-tdTomato;PDGFRaH2B-GFP mice injected with tamoxifen at E13.5, 14.5, and 15.5 and quantification (Figure 3—source data 1). Orange arrows represent tdTOMATO+/PDGFRaH2B-GFP+ cells that are OCN-. White arrows represent tdTOMATO+/ PDGFRaH2B-GFP+ cells that co-express OCN. Scale bar = 100 um. N = 1/2 slides for three biological replicates, Average = 36.7%, SD ±20.7%. Dotted line demarks the chondro-osseous junction.
-
Figure 3—source data 1
PDGFRa+ TOMATO+ quantification at e16.5 of Col10a1Cre; Rosa26-fs-tdTomato; PDGFRa-H2B-GFP.
- https://cdn.elifesciences.org/articles/76932/elife-76932-fig3-data1-v2.xlsx
Figure 3—figure supplement 1
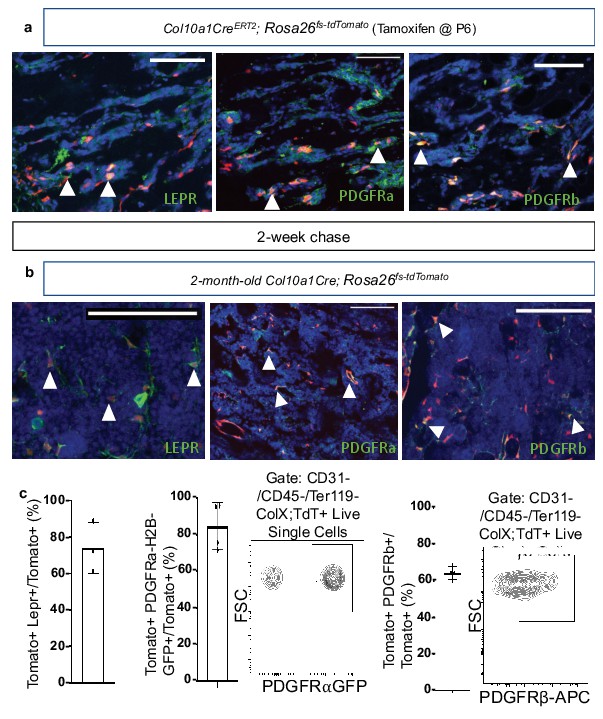
SSPC associated proteins are detected in hypertrophic chondrocyte-derived marrow-associated cells.
(a) Immunostaining of SSPC associated proteins in both bone sections from Col10a1CreERT2; Rosa26fs-tdTomato mice injected with tamoxifen at P6 and chased for 2 weeks and (b) 2 M old Col10a1Cre; Rosa26fs-tdTomato bone sections. Representative co-labeled (LEPR, PDGFRa, or PDGFRb and tdTOMATO) cells are identified by white arrows. (c) Quantification of contribution to SSPC-like cells by hypertrophic chondrocyte descendants by immunofluorescence of 2-month-old Col10a1Cre; Rosa26fs-tdTomato stained with LEPR antibody (left – Average = 74.21%, Figure 3—figure supplement 1—source data 1), flow cytometric analysis of bone marrow cells from 1-month-old Col10a1Cre; Rosa26fs-tdTomato; PDGFRaH2B-GFP (middle – Average = 84.6%, Figure 3—figure supplement 1—source data 2), and 2-month-old Col10a1Cre; Rosa26fs-tdTomato stained with PDGFRb antibody (right – Average = 64.33%, Figure 3—figure supplement 1—source data 3) N = 3 biologic replicates (LEPR), 4 biologic replicates (PDGFRa), and four biologic replicates (PDGFRb). SD LEPR = ± 13.92%, PDGFRa = ± 12.81%, and PDGFRb = ± 3.48%. Scale bars = 100 um.
-
Figure 3—figure supplement 1—source data 1
LEPR+ TOMATO+ quantification of Col10a1Cre;Rosa26fs-tdTomato at 2M.
- https://cdn.elifesciences.org/articles/76932/elife-76932-fig3-figsupp1-data1-v2.xlsx
-
Figure 3—figure supplement 1—source data 2
Flow cytometric analysis of PDGFRa-H2B-GFP and tdTOMATO on Col10a1Cre;Rosa26fs-tdTomato at 2M.
- https://cdn.elifesciences.org/articles/76932/elife-76932-fig3-figsupp1-data2-v2.xlsx
-
Figure 3—figure supplement 1—source data 3
Flow cytometric analysis of PDGFRb and tdTOMATO on Col10a1Cre;Rosa26fs-tdTomato at 2M.
- https://cdn.elifesciences.org/articles/76932/elife-76932-fig3-figsupp1-data3-v2.xlsx
Figure 4 with 4 supplements
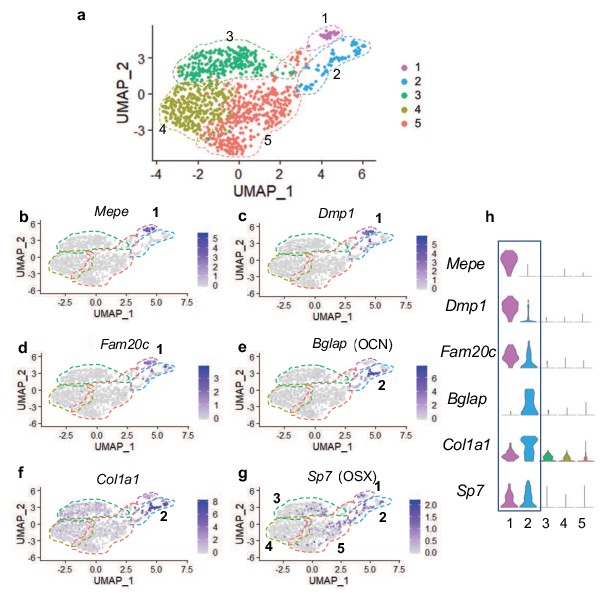
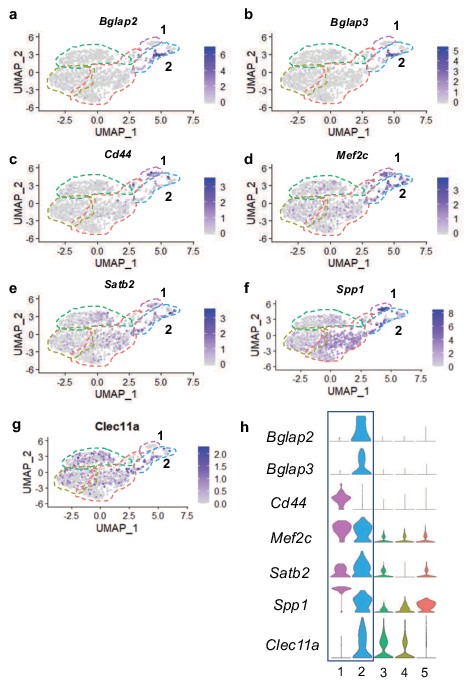
Single cell transcriptomics of hypertrophic chondrocyte descendants following FACS and 10 X Genomics sequencing at 2 M of age.
(a) UMAP shown in two-dimensional space produced using Seurat 3 package of R from single-cell RNA-sequencing of bone marrow digest from Col10Cre; Rosa26fs-tdTomato mice at 2 M. (b–f) Feature plots of osteoblast specific genes identified in cluster 1 (b–d) and cluster 2 (e–f). (g) Feature plot of the osteoprogenitor associated gene, Sp7. (h) Violin plot representing the relative level of osteoblast-associated gene expression (b–g).
Figure 4—figure supplement 1
Additional osteoblast associated genes observed in clusters 1 and 2 at 2 months of age.
(a–g) Feature plots of genes associated with osteoblasts were observed in clusters 1 and 2 with minimal expression in clusters 3–5. (h) Violin plots representing relative gene expression levels in (a–g) among the five identified clusters.
Figure 4—figure supplement 2
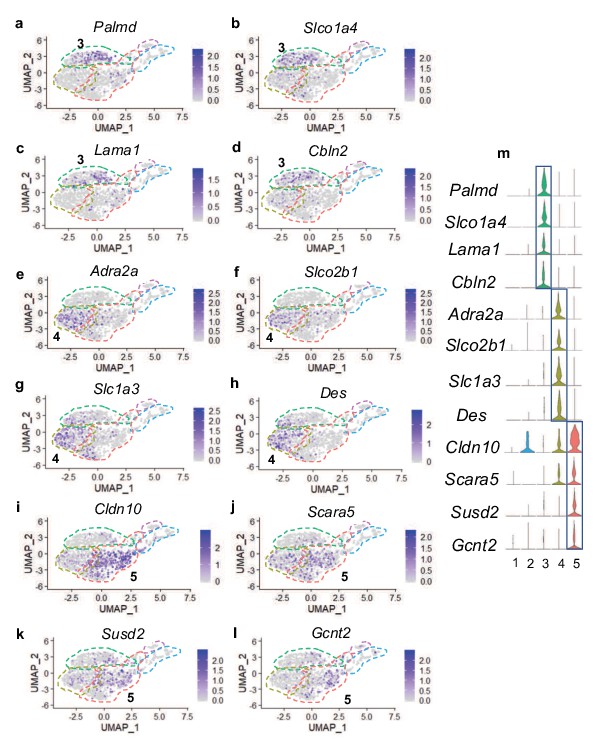
Differentially expressed genes mostly unique to clusters 3, 4, and 5.
(a–j) Feature plots of genes identified by differential gene expression in cluster 3 (a–d), cluster 4 (e–h), and cluster 5 (i–l). (m) Violin plots of differentially expressed genes represented in (a–l).
Figure 4—figure supplement 3
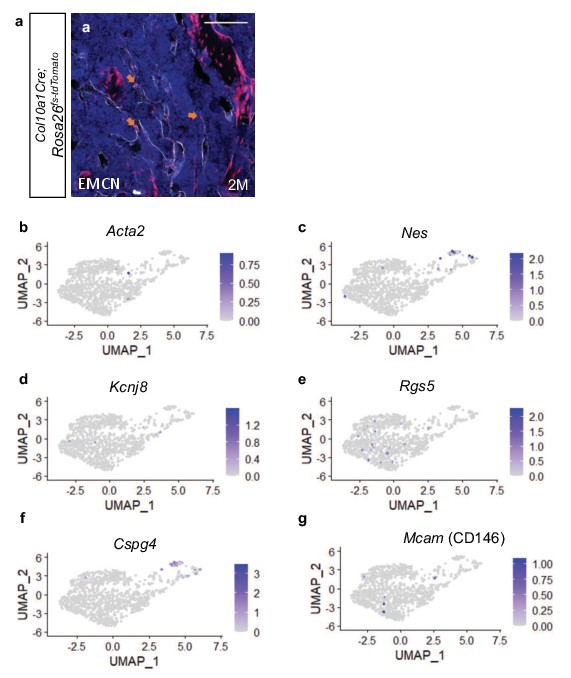
Hypertrophic chondrocyte-derived cells can associate with blood vessels; however, do not express genes associated with pericytes or vascular smooth muscle cells.
(a) Immunostaining for endothelial-cell-associated protein, ENDOMUCIN, on 2-month-old Col10a1Cre; Rosa26fs-tdTomato bone sections show adjacent tdTOMATO+ cells indicated by orange arrows. Feature plots for (b–c) vascular smooth muscle cell associated genes and (d-g) pericyte-associated genes indicate that these genes are rarely expressed in any cell cluster. Scale bar = 100 µm.
Figure 4—figure supplement 4
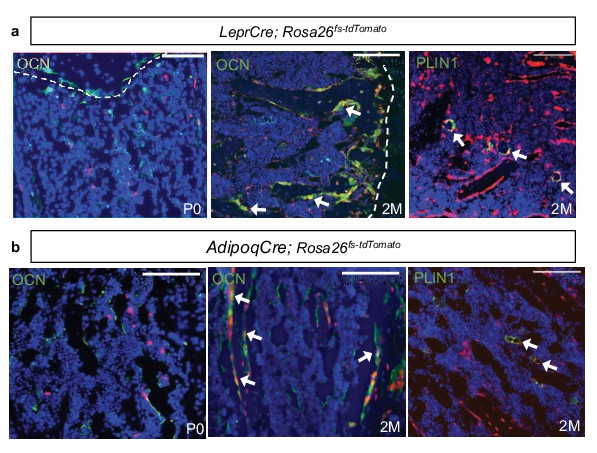
LeprCre; R26-tdTomato and AdipoqCre; R26-tdTomato mice exhibit reporter expression in marrow associated cells, osteoblasts, and adipocytes with age.
(a) Immunostaining of bone sections from LeprCre; Rosa26fs-tdTomato mice exhibit tdTOMATO+ marrow-associated cells; however, do not display tdTOMATO+, OCN+ osteoblasts at P0. Immunostaining at 2 months of age reveals both tdTOMATO+, OCN+ osteoblasts and tdTOMATO+, PERILIPIN+ adipocytes. (b) Immunostaining of bone sections from AdipoqCre; Rosa26fs-tdTomato mice also exhibit tdTOMATO+ marrow-associated cells; however, do not display tdTOMATO+, OCN+ osteoblasts at P0. Immunostaining at 2 M of age reveals both tdTOMATO+, OCN+ osteoblasts and tdTOMATO+, PERILIPIN+ adipocytes.
Figure 5 with 1 supplement
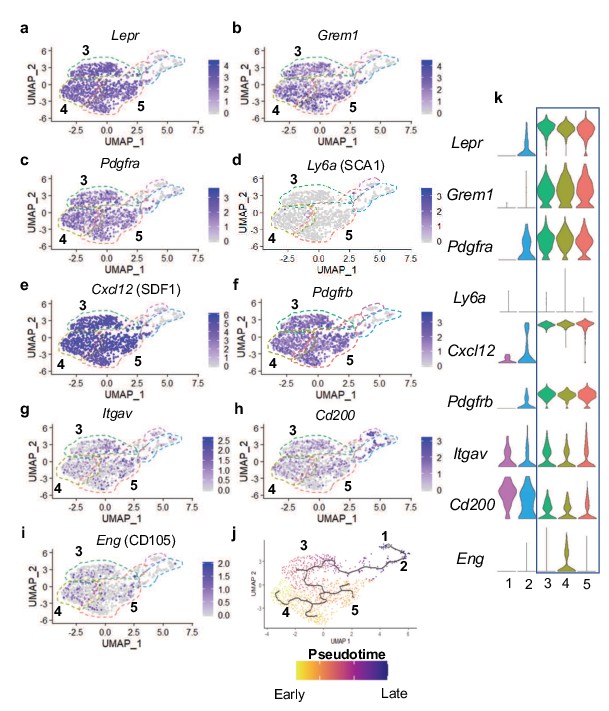
Many hypertrophic chondrocyte derived cells express genes associated with SSPCs.
(a–f) Feature plots of genes previously identified as SSPC markers in genetic mouse models. (g–i) Feature plots of genes previously identified as SSPC markers for use in flow cytometry and FACS. (j) Monocle three trajectory analysis with clusters noted throughout pseudotime. (k) Violin plots of SSPC-associated genes in (a–i).
Figure 5—figure supplement 1

Contribution of hypertrophic chondrocyte descendants to total SSPC populations.
(a) Quantitation of immunostaining for LEPR on bone sections from 2 M old Col10a1Cre; Rosa26fs-tdTomato mice exhibit 37.4% LEPR+; tdTOMATO+ as compared to total LEPR+ marrow-associated cells (Figure 5—figure supplement 1—source data 1). N = 2 technical replicates of three biologic replicates, SD ±6.2%. (b) Flow cytometric analysis of 1-month-old Col10a1Cre; Rosa26fs-tdTomato; PDGFRaH2B-GFP mice exhibit 26.93% PDGFRA+; tdTOMATO+ as compared to total PDGFRA+ marrow-associated cells (Figure 5—figure supplement 1—source data 2). N = 4 biologic replicates, SD ±3.79%.
-
Figure 5—figure supplement 1—source data 1
LEPR+ TOMATO+ quantification on Col10a1Cre;Rosa26fs-tdTomato at 2M.
- https://cdn.elifesciences.org/articles/76932/elife-76932-fig5-figsupp1-data1-v2.xlsx
-
Figure 5—figure supplement 1—source data 2
Flow cytometric analysis of PDGFRa-H2B-GFP and TOMATO on Col10a1Cre;Rosa26fs-tdTomato at 2M.
- https://cdn.elifesciences.org/articles/76932/elife-76932-fig5-figsupp1-data2-v2.xlsx
Figure 6
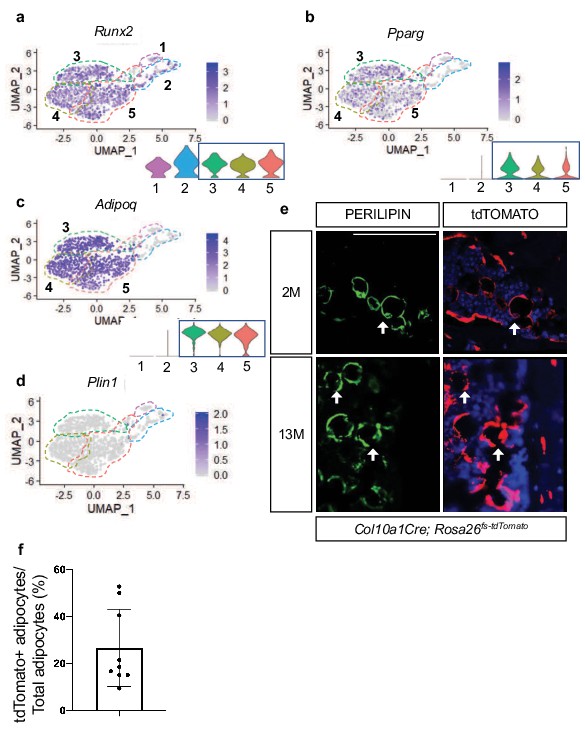
Hypertrophic chondrocyte derived SSPCs exhibit osteogenic and adipogenic differentiation capacities.
(a) Feature plot and violin plot of the osteoblast specification gene, Runx2. (b–c) Feature plots and violin plots of the adipogenic specification gene, Pparg, and adipogenic associated gene, Adipoq. (d) Feature plot indicating a lack of expression of the mature lipid laden adipocyte gene, Perilipin. (e) Immunostaining for PERILIPIN in Col10a1Cre;R26-tdTomato mice at 2 months and 13 months of age. PERILIPIN+, tdTOMATO+ adipocytes noted with white arrows. Scale bar = 100 µm (f) Quantification of PERILIPIN+, tdTOMATO+ adipocytes at 13 months of age in (e) Average = 27.59% (Figure 6—source data 1). N = 3 slides from three biologic replicates, SD ±16.2%.
-
Figure 6—source data 1
PERILIPIN+ TOMATO+ quantifications on Col10a1Cre;Rosa26fs-tdTomato at 2M.
- https://cdn.elifesciences.org/articles/76932/elife-76932-fig6-data1-v2.xlsx
Figure 7
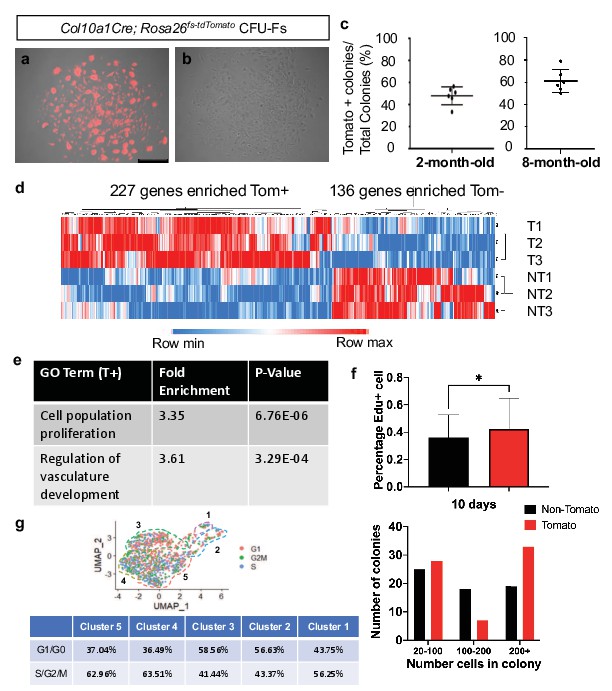
CFU-Fs derived from hypertrophic chondrocytes are similar to CFU-Fs derived from other cell sources, but contain SSPCs with enhanced proliferative capacities.
(a–c) CFU-Fs derived from hypertrophic chondrocytes (tdTOMATO+) (a) and those derived from other cell sources (tdTOMATO-)(b) are established and develop at similar frequencies at 2- and 8 months of age (c – Figure 7—source data 1). Scale bar = 500 µm (d) Heat-map from bulk RNA-seq data from three tdTOMATO+ CFU-Fs and 3 TOMATO- CFU-Fs (Figure 7—source data 2). (e) Gene ontology terms associated with tdTOMATO+ CFU-Fs (Figure 7—source data 3 and Figure 7—source data 4). (f) EdU incorporation within tdTOMATO+ and tdTOMATO- CFU-Fs (top - Figure 7—source data 5) and differences in cell numbers between tdTOMATO+ and tdTOMATO- CFU-Fs (bottom - Figure 7—source data 6). N = 2 technical replicates of three biologic replicates, SD tdTOMATO- ± 16.5%, SD tdTOMATO+ ± 22.3%, p-value = 0.044. (g) Cell cycle analysis of the SSPCs associated with clusters 1–5 using Seurat 3.
-
Figure 7—source data 1
Tomato+ colony unit formation quantifications at 2 and 8M of Col10a1Cre;Rosa26fs-tdTomato.
- https://cdn.elifesciences.org/articles/76932/elife-76932-fig7-data1-v2.xlsx
-
Figure 7—source data 2
Bulk RNA-sequencing total gene list of 3 TOMATO+ and 3 TOMATO- colonies from Col10a1Cre;Rosa26fs-tdTomato.
- https://cdn.elifesciences.org/articles/76932/elife-76932-fig7-data2-v2.xlsx
-
Figure 7—source data 3
Gene ontology analysis of genes enriched in TOMATO+ colonies.
- https://cdn.elifesciences.org/articles/76932/elife-76932-fig7-data3-v2.xlsx
-
Figure 7—source data 4
Gene ontology analysis of genes enriched in TOMATO- colonies.
- https://cdn.elifesciences.org/articles/76932/elife-76932-fig7-data4-v2.xlsx
-
Figure 7—source data 5
EDU+ quantifications of TOMATO+ and TOMATO- colonies.
- https://cdn.elifesciences.org/articles/76932/elife-76932-fig7-data5-v2.xlsx
-
Figure 7—source data 6
Colony size of TOMATO+ and TOMATO- colonies.
- https://cdn.elifesciences.org/articles/76932/elife-76932-fig7-data6-v2.xlsx
Figure 8 with 1 supplement
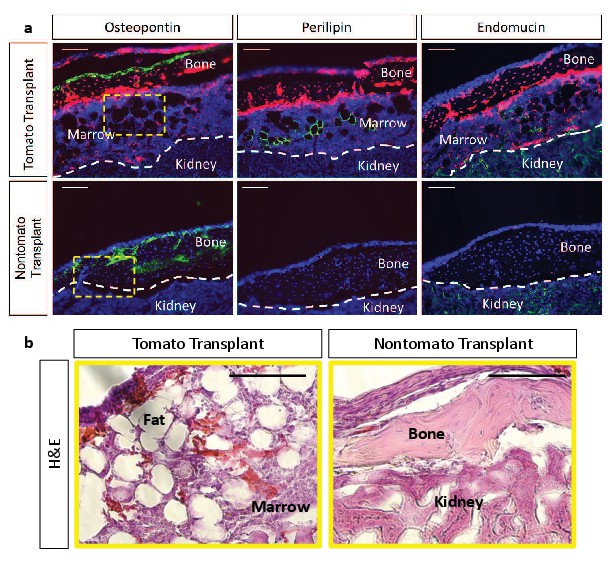
Kidney capsule transplantations of tdTOMATO+ cells exhibit complete ossicle formation with bone, adipocytes, and bone marrow compared to tdTOMATO- resulting in only bone formation.
(a) Immunofluroescent stain for bone (osteopontin), adipocytes (perilipin), and vessels (endomucin) for tomato+ transplant (top) and tomato- transplant (bottom). (b) Hematoxylin and Eosin stain for marrow establishment in tdTomato+ transplant and tdTOMATO- transplant.
Figure 8—figure supplement 1
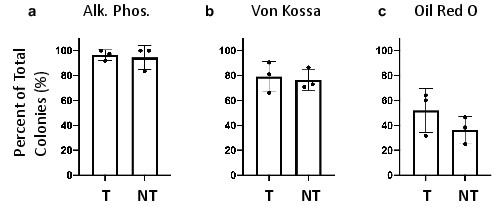
In vitro differentiation of colonies reveals relatively similar osteogenic and adipogenic differentiation capacities.
(a–b) CFUs from Col10a1Cre; Rosa26fs-tdTomato bone marrow differentiate into osteoblasts stained with alkaline phosphatase (a) and von kossa (b) (CFU-OB). alkaline phosphatase: SD tdTOMATO+ (T) ± 4.2%, SD tdTOMATO- (NT) ±9.6%, p-value = 0.63. von kossa: SD tdTOMATO+ ± 12.3%, SD tdTOMATO- ± 8.4%, p-value = 0.67. (c) CFUs from Col10a1Cre; Rosa26fs-tdTomato marrow differentiate into adipocytes stained with oil red o (CFU-AD). SD tdTOMATO+ ± 17.6%, SD tdTOMATO- ± 10.8%, p-value = 0.11. Figure 8—figure supplement 1—source data 1.
-
Figure 8—figure supplement 1—source data 1
Differentiation assay quantifications of TOMATO+ and TOMATO- colonies.
- https://cdn.elifesciences.org/articles/76932/elife-76932-fig8-figsupp1-data1-v2.xlsx
Figure 9
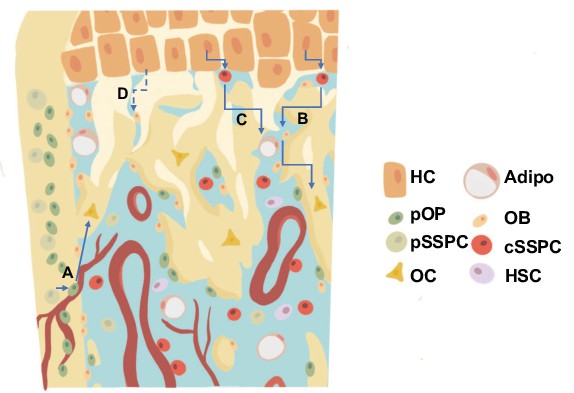
Revised model for the generation of trabecular/endocortical bone associated osteoblasts/osteocytes from multiple sources.
(a) Perichondrial or periosteal SSPCs/osteoprogenitors (pSSPC/pOP) migrate into the marrow utilizing blood vessels and possess the ability to further differentiate into osteoblasts/osteocytes (OB/OC). (b–c) Hypertrophic chondrocytes (HC) dedifferentiate into chondrocyte derived SSPCs (cSSPC) with the capacity to generate osteoblasts/osteocytes (b) and adipocytes (Adipo) (c). (d) Data presented does not rule out the potential for the transdifferentiation of hypertrophic chondrocytes directly into osteoblasts/osteocytes. HSC = hematopoietic stem cells.
Tables
Appendix 1—key resources table
| Reagent type (species) or resource | Designation | Source or reference | Identifiers | Additional information |
|---|---|---|---|---|
| Strain, strain background (Mus musculus) | C57BL/6 J | Jackson Laboratory | RRID:IMSR_JAX:000664 | |
| Genetic reagent (Mus musculus) | Col10a1Cre | DOI: 10.1242/bio.201411031 | Dr. Klaus von der Mark | |
| Genetic reagent (Mus musculus) | Col10a1CreERT2 | This paper | Dr. Kathryn Cheah | |
| Genetic reagent (Mus musculus) | Rosa26fs-tdTomato | Jackson Laboratory | RRID:IMSR_JAX:007909 | |
| Genetic reagent (Mus musculus) | PdgfraH2B-GFP | Jackson Laboratory | RRID:IMSR_JAX:007669 | |
| Genetic reagent (Mus musculus) | LeprCre | Jackson Laboratory | RRID:IMSR_JAX:008320 | |
| Genetic reagent (Mus musculus) | AdipoqCre | Jackson Laboratory | RRID:IMSR_JAX:028020 | |
| Sequence-based reagent | Col10a1Cre/ ERT2_F | DOI: 10.1242/bio.201411031 | TTTAGAGCATTATT TCAAGGCA GTTTCCADr. Klaus von der Mark | |
| Sequence-based reagent | Col10a1Cre/ ERT2_R | DOI: 10.1242/bio.201411031 | AGGCAAATCTT GGTGTACGGDr. Klaus von der Mark | |
| Antibody | ENDOMUCIN (rat mAb) | Abcam | Cat# ab106100, RRID:AB_10859306 | IF (1:100), 0.3% Triton X-100 in 1 x PBS |
| Antibody | PERILIPIN (rabbit mAb) | Cell Signaling | Cat# 9349, RRID:AB_10829911 | IF (1:100) |
| Antibody | OSTEOCALCIN (rabbit pAb) | Millipore | Cat# AB10911, RRID:AB_1587337 | IF (1:200), 10 ug/mL Proteinase K |
| Antibody | OSTERIX(Rabbit pAb) | Abcam | Cat# ab22552, RRID:AB_2194492 | IF (1:400) |
| Antibody | CRE(Rabbit mAb) | Cell Signaling | Cat# 15036, RRID:AB_2798694 | IF (1:100), 0.3% Triton X-100 in 1 x PBS |
| Antibody | RFP (rabbit pAb) | Abcam | Cat# ab62341, RRID:AB_945213 | IF (1:100) |
| Antibody | LEPR (goat pAb) | R&D Systems | Cat# AF497, RRID:AB_2281270 | IF (1:50), 0.3% Triton X-100 in 1 x PBS |
| Antibody | PDGFRa (goat mAb) | R&D Systems | Cat# AF1062, RRID:AB_2236897 | IF (1:50), 0.3% Triton X-100 in 1 x PBS |
| Antibody | PDGFRb (rat mAb) | Invitrogen | Cat# 14-1402-81, RRID:AB_467492 | IF (1:50), 0.3% Triton X-100 in 1 x PBS |
| Antibody | Osteopontin (goat pAb) | R&D Systems | Cat# AF808, RRID:AB_2194992 | IF (1:100), 0.3% Triton X-100 in 1 x PBS |
| Antibody | PDGFRb (rat mAb) | Invitrogen | Cat# 17-1402-80, RRID:AB_1548752 | Flow Cytometry (1:25) |
| Antibody | CD45-FITC (rat mAb) | Biolegend | Cat# 103107, RRID:AB_312972 | Flow Cytometry (1:1000) |
| Antibody | CD45-APC (rat mAb) | Biolegend | Cat# 103111, RRID:AB_312976 | Flow Cytometry (1:1000) |
| Antibody | CD31-FITC (rat mAb) | Biolegend | Cat# 102405, RRID:AB_312900 | Flow Cytometry (1:1000) |
| Antibody | CD31-APC (rat mAb) | Biolegend | Cat# 102409, RRID:AB_312904 | Flow Cytometry (1:1000) |
| Antibody | TER119-FITC (rat mAb) | BD Biosciences | Cat# 561032, RRID:AB_10563083 | Flow Cytometry (1:500) |
| Antibody | TER119-APC (rat mAb) | Biolegend | Cat# 116211, RRID:AB_313712 | Flow Cytometry (1:250) |
| Antibody | DAPI (FLOW) | ThermoFisher | Cat# D1306, RRID:AB_2629482 | Flow Cytometry (1:1000) |
| Antibody | Goat anti-Mouse Alexa Fluor 488 pAb | Invitrogen | Cat# A-11001, RRID:AB_2534069 | IF (1:200) |
| Antibody | Donkey anti-Goat Alexa Fluor 488 pAb | Invitrogen | Cat# A-11055, RRID:AB_2534102 | IF (1:200) |
| Antibody | Goat anti-Rat Alexa Fluor 488 pAb | Invitrogen | Cat# A-11006, RRID:AB_2534074 | IF (1:200) |
| Antibody | Goat anti-Rabbit Alexa Fluor 594 pAb | Invitrogen | Cat# A-11037, RRID:AB_2534095 | IF (1:200) |
| Antibody | Goat anti-Rabbit Alexa Fluor 488 pAb | Invitrogen | Cat# A-11034, RRID:AB_2576217 | IF (1:200) |
| Antibody | Goat anti-Rat Alexa Fluor 647 pAb | Invitrogen | Cat# A-21247, RRID:AB_141778 | IF (1:200) |
| Antibody | Goat anti-Rabbit Alexa Fluor 488 pAb | Invitrogen | Cat# A-11008, RRID:AB_143165 | For LepRCre;tdTomato stained PERILIPIN only - IF (1:200) |
| Chemical compound, drug | Collagenase II | Gibco | 17101–015 | |
| Chemical compound, drug | Collagenase D | Roche | 11088866001 | |
| Chemical compound, drug | Polyvinylpyrrolidone | Sigma | P5288 | |
| Chemical compound, drug | Glutamax 100 x | Gibco | 35050–061 | |
| Chemical compound, drug | L-Ascorbic Acid | Sigma | A4544 | |
| Chemical compound, drug | B-glycerophosphate | Sigma | G9422 | |
| Chemical compound, drug | Insulin Human | Sigma | I3536 | |
| Chemical compound, drug | IBMX | Sigma | I7018 | |
| Chemical compound, drug | Dexamethasone | Sigma | D2915 | |
| Chemical compound, drug | Antigen Unmasking solution, Citrate Acid Based | Vector | H3300 | |
| Commercial assay, kit | Click-iT Plus EdU Cell Proliferation Kit | Invitrogen | C10637 | |
| Software, algorithm | FIJI | doi:10.1038/ nmeth.2019 | Fiji, RRID:SCR_002285 | |
| Software, algorithm | Seurat | CRAN | Seurat, RRID:SCR_007322 | |
| Software, algorithm | Monocle3 | Github | Monocle3, RRID:SCR_018685 | |
| Software, algorithm | Trim Galore | Babraham Bioinformatics | Trim Galore,RRID:SCR_011847 | Felix Krueger |
| Software, algorithem | Cutadapt | Github | cutadapt, RRID:SCR_011841 | |
| Software, algorithm | STAR RNA-seq Alignment | Github | STAR, RRID:SCR_004463 | |
| Software, algorithm | HTSeq tool | Github | HTSeq, RRID:SCR_005514 | |
| Software, algorithm | DESeq2 | Bioconductor | DESeq2, RRID:SCR_015687 | |
| Software, algorithm | Gene Ontology | Geneontoloy.org | Gene Ontology, RRID:SCR_002811 | |
| Other | Silver Nitrate 10% | Ricca | 6830–4 | |
| Other | Oil Red O | Sigma | O0625 | |
| Other | Alizarin Red | Sigma | A5533 | |
| Other | Mayer’s Hematoxylin solution | Electron Microscopy Sciences | 26043–06 | |
| Other | Eosin Y with Phloxine staining solution | Electron Microscopy Sciences | 26051–21 |
Additional files
-
Transparent reporting form
- https://cdn.elifesciences.org/articles/76932/elife-76932-transrepform1-v2.pdf
-
Source code 1
Code used for generation of Single Cell datasets and analysis at e16.5/2M of Col10a1Cre;Rosa26fs-tdTomato.
- https://cdn.elifesciences.org/articles/76932/elife-76932-code1-v2.zip
Download links
A two-part list of links to download the article, or parts of the article, in various formats.
Downloads (link to download the article as PDF)
Open citations (links to open the citations from this article in various online reference manager services)
Cite this article (links to download the citations from this article in formats compatible with various reference manager tools)
Hypertrophic chondrocytes serve as a reservoir for marrow-associated skeletal stem and progenitor cells, osteoblasts, and adipocytes during skeletal development
eLife 11:e76932.
https://doi.org/10.7554/eLife.76932


