Hedgehog regulation of epithelial cell state and morphogenesis in the larynx
- Department of Molecular Biosciences, The University of Texas at Austin, United States
- Department of Biostatistics, Johns Hopkins Bloomberg School of Public Health, United States
- Center for Stem Cell and Organoid Medicine (CuSTOM), Division of Developmental Biology, and Perinatal Institute, Cincinnati Children’s Hospital Medical Center, United States
- Department of Pediatrics, University of Cincinnati College of Medicine, United States
Figures
Figure 1 with 2 supplements
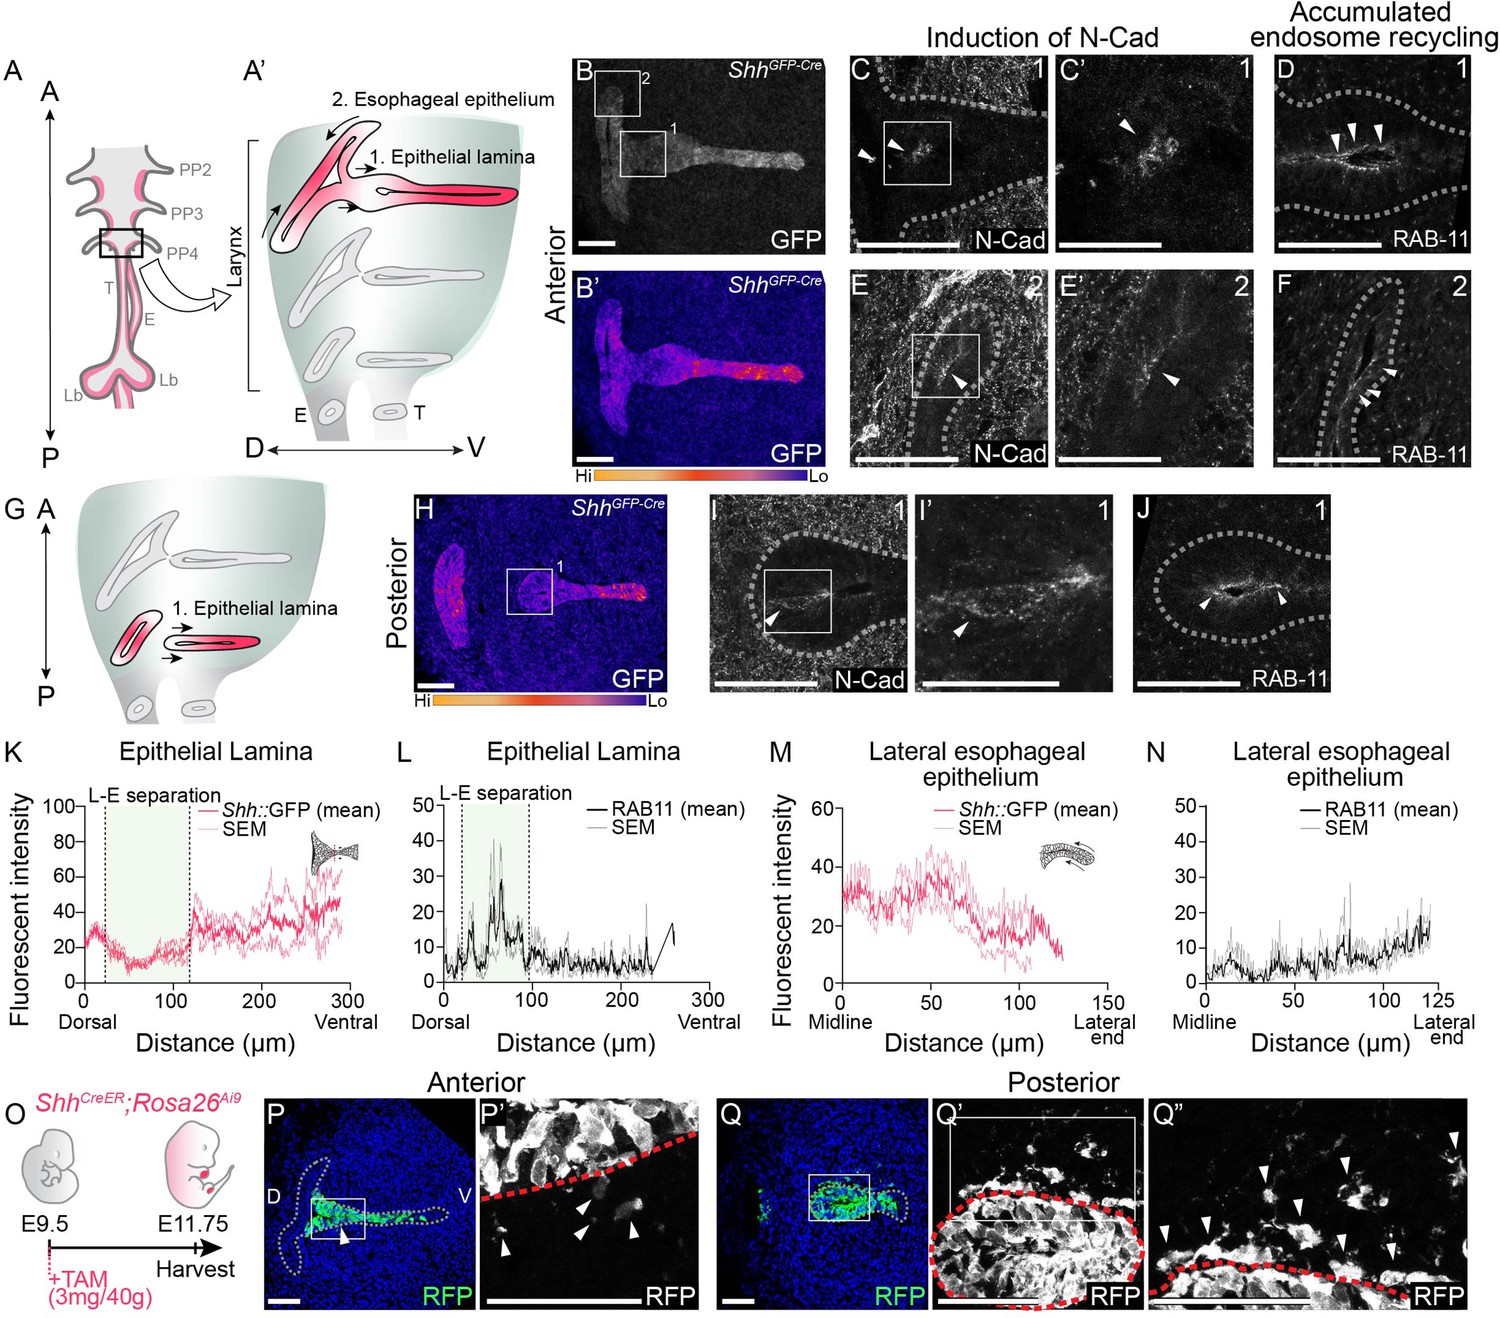
Actively remodeling epithelial cells have low Shh expression and undergo epithelial-to-mesenchymal transition (EMT) during larynx-esophageal separation and esophageal constriction.
Schematic of the anterior foregut (A) highlighting the anterior (A’) and posterior (G) larynx at E11.75. (A, B, H) GFP marking Shh expression in the anterior and posterior larynx (n = 5 for each). There is reduced GFP expression at the epithelial lamina which fuses and then separates the larynx and esophagus (region 1; B, H), and the constricting esophageal opening (region 2; B) of the larynx. (C, E–E’, I–I’). Expression of N-Cadherin at anterior or posterior regions at E11.75 (n = 3). Arrowheads mark N-Cadherin expression in the epithelium. RAB-11 was visualized at regions 1 (D, J) and 2 (F) in three larynxes. Arrowheads mark apical RAB-11 expression in the epithelium. Relative GFP expression along the epithelium at regions 1 (K) and 2 (M) was measured and averaged across three replicates by line scans of fluorescent intensity. Standard error of mean was calculated across all three replicates and plotted in light pink. Relative RAB-11 expression was measured by line scans of fluorescent intensity along the epithelium at regions 1 (L) and 2 (N) and averaged across three replicates. Standard error of mean was calculated across all three replicates and plotted in gray. (O–Q). Shh-descendant cells were visualized in three E11.75 larynxes using ShhCreER;Rosa26Ai9 lineage labeling. ShhCreER/+;Rosa26Ai9/+ embryos were induced with Tamoxifen at E9.5 and analyzed for RFP (green) expression (P–Q) at E11.75 along the anterior–posterior axis of the larynx. Arrowheads mark Shh descendants in the mesenchyme. Panels (B, B’, H, P, and Q) are single slice images. All other panels are z-projections. A – anterior; P – posterior; D – dorsal; V – ventral (panels A–J and P–Q are in the same orientation); PP 2/3/4 – pharyngeal pouches #2–4; Lar – larynx; T – trachea; E – esophagus; Lb – lung buds. (C’, E’, I’). Scale bars denote 25 µm. All other scale bars denote 50 µm.
Figure 1—figure supplement 1
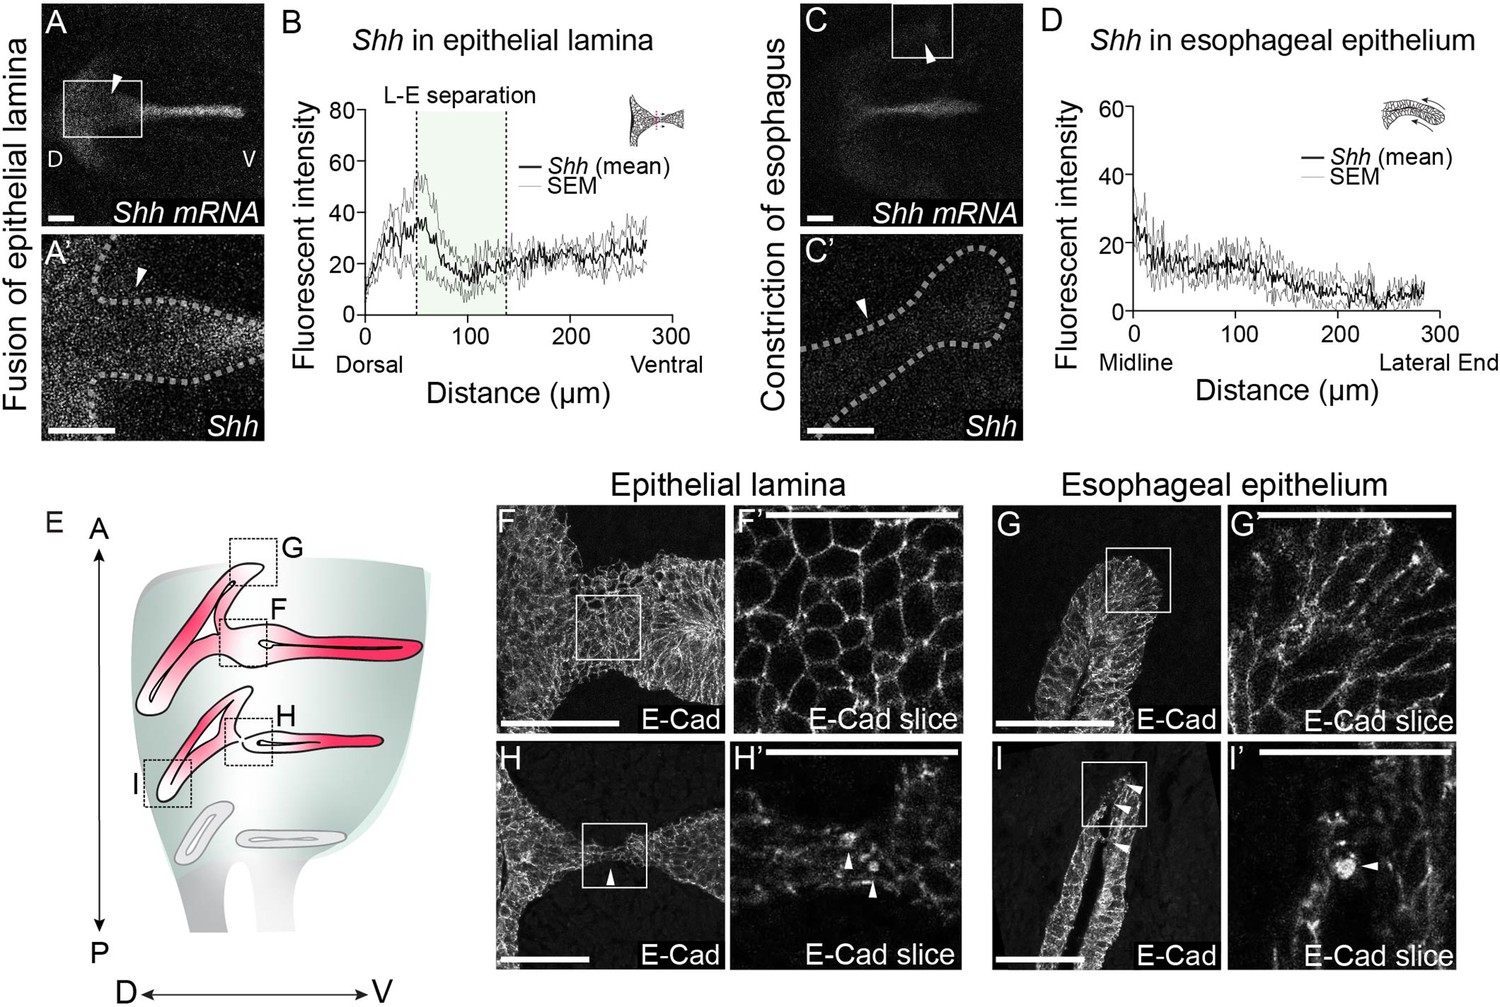
Shh expression is reduced, and E-Cadherin is re-localized in the epithelial lamina and the constricting esophagus during larynx-esophageal separation.
(A–D) Shh expression in the epithelial lamina and the constricting esophageal opening in three control E11.75 whole-mount larynxes by fluorescent in situ hybridization. Arrowheads mark low Shh expression in the epithelium. Relative Shh (B, D) expression was measured by line scans of fluorescent intensity along the epithelial lamina (A, B) and the esophagus (C, D) in all three larynxes. Graphs show average fluorescent intensity and the standard error of mean across the three replicates. (E) E-Cadherin protein expression in the epithelial lamina and the constricting esophagus in anterior larynx sections prior to larynx-esophageal separation (F, G), and more posteriorly at the level of larynx-esophageal separation (H, I). E-Cadherin expression and distribution across the cell surface were analyzed in three larynxes. (H’ and I’). Punctate E-Cadherin expression was observed in single slices at both regions of remodeling at the level of larynx-esophageal separation. Arrowheads mark E-Cadherin puncta. Panels F, G, H, I are z-projections. All other panels are single slice images. A – anterior; P – posterior; D – dorsal; V – ventral (panels A–I are in the same orientation). (F’, G’, H’, I’). Scale bars denote 25 µm. All other scale bars denote 50 µm.
Figure 1—figure supplement 2
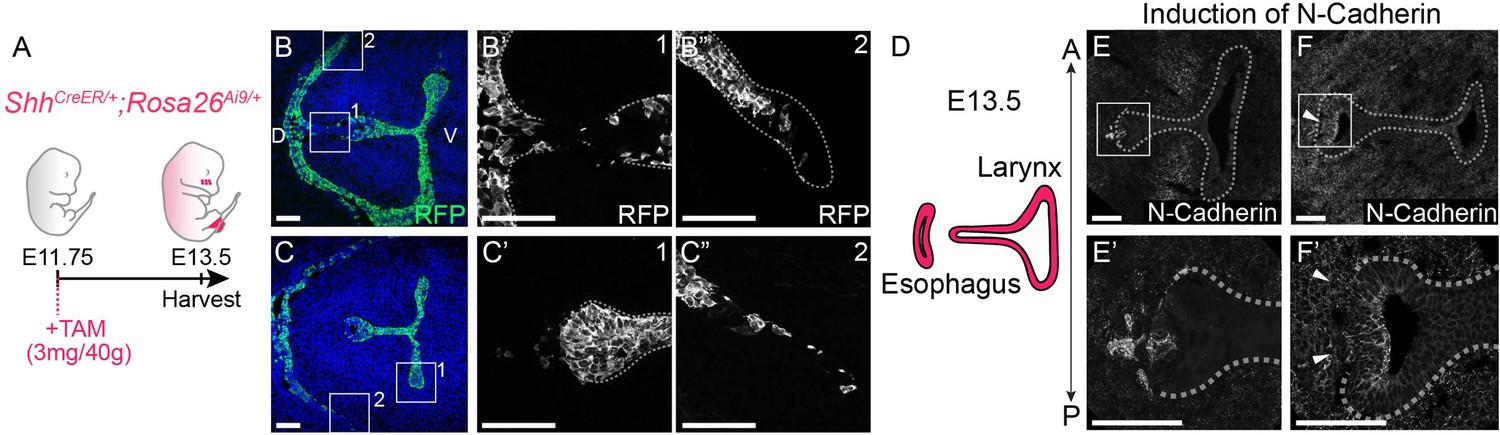
Shh-descendant cells express N-Cadherin and undergo epithelial-to-mesenchymal transition (EMT) during larynx-esophageal separation.
(A–C) ShhCreER/+;Rosa26Ai9/+ embryos (three replicates) were induced with Tamoxifen at E11.75 and examined for RFP (green) expression at E13.5 in anterior (B) and posterior (C) sections of the larynx. Arrowheads indicate extruding RFP-positive Shh-descendant cells in the mesenchyme. (D–F). N-Cadherin expression in anterior (E) and posterior (F) sections through the larynx at E13.5 at the region of larynx-esophageal separation (three replicates at each plane). Arrowheads indicate N-Cadherin expression in the epithelium. Panels B, C, E, F are single slice images. All other panels are z-projections. D – dorsal; V – ventral (panels A–F are in the same orientation). All scale bars denote 50 µm.
Figure 2 with 1 supplement

Larynx epithelial cells undergo ectopic epithelial-to-mesenchymal transition (EMT)-like cell extrusion in the absence of HH signaling.
(A). RNA-seq of wild-type (WT) and Shh−/−larynx tissue at E10.5 identified 1873 HH-dependent genes (false discovery rate (FDR) < 0.05). EMT-related genes were highly enriched among HH targets by Hallmark pathway analysis. (B) Differentially expressed EMT genes cluster into stage-specific groups. (C, D) E-Cadherin (green) expression in the epithelium across three controls and three Shh−/−s at E10.5. (E, F) N-Cadherin (red) expression within the epithelium of three controls and three Shh−/−s. Arrowheads mark cells in the lumen. (G, H) Laminin (green) expression marking the basement membrane in three controls and three Shh−/−s. Arrowheads indicate loss of Laminin from the basement membrane in Shh−/−s. (I–K) 4′,6-Diamidino-2-phenylindole (DAPI) staining marking cells within the lumen of the larynx in Shh−/−s at E10.5 and E11.5. (K) Total number of luminal cells/section were quantified in four controls and four Shh−/−s at E10.5 and in four controls and seven Shh−/−s at E11.5. Average numbers of luminal cells/section were analyzed for statistical significance using the Student’s t-test. Error bars show the standard error of the mean.**p < 0.005, ***p < 0.0005. VF-M – vocal fold mesenchyme; VF-E – vocal fold epithelium; D – dorsal; V – ventral (panels A–H are in the same orientation). Panels C’, D’, D”, E’, F’, G’, H’ are z-projections. All other panels are single slices. All scale bars denote 50 µm.
-
Figure 2—source data 1
List of all differentially expressed genes detected by RNA-seq in wild-type (n = 2 sets of 3-pooled larynx samples) compared to Shh–/–(n = 2 sets of 3-pooled larynx samples) pooled larynx samples at E10.5 (32–35 s) .
We defined significantly differentially expressed genes using an adjusted p-value or false discovery rate (FDR) <0.05. RNA-seq data can be found on GEO (accession number GSE190281.)
- https://cdn.elifesciences.org/articles/77055/elife-77055-fig2-data1-v2.xlsx
Figure 2—figure supplement 1
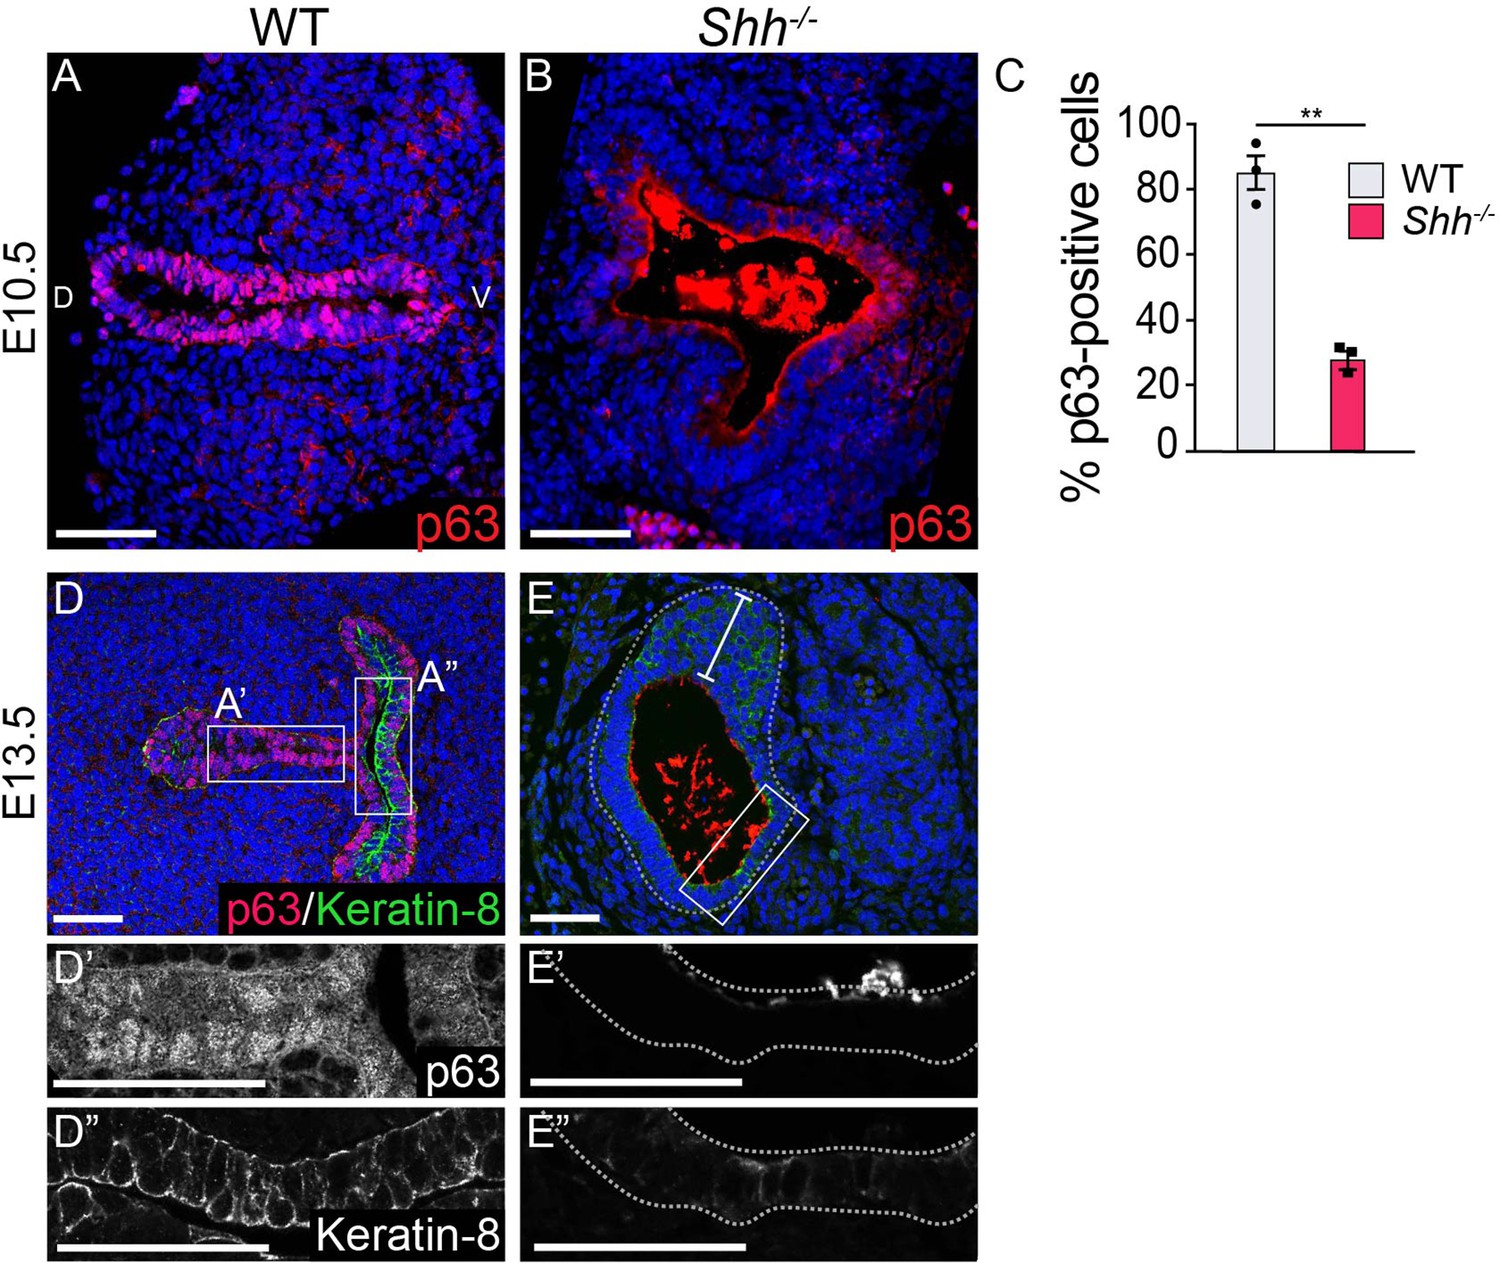
A loss of p63 expression in Shh–/– laryngeal epithelia.
(A–C) p63 expression (pink) marks stratified epithelial progenitors in the larynx at E10.5. Non-cellular staining in panel B is non-specific signal from the anti-mouse secondary antibody. (C) The percentage of epithelial cells expressing p63 was averaged across three controls and three Shh–/–s and analyzed using a Student’s t-test (**p < 0.005). Error bars show the standard error of the mean. (D, E) p63 (pink) and Keratin-8 (green) expression in three control and three Shh–/– larynxes at E13.5. Panels A, B, D, E are single slice images. All other panels are z-projections. D – dorsal; V – ventral (panels A–E are in the same orientation). All scale bars denote 50 µm.
Figure 3 with 3 supplements
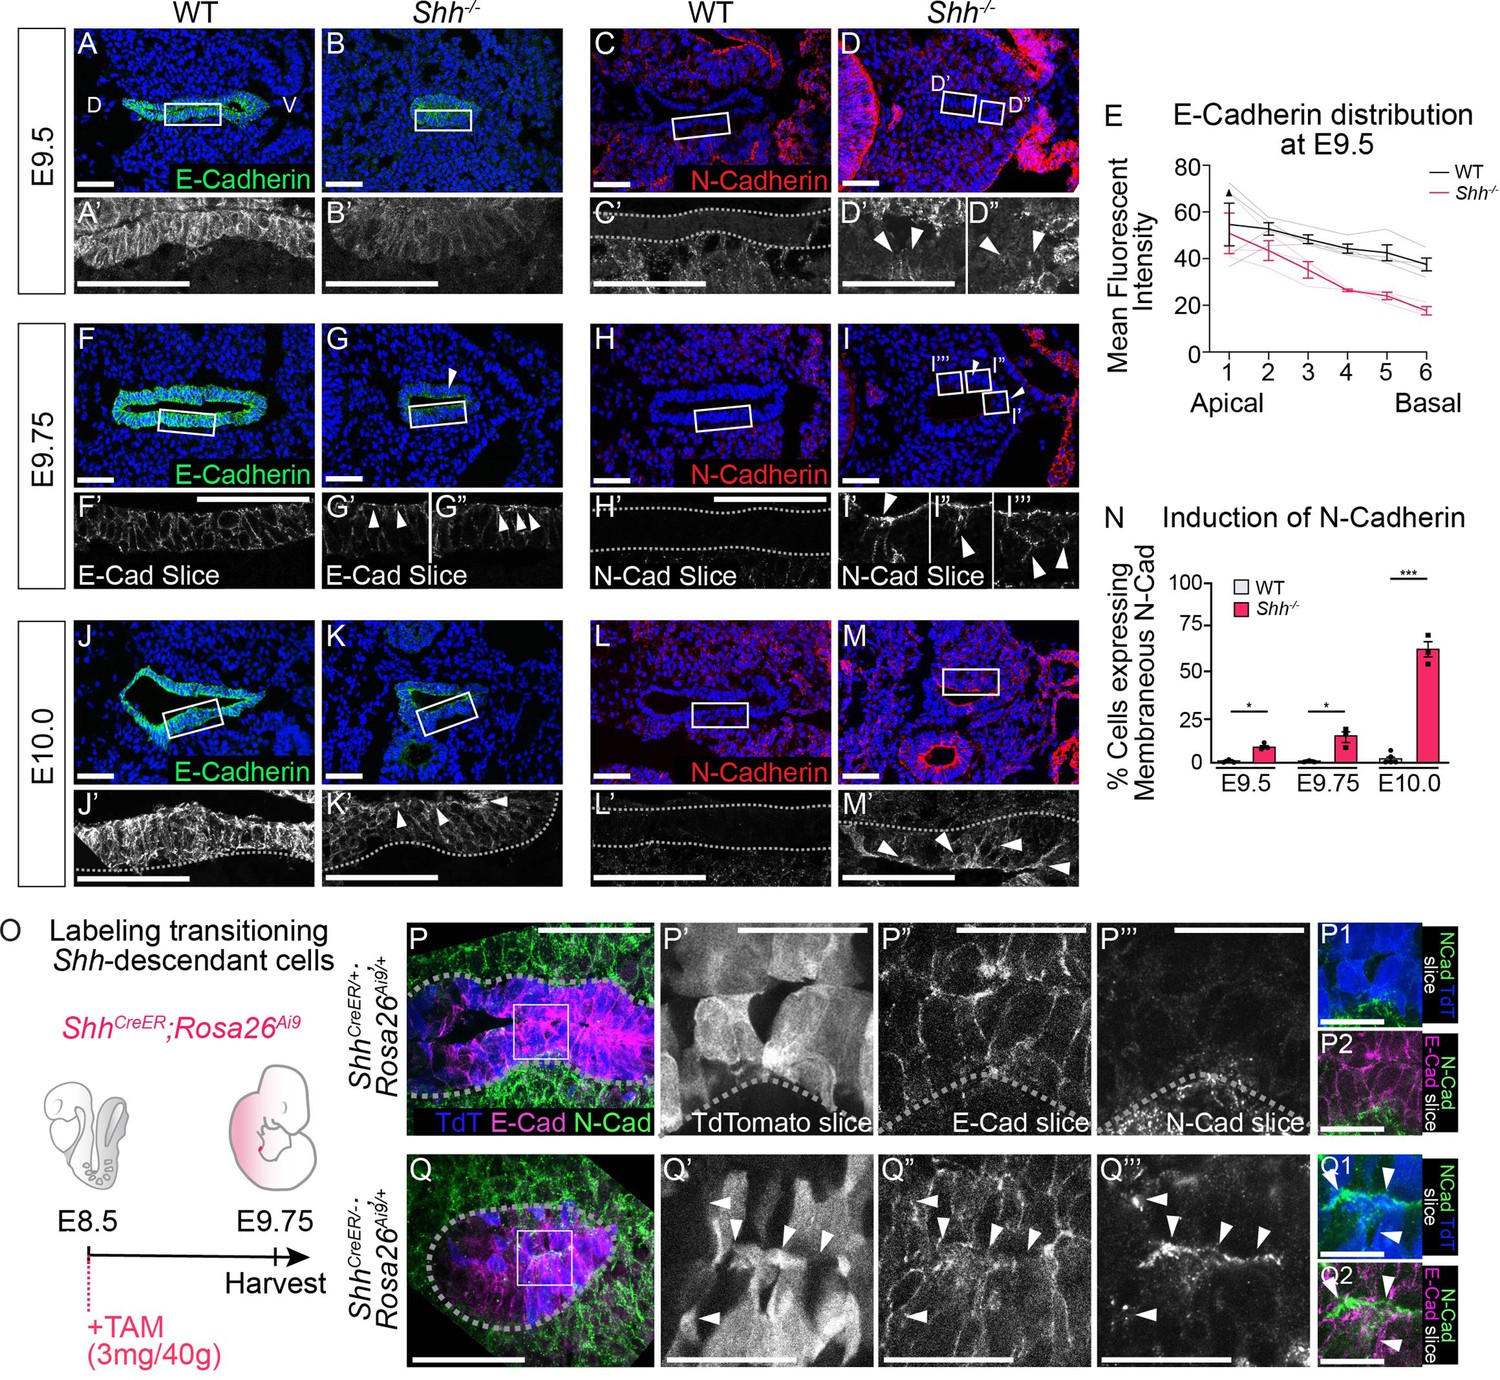
HH signaling is required to prevent a cadherin switch within the epithelium during early stages of foregut development.
E-Cadherin expression (A, B; green) and N-Cadherin expression (C, D; red) in four control and three Shh−/− larynxes at E9.5 (24–26 somites). Arrowheads mark N-Cadherin expression in the epithelium. (E) E-Cadherin distribution along the apical–basal axis of the epithelium in four controls and three Shh−/−s at E9.5. Error bars show standard error of the mean. E-Cadherin expression (F, G; green) and N-Cadherin expression (H, I; red) in three control and three Shh−/− larynxes at E9.75 (27–29 somites). Arrowheads mark apical E-Cadherin puncta (G–G”) and N-Cadherin expression in the epithelium (I–I’’’). E-Cadherin expression (J–K; green) and N-Cadherin expression (L–M; red) was examined in three control and three Shh−/− larynxes at E10.0 (30–31 somites). Arrowheads mark apical E-Cadherin (K’) and membranous N-Cadherin expression in the epithelium (M’). (N) The percentage of N-Cadherin-expressing cells within the epithelium at E9.5, E9.75, and E10.0 was averaged across three to five controls and three Shh−/− larynxes at each stage and analyzed for significance using the Student’s t-test (*p < 0.05, ***p < 0.0005). Error bars indicate the standard error of the mean. (O) Shh-fate mapping in control (ShhCreER/+;Rosa26Ai9/+) and mutant (ShhCreER/−;Rosa26Ai9/+) embryos (four replicates each). Td-Tomato (TdT) labeling was induced with Tamoxifen at E8.5 and visualized at E9.75. (P–Q) Sections were analyzed for E-Cadherin (E-Cad; magenta) and N-Cadherin (N-Cad; green) expression as well as Td-Tomato (TdT; blue) expression. Arrowheads mark regions of E-Cadherin and N-Cadherin expression along the membrane of a Td-Tomato-positive cell. D – dorsal; V – ventral (all panels are in the same orientation). Panels A–D, F–I”, J–M, P’–P2, Q’–Q2 are single slice images. Panels A’, B’, C’, D’-D”, J’, K’, L’, M’, P, Q are z-projections. P’–P2, Q’–Q2. Scale bars denote 25 µm. All other scale bars denote 50 µm.
Figure 3—figure supplement 1
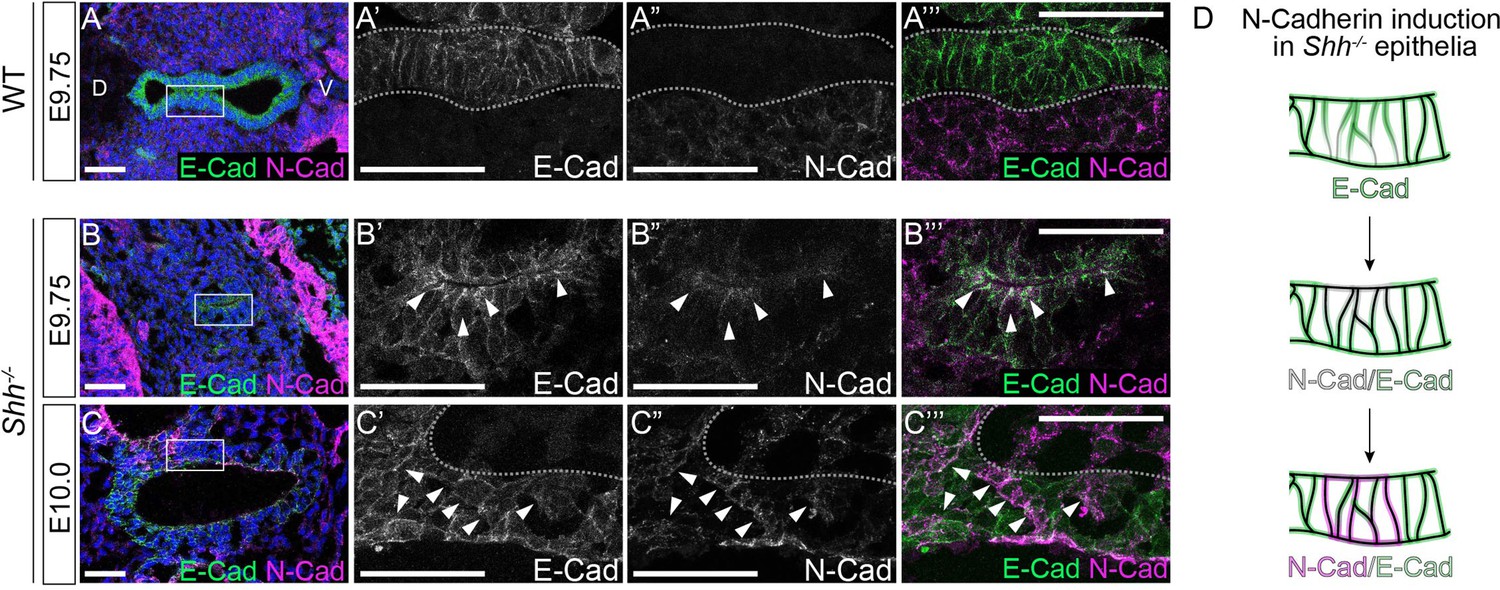
Larynx epithelial cells coexpress E-Cadherin and N-Cadherin during early stages of foregut development in the absence of HH signaling.
E-Cadherin (green) and N-Cadherin (magenta) in the vocal fold epithelium of three control and three Shh−/− embryos at E9.75 (27–28 s) (A, B) and at E10.0 (29–31 s) (C, D). Schematic of N-Cadherin induction in Shh−/− epithelia. Arrowheads mark regions of coexpression along the apical surface as well as along the cell boundaries. All panels are single slice images. D – dorsal; V – ventral (panels A–C are in the same orientation). All scale bars denote 50 µm.
Figure 3—figure supplement 2
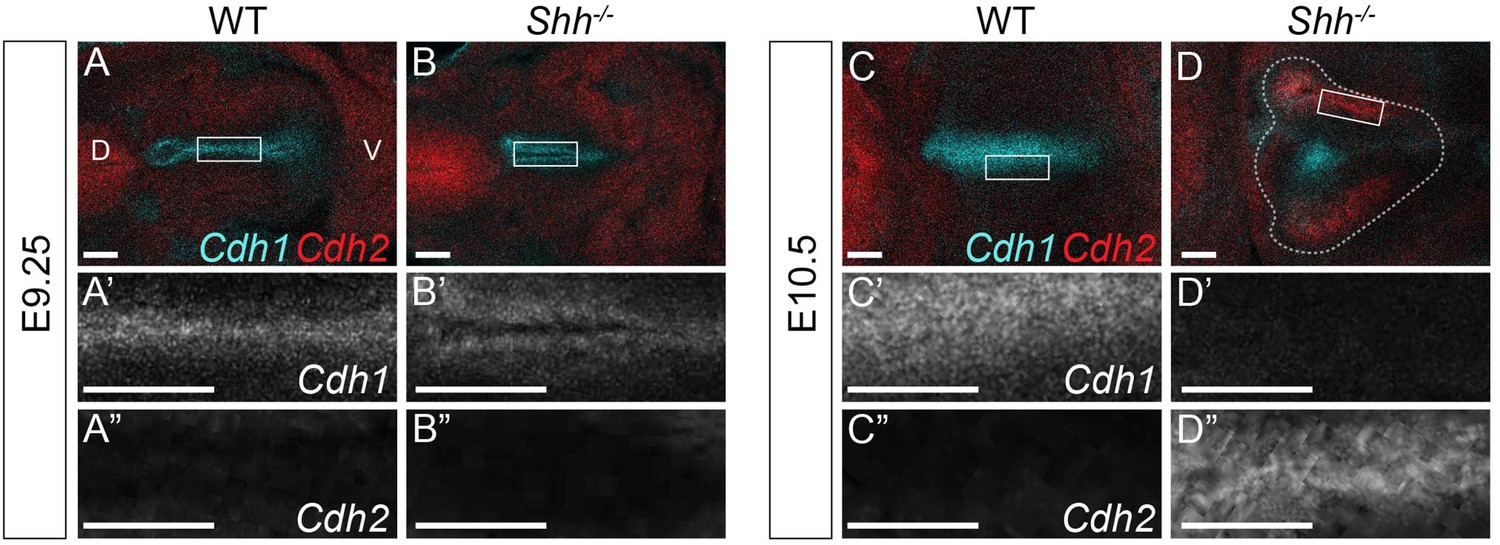
HH is required to maintain Cdh1 expression in the early anterior foregut.
Cdh1 (cyan) and Cdh2 (red) expression by whole-mount fluorescent in situ hybridization in three control and three Shh−/− larynxes at E9.25 (A–B) and at E10.5 (C–D). All panels are single slice images. D – dorsal; V – ventral (all parenls are in the same orientation). All scale bars denote 50 µm.
Figure 3—figure supplement 3
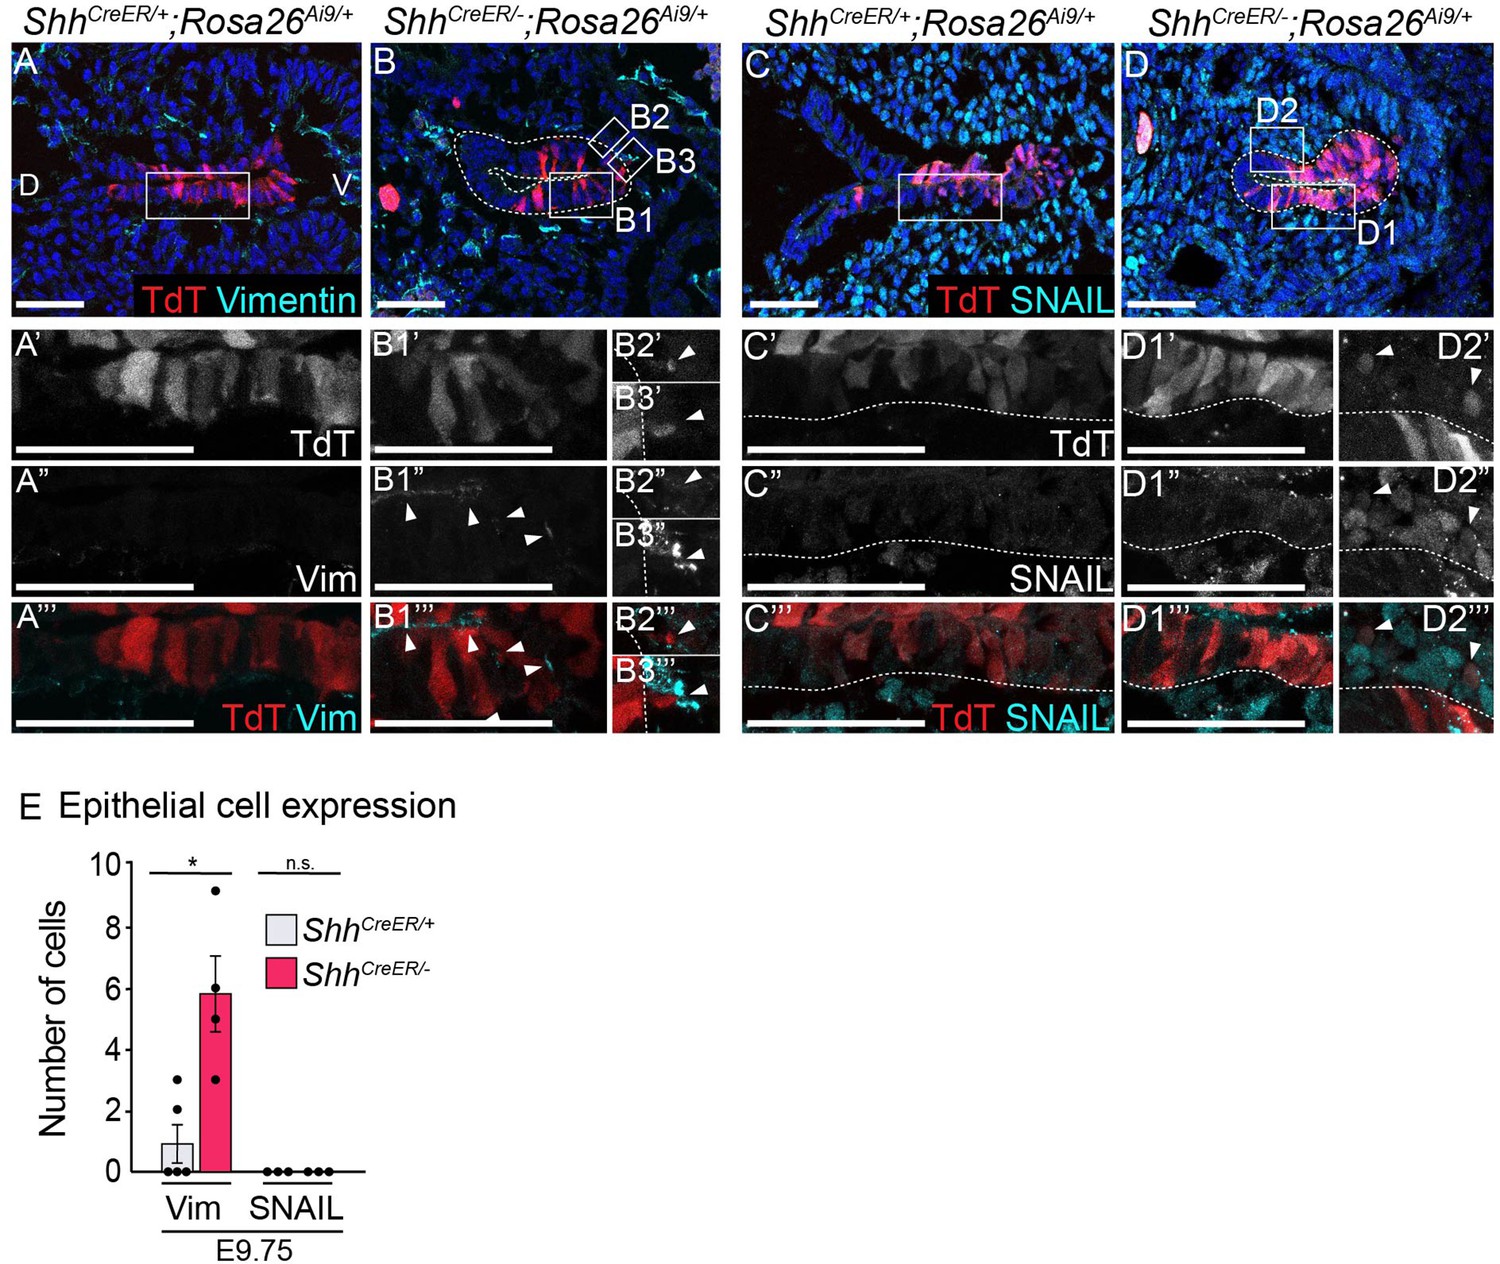
Vimentin and SNAIL in Shh−/− cells that leave the epithelium.
(A–B, E) TdT expression (red) and Vimentin expression (cyan) was examined in five control (ShhCreER/+;Rosa26Ai9/+) and four mutant (ShhCreER/−;Rosa26Ai9/+) larynxes at E9.75. (C–D, E) TdT-expression (red) and SNAIL expression (cyan) was examined in three control and four mutant larynxes at E9.75. Arrowheads indicate Vimentin expression (B1”–B1’’’) and Shh-descendant cells within the mesenchyme (B2’–B3’’’, D2’–D2’’’). (E) The number of Vimentin- and SNAIL-expressing cells was quantified across three to five controls and three to four mutants and analyzed for significance using a Student’s t-test (*p < 0.05, n.s. – not significant). Error bars indicate the standard error of the mean. Panels A, B, C, D are single slice images. All other panels are z-projections. D – dorsal; V – ventral (panels A–D are in the same orientation). All scale bars denote 50 µm.
Figure 4 with 6 supplements
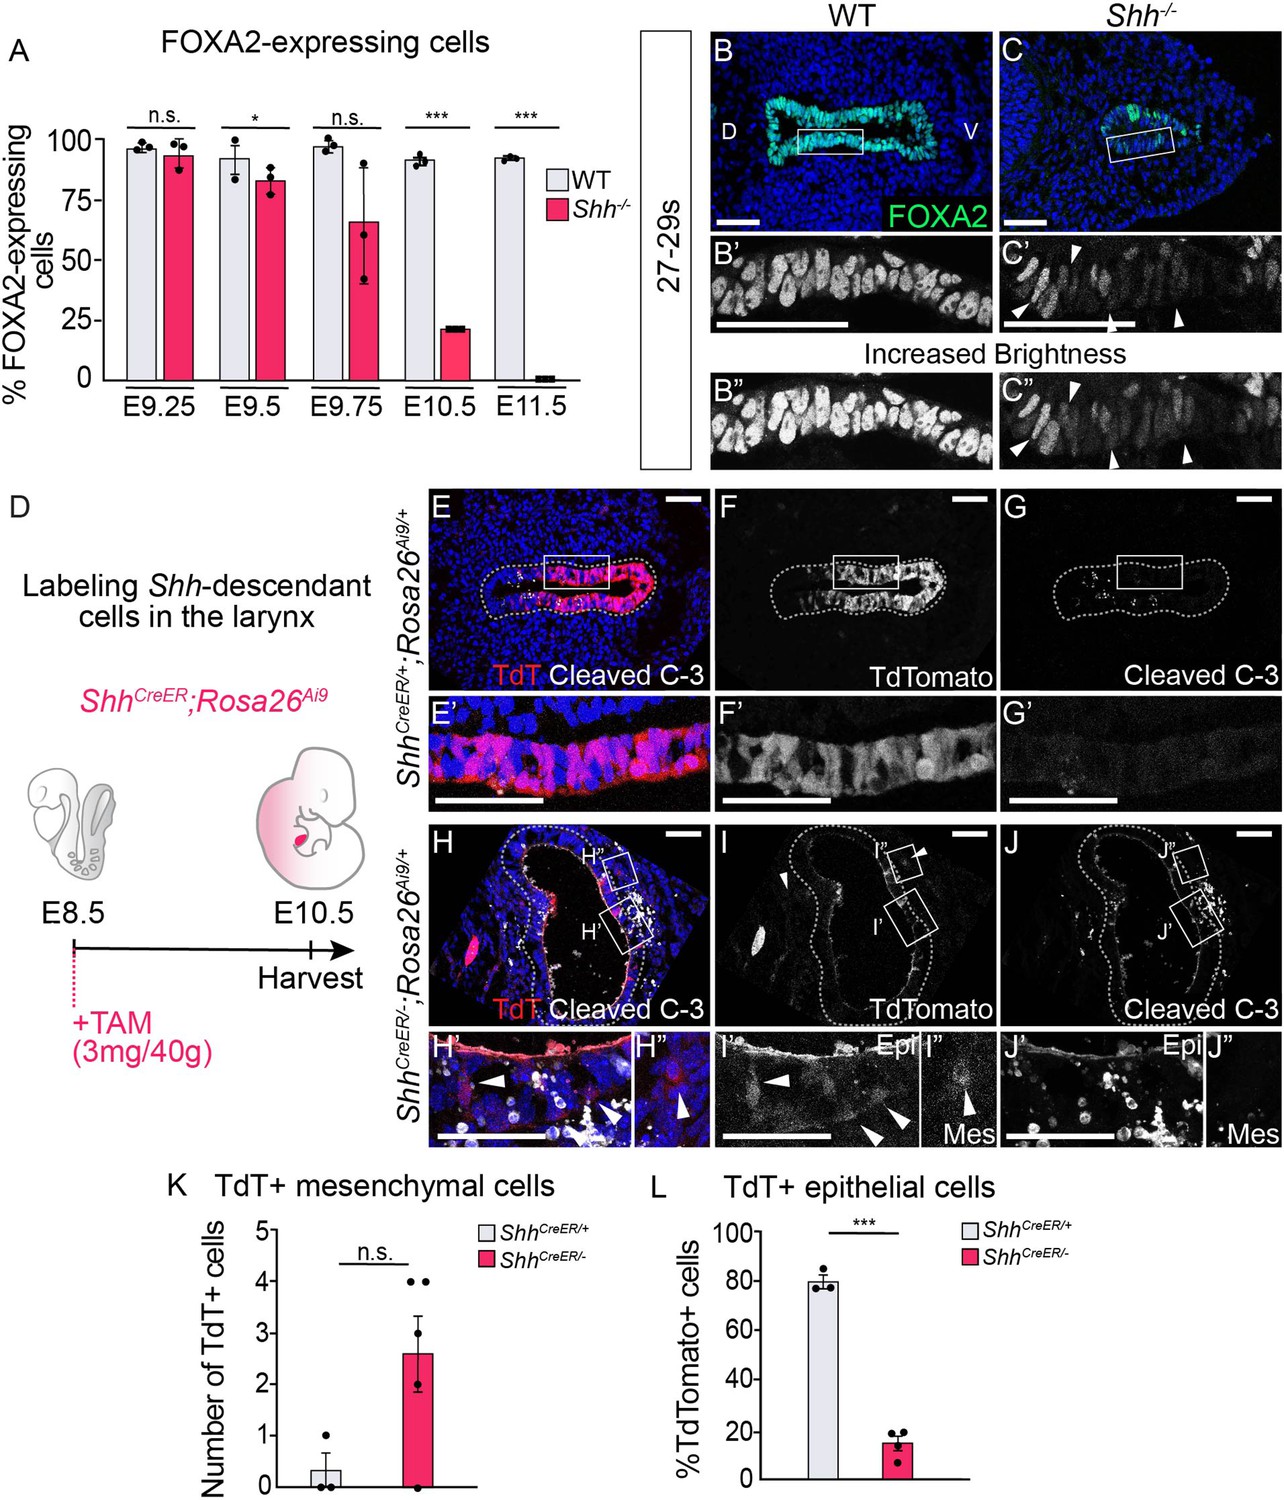
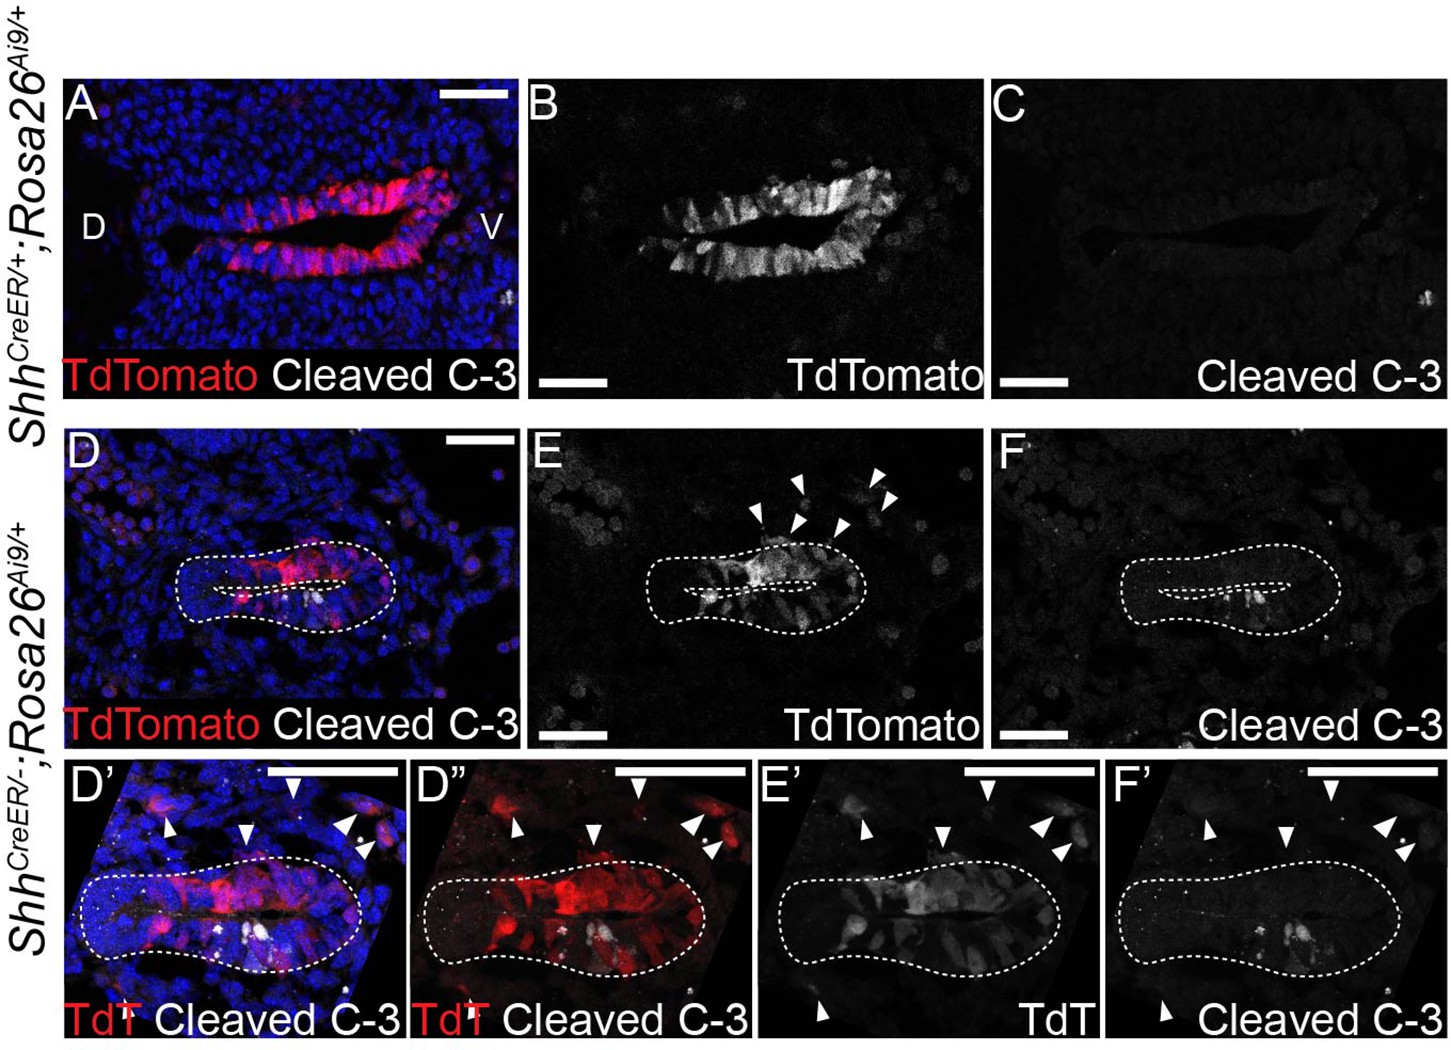
Epithelial cells lose FOXA2 and leave the epithelium in the absence of HH signaling.
(A) FOXA2 expression in control and Shh−/− larynxes at E9.25 (21–23 s), E9.5 (24–26 s), E9.75 (27–29 s), E10.5 (31–35 s), and E11.5 (42–44 s). The percentage of epithelial cells expressing FOXA2 in three control and three Shh−/− larynxes was averaged at each developmental stage and analyzed for significance using a Student’s t-test. Error bars show the standard error of the mean. (B–C) FOXA2 (green) expression is reduced in Shh−/−s by E9.75 (27–29 s) compared to controls. Arrowheads indicate FOXA2-low cells (B’, B”). Panels B and C have been repeated in Figure 4—figure supplement 1E–F for clarity. (D–J) Three control (ShhCreER/+;Rosa26Ai9/+) (E–G) and five mutant (ShhCreER/−,Rosa26Ai9/+) (H–J) embryos were induced with Tamoxifen at E8.5 and analyzed for TdTomato (TdT)-expressing Shh-descendant cells (in red; E–F, H–I) and for Cleaved Caspase-3 expression (in white; E,G,H,J) in the larynx at E10.5 (30–34 s). Arrowheads indicate Shh-descendant cells within the epithelium (I’) and within the mesenchyme (H”, I”). (K) The number of TdT-expressing cells found in the mesenchyme in three controls (ShhCreER/+) and five mutants (ShhCreER/-) was quantified and tested for significance using the Student’s t-test. Error bars show the standard error of the mean. (L) The percentage of TdT-expressing cells within the ventral half of the epithelium in three controls (ShhCreER/+) and four mutants (ShhCreER/−) was quantified and tested for significance using the Student’s t-test. Source data for panels K, L can be found in Supplementary file 1. Error bars show the standard error of the mean. *p < 0.05, ***p < 0.0005; n.s. – not significant. Panels B, C, E, F, G, H, I, J are single slice images. All other panels are z-projections. D – dorsal; V – ventral (all panels are in the same orientation). All scale bars denote 50 µm.
Figure 4—figure supplement 1
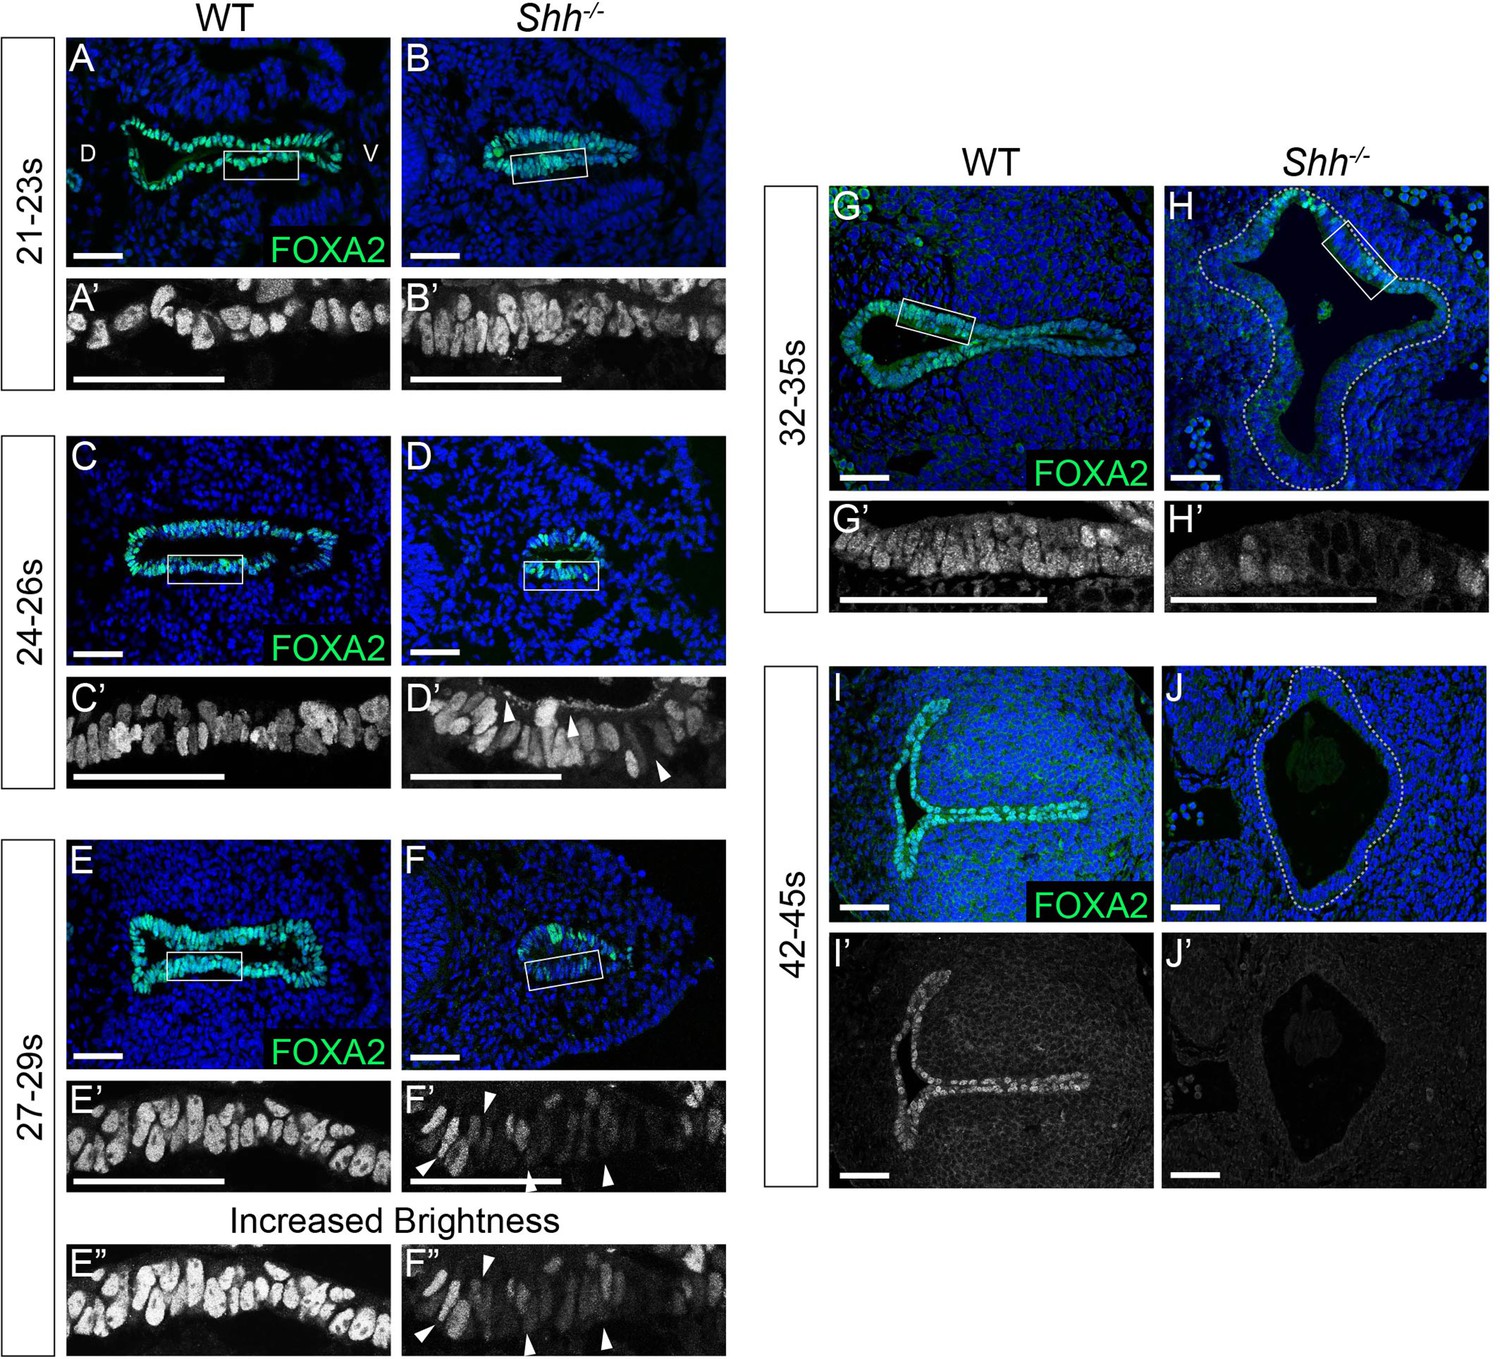
FOXA2 is downregulated in the early foregut endoderm and absent from the larynx epithelium by E11.5 in Shh−/−s.
FOXA2 expression (green) in control and Shh−/− larynxes at E9.25 21–23 s (A–B), E9.5 24–26 s (C–D), E9.75 27–29 s (E–F), E10.5 32–35 s (G–H), and E11.5 42–45 s, (I–J) Arrowheads indicate apical (D’), and low-level FOXA2 expression in the epithelium (F’–F”). Three controls and three mutants were examined at each timepoint. Please note that panels E, F are the same images shown in Figure 3B, C, respectively. D – dorsal; V – ventral (all panels are in the same orientation). Panels A, B, C, D, E, F, G, H, I-J’ are single slice images. All other panels are z-projections. All scale bars denote 50 µm.
Figure 4—figure supplement 2
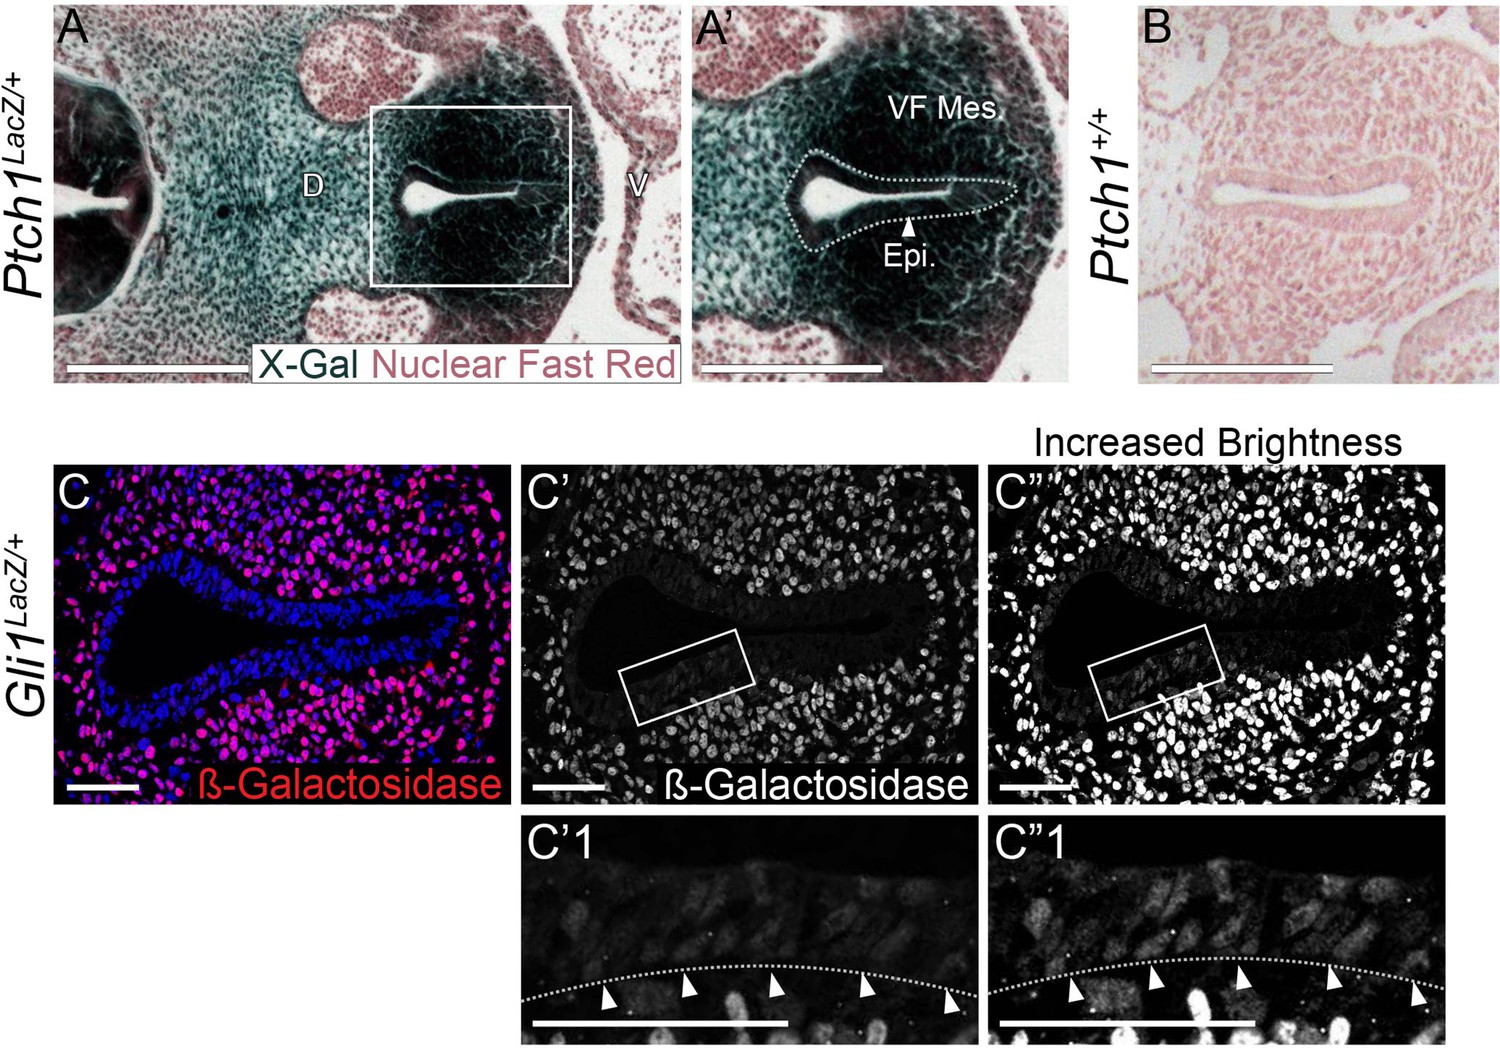
PtchLacZ and Gli1LacZ expression is present within the larynx epithelium as well as the mesenchyme at E10.5.
(A–A’) PtchLacZ expression by β-galactosidase (marked by X-Gal in dark blue) staining of three PtchLacZ/+ embryos at E10.5. Embryos were fixed in 1% formaldehyde/0.2% glutaraldehyde, stained in 1 mg/ml X-gal for 4 hr and sectioned to generate 5-µm sections that were then counterstained with Nuclear Fast Red. Arrowhead indicates the larynx epithelium. (B) Sections through the larynx from control (Ptch+/+) embryos stained for β-galactosidase and Nuclear Fast Red. (C–C”) Gli1LacZ expression within the larynx epithelium and mesenchyme of three Gli1LacZ/+ E10.0 embryos was assessed using a β-galactosidase antibody (red; Abcam ab9361). Arrowheads indicate low-level β-galactosidase expression in the larynx epithelium. All panels are single slice images. VF Mes – vocal fold mesenchyme; Epi – epithelium; D – dorsal; V – ventral (all panels are in the same orientation). Scale bars in panels A–B denote 250 µm; all other scale bars denote 50 µm.
Figure 4—figure supplement 3
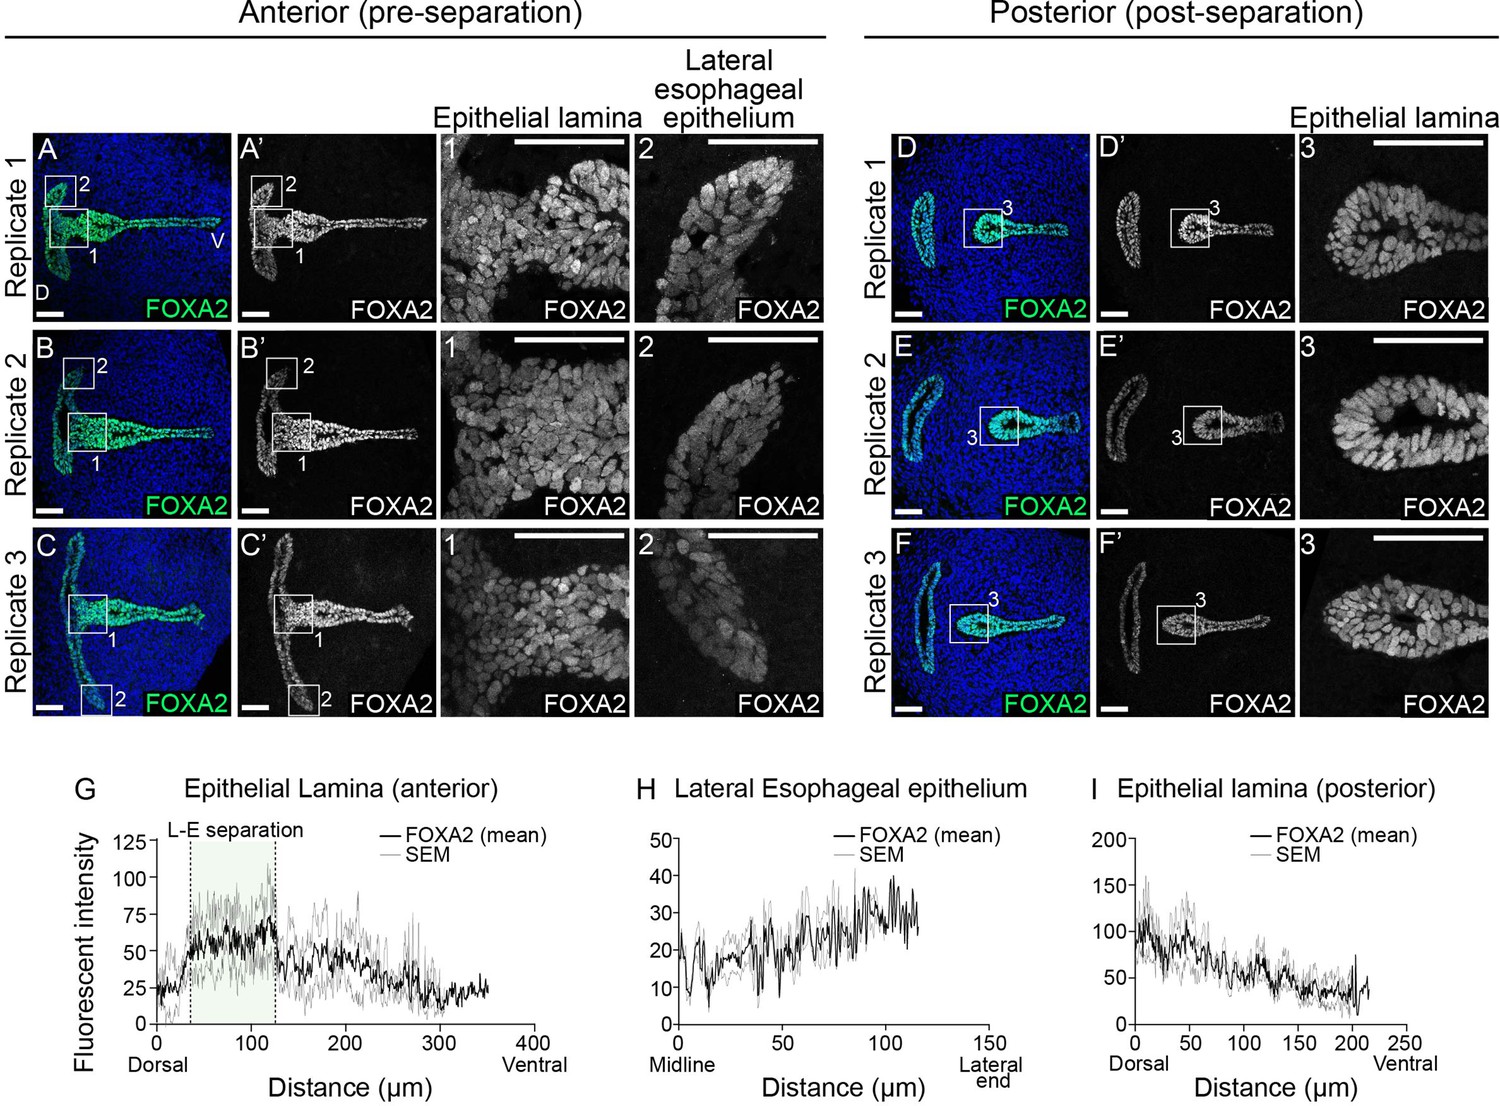
FOXA2 is not downregulated in the epithelial lamina or the lateral esophageal epithelium during larynx-esophageal separation.
(A–C) FOXA2 expression in the epithelial lamina (1) and the lateral ends of the constricting esophageal opening (2) in anterior (pre-larynx-esophageal separation) larynx sections at E11.75 (48–52 s). (D–F) FOXA2 expression in the epithelial lamina (3) in posterior (post-larynx-esophageal separation) larynx sections at E11.75 (48–52 s). Relative FOXA2 expression along the epithelium at regions 1 (G) and 2 (H) in anterior sections and at region 3 (I) in posterior sections. The standard error of mean is plotted in gray. n = 3 biological replicates; the replicates in panels A, B are from Swiss Webster embryos while the other replicates are from ShhGFP-Cre/+ embryos. Panels A1–2, B1–2, C1–2, D3, E3, F3 are z-projections. All other panels are single slice images. D – dorsal; V – ventral (panels A–F are in the same orientation). Scale bars denote 50 µm.
Figure 4—figure supplement 4
Mutant epithelial cells leave the epithelium but do not undergo cell death until E10.5 in the absence of HH signaling.
Five control (ShhCreER/+;Rosa26Ai9/+) (A–C) and six mutant (ShhCreER/−;Rosa26Ai9/+) (D–F) embryos were induced with Tamoxifen at E8.5 and analyzed for TdTomato (TdT)-expressing Shh-descendant cells (in red; A–B, D–E) and for Cleaved Caspase-3 expression (in white; C, F) in the larynx at E9.75. Arrowheads indicate Shh-descendant cells within the mesenchyme (D’–F’). Panels D’, D”, E’, F’ are z-projections. All other panels are single slice images. D – dorsal; V – ventral (all panels are in the same orientation). All scale bars denote 50 µm.
Figure 4—figure supplement 5
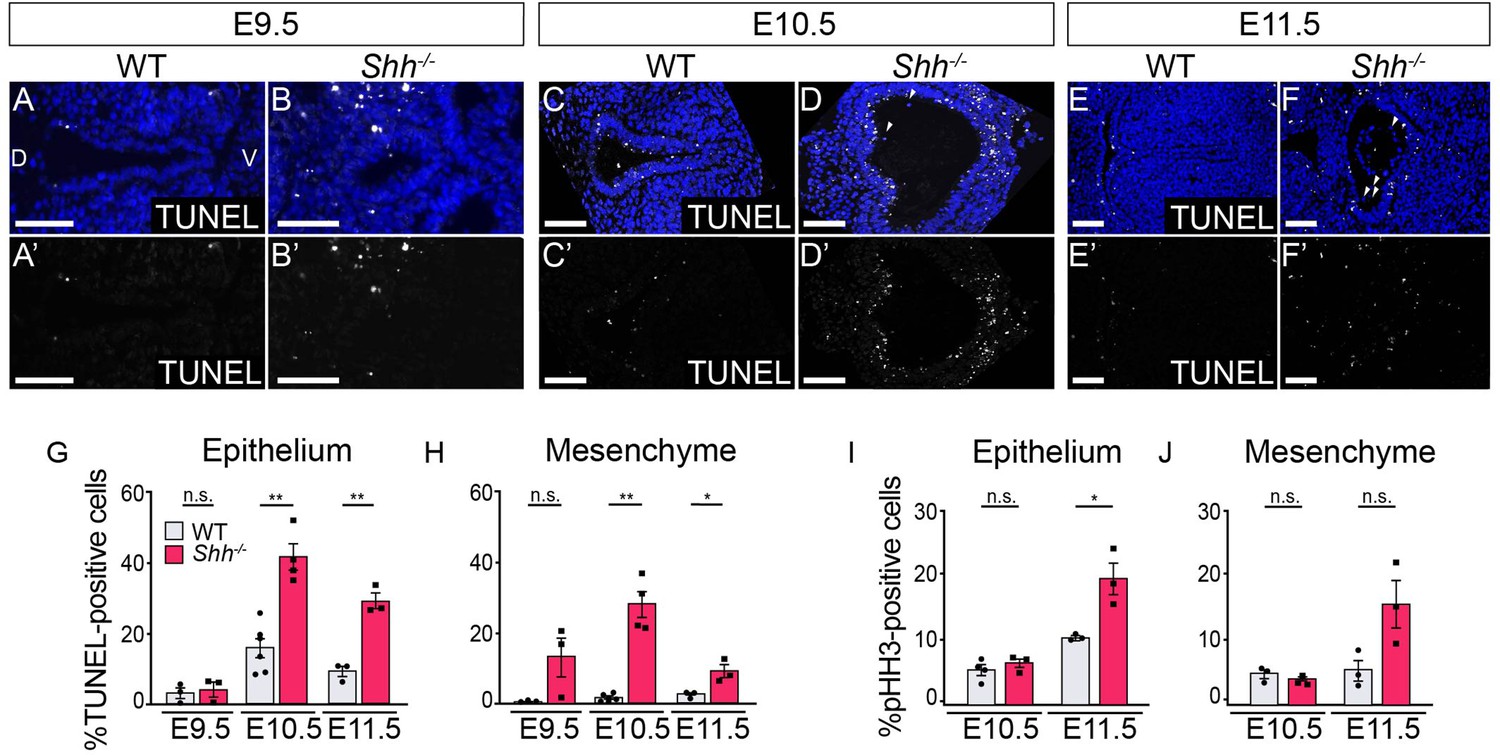
HH signaling is required for the survival of epithelial and mesenchymal cells within the larynx.
TUNEL staining of control and Shh−/−s at E9.5 (A–B), 10.5 (C–D), and E11.5 (E–F) within the epithelium and mesenchyme of the vocal folds. (G, H) The percentage of TUNEL-positive cells within the epithelium and mesenchyme was quantified over three to five replicates each at E9.5, E10.5, and E11.5. (I, J) The percentage of proliferative pHH3-positive cells within the epithelium and mesenchyme in controls and Shh−/−s was quantified over three to five replicates at E10.5 and E11.5. Average counts were analyzed for significance using a Student’s t-test, and error bars denote the standard error of mean. *p < 0.05, **p < 0.005; n.s. – not significant. All panels are single slice images. D – dorsal; V – ventral (panels A–F are in the same orientation). All scale bars denote 50 µm.
Figure 4—figure supplement 6
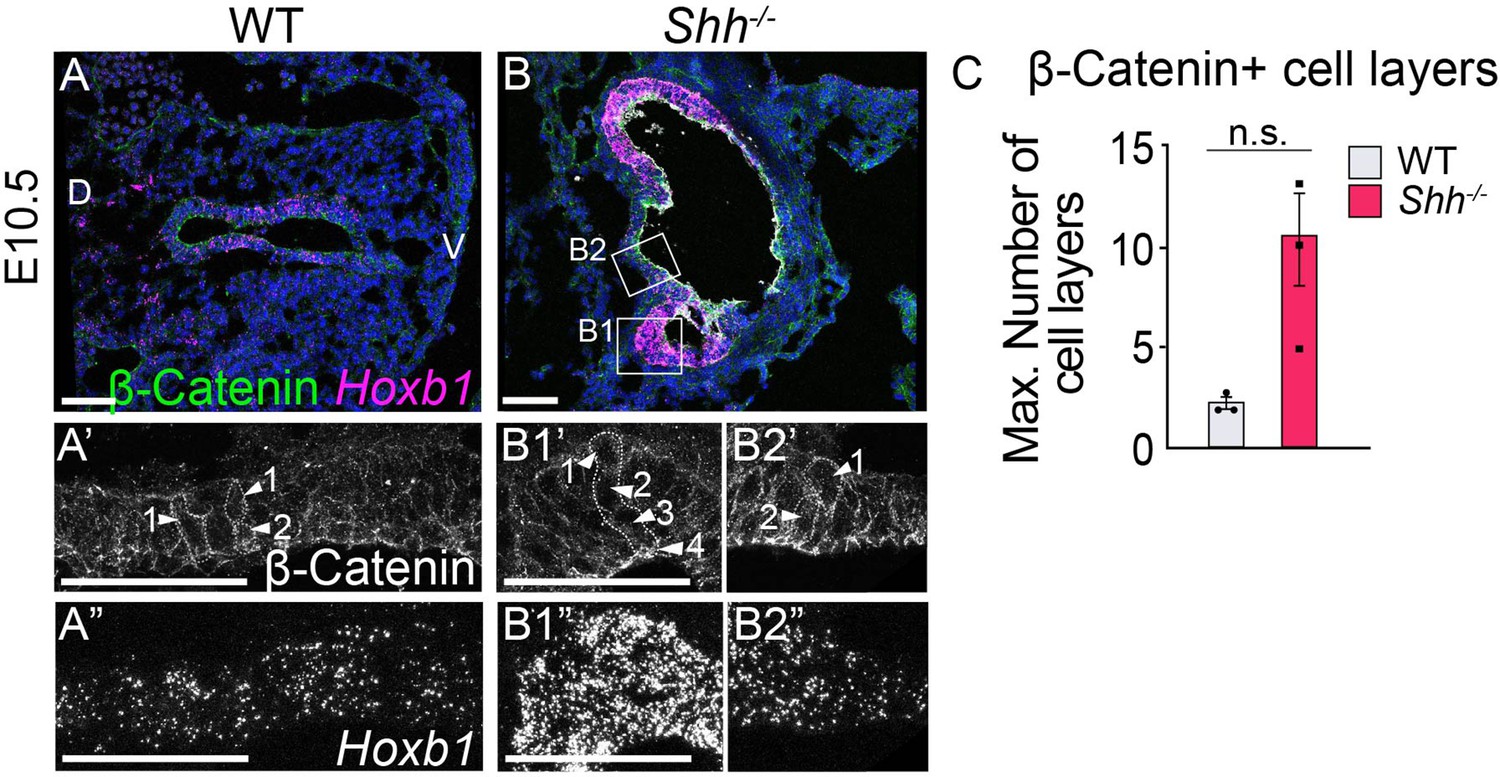
Loss of Shh results in thickening and cell disorganization of the epithelial layer.
(A–C) β-Catenin (green) marks cell layers within the epithelium, highlighting the thickening of the foregut epithelium in this tissue. Hoxb1 expression (magenta) marks the axial plane of the larynx and fourth pharyngeal pouches at E10.5 (three control and three Shh−/− larynxes). Note the fusion of the fourth pharyngeal pouches (expressing high Hoxb1, panel B1”) and the larynx epithelium (expressing low Hoxb1, panel B2”). (C) The number of cell layers was averaged across three controls and three Shh−/−s and analyzed using a Student’s t-test (n.s. – not significant). Error bars show the standard error of the mean. (A’, B1’–B2’) Arrowheads mark cell layers within two regions of the epithelium. Panels A, B are single slice images. All other panels are z-projections. D – dorsal; V – ventral (panels A–B are in the same orientation). All scale bars denote 50 µm.
Figure 5 with 3 supplements
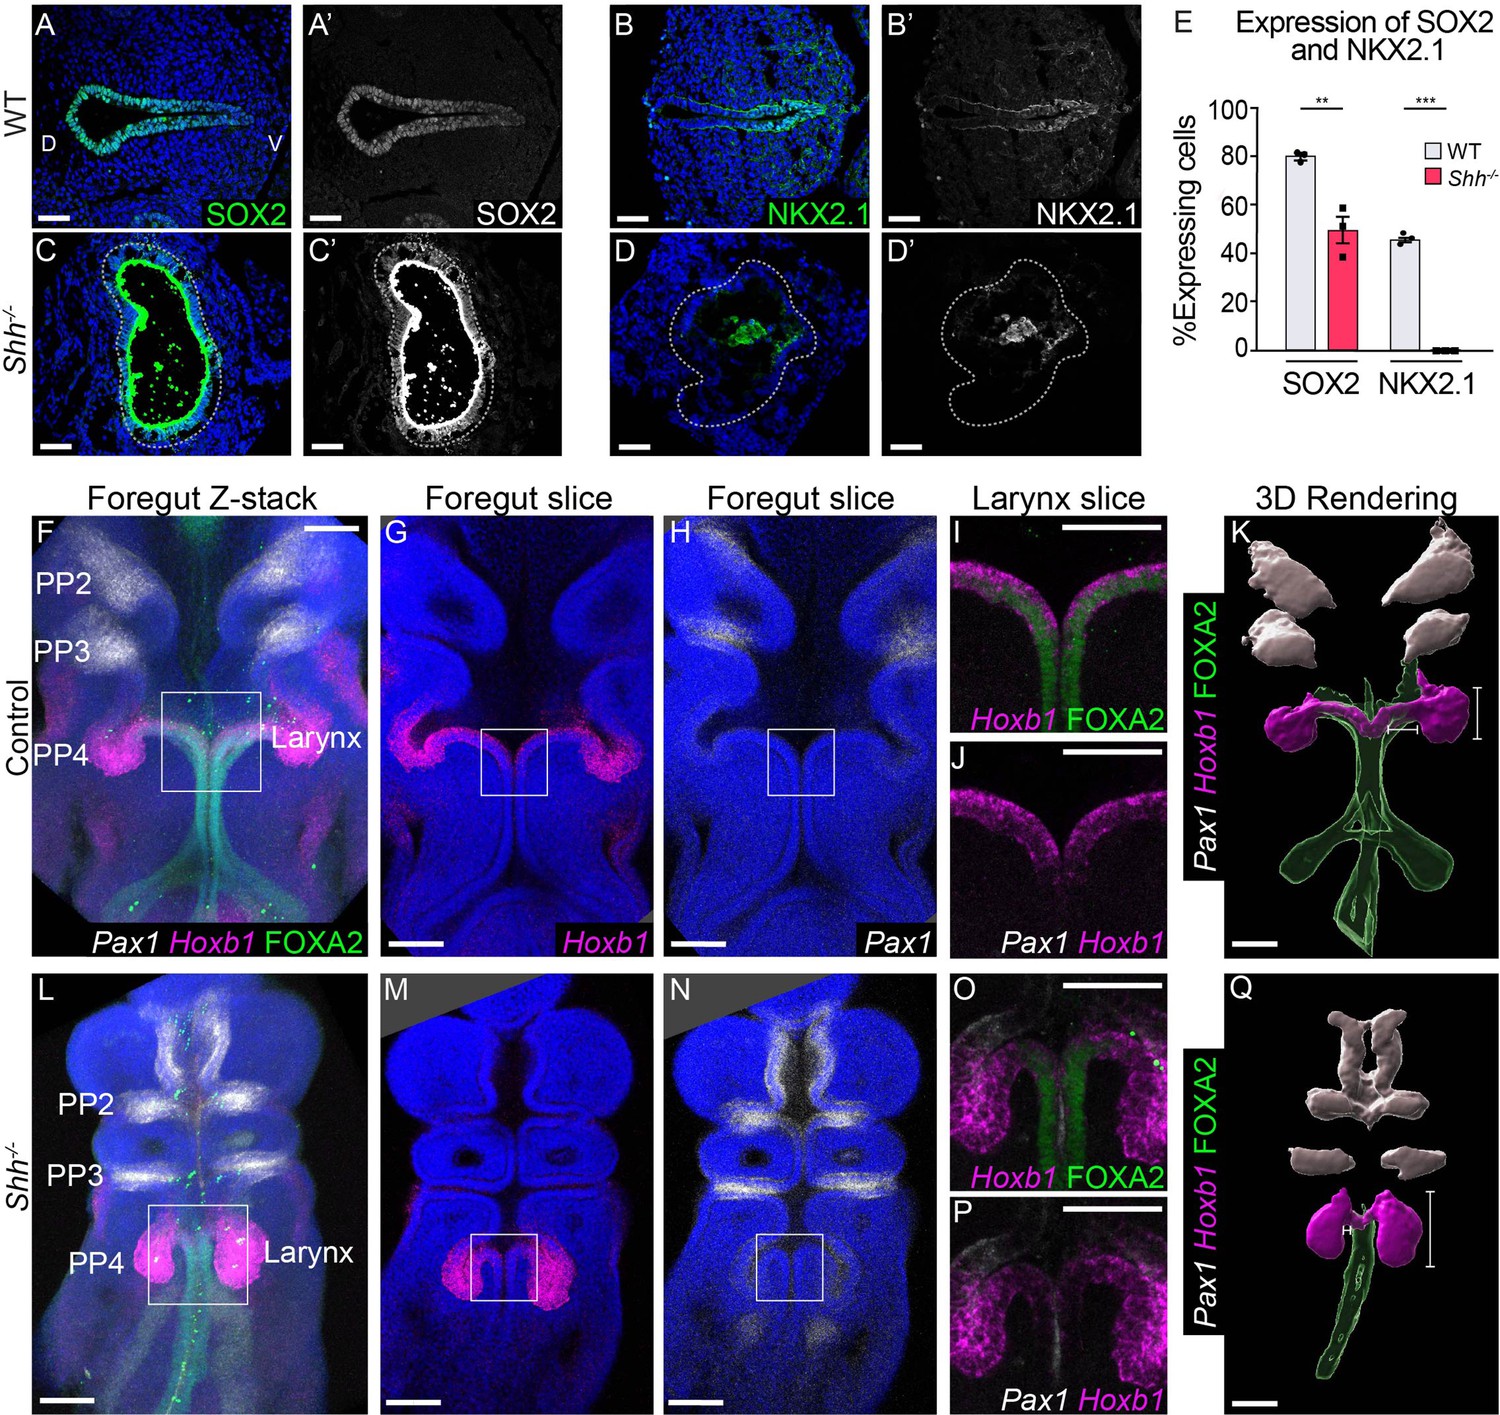
Shh-descendant larynx epithelial cells are replaced by an unknown population of cells in the absence of HH signaling.
SOX2 (A, C) and NKX2.1 (B–D) expression in three control and Shh−/− larynxes at E10.5 (32–35 s, n = 3 per genotype). Apical staining along the epithelium in panels C–C’, D–D’ is non-specific signal from anti-mouse secondary antibodies. (E) The percentage of SOX2- and NKX2.1-expressing cells within the epithelium was quantified in three controls and three Shh−/−s each at E10.5 and analyzed for significance using the Student’s t-test (**p < 0.005 ***p < 0.0005). Error bars plot the standard error of the mean. (F–J, L–P) Pax1 (white), Hoxb1 (magenta), and FOXA2 (green) expression in three control and Shh−/− foreguts at E10.5 (30–32 s, n = 3 per genotype; Pax1, Hoxb1, and FOXA2 channels were imaged for each replicate). (K, Q) Three-dimensional renderings of Pax1, Hoxb1, and FOXA2 expression domains along the foregut epithelium in control and Shh−/− foreguts at E10.5. Panels F, L, K, Q have been repeated in Figure 5—figure supplement 2 for clarity. Panels A–D’, G–J, M–P are single slice images. All other panels are z-projections. PP – pharyngeal pouch; D – dorsal; V – ventral (panels A–D are in the same orientation). Scale bars denote 50 µm (A–D) and 100 µm (F–M).
Figure 5—figure supplement 1
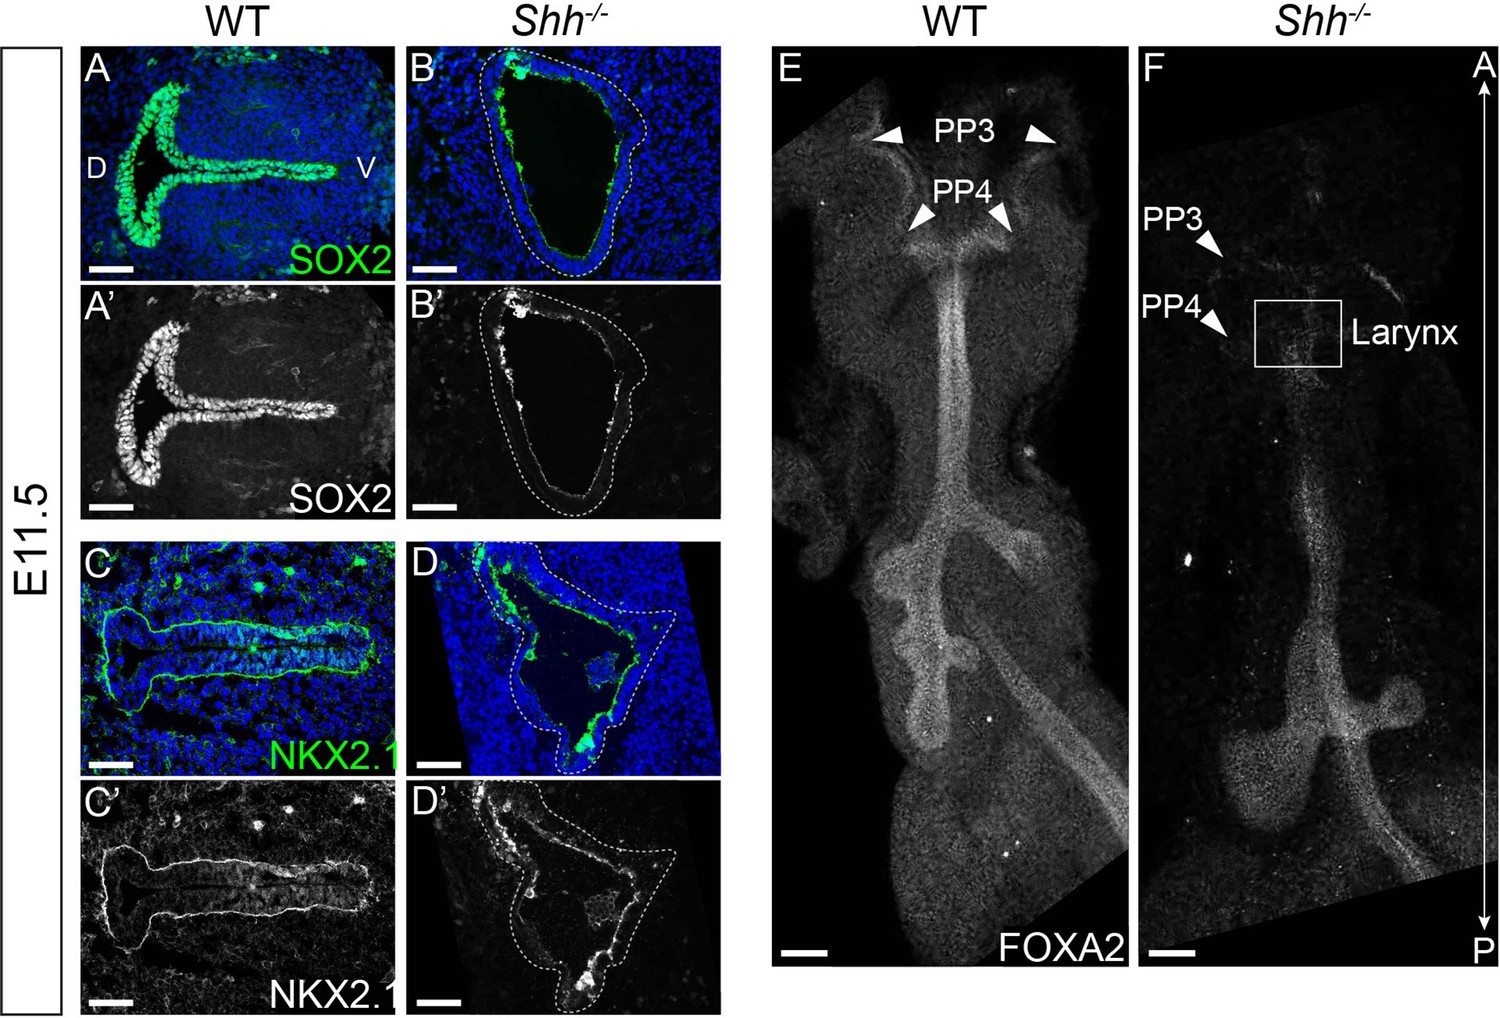
SOX2, NKX2.1, and FOXA2 are absent from the larynx epithelium by E11.5 in Shh−/−s.
SOX2 (green; A–B) and NKX2.1 (green; C–D) expression within the epithelium of three control and three Shh−/−s at E11.5. (E, F) Sagittal view of whole-mount FOXA2 expression along the anterior foregut in E11.5 control (three replicates) and Shh−/− (three replicates) embryos. Arrowheads indicate the third and fourth pharyngeal pouches. All panels are single slice images. PP3 and PP4 denote the third and fourth pharyngeal pouches; D – dorsal; V – ventral; A – anterior; P – posterior (panels A–D are in the same orientation; panels E, F are in the same orientation). All scale bars denote 50 µm.
Figure 5—figure supplement 2
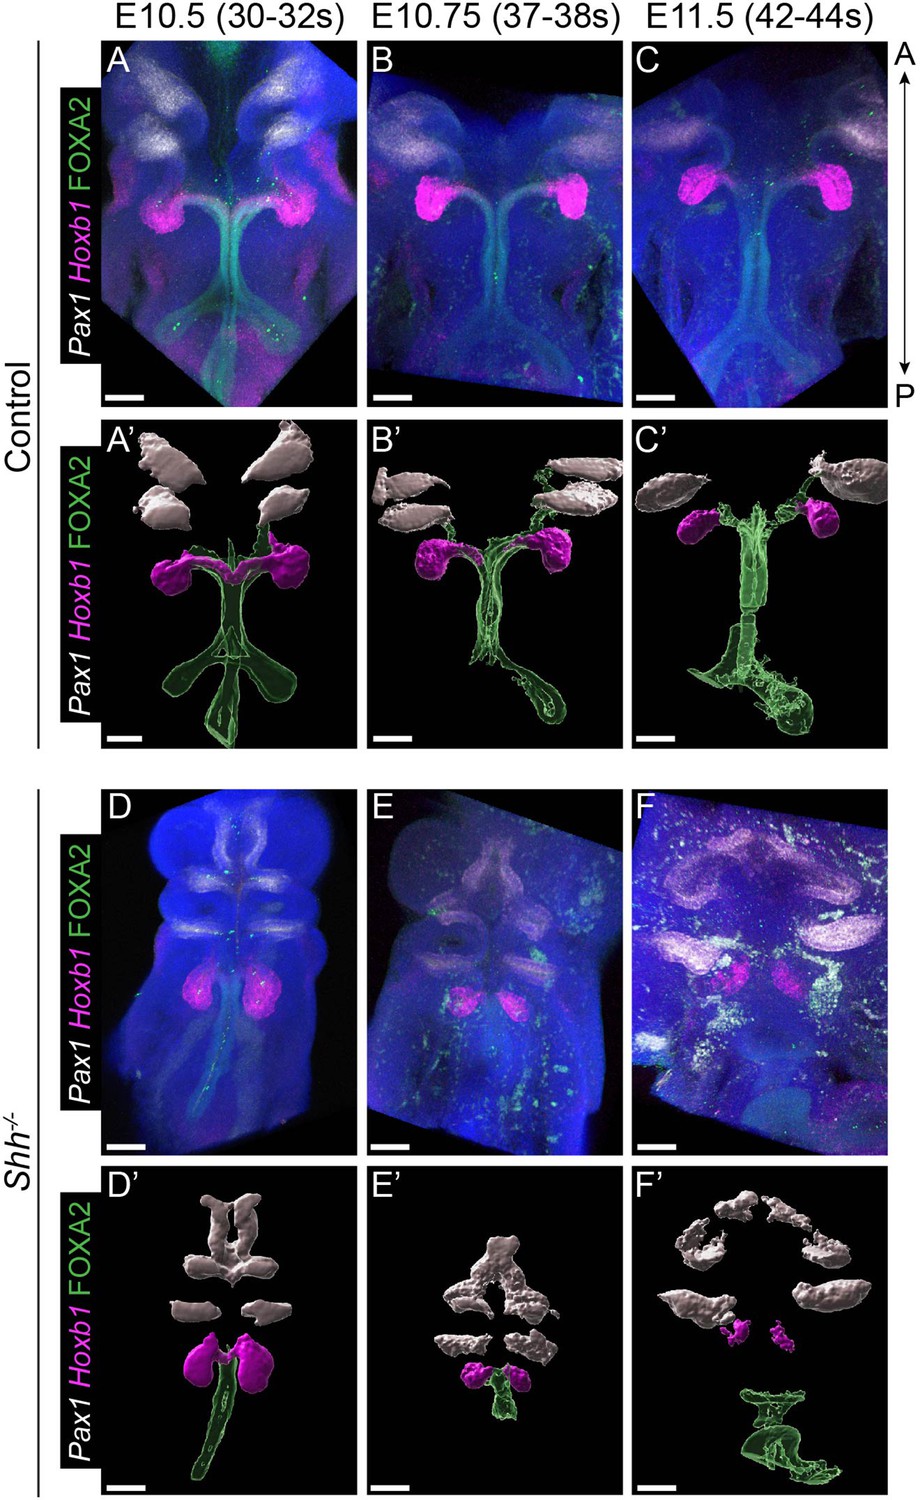
Pharyngeal pouch marker Pax1 does not extend into the larynx in the absence of HH signaling.
(A–F) Pax1 (white), Hoxb1 (magenta), and FOXA2 (green) expression mark the second to third pharyngeal pouches, the fourth pharyngeal pouch and the foregut epithelium, respectively, in control and Shh−/−s at E10.5 (30–32 s), E10.75 (37–38 s), and E11.5 (42–44 s). Hoxb1 expression additionally marks the larynx epithelium at early stages (A–B, A’–C’, D’–F’). Three-dimensional renderings of Pax1, Hoxb1, and FOXA2 expression domains (representative images from three replicates per genotype per timepoint) at E10.5, E10.75, and E11.5. Please note that panels (A–A’) and (D–D’) are the same images shown in Figure 5F, K, L, Q, respectively. Panels A, B, C, D, E, F are z-projections. are A – anterior; P – posterior (all panels are in the same orientation). All scale bars denote 100 µm.
Figure 5—figure supplement 3
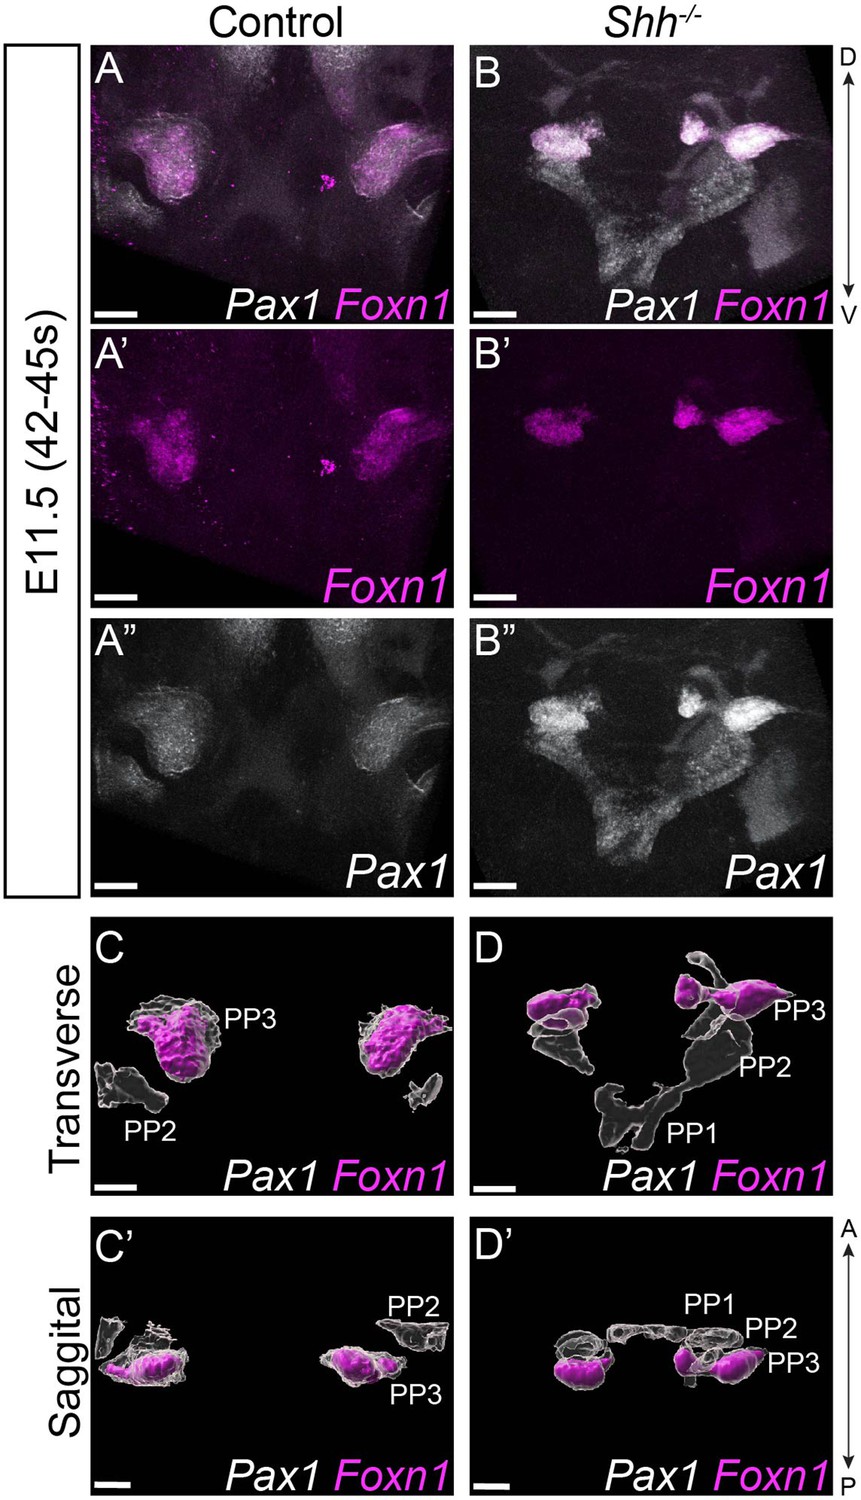
Foxn1-expression is not extended beyond the third pharyngeal pouch in the absence of HH signaling.
(A–D) Pax1 (white) and Foxn1 (magenta) expression in three control and three Shh−/− embryos at E11.5 (42–45 s). (C–D’) Three-dimensional renderings of Pax1 and Foxn1 expression domains within the third pharyngeal pouch of control and Shh−/− embryos at E11.5 from a traverse (C, D) and sagittal (C’, D’) perspectives. Panels (A–B”) are single slice images. PP – pharyngeal pouch; D – dorsal; V – ventral; A – anterior; P – posterior (panels A–D are in the same orientation; panels (C’–D’) are in the same orientation). Scale bars denote 100 µm.
Figure 6
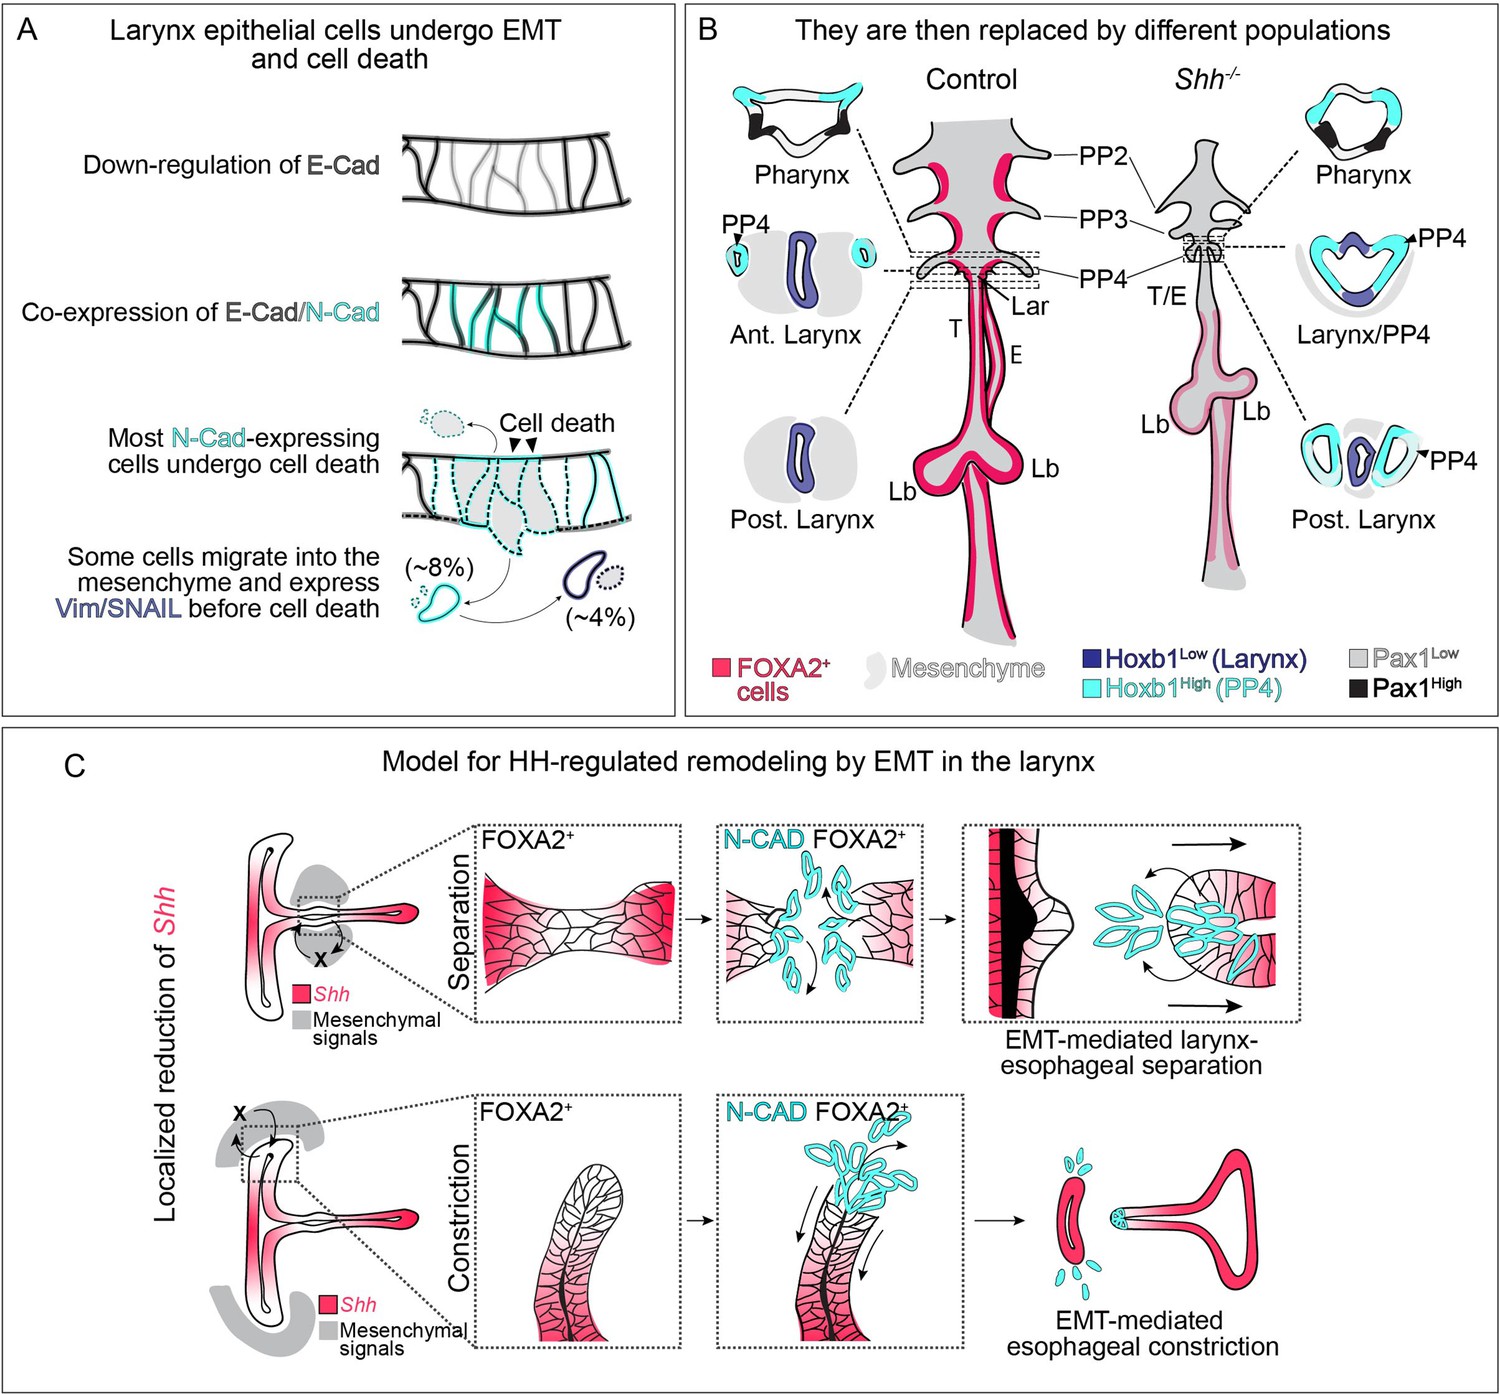
Dynamic HH signaling drives the homeostasis of the early anterior foregut endoderm and may also regulate later stages of larynx remodeling.
(A) Epithelial cells marked by E-Cadherin (gray) in the anterior foregut undergo a cadherin switch (marked by the induction of N-Cadherin expression in cyan), cell death and are cleared from the epithelium in the absence of HH signaling. Some cells (8%) migrate out of the foregut epithelium and a subset express mesenchymal markers (Vimentin and SNAIL expression in dark blue; 4%) prior to cell death. (B) We propose that the original larynx epithelial cells (expressing FOXA2 in pink) are replaced by cells derived from the fourth pharyngeal pouch (marked by high Hoxb1 expression in cyan) which have fused to the laryngeal epithelium (marked by low Hoxb1 expression in dark blue) in anterior sections. (C) Proposed model for epithelial-to-mesenchymal transition (EMT)-mediated morphogenesis at later stages of larynx development. Dynamic Shh (pink) expression within the larynx epithelium drives EMT-mediated morphogenesis resulting in larynx-esophageal separation and esophageal constriction. PP 2/3/4 – pharyngeal pouches #2–4, Lar – larynx, T – trachea, E – esophagus, Lb – lung buds.
Tables
Key resources table
| Reagent type (species) or resource | Designation | Source or reference | Identifiers | Additional information |
|---|---|---|---|---|
| Genetic reagent (M. musculus) | Shhtm1amc (Shh+/−) | Jackson Laboratory (Lewis et al., 2001) | Jackson Cat# 003318, MGI Cat# 3584154, RRID:MGI:3584154 | Swiss Webster background |
| Genetic reagent (M. musculus) | Cg-Shhtm1(EGFP/cre)Cjt (ShhGFP-Cre) | Jackson Laboratory (Harfe et al., 2004) | Jackson Cat#: 005622; MGI Cat#: 92505; RRID: IMSR_JAX:005622 | Mixed background |
| Genetic reagent (M. musculus) | Ptch1tm1Mps/J (PtchLacZ) | Jackson Laboratory (Goodrich et al., 1997) | Jackson Cat#: 003081; MGI Cat#: 42441; RRID: IMSR_JAX:003081 | BL6-background |
| Genetic reagent (M. musculus) | Gli1tm2Alj/J (Gli1LacZ) | Laboratory of Dr. Aaron Zorn | Jackson Cat#: 008211; MGI Cat#: 2449767; RRID: IMSR_JAX: 008211 | |
| Genetic reagent (M. musculus) | B6.129S6-Shhtm2(cre/ERT2)Cjt/J (ShhCreER/+) | Laboratory of Dr. Susan Mackem (Harfe et al., 2004) | Jackson Cat#: 005623 MGI: 92504 RRID: IMSR_JAX:005623 | Swiss Webster background |
| Genetic reagent (M. musculus) | B6.Cg-Gt(ROSA)26Sortm9(CAG-tdTomato)Hze/J (Rosa26Ai9/+) | Jackson Laboratory | Jackson Cat#: 007909 MGI: 155793 RRID: IMSR_JAX: 007909 | BL6-background |
| Genetic reagent (M. musculus) | Swiss Webster Wildtype | Charles River | Charles River Cat# NCI 551 IMSR Cat# TAC:sw, RRID:IMSR_TAC:sw | |
| Chemical compound, drug | Tamoxifen | Sigma-Aldrich | Cat#: T5648-1G Lot/batch#: WXBD2299V | |
| Other | Trizol | Life Technologies | Cat#: 10296010 | Used for RNA extraction |
| Commercial assay, kit | NEBNext Ultra II Directional RNA library prep kit | New England Biolabs | Cat#: E7760L | |
| Commercial assay, kit | In Situ Cell death detection Kit | Roche | Cat# 12156792910 Lot#: 11520500 | OCT and paraffin |
| Other | 4′,6-Diamidino-2-phenylindole (DAPI) | Invitrogen | Cat# D1306 Lot#: 2208529 | Nuclear stain for OCT and paraffin sections and whole mounts (1:5000) |
| Other | Prolong Gold Antifade | Thermo Fisher Scientific | Cat#: P36930 | Used to mount OCT/paraffin section stains |
| Chemical compound, drug | Histodenz | Sigma-Aldrich | Cat#: D2158-100G Lot #: WXBD3838V | Used to clear whole-mount embryos |
| Chemical compound, drug | N-Methyl-acetimide | Sigma-Aldrich | Cat#: M26305-100G | Used to clear whole-mount embryos |
| Other | Low-melt agarose | Sigma-Aldrich | Cat#: A2576-5G Lot#: SLCG3476 | Used at 1.5% agarose in water (wt/vol) |
| Antibody | SOX9 (rabbit polyclonal) | Millipore | Cat#: AB5535; Lot#: 3389351 RRID:AB_2239761 | OCT and paraffin (1:200) |
| Antibody | SOX2 (mouse monoclonal) | Santa-Cruz | Cat#: sc-365823; LOT#: E1619 RRID:AB_10842165 | OCT and paraffin (1:200) |
| Antibody | NKX2.1 (TTF-1) (mouse monoclonal) | Santa-Cruz | Cat#: sc-53136 LOT#: B2219 RRID:AB_793529 | OCT (1:200) |
| Antibody | FOXA2 (rabbit monoclonal) | Abcam | Cat#: ab108422; LOT#: GR3289185 RRID:AB_11157157 | OCT and paraffin (1:300) |
| Antibody | FOXA2 (mouse monoclonal) | DSHB | Cat#: 4c7 RRID:AB_528255 | OCT (1:50) |
| Antibody | N-Cadherin (rabbit monoclonal) | Cell Signaling Technologies | Cat#: 13116S RRID:AB_2687616 | OCT (1:200) |
| Antibody | E-Cadherin (rabbit monoclonal) | Cell Signaling Technologies | Cat#: 3195S RRID:AB_2291471 | OCT and paraffin (1:200) |
| Antibody | Vimentin (rabbit monoclonal) | Cell Signaling Technologies | Cat#: 5741T RRID:AB_10695459 | OCT (1:200) |
| Antibody | P63 (mouse monoclonal) | Abcam | Cat#: ab735 RRID:AB_305870 | OCT and paraffin (1:200) |
| Antibody | Cleaved-Caspase3 (D165) (rabbit monoclonal) | Cell Signaling Technologies | Cat#: 9664S RRID:AB_2070042 | OCT and paraffin (1:200) |
| Antibody | GFP (chicken polyclonal) | Aves | Cat#: 1020; LOT#: 1229FP08 RRID:AB_10000240 | OCT (1:500) |
| Antibody | RFP (Rabbit polyclonal) | Rockland | Cat#: 600-401-379; LOT#: 46317 RRID:AB_2209751 | OCT (1:100) |
| Antibody | ECAD-488 (24E10) (rabbit monoclonal) | Cell Signaling Technologies | Cat#: 3199S RRID:AB_10691457 | OCT (1:200) |
| Antibody | Phospho-Histone H3 (rabbit polyclonal) | Millipore | Cat#: 06-570; LOT#: 2972863 RRID:AB_310177 | OCT and paraffin (1:200) |
| Antibody | Rabbit Isotype Control (DA1E) (rabbit monoclonal) | Cell Signaling Technologies | Cat#: 3900S RRID:AB_1550038 | OCT (4 μg/ml) |
| Antibody | RAB-11 (rabbit monoclonal) | Cell Signaling Technologies | Cat#: 5589T RRID:AB_10693925 | OCT (1:100) |
| Antibody | Beta-Catenin (rabbit polyclonal) | Thermo Fisher Scientific | Cat#: 71-2700 RRID:AB_2533982 | OCT (1:500) |
| Antibody | Laminin (rabbit polyclonal) | Sigma-Aldrich | Cat#: L9393-100UL; LOT#: 099M4886V RRID:AB_477163 | Paraffin (1:100) |
| Antibody | anti-Rabbit Alexa 488 (goatpolyclonal) | Thermo Fisher Scientific | Cat#: A11034 RRID:AB_2576217 | OCT and paraffin (1:250) |
| Antibody | anti-Mouse Alexa 568 (goat polyclonal) | Thermo Fisher Scientific | Cat#: A11004 RRID:AB_2534072 | OCT and paraffin (1:250) |
| Antibody | anti-Chicken Alexa 568 (goat polyclonal) | Thermo Fisher Scientific | Cat#: A11041 RRID:AB_2534098 | OCT (1:250) |
| Antibody | anti-Rabbit Alexa 647 (goat polyclonal) | Life Technologies | Cat#: A27040 RRID:AB_2536101 | OCT (1:250) |
| Commercial assay, kit | V3.0 HCR RNA-FISH Kit Probe Hybridization buffer | Molecular Instruments | LOT#: BPH02324 | Whole-mount embryos |
| Commercial assay, kit | V3.0 HCR RNA-FISH Kit Probe Wash buffer | Molecular Instruments | LOT#: BPW02123 | Whole-mount embryos |
| Commercial assay, kit | V3.0 HCR RNA-FISH Kit Amplification buffer | Molecular Instruments | LOT#: BAM01923 | Whole-mount embryos |
| Commercial assay, kit | Cdh1 HCR probe (M. musculus) | Molecular Instruments | Probe Lot#: PRI679 MGI Accession: 12550 | Hairpin-B2-Alexa488 |
| Commercial assay, kit | Cdh2 HCR probe (M. musculus) | Molecular Instruments | Probe Lot#: PRH832 MGI Accession: BC022107 | Hairpin-B1- Alexa594 |
| Commercial assay, kit | Shh HCR probe (M. musculus) | Molecular Instruments | Probe Lot#: PRA909 MGI Accession: NM_009170 | Hairpin-B1-Alexa594 |
| Commercial assay, kit | Pax1 HCR probe (M. musculus) | Molecular Instruments | Probe Lot#: PRH830 MGI Accession: NM_008780.2 | Hairpin-B1-Alexa594 |
| Commercial assay, kit | Hoxb1 HCR probe (M. musculus) | Molecular Instruments | Probe Lot#: PRE343 | Hairpin-B4-Alexa647 |
| Commercial assay, kit | Foxn1 HCR probe (M. musculus) | Molecular Instruments | Probe Lot#: PRN998 | Hairpin-B4-Alexa647 |
| Software, algorithm | HISAT2 v2.1.0 | Pertea et al., 2016; Pertea et al., 2015 | RRID:SCR_015530 | Used for RNA-seq analysis |
| Software, algorithm | StringTie v1.3.6 | Pertea et al., 2016; Pertea et al., 2015 | RRID:SCR_016323 | Used for RNA-seq analysis |
| Software, algorithm | Imaris v9.9.1 software | Bitplane Inc | RRID:SCR_007370 | Used for 3D rendering of surfaces |
Additional files
-
Transparent reporting form
- https://cdn.elifesciences.org/articles/77055/elife-77055-transrepform1-v2.pdf
-
Supplementary file 1
Number of TdT-expressing and Cleaved Caspase-3-expressing cells in the larynx epithelium and mesenchyme of control (ShhCreER/+;Rosa26Ai9/+) and mutant (ShhCreER/− ;Rosa26Ai9/+) embryos at E9.75 (26–29 s) and E10.5 (31–35 s).
Cell numbers were quantified from the ventral half of the epithelium in each section analyzed. This table provides source data for figure panels Figure 4K–L and Figure 4—figure supplement 4A–F. Ventral epi. – ventral epithelium.
- https://cdn.elifesciences.org/articles/77055/elife-77055-supp1-v2.docx
Download links
A two-part list of links to download the article, or parts of the article, in various formats.
Downloads (link to download the article as PDF)
Open citations (links to open the citations from this article in various online reference manager services)
Cite this article (links to download the citations from this article in formats compatible with various reference manager tools)
Hedgehog regulation of epithelial cell state and morphogenesis in the larynx
eLife 11:e77055.
https://doi.org/10.7554/eLife.77055


