No evidence from complementary data sources of a direct glutamatergic projection from the mouse anterior cingulate area to the hippocampal formation
- Institute of Biomedical and Clinical Science, University of Exeter Medical School, United Kingdom
- School of Psychology & Neuroscience, College of Medical, Veterinary and Life Sciences, University of Glasgow, United Kingdom
- School of Infection & Immunity, College of Medical, Veterinary and Life Sciences, University of Glasgow, United Kingdom
- School of Psychology, Cardiff University, United Kingdom
Figures
Figure 1 with 1 supplement

Anterograde viral tracing from anterior cingulate area (ACA) CaMKII-expressing neurons shows no excitatory projection to the dCA1 region of hippocampus.
(A) Prefrontal cortex injection sites and spread, blue overlays show injections made using previously published coordinates (Rajasethupathy et al., 2015), green overlays show representative viral spreads of each experimental mouse using in-house initial optimisation attempt, n = 3 and n = 3, respectively. Intensity of colours shows number of animals with the corresponding viral spread, (B) Prefrontal cortex injection site and spread of individual injections using in-house optimised coordinates; each overlay shape represents one injection, n = 7. (C) Representative images of dCA1 area of hippocampus, Ci closeup image of CA1, showing no fluorescent signal, (D) ipsilateral claustrum, (E) ACA at +0.8 Bregma, (F) contralateral claustrum, (G) fibres in some thalamic nuclei, (H) fibres striatum, nucleus accumbens lateral septum, and nucleus of the diagonal band, (I) fibres in prefrontal cortex at +1.2 Bregma. A24a, area 24a (infralimbic); A24b, area 24b (cingulate cortex 1); A25, area 25 (dorsal peduncular cortex); A32, area 32 (prelimbic); ac, anterior commissure; ACA, anterior cingulate area; AD, anterodorsal nucleus; AM, anteromedial nucleus; AV, anteroventral nucleus; CA1, Cornu Ammonis 1;; CA3, Cornu Ammonis 3; Cl, claustrum; DG, dentate gyrus; H, habenula; LD, lateral dorsal nucleus; M1, primary motor area; M2, secondary motor area; MD, mediodorsal nucleus; NAs, nucleus accumbens shell area; PVT, paraventricular nucleus of the thalamus; RE, nucleus reuniens; RH, rhomboid nucleus; VPM, ventral posteromedial nucleus. Transduced neurons and their axons are shown in green while DAPI is shown in blue. Scale bars 100 microns.
-
Figure 1—source data 1
Summary of all injections carried out for anterograde tracing from ACA.
- https://cdn.elifesciences.org/articles/77364/elife-77364-fig1-data1-v2.xlsx
Figure 1—figure supplement 1

Comparing viral spread in different injection coordinates of anterior cingulate area (ACA).
(A–D) Representative images of injection site with coordinates reported previously (A), spread into posterior part of ACA and other cortical areas (B), fluorescent signal present in many structures, but not in dorsal hippocampus (C), representative image of dCA1 with no fluorescent signal present (D). (E–P) Representative images of three injections using in-house optimised coordinates to target ACA. Similarly, fluorescent signal is present in other cortical areas (F, J, N) and absent in dorsal hippocampal sections (G, K, O), closer images of dCA1 with no fibres present (H, L, P). Scale bars represent 100 microns (A–C), ( –G, I –K, M–O) and 50 microns (D, H, L, P).
Figure 2 with 1 supplement
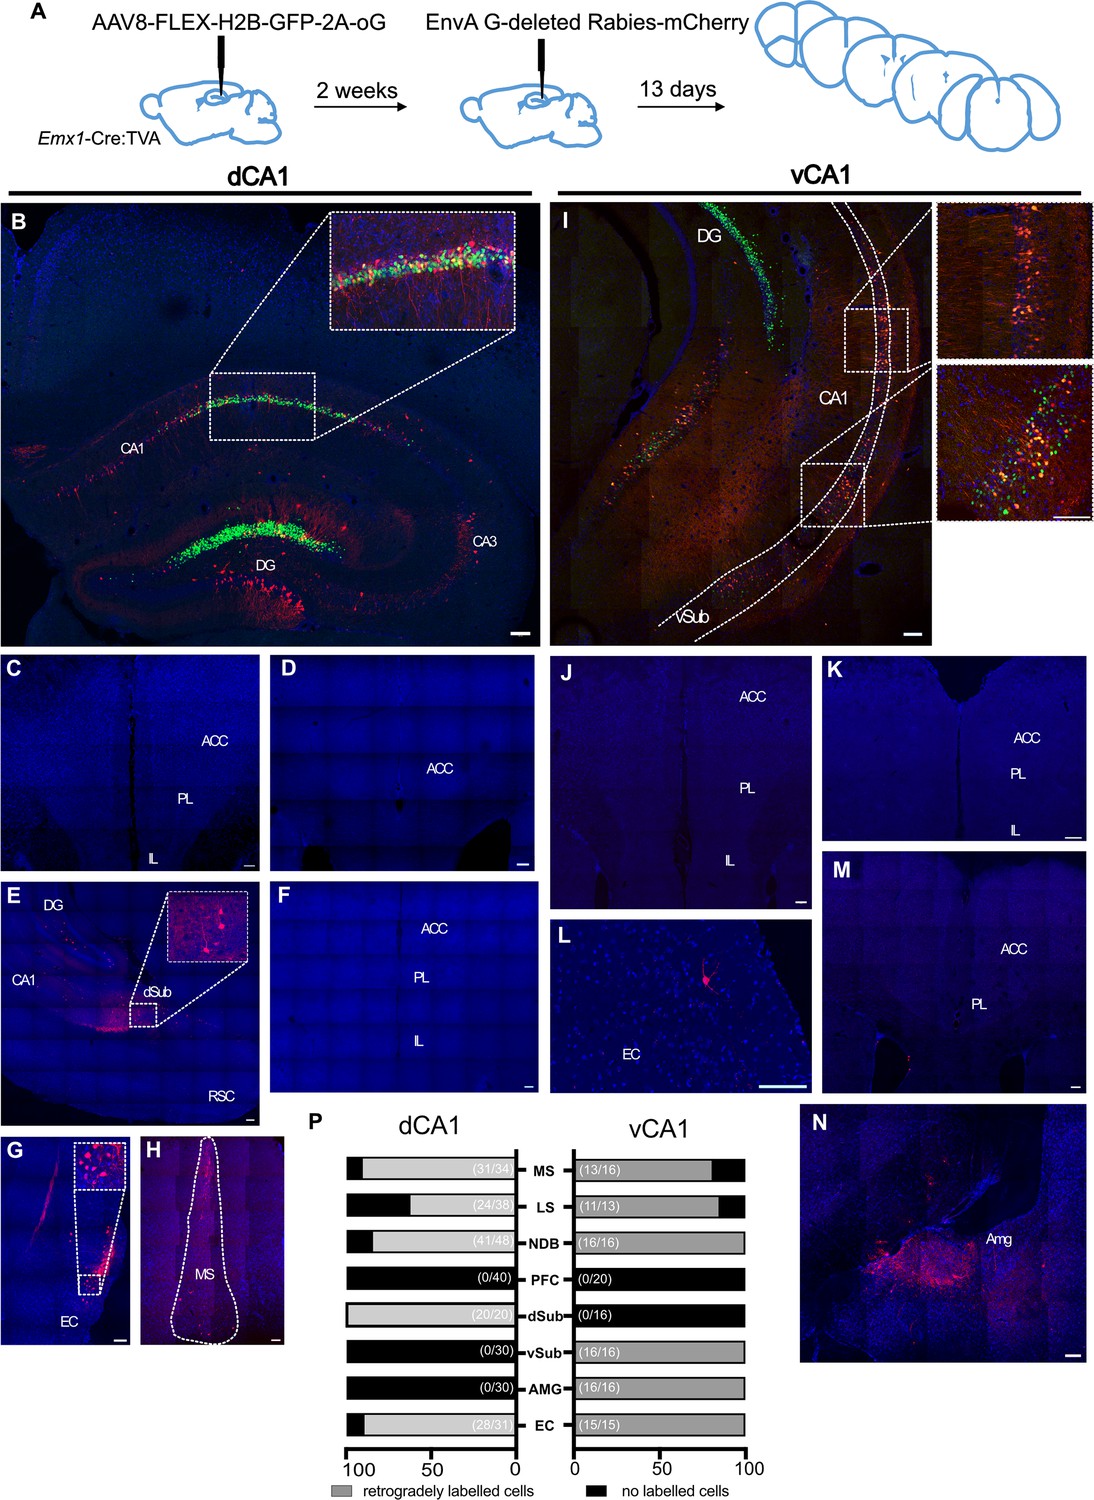
Monosynaptic retrograde tracing from dorsal CA1 (dCA1) and ventral CA1 (vCA1) using modified rabies virus shows no excitatory projection from the anterior cingulate area (ACA) to either dorsal or ventral CA1 regions.
(A) Outline of experimental method. (B) Representative images of dCA1 injection site, starter cells shown as inset. Representative images of (C–F) prefrontal cortical areas at +1.6, +1.1, and +2.0 Bregma, (G) entorhinal cortex, (H) medial septum. (I) vCA1 injection site, starter cells shown as insets. Representative images of: (J, K, M) prefrontal cortical areas at +1.6, +2.0, and +1.1 Bregma, (L) entorhinal cortex, (N) amygdala, and (P) summary of data. Bar graphs show the mean percentage of sections from each animal showing presynaptic neurons while numbers in bracket show total number of sections examined. Scale bars represent 100 microns.
Figure 2—figure supplement 1
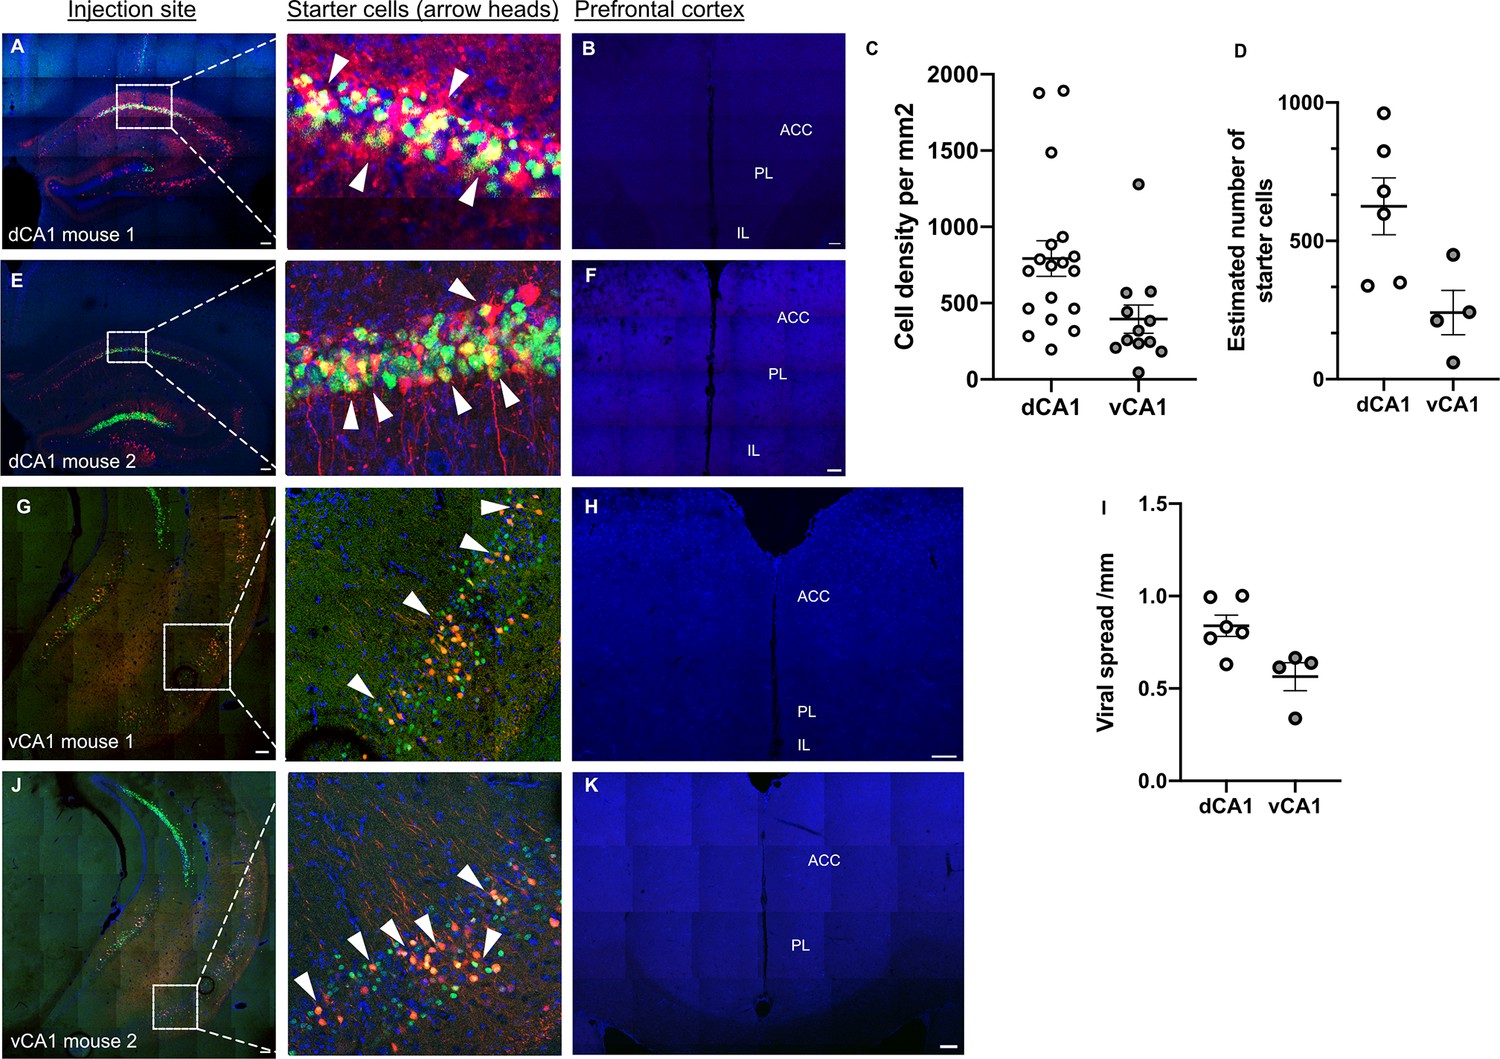
Rabies virus tracing – injection sites and starter cells.
(A, E) Dorsal hippocampus injection site with insets and arrowheads showing starter cells, (G, J) ventral hippocampus injection site with insets and arrowheads showing starter cells, (B, F, H, K) representative images of prefrontal cortices from animals injected into the dorsal (B, F) and ventral (H, K) hippocampal injection site showing no fluorescently labelled cells, (C) cell densities of starter cells (18 sections from six mice for dCA1 and 12 sections from four mice for vCA1), and (D) tally of estimated total starter cells numbers for both injection sites (n = 6 mice for dCA1 and n = 4 mice for vCA1). The estimation considered the spread of viral vectors and numbers of starter cells seen on representative images. For example, representative image shows 28 starter cells in a 50-micron section (when using epifluorescent images) or in a 3-micron section when using confocal images, and the viral spread was 1001 microns in medial to lateral direction, so it is estimated that a similar spread took place in anterior–posterior direction, thus extrapolating that a total of 388 starter cells were present in the brain. (I) Viral spread in different experimental mice. Scale bars represent 100 microns; error bars show standard error of the mean (SEM).
Figure 3 with 1 supplement
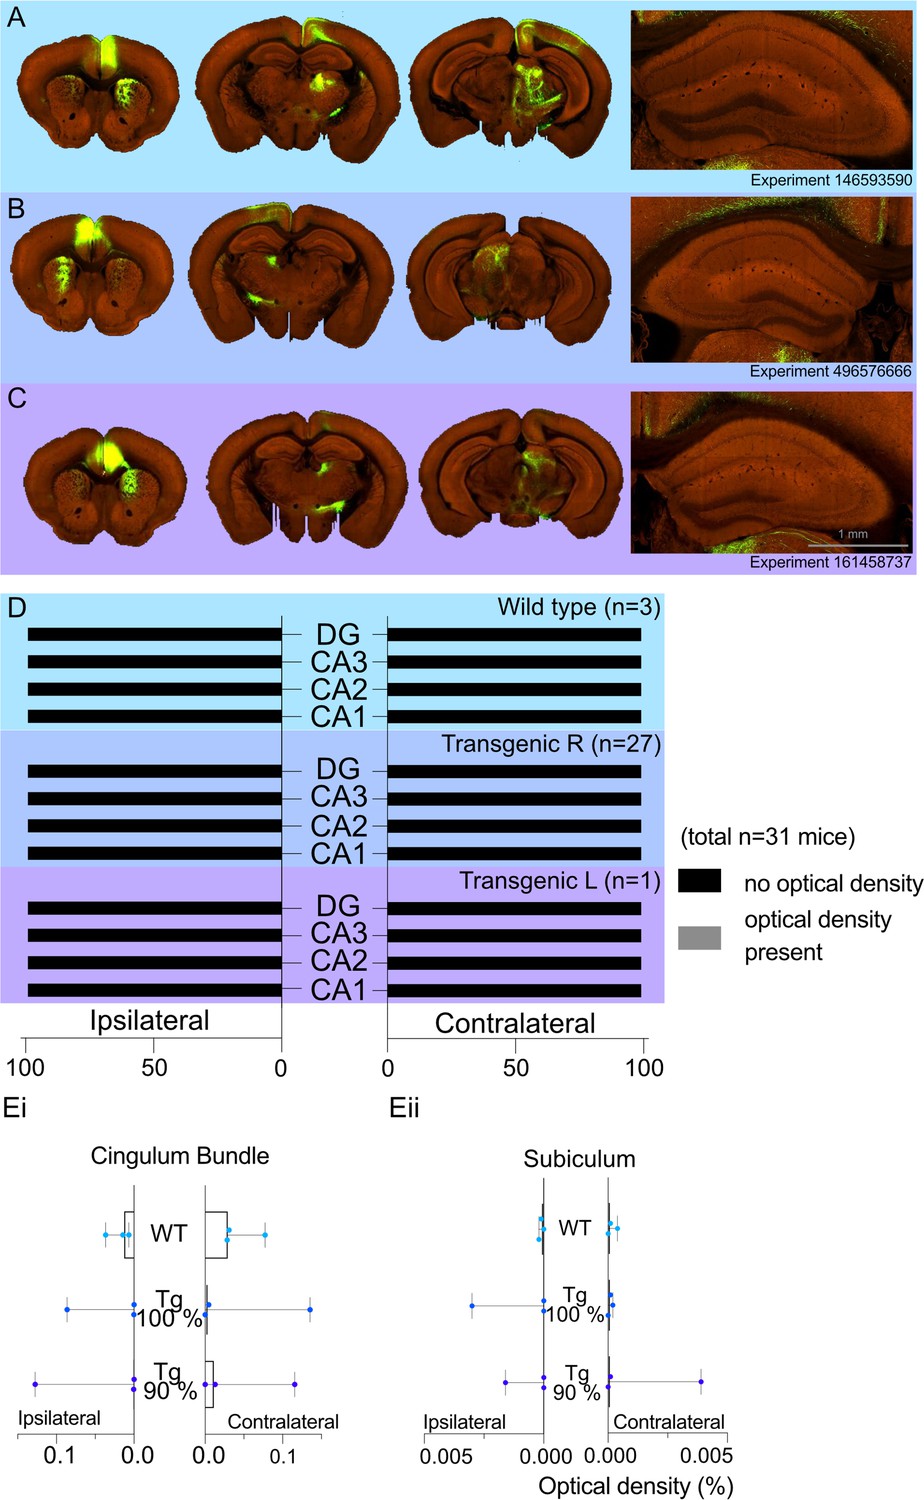
Allen Projection Atlas data search shows no evidence of a direct projection from anterior cingulate area (ACA) to dorsal CA1.
Representative examples of tracing experiments in (A) wild-type mouse line (C57BL/6J), (B) transgenic (Rbp4-Cre_KL100) mouse line experiment with 100% of the virus injected in the ACA, (C) transgenic (Rbp4-Cre_KL100) mouse line experiment with 90% of the virus injected in the ACA; and the corresponding typical anterograde expression patterns. (D) Histograms showing the summary of fluorescent fibres present in different hippocampal subfields in all datasets. No fibres were found any sections containing hippocampal regions DG and CA1-3. (E) Median signal densities of fibres seen in cingulum bundle (Ei) and subiculum (Eii) in experiments with wild-type and transgenic mouse lines; box plots show median and error bars the range of the data. The histograms show the optical densities of potential transported tracer in different experiments in the cingulum bundle and subiculum. While there is no apparent signal in the subiculum, the tracer uptake is significantly higher in the cingulum bundle.
-
Figure 3—source data 1
Numerical data from Allen Projection Atlas mining that was used to generate figure 3.
- https://cdn.elifesciences.org/articles/77364/elife-77364-fig3-data1-v2.xlsx
Figure 3—figure supplement 1

Images from prefrontal projectome paper (Gao et al., 2022).
Anterior cingulate area (ACA) shown in blue and CA subfields of hippocampus shown in red. (A) Coronal view from anterior side, (B) coronal view from posterior side, (C) horizontal view from below, (D) horizontal view from above, and (E) sagittal view. Shown are the three neurons that project to dorsal CA1 subfields; locations of somata are lateral orbitofrontal cortex, layer 2/3 (cells 195786_008 and 195786_013), anterior secondary motor cortex, layer 5 (cell 192981_002). Note that none of the somata from the three neurons are located in ACA, and their hippocampal axonal terminations are primarily located just outside of the CA subfields. Data taken from https://mouse.braindatacenter.cn/, accessed on 29 June 2023.
Figure 4

Retrograde tracing from dCA1 shows non-specific expression in multiple brain area, including both ipsi- and contralateral anterior cingulate and prelimbic areas.
(A) Outline of experimental method. Representative images of (B) injection site dCA1, showing strong labelling in the hippocampus as well as some labelling in the overlaying cortical areas, including contralateral cortex, (Bi) cells in CA1 pyramidal layer, (C) dorsal subiculum (dSub), (Ci) neurons in dSub, (D) retrograde labelling in anterodorsal and anteroventral (AD/AV) and anteromedial (AM) thalamus nuclei, (E, H, G) labelled cells present in both hemispheres of prefrontal cortices at +1.7, +1.2, and+ 1.5 Bregma showing prelimbic (PL) and anterior cingulate cortex (ACC), (F) cells in claustrum, (I) cells in lateral entorhinal (LEC), perirhinal and ectorhinal (Ect) cortices. Scale bars 100 microns.
Figure 5 with 1 supplement

Retrograde tracing from dCA1 using Fast Blue reveals no positive labelled neurons in the anterior cingulate area (ACA).
(A) Outline of experimental, (B) injection site and inset showing filled cells in the CA1 region of hippocampus and some overlaying cortex, (C, D) representative images showing no filled cells in prefrontal cortices at +1.4 and +1.1 Bregma, insets show close up of PL and ACC areas, (E) filled cells in entorhinal cortex (EC), (F) filled cells in medial septum (MS), and (G) filled cells in dorsal subiculum (dSub). RSC, retrosplenial cortex, N = 7. Scale bars 100 microns.
Figure 5—figure supplement 1

Retrograde tracing from dCA1 shows positive cells in the anterior cingulate area (ACA) when injected dye spreads off target.
(A) Experimental timeline, (B), dorsal hippocampus injection site with both ipsilateral and contralateral hemispheres, (C, D) representative images of prefrontal cortices from animals injected into the dorsal hippocampus and spilling over into the overlaying corpus collosum and cortical layers, showing several fluorescently labelled cells in ACC (E) and many in PL (F), (G), labelled cells in entorhinal cortex (EC), (H), many labelled cells in dorsal subiculum, CA1, and some in deep layers of retrosplenial cortex (RSC). Scale bars represent 100 microns.
Additional files
Download links
A two-part list of links to download the article, or parts of the article, in various formats.
Downloads (link to download the article as PDF)
Open citations (links to open the citations from this article in various online reference manager services)
Cite this article (links to download the citations from this article in formats compatible with various reference manager tools)
No evidence from complementary data sources of a direct glutamatergic projection from the mouse anterior cingulate area to the hippocampal formation
eLife 12:e77364.
https://doi.org/10.7554/eLife.77364


