Comprehensive fitness landscape of SARS-CoV-2 Mpro reveals insights into viral resistance mechanisms
- Department of Biochemistry and Molecular Biotechnology, University of Massachusetts Chan Medical School, United States
- Novartis Institutes for Biomedical Research, United States
Figures
Figure 1 with 1 supplement

Experimental strategy to measure the function of all individual mutations of main protease (Mpro).
(A) Fluorescence resonance energy transfer (FRET)-based reporter screen. The Mpro variants were sorted based on their ability to cleave at the Mpro cut-site, separating the YFP-CFP FRET pair. Cells were separated by fluorescence-activated single cell sorting (FACS) into cleaved (low FRET) and uncleaved (high FRET) populations. (B) Split transcription factor screen. Mpro variants were sorted based on their ability to cleave at the Mpro cut-site, separating the DNA binding domain (DBD) and activation domain (AD) of the Gal4 transcription factor. The transcription factor drives GFP expression from a galactose promoter. Cells were separated by FACS into cleaved (low GFP expression) and uncleaved (high GFP expression) populations. (C) Growth screen. Yeast cells expressing functional Mpro variants that cleave essential yeast proteins grow slowly and are depleted in bulk culture, while yeast cells expressing non-functional Mpro variants are enriched. (D) Barcoding strategy to measure frequency of all individual mutations of Mpro in a single experiment.
Figure 1—figure supplement 1
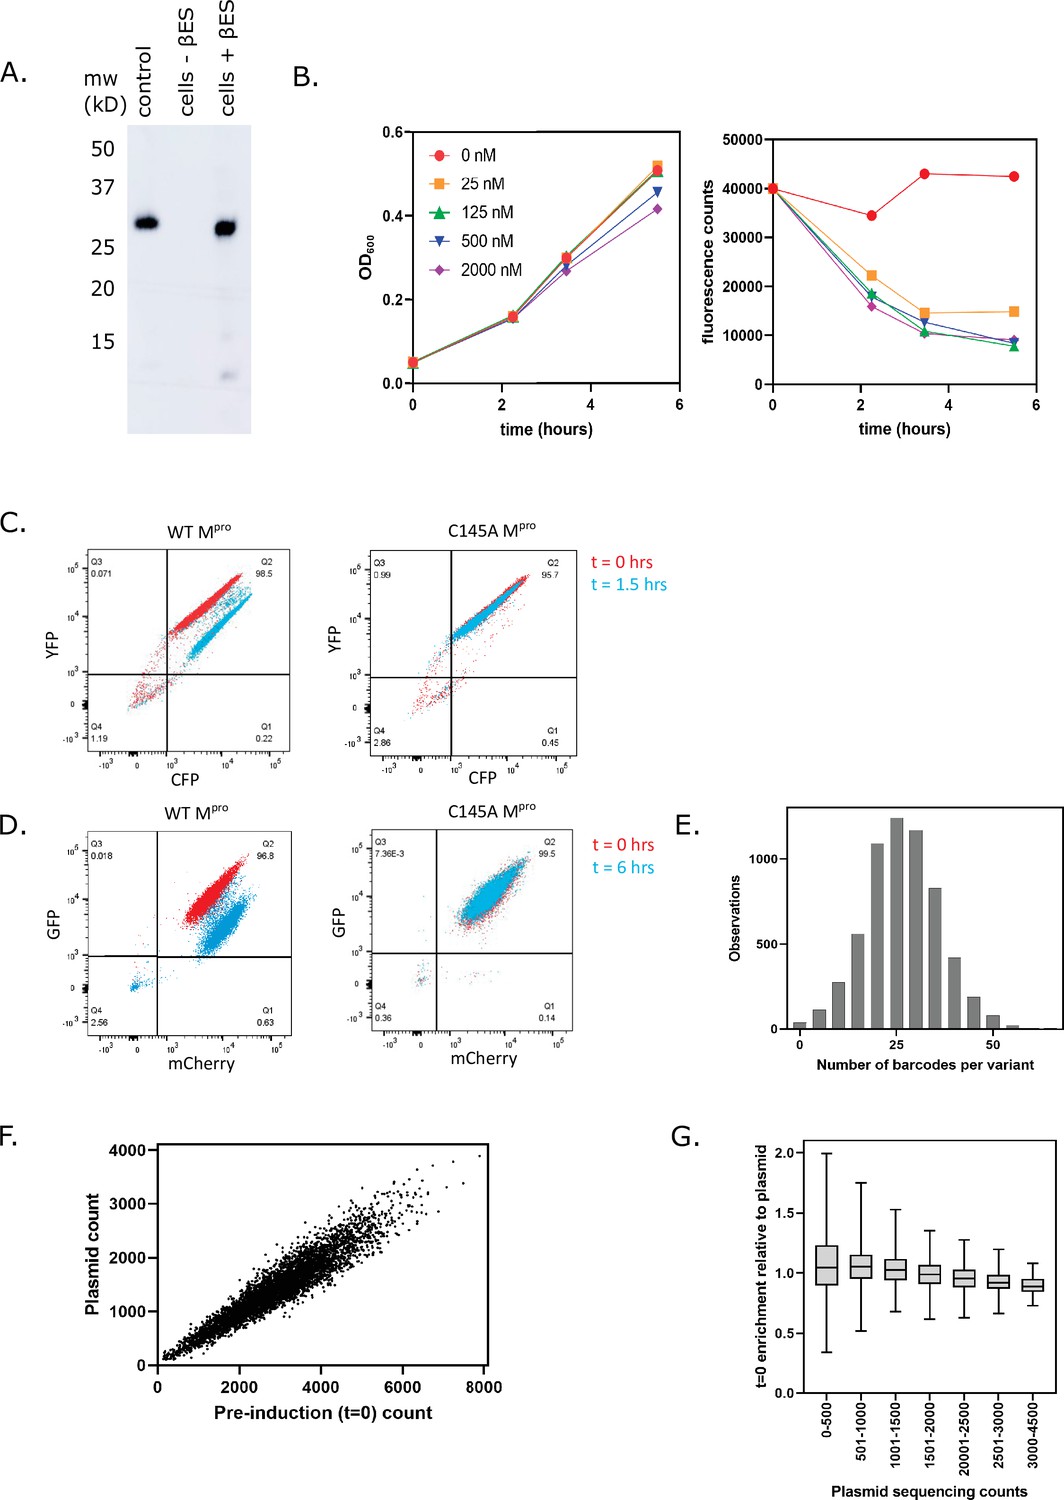
Main protease (Mpro) expression in cells harboring the LexA-UbMpro plasmid construct.
(A) Yeast cells transformed with a plasmid expressing C145A Ub-Mpro-his6 under the LexA promoter were grown to exponential phase followed by the addition of 2 µM β-estradiol to induce expression for 8 hr. The Mpro levels were monitored by Western blot with an anti-his6 antibody and the correct size was measured against purified Mpro-his6 protein (control). (B) The plasmid expressing wild-type (WT) Ub-Mpro under control of the LexA promoter was transformed into cells expressing the split transcription factor. Cells were grown to exponential phase followed by addition of the indicated concentration of β-estradiol. Cell density was monitored based on absorbance at 600 nm at the times indicated (left panel). At the same time points, cells were washed, diluted to equal cell number, and GFP fluorescence was monitored at 525 nm (right panel). (C) Fluorescence-activated single cell sorting (FACS) analysis of cells expressing the CFP-MproCS-YFP FRET pair and either WT Ub-Mpro (left) or C145A Ub-Mpro (right). Cell samples were collected before and after induction of Mpro expression with 125 nM β-estradiol for 1.5 hr. (D) The FACS analysis of cells expressing the split transcription factor separated by the Mpro cut-site and either WT Ub-Mpro (left) or C145A Ub-Mpro (right). Cell samples were collected before and after induction of Mpro expression with 125 nM β-estradiol for 6 hr. (E) Distribution of number of barcodes associated with all Mpro variants. (F) Correlation between total counts of each variant in the Mpro plasmid library (plasmid count) and the total counts of that variant before Mpro induction (pre-induction count). (G) Mpro variants present at low frequency in the library showed a wider variance between plasmid library counts and counts in the pre-induction sample, consistent with lower sampling.
Figure 2 with 1 supplement
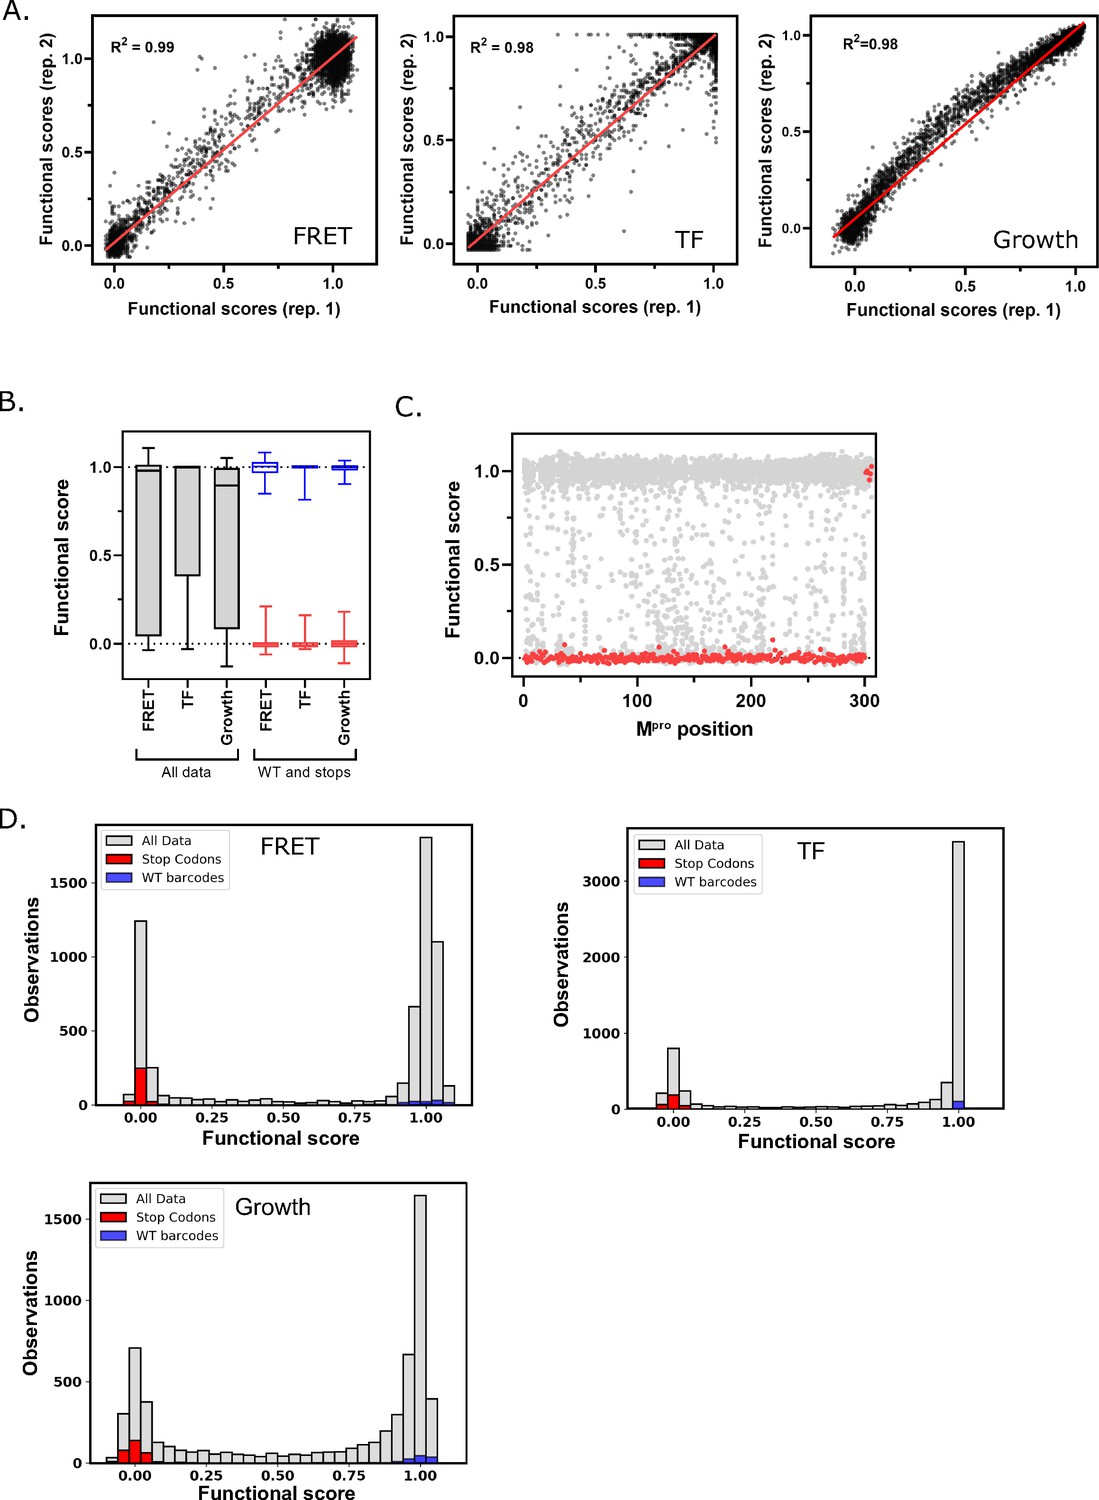
Main protease (Mpro) functional scores are reproducible, and variants can be clearly distinguished based on function.
(A) Correlation between biological replicates of functional scores of all Mpro variants for each screen. Red line indicates best fit. (B) Distribution of functional scores for all variants (gray), stop codons (red), and wild-type (WT) barcodes (blue) in each screen. (C) The functional scores for all variants (gray) and stop codons (red) at each position of Mpro in the fluorescence resonance energy transfer (FRET) screen. (D) Distribution of all functional scores (gray) in each screen. Functional scores are categorized as WT-like, intermediate, or null based on the distribution of WT barcodes (blue) and stop codons (red) in each screen. See Figure 2—source data 1.
-
Figure 2—source data 1
Sequencing counts and functional scores for each amino acid of main protease (Mpro) in both replicates of all three screens.
For each dataset, the sequencing counts, unnormalized functional scores, and normalized functional scores (normalized to average stop = 0, average wild-type barcode = 1) are reported. For the growth screens, the selection coefficients are also reported. All figures in this paper use the data from replicate 1 of each screen.
- https://cdn.elifesciences.org/articles/77433/elife-77433-fig2-data1-v2.xlsx
Figure 2—figure supplement 1

Cumulative frequency distributions for all variants (gray), stops (red), and wild-type (WT) barcodes (blue) for all three screens.
Figure 3 with 2 supplements

Heatmap representation of the main protease (Mpro) functional scores measured in the fluorescence resonance energy transfer (FRET) screen (replicate 1).
Arrows represent positions that form β-sheets, coils represent α-helices, and red triangles indicate the catalytic dyad residues H41 and C145.
Figure 3—figure supplement 1
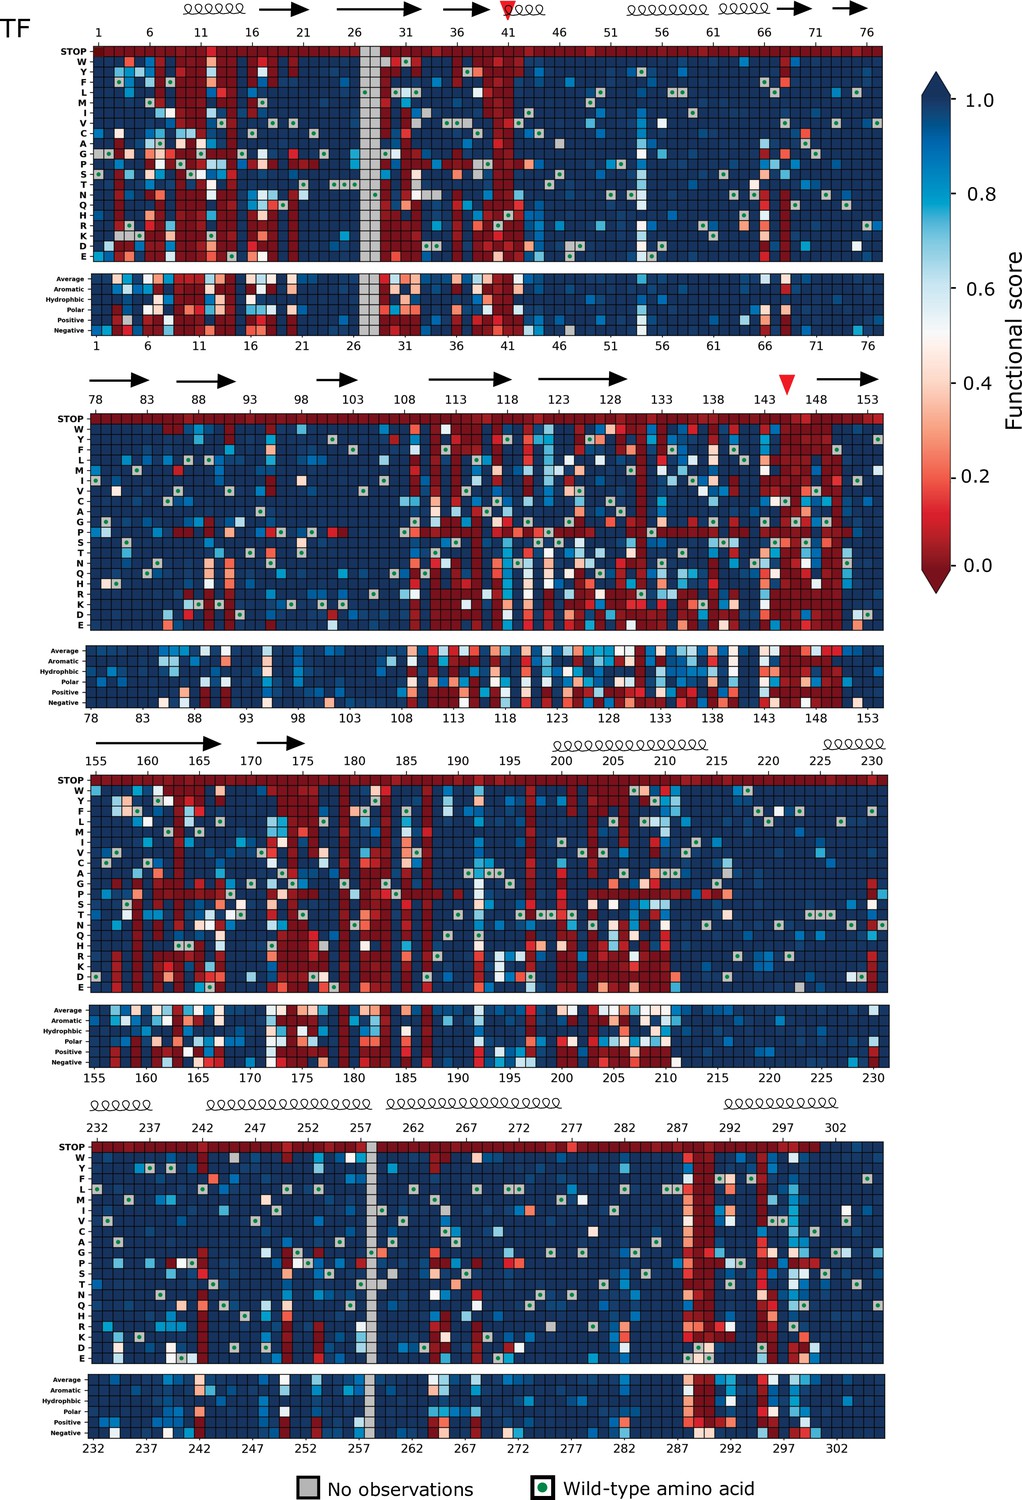
Heatmap representation of scores from the transcription factor (TF) screen (replicate 1).
Arrows represent positions that form beta sheets, coils represent α-helices, and red triangles indicate the catalytic dyad residues H41 and C145.
Figure 3—figure supplement 2

Heatmap representation of scores from the growth screen (replicate 1).
Arrows represent positions that form beta sheets, coils represent α-helices, and red triangles indicate the catalytic dyad residues H41 and C145.
Figure 4

Functional scores reflect fundamental biophysical constraints of main protease (Mpro).
(A) Heatmap representation of the average functional score at each position (excluding stops) in replicate 1 of each screen (see Figure 4—source data 1). (B) The average functional score at each position mapped to Mpro structure for each screen. The Nsp4/5 substrate peptide is shown in green (PDB 7T70). (C) The average functional score at each position compared between the three screens. The diagonal is indicated with a blue dashed line. (D) Comparison between relative catalytic rates measured independently in various studies and functional scores measured in each screen (see Figure 4—source data 2). Each graph is fit with a non-linear and linear regression with the best of the two fits represented with a black solid line and the worst fit represented with a red dashed line. The non-linear regression is fit to the equation Y = Ym − (Y0 – Ym) e−kx.
-
Figure 4—source data 1
Average functional score (excluding stops) at each position of main protease (Mpro) in replicate 1 of each screen.
- https://cdn.elifesciences.org/articles/77433/elife-77433-fig4-data1-v2.xlsx
-
Figure 4—source data 2
Comparison of previously measured relative catalytic rates of individual mutations to functional scores.
- https://cdn.elifesciences.org/articles/77433/elife-77433-fig4-data2-v2.docx
Figure 5 with 1 supplement
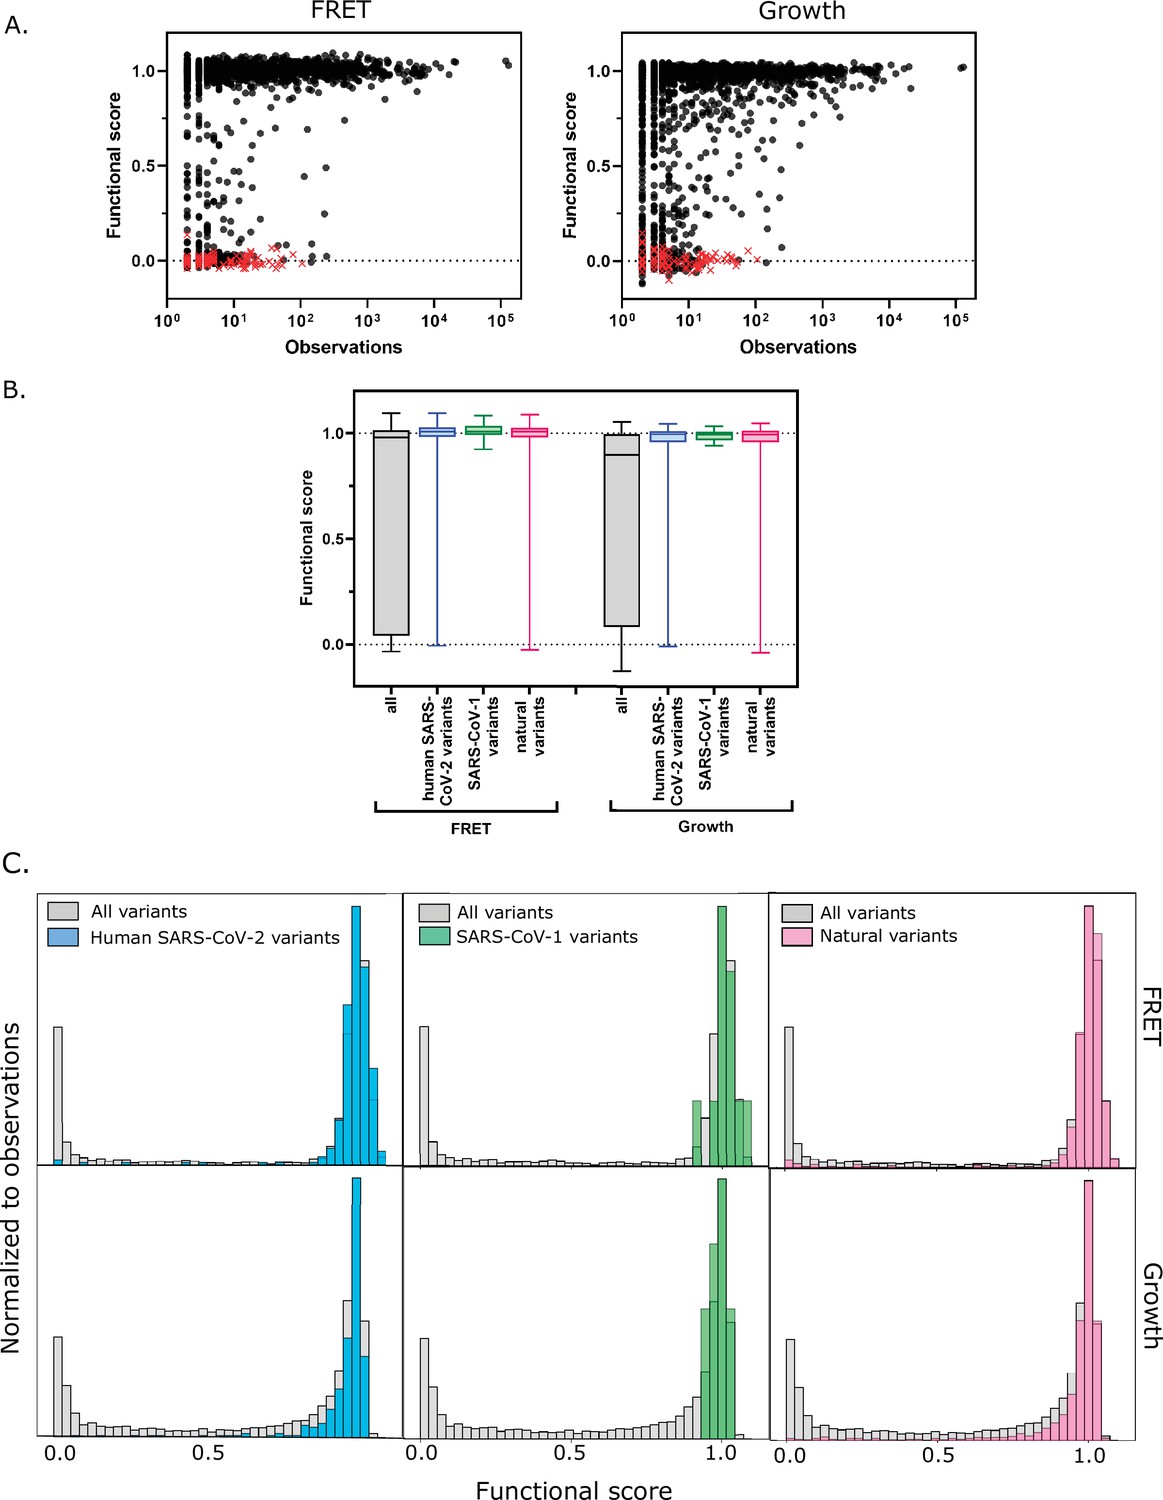
Functional scores indicate that natural amino acid variants of main protease (Mpro) are generally fit.
(A) Comparison of functional scores in the FRET screen (left panel) and growth screen (right panel) to the number of observations among clinical samples. All missense mutations excluding stops are indicated with black circles and stop codons are indicated with red x’s. (See Figure 5—source data 1) (B) The distribution of functional scores of all variants in the FRET and growth screens compared to the observed clinically-relevant Mpro variants (human SARS-CoV-2 variants, blue), 12 amino acid differences between SARS-CoV-2 and SARS-CoV-1 (green), and the different amino acids in a broad sample of Mpro SARS-CoV-2 homologs (natural variants, pink). Distributions are significantly different as measured by a two-sample Kolmogorov-Smirnov (KS) (All FRET vs. human SARS-CoV-2 variants: N = 6044, 289, p<0.0001, D = 0.3258; All FRET vs. SARS-CoV-1 variants: N=6044, 12, p=0.0398, D=0.4223; All FRET vs. natural variants: N = 6044, 1205, p<0.0001, D = 0.2984; All Growth vs. human SARS-CoV-2 variants: N = 6044, 289, p<0.0001, D = 0.3938; All growth vs. SARS-CoV-1 variants: N=6044, 12, p=0.0024, D=0.5533; All growth vs. natural variants: N=6044,1205, p<0.0001, D = 0.3462) (C) Histogram of functional scores of all variants (grey) compared to that of human SARS-CoV-2 variants (blue), SARS-CoV-1 variants (green), and natural variants (pink).
-
Figure 5—source data 1
Frequency at which the clinical variants of the main protease (Mpro) gene have been observed.
- https://cdn.elifesciences.org/articles/77433/elife-77433-fig5-data1-v2.xlsx
Figure 5—figure supplement 1

Functional scores indicate that natural amino acid variants of main protease (Mpro) are generally fit.
(A) Comparison of functional scores in the transcription factor (TF) screen to the number of observations among clinical samples. All missense mutations excluding stops are indicated with black circles and stop codons are indicated with red x’s. (See Figure 5—source data 1) (B) The distribution of functional scores of all variants in the TF screen compared to the observed clinically relevant Mpro variants (human severe acute respiratory syndrome coronavirus-2 (SARS-CoV-2) variants, blue), 12 amino acid differences between SARS-CoV-2 and SARS-CoV-1 (green), and the different amino acids in a broad sample of Mpro SARS-CoV-2 homologs (natural variants, pink). Distributions are significantly different as measured by a two-sample Kolmogorov-Smirnov (KS) (all TF vs human SARS-CoV-2 variants: N=6038, 289, p<0.0001, D=0.2845; all TF vs SARS-CoV-1 variants: N=6038, 12, p=0.0196, D=0.4589; all TF vs natural variants: N=6038, 1205, p<0.0001, D=0.2608).
Figure 6 with 1 supplement

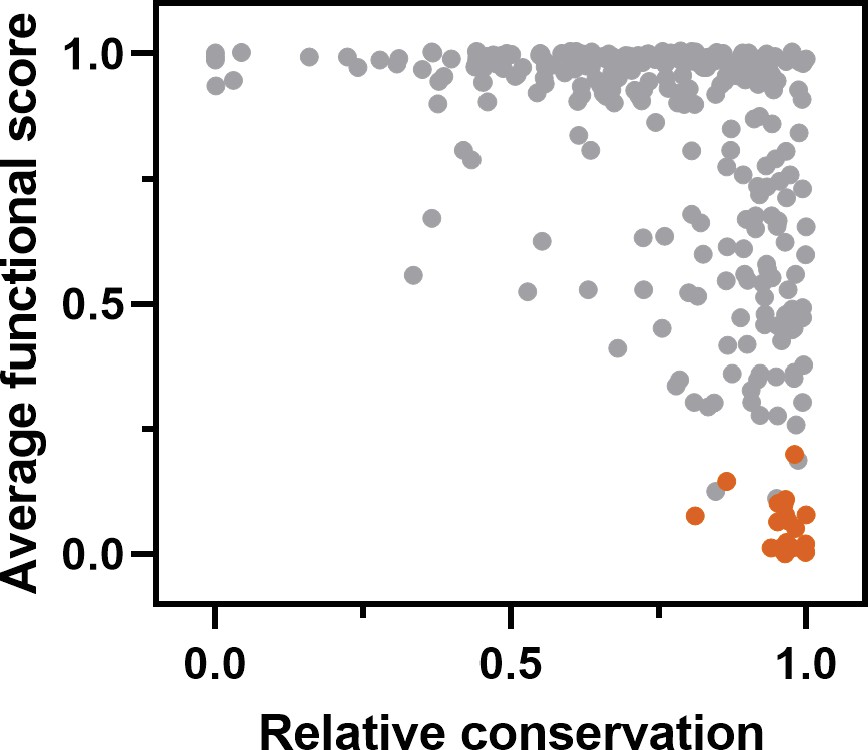
Structural distribution of main protease (Mpro) positions that are intolerant to mutation.
(A) Mpro positions that are intolerant of mutations with 17 or more substitutions having null-like function are represented by red spheres on chain A (shown in gray) and pink spheres on chain B (shown in white). The Nsp4/5 substrate peptide is shown in green (PDB 7T70). (B) Representation of a cluster of the mutation-intolerant positions (red spheres) at a site distal to the active site. (C) A cluster of mutation-intolerant residues (red spheres) appear to be part of a communication network between the active site and the dimerization interface. (D) Comparison of the average functional score of each position to conservation observed in a broad sample of severe acute respiratory syndrome coronavirus-2 (SARS-CoV-2) Mpro homologs. The 24 mutation-intolerant positions shown as red spheres in part A are highlighted in red. Positions exhibiting the strongest evolutionary conservation exhibit a broad range of experimental sensitivity to mutation while the most evolutionary variable positions are experimentally tolerant to mutations.
Figure 6—figure supplement 1
Comparison of the average transcription factor (TF) functional score of each position to conservation observed in a broad sample of severe acute respiratory syndrome coronavirus-2 (SARS-CoV-2) main protease (Mpro) homologs.
Figure 7 with 1 supplement
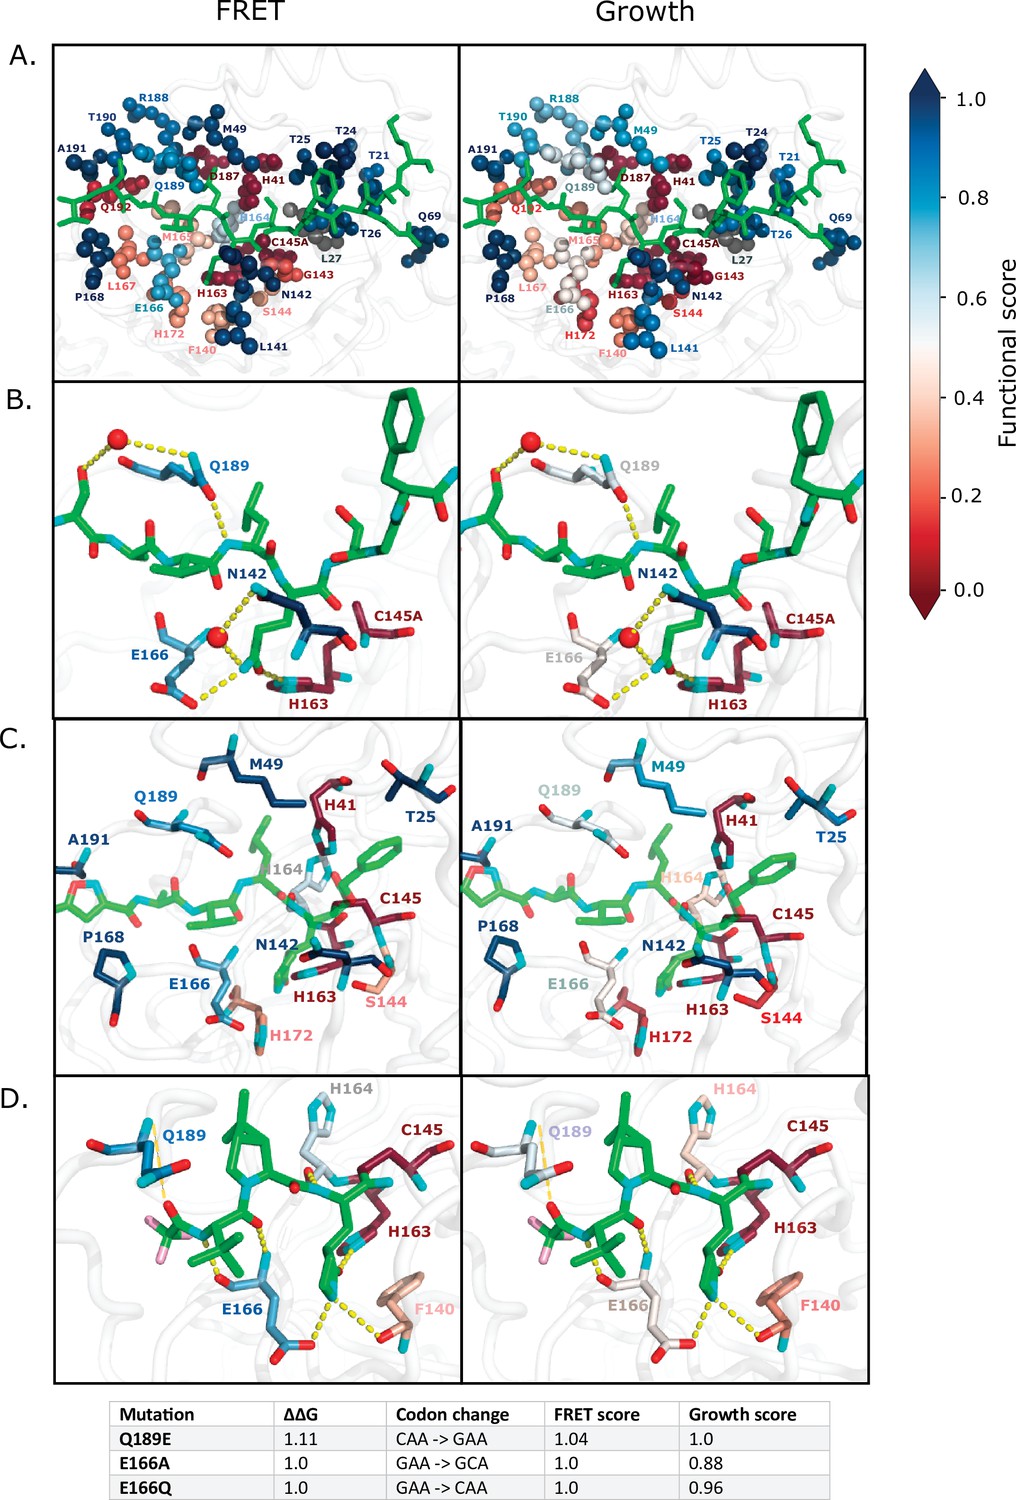
Substrate and inhibitor binding sites are variably sensitive to mutation.
(A) All main protease (Mpro) positions that contact the Nsp4/5 substrate peptide are represented in spheres and colored by their average fluorescence resonance energy transfer (FRET) functional score (left panel) and growth functional score (right panel; PDB 7T70). The Nsp4/5 peptide is shown in green. (B) Mpro positions that form hydrogen bonds with the Nsp4/5 substrate are shown in sticks and colored by their average FRET functional score (left panel) and growth functional score (right panel; PDB 7T70). Oxygens are shown in red and nitrogens in cyan. Water molecules are represented as red spheres and hydrogen bonds as yellow dashed lines. (C) Mpro positions shown to contact over 185 inhibitors in crystal structures (Cho et al., 2021) are shown in sticks and are colored by their average FRET functional score (left panel) and average growth functional score (right panel). Shown is a representative structure of Mpro bound to the N3 inhibitor (PDB 6LU7) (Jin et al., 2020). The N3 inhibitor is shown in green, oxygens in red, and nitrogens in cyan. (D) Mpro positions that form hydrogen bonds with the Pfizer inhibitor, PF-07321332, are represented by sticks and colored by their average FRET functional score (left panel) or growth functional score (right panel; PDB 7VH8) (Owen et al., 2021; Zhao et al., 2021). PF-07321332 is shown in green, oxygens in red, nitrogens in cyan, fluorines in pink. Hydrogen bonds less than 4 Å are represented with thick yellow dashed lines and greater than 4 Å with a thin yellow dashed line. The table below lists the mutations with highest potential for being resistant against PF-07321332.
Figure 7—figure supplement 1
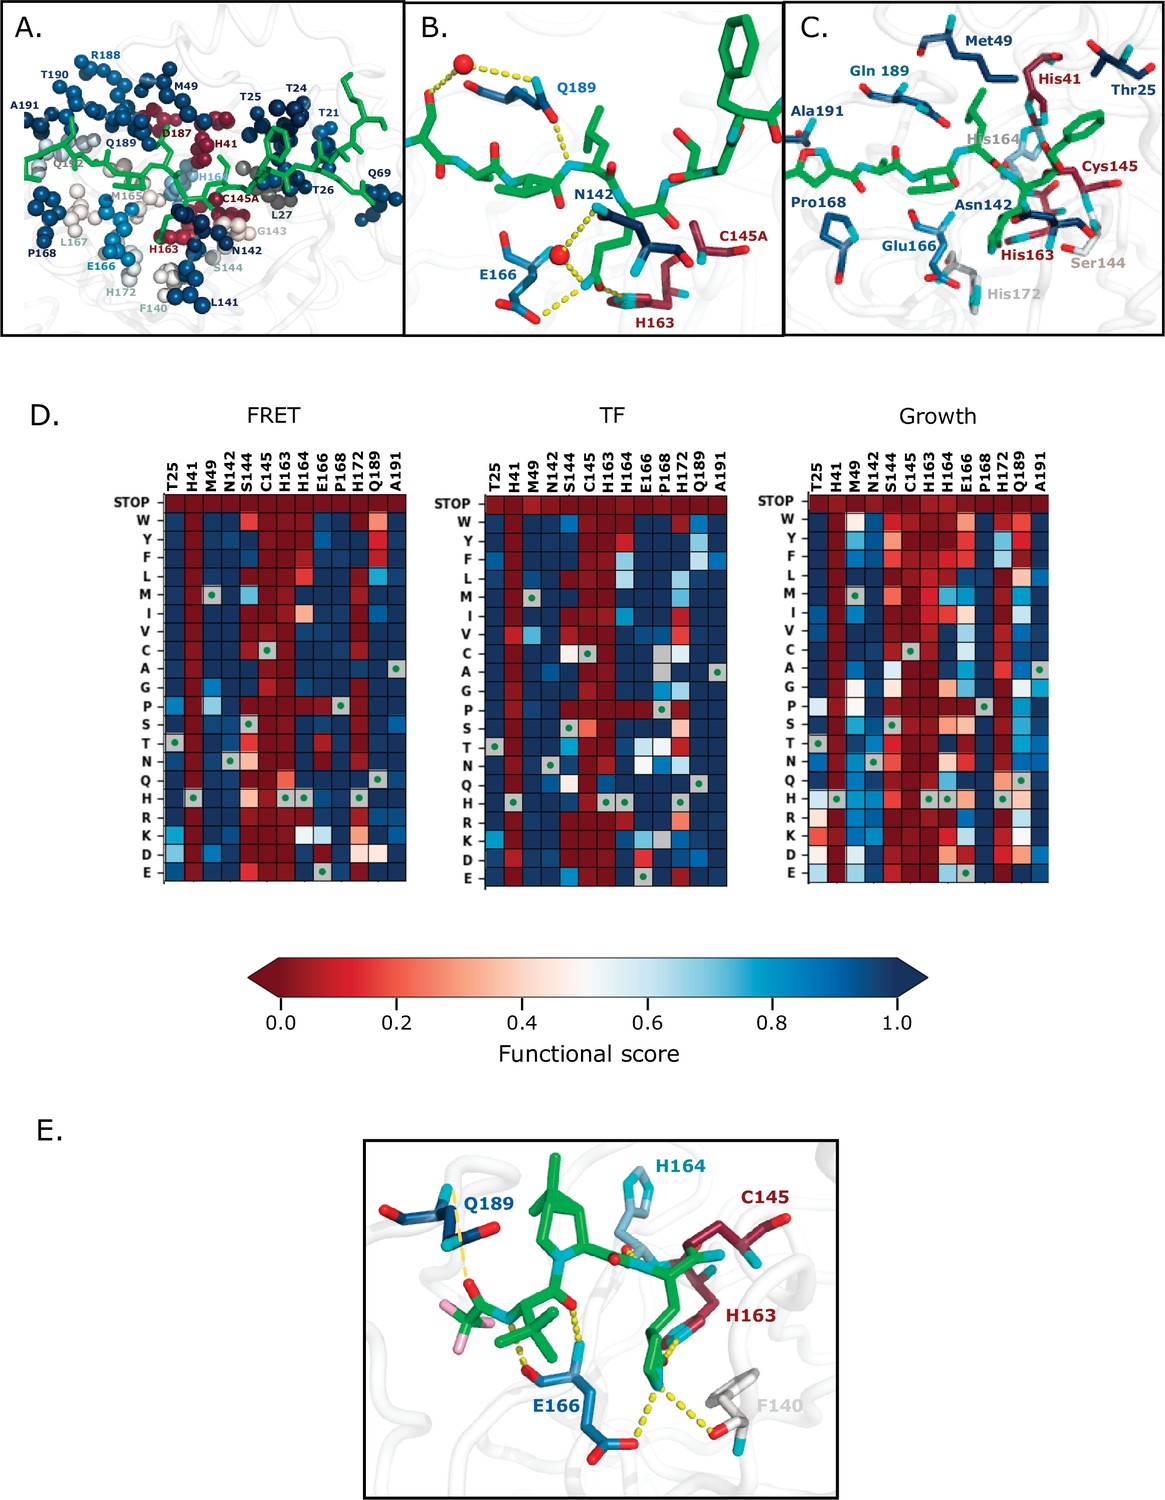
Substrate and inhibitor binding sites are variably sensitive to mutation.
(A) All main protease (Mpro) positions that contact the Nsp4/5 substrate peptide are represented in spheres and colored by their average transcription factor (TF) functional score (PDB 7T70). The Nsp4/5 peptide is shown in green. (B) Mpro positions that form hydrogen bonds with the Nsp4/5 substrate are shown in sticks and colored by their average TF functional score (PDB 7T70). Oxygens are shown in red and nitrogens in cyan. Water molecules are represented as red spheres and hydrogen bonds as yellow dashed lines. (C) Mpro positions shown to contact over 185 inhibitors in crystal structures (Cho et al., 2021) are shown in sticks and are colored by their average TF functional score. Shown is a representative structure of Mpro bound to the N3 inhibitor (PDB 6LU7) (Jin et al., 2020). The N3 inhibitor is shown in green, oxygens in red, and nitrogens in cyan. (D) Heatmap representation of functional scores for the fluorescence resonance energy transfer (FRET) screen (left panel), TF screen (middle panel) and the growth screen (right panel) at key inhibitor-contact positions as illustrated in Figure 7c. (E) Mpro positions that form hydrogen bonds with the Pfizer inhibitor, PF-07321332, are represented by sticks and colored by their average TF functional score (PDB 7VH8) (Owen et al., 2021; Zhao et al., 2021). PF-07321332 is shown in green, oxygens in red, nitrogens in cyan. Hydrogen bonds less than 4 Å are represented with thick yellow dashed lines and greater than 4Å with a thin yellow dashed line.
Tables
Key resources table
| Reagent type (species) or resource | Designation | Source or reference | Identifiers | Additional information |
|---|---|---|---|---|
| Gene (SARS-CoV-2) | ORF1ab/ nsp5A-B | NIH GenBank | NC_045512 | Mpro |
| Strain, Strain background (Saccharomyces cerevisiae) | W303 | Saccharomyces Genome Database | GenBank JRIU00000000 | |
| Antibody | anti-his tag HRP-labelled (Mouse monoclonal) | R&D systems | CAT#: MAB050H | WB (1:4000) |
| Recombinant DNA reagent | Barcoded UbMpro plasmid library | This paper | p416LexA- UbMpro(lib)-N18 | See Materials and Methods section “Generating mutant libraries” |
| Recombinant DNA reagent | Barcoded WT UbMpro plasmid | This paper | p416LexA- UbMpro(WT)-N18 | See Materials and Methods section “Construction of WT Ub-Mpro vector” |
| Recombinant DNA reagent | C145A-Mpro-his6 plasmid | This paper | p416LexA-UbMpro (C145A)-his | See Materials and Methods section “Analysis of Mpro expression” |
| Recombinant DNA reagent | pCyPet-His | Addgene | #14,040 | |
| Recombinant DNA reagent | pYPet-His | Addgene | #14,031 | |
| Recombinant DNA reagent | CyPet-MproCS-YPet fusion gene | This paper | See Materials and Methods section “Generating FRET strain” | |
| Recombinant DNA reagent | pDK-ATC | PMID:28660202 | Integrative bidirectional plasmid with TEF and CUP promoters | |
| Recombinant DNA reagent | pDK-ATG | PMID:28660202 | Integrative bidirectional plasmid with TEF and GPD promoters | |
| Recombinant DNA reagent | DBD-MproCS-AD fusion gene | This paper | See Materials and Methods section “Generating split TF strain” | |
| Commercial assay or kit | KAPA SYBR FAST qPCR Master Mix | Kapa Biosystems | KK4600 | |
| Commercial assay or kit | BCA protein assay kit | Pierce | CAT# 23,225 | |
| Chemical compound, drug | β-Estradiol | Sigma Aldrich | E2768 | |
| Software, algorithm | Scripts to tabulate variant counts | This paper | https://github.com/JuliaFlynn/BolonLab, (copy archived at swh:1:rev:b54d80818c2681fb89533ae330c18a3d39f32ab6) | See Materials and Methods section “Analysis of Illumina sequencing data” |
| Software, algorithm | Scripts to associate barcodes with variants | This paper | https://github.com/JuliaFlynn/PacBio_barcode_assocation, (copy archived at swh:1:rev:29eac92475a9ff8e24fb390986c865b504c03f51) | See Materials and Methods section “Barcode Association” |
| Software, algorithm | GraphPad Prism 9 | Graphpad.com | RRID:SCR_008520 | |
| Software, algorithm | Flowjo v.10.8.0 | BD Biosciences | RRID:SCR_008520 | |
| Software, algorithm | Pymol v. 2.5.2 | Schrödinger | RRID:SCR_000305 | |
| Software, algorithm | MatPlotLib | http://matplotlib.sourceforge.net | RRID:SCR_008624 | |
| Sequence-based reagent | Sequencing primers | This paper | See Supplementary file 1 | |
| Sequence-based reagent | Site-directed mutagenesis primers | This paper | See Supplementary file 1 |
Additional files
-
Supplementary file 1
List of oligomers used in this study.
- https://cdn.elifesciences.org/articles/77433/elife-77433-supp1-v2.xlsx
-
Transparent reporting form
- https://cdn.elifesciences.org/articles/77433/elife-77433-transrepform1-v2.docx
Download links
A two-part list of links to download the article, or parts of the article, in various formats.
Downloads (link to download the article as PDF)
Open citations (links to open the citations from this article in various online reference manager services)
Cite this article (links to download the citations from this article in formats compatible with various reference manager tools)
Comprehensive fitness landscape of SARS-CoV-2 Mpro reveals insights into viral resistance mechanisms
eLife 11:e77433.
https://doi.org/10.7554/eLife.77433


