Oligodendrocyte-lineage cell exocytosis and L-type prostaglandin D synthase promote oligodendrocyte development and myelination
- Department of Psychiatry and Biobehavioral Sciences, Intellectual and Developmental Disabilities Research Center, Semel Institute for Neuroscience and Human Behavior, David Geffen School of Medicine, University of California, Los Angeles, United States
- Division of Neuroscience, IRCCS, San Raffaele Hospital, Italy
- Department of Pathobiochemistry, Osaka Medical and Pharmaceutical University, Japan
- Hirono Satellite, Isotope Science Center, The University of Tokyo, Japan
- Department of Molecular Biology, University of Texas Southwestern Medical Center, United States
- Brain Research Institute, University of California, Los Angeles, United States
- Eli and Edythe Broad Center of Regenerative Medicine and Stem Cell Research, University of California, Los Angeles, United States
- Molecular Biology Institute, University of California, Los Angeles, United States
Figures
Figure 1 with 3 supplements
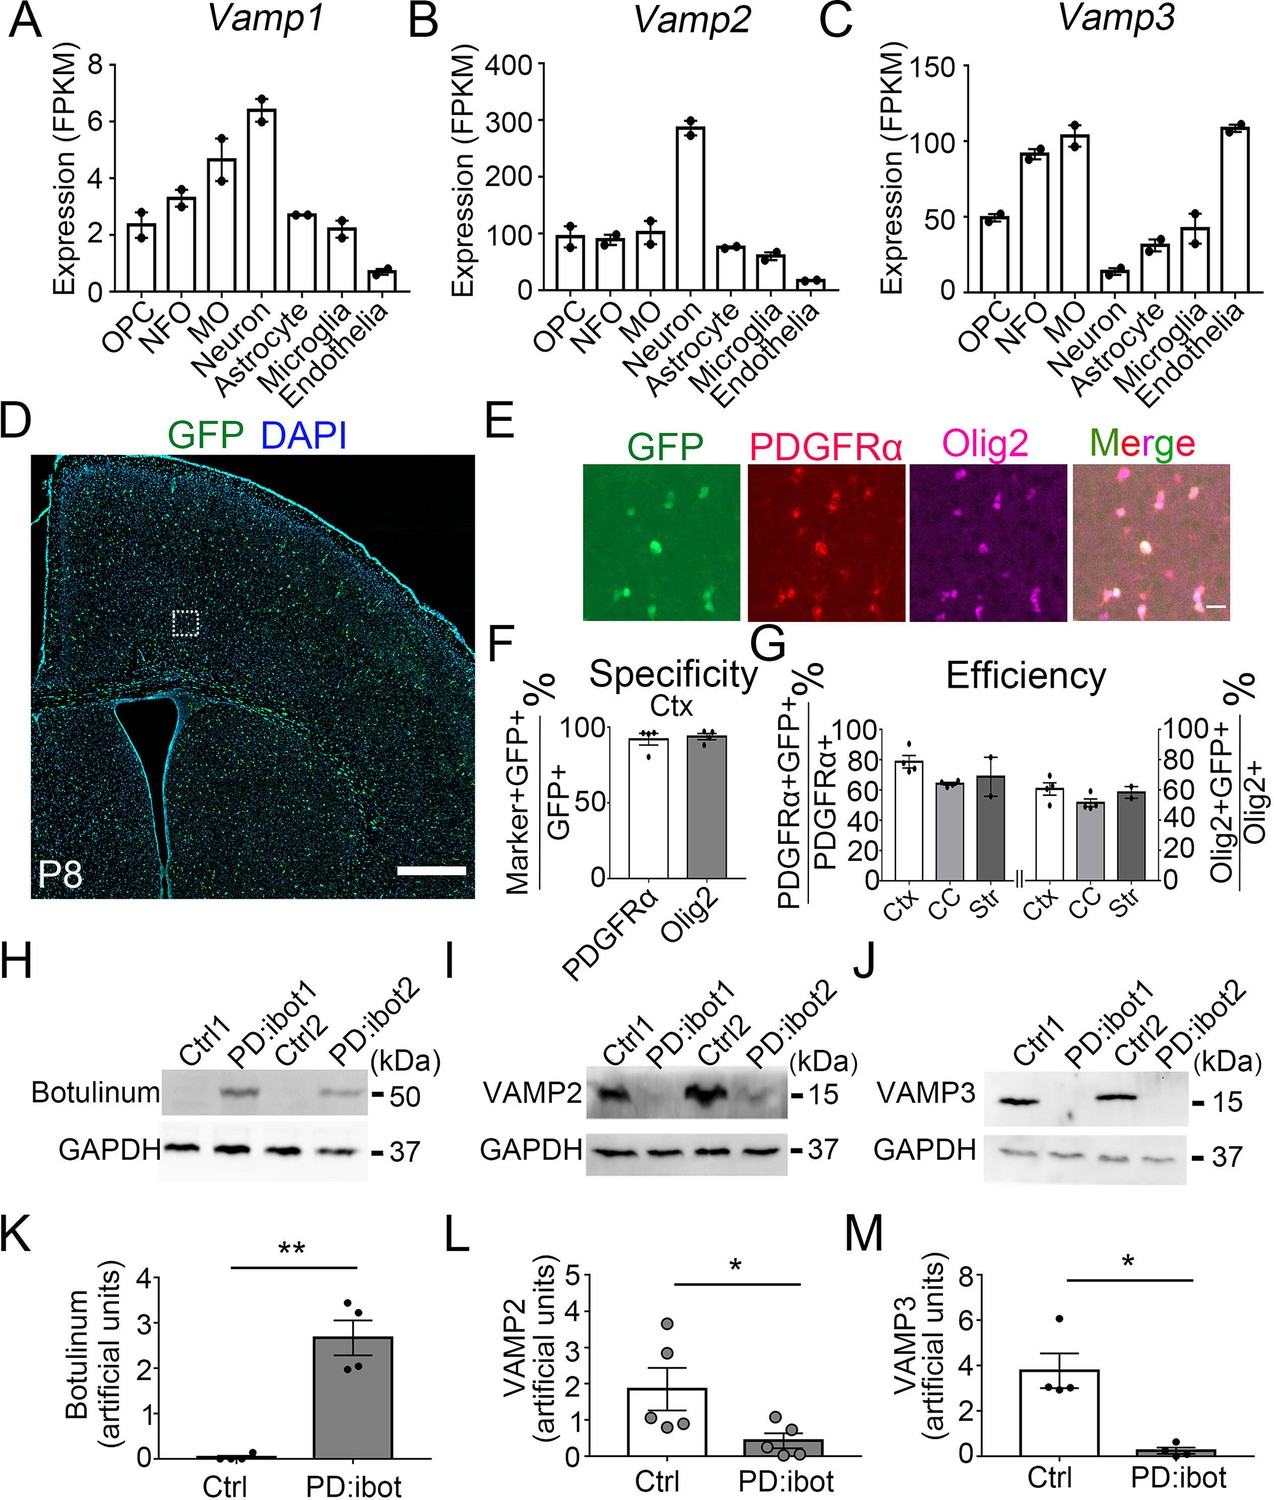
VAMP1/2/3 and ibot expression in oligodendrocyte-lineage cells.
(A–C) Expression of VAMP1/2/3 by oligodendrocyte-lineage cells, neuron, astrocyte, microglia, and endothelia determined by RNA-seq (Zhang et al., 2014). NFO, newly formed oligodendrocytes. MO, myelinating oligodendrocytes. (D) Expression of ibot-GFP in Pdgfra-CreER; ibot (PD:ibot) mice. Scale bar: 500 μm. (E) Colocalization of ibot-GFP with PDGFRα and Olig2 in PD:ibot mice. Scale bar: 20 μm. This image is from box area in (D). (F) Specificity of ibot-GFP expression in oligodendrocyte-lineage cells in cortex. N=4 mice per group. 92.1 ± 3.9% of GFP+ cells were PDGFRα+; 93.8 ± 2.1% of GFP+ cells were Olig2+. (G) Efficiency of ibot-GFP expression in oligodendrocyte-lineage cells in cortex, corpus callosum, and striatum. N=4 mice per group for cortex and corpus callosum. N=2 mice per group for striatum. In cortex, 78.7 ± 4.1% of PDGFRα+ cells were GFP+; 60.6 ± 4.1% of Olig2+ cells were GFP+. In corpus callosum, 64.1 ± 0.9% of PDGFRα+ cells were GFP+; 51.5 ± 2.6% of Olig2+ cells were GFP+. In striatum, 68.8 ± 12.9% of PDGFRα+ cells were GFP+; 58.4 ± 3.9% of Olig2+ cells were GFP+. P8 mice were used in (D–G). (H) Presence of botulinum toxin B-light chain in oligodendrocyte cultures from 4-hydroxytamoxifen-injected PD:ibot mice detected by western blots. (I) Reduced levels of full-length VAMP2 in oligodendrocyte cultures from 4-hydroxytamoxifen-injected PD:ibot mice determined by Western blots. (J) Reduced levels of full-length VAMP3 in oligodendrocyte cultures from 4-hydroxytamoxifen-injected PD:ibot mice determined by western blots. (K) Quantification of botulinum toxin B-light chain immunoblot signal intensity. N=4 mice per group. Paired two-tailed T-test. *, p<0.05. **, p<0.01. ***, p<0.001. NS, not significant. Botulinum toxin B-light chain intensity: 0.03±0.03 in ctrl and 2.7±0.4 in PD:ibot, p=0.008. (L) Quantification of VAMP2 immunoblot signal intensity. N=5 mice per group. Paired two-tailed T-test. VAMP2 intensity: 1.8±0.6 in ctrl and 0.4±0.2 in PD:ibot, p=0.03. (M) Quantification of VAMP3 immunoblot signal intensity. N=4 mice per group. VAMP3 intensity: 3.8±0.8 in ctrl and 0.2±0.1 in PD:ibot, p=0.01.
-
Figure 1—source data 1
It contains original data points for Figure 1A, B, C, F, G, K, L and M.
- https://cdn.elifesciences.org/articles/77441/elife-77441-fig1-data1-v2.xlsx
-
Figure 1—source data 2
It contains figures with the uncropped blots with the relevant bands clearly labelled (A) and original blot images (B–G).
- https://cdn.elifesciences.org/articles/77441/elife-77441-fig1-data2-v2.zip
Figure 1—figure supplement 1
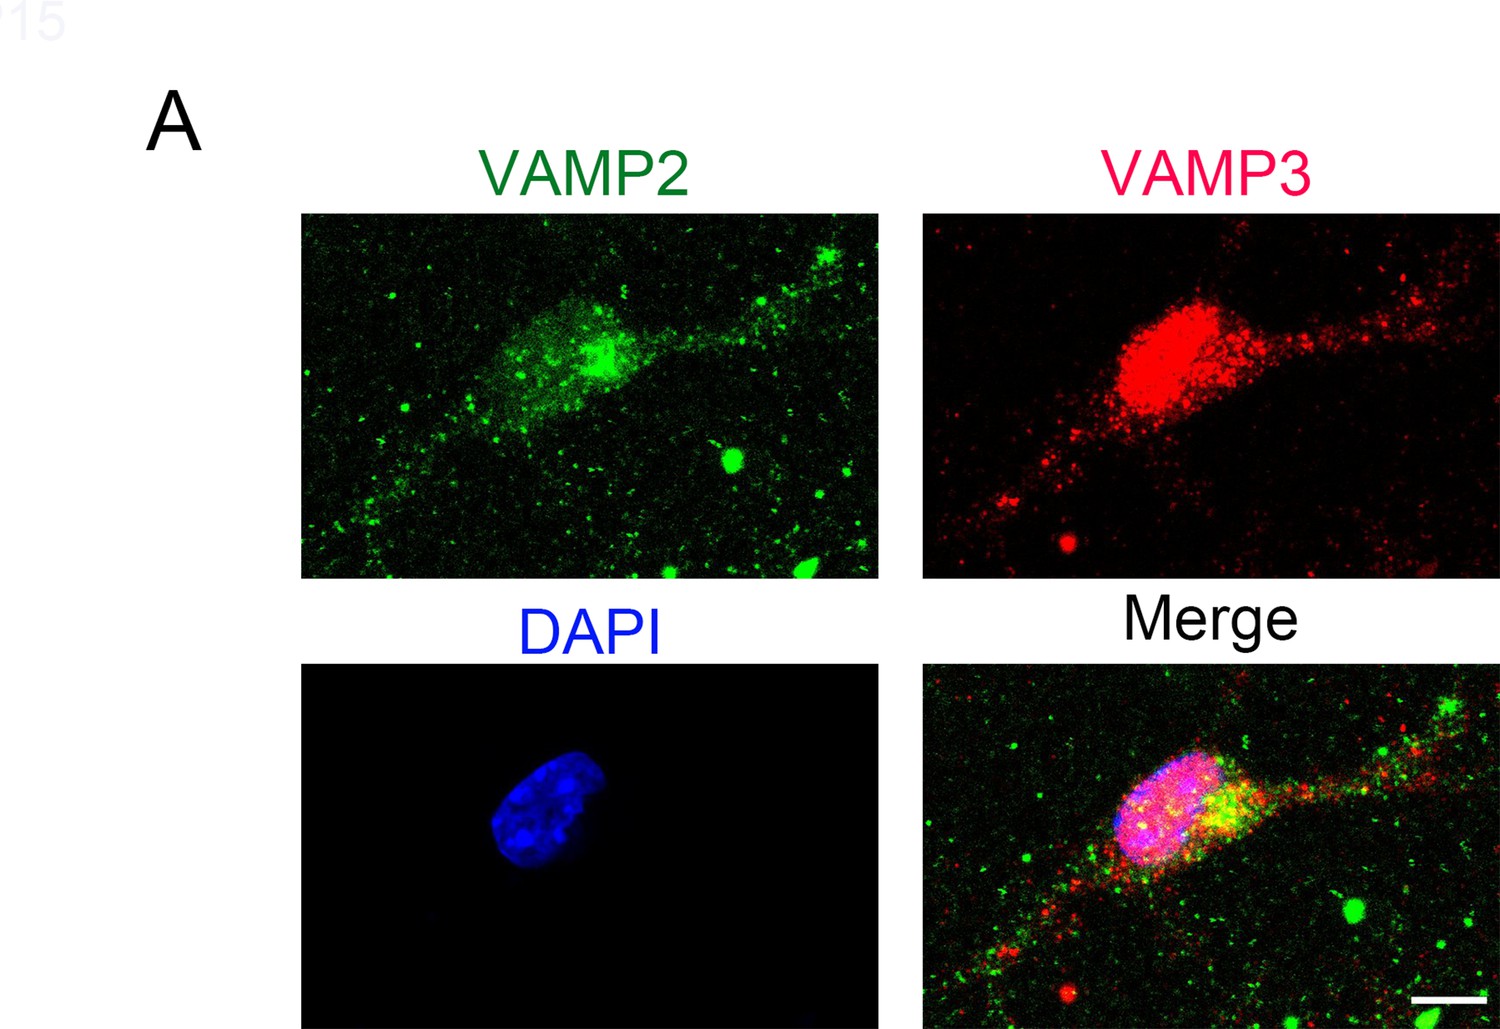
VAMP2+ and VAMP3+ puncta are distributed throughout cultured OPCs, including soma and processes.
(A) DIV2 cultured mouse OPCs were stained with VAMP2 and VAMP3 antibodies. VAMP2+ and VAMP3+ puncta are present in the soma and processes of these cells. Scale bar: 10 μm.
Figure 1—figure supplement 2
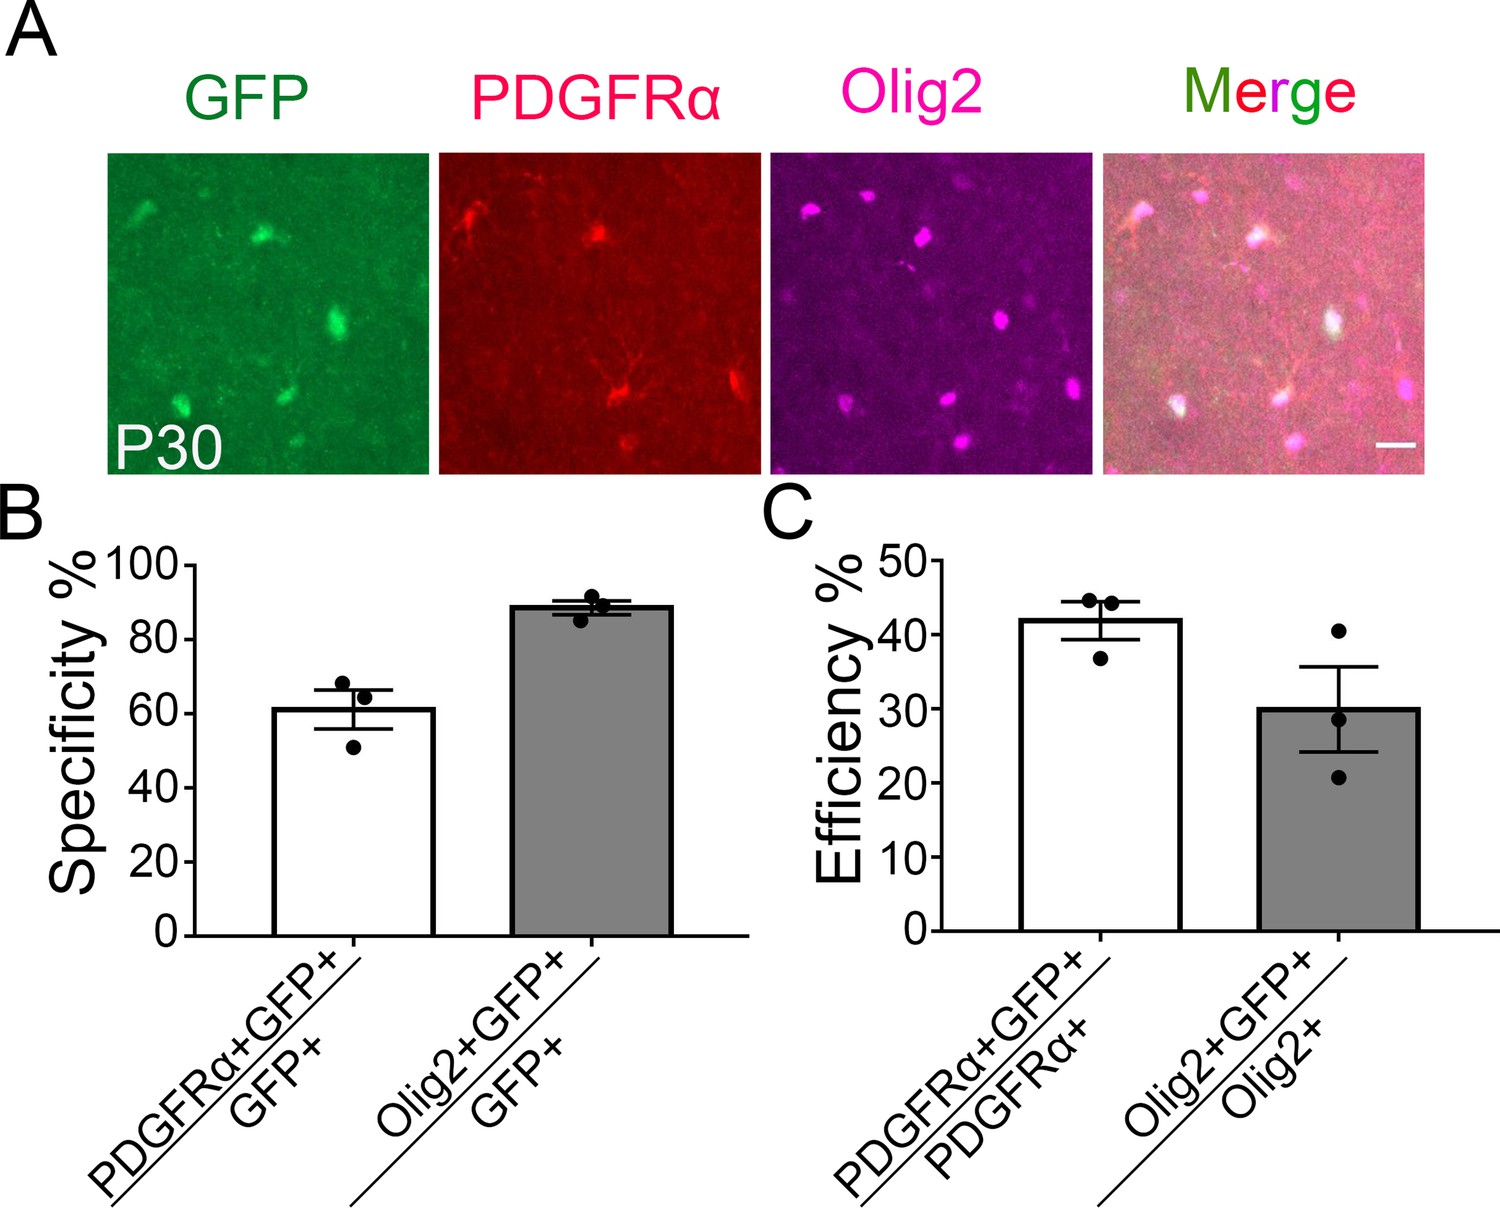
Specificity and efficiency of ibot expression in oligodendrocyte-lineage cells at P30.
(A) Colocalization of ibot-GFP with PDGFRα and Olig2 in PD:ibot mice. Scale bar: 20 μm. (B) Specificity of ibot-GFP expression in oligodendrocyte-lineage cells at P30. N=3 mice per group. 66.2 ± 5.2% in ctrl and 88.7 ± 1.9% in PD:ibot. (C) Efficiency of ibot-GFP expression in oligodendrocyte-lineage cells at P30. N=3 mice per group. 41.9 ± 2.5% in ctrl and 29.9 ± 5.2% in PD:ibot.
-
Figure 1—figure supplement 2—source data 1
It contains original data points for Figure 1—figure supplement 2B and C.
- https://cdn.elifesciences.org/articles/77441/elife-77441-fig1-figsupp2-data1-v2.xlsx
Figure 1—figure supplement 3

Distribution of GFP+ cells in the brain at P8.
(A) Expression of GFP in control and PD:ibot mice. Scale bar: 500 μm. (B,C) Quantification of the density of GFP+ cells in control and PD:ibot mice at P8 and p30. GFP+ cells/mm2 at P8: 0.3±0.1 in ctrl and 323.1±24.1 in PD:ibot; GFP+ cells/mm2 at P30: 0.3±0.1 in ctrl and 132.5±6.3 in PD:ibot.
-
Figure 1—figure supplement 3—source data 1
It contains original data points for Figure 1—figure supplement 3B and C.
- https://cdn.elifesciences.org/articles/77441/elife-77441-fig1-figsupp3-data1-v2.xlsx
Figure 2
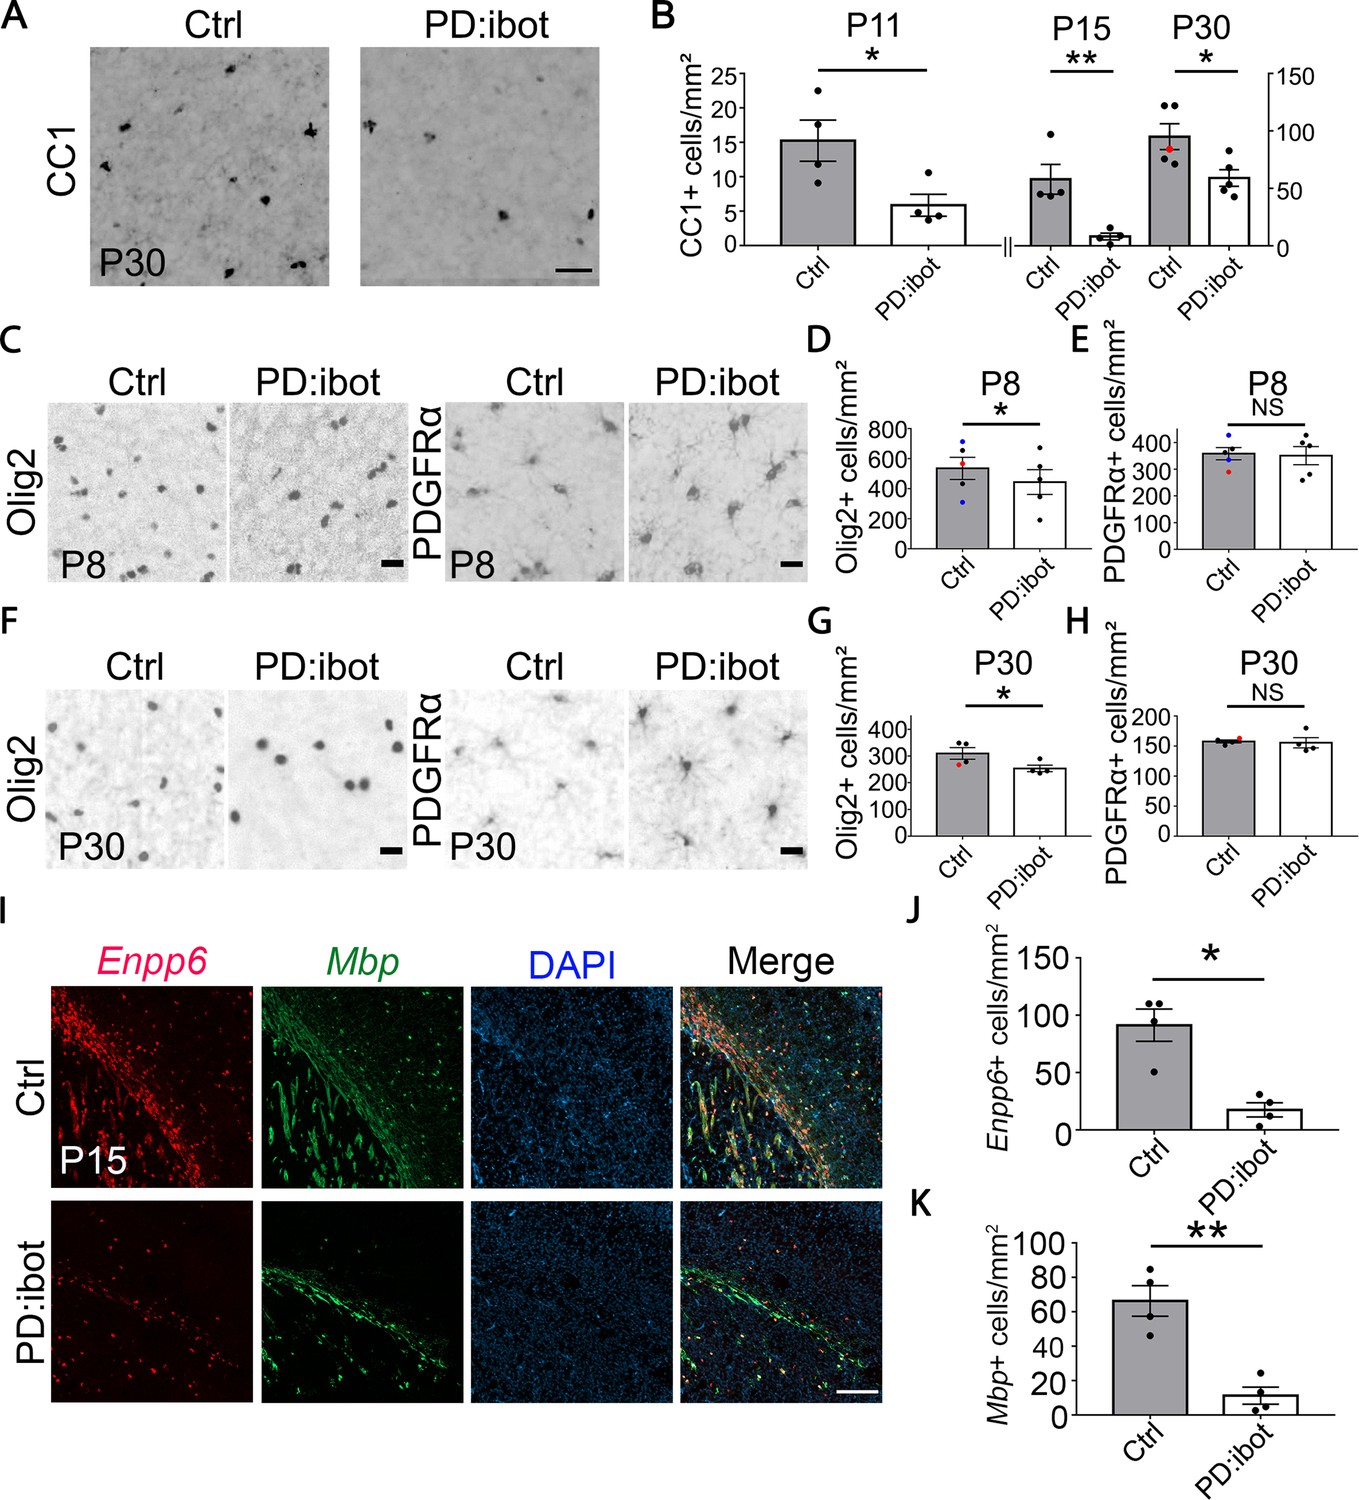
Reduction of CC1+, Olig2+, Enpp6+, and Mbp+ oligodendrocytes in PD:ibot mice.
(A) Differentiated oligodendrocytes labeled by CC1 in the cerebral cortex of PD:ibot and control mice at P30. Scale bar: 50 μm. (B) Quantification of the density of CC1+ differentiated oligodendrocytes in the cerebral cortex of PD:ibot and control mice at P11, 15, and 30. N=4 mice per group at P11 and P15. N=5 mice per group for P30. The genotype of control mice is indicated by color: black dots for ibot only and red dots for Cre only. Paired two-tailed T-test. CC1+ cells/mm2: 15.3±3.0 in control and 5.9±1.6 in PD:ibot, p=0.046 at P11. 57.9±13 in control and 8.1±3.0 in PD:ibot, p=0.018 at P15. 95.0±11.2 in control and 59.0±7.3 in PD:ibot, p=0.049 at P30. (C, F) Olig2+ oligodendrocyte-lineage cells and PDGFRα+ OPCs in the cerebral cortex of PDibot and control mice at P8 (C) and P30 (F). Scale bars: 20 μm. (D, E, G, H) Quantification of the densities of Olig2+ and PDGFRα+ cells in the cerebral cortex of PD:ibot and control mice at P8 and P30. N=5 mice per group at P8. N=4 mice per group at P30. Paired two-tailed T-test. Olig2+ cells/mm2: 535.6±73.6 in control and 444.4±82.9 in PD:ibot, p=0.040 at P8; 309.9±21.7 in control and 253.8±12.2 in PD:ibot, p=0.048 at P30. PDGFRα+ cells/mm2: 358.4±22.8 in control and 350.9±34.0 in PD:ibot, p=0.74 at P8; 157.8±2.6 in control and 155.6±8.5 in PD:ibot, p=0.85 at P30. (I) Enpp6+ cells and Mbp+ cells in the brains of PDibot and control mice at p15. Scale bar: 200 μm. (J, K) Quantification of the density of Enpp6+ cells and Mbp+ cells in the cerebral cortex of PD:ibot and control mice at P15. N=4 mice per group. All control mice are ibot only (black dots). Paired two-tailed T-test. Enpp6+ cells/mm2: 91.4±14.1 in control and 17.5±6.2 in PD:ibot, p=0.015; Mbp+ cells/mm2: 66.3±8.9 in control and 11.3±4.9 in PD:ibot, p=0.0057.
-
Figure 2—source data 1
It contains original data points for Figure 2B, D, E, G, H, J and K.
- https://cdn.elifesciences.org/articles/77441/elife-77441-fig2-data1-v2.xlsx
Figure 3 with 3 supplements
Defective myelination and motor behavior in PD:ibot mice.
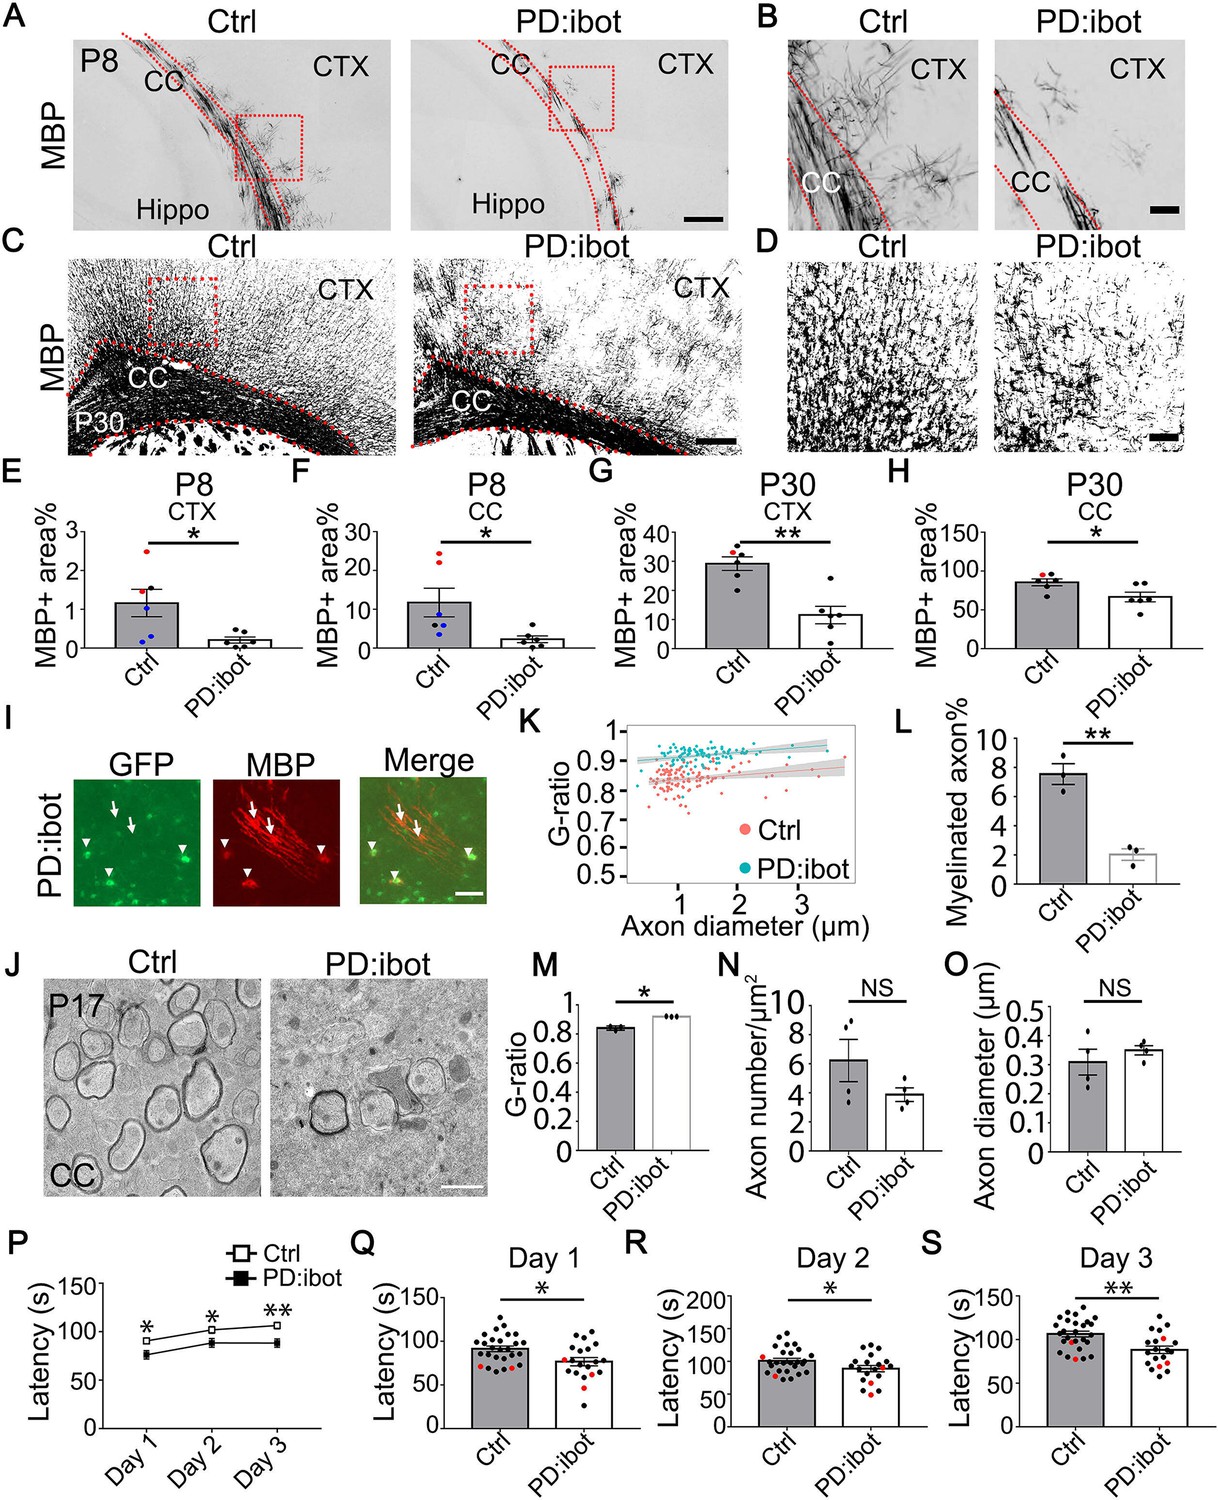
(A–D) MBP immunofluorescence at P8 (A, B) and P30 (C, D) in PD:ibot and control brains. Dashed lines delineate the corpus callosum. CTX, cerebral cortex. CC, corpus callosum. Hippo, hippocampus. Boxed areas in (A) are enlarged and shown in (B); Boxed areas in (C) are enlarged and shown in (D). Scale bars: 200 μm in (A, C), 50 μm in (B, D). (E–H) Quantification of MBP +area in the cerebral cortex (E, G) and the corpus callosum (F, H) at P8 and P30. Control mice at P8 are ibot only (black dots), Cre only (red dot), and wildtype (blue dots). Control mice at P30 are ibot only (black dots) and Cre only (red dots). N=6 mice per group. Paired two-tailed T-test. MBP coverage in the cortex (%): 1.16±0.35 in control and 0.21±0.079 in PD:ibot, p=0.030 at P8; 29.21±2.22 in control and 11.55±3.02 in PD:ibot, p=0.0025 at p30. MBP coverage in the corpus callosum (%): 11.73±3.70 in control and 2.26±0.87 in PD:ibot, p=0.024 at P8; 85.50±4.40 in control and 66.61±6.25 in PD:ibot, p=0.024 at P30. (I) The morphology of ibot-GFP + cells and GFP– control cells labeled by MBP immunofluorescence. A region in the cerebral cortex from a P8 PD:ibot mouse is shown. The arrowheads point to ibot-GFP + cells and the arrows point to GFP– control cells. Scale bar: 50 μm. (J) Transmission electron microscopy images of the corpus callosum at P17. Scale bar: 1 μm. (K) g-ratio as a function of axon diameter in the corpus callosum at P17. N=3 mice per group. 112 myelinated axons from control and 97 myelinated axons from PD:ibot were analyzed. (L, M) Quantification of the percentage of myelinated axons and g-ratio (axon diameter divided by the diameter of myelin +axon) from the transmission electron microscopy images of the corpus callosum at P17. N=3 mice per group. All control mice at P17 are ibot only (black dots). Paired two-tailed T-test. Myelinated axons %: 7.6±0.7 in control and 2.0±0.4 in PD:ibot, p=0.0048. g-ratio: 0.84±0.009 in control and 0.92±0.0009 in PD:ibot; p=0.012. (N, O) Quantification of axon density and axon diameter from the transmission electron microscopy images of the corpus callosum at P17. N=4 mice per group. Paired two-tailed T-test. Axon number/µm2: 6.2±1.5 in control and 3.9±0.47 in PD:ibot, p=0.19. Axon diameter: 309.1±44.3 nm in control and 349.8±16.0 nm in PD:ibot; p=0.51. (P) Latency to fall from an accelerating rotarod (seconds). Each mouse was tested three times per day for 3 consecutive days. The average latency to fall of the three trials of each mouse was recorded for each day. No significant sex differences were detected. Unpaired two-tailed T-test was performed with Benjamini, Krieger, and Yekutieli’s false discovery rate (FDR) method to correct for multiple comparisons. *, FDR <0.05. **, FDR <0.01. (Q–S) Latency to fall on each testing day. Day 1: PD:ibot: 76.7±4.7 seconds, control: 91.4±3.2 s, p=0.015; day 2: PD:ibot: 88.9±4.9 s, control: 101.1±3.7 s, p=0.033; day 3: PD:ibot: 88.4±4.3 s, control: 106.4±3.3 s, p=0.0051. N=27 mice for control and 20 mice for PD:ibot. 2 months old mice (black dots) and 5 months old mice (red dots) are pooled for experiments.
-
Figure 3—source data 1
It contains original data points for Figure 3E, F, G, H, K, L, M, N, O, P, Q, R and S.
- https://cdn.elifesciences.org/articles/77441/elife-77441-fig3-data1-v2.xlsx
Figure 3—figure supplement 1
No change in the percentage of cleaved-caspase-3+ cells in oligodendrocytes, OPCs, and other lineages.
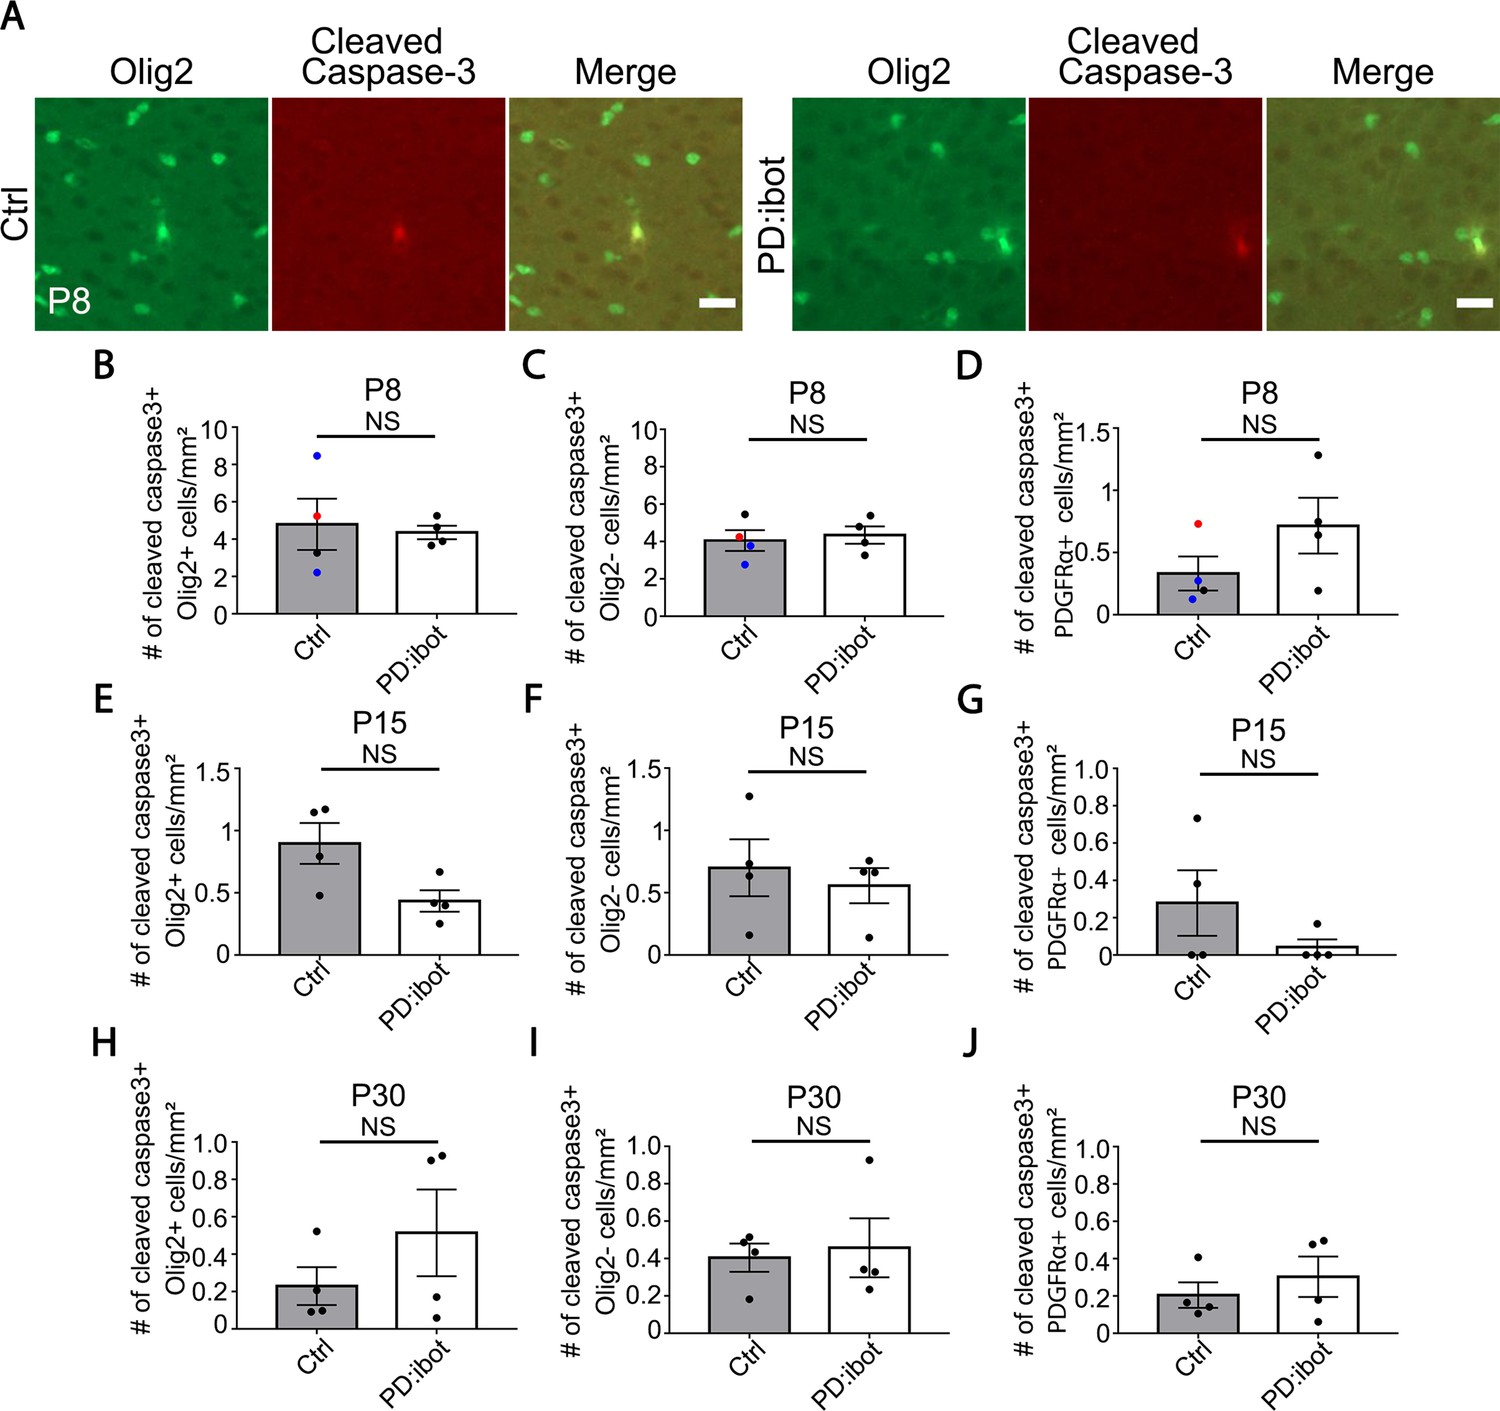
(A) Examples of apoptotic oligodendrocyte-lineage cells labeled by cleaved caspase-3 in the cerebral cortex at P8. Scale bar: 20 μm. (B–D) Quantification of the density of cleaved caspase3+ cells in the cerebral cortex of PD:ibot and control mice at P8. N=4 mice per group. Control mice were ibot only (black dots), Cre only (red dot), and wildtype (blue dots). Paired two-tailed T-test. Cleaved caspase3+Olig2+ cells/mm2: 4.8±1.4 in control and 4.4±0.4 in PD:ibot, p=0.74; cleaved caspase3+ Olig2- cells/mm2: 4.1±0.6 in control and 4.3±0.5 in PD:ibot, p=0.77; cleaved caspase3+PDGFRα+ cells/mm2: 0.3±0.1 in control and 0.7±0.2 in PD:ibot, p=0.3. (E–G) Quantification of the density of cleaved caspase3+ cells in the cerebral cortex of PD:ibot and control mice at P15. N=4 mice per group. All control mice were ibot only (black dots). Paired two-tailed T-test. Cleaved caspase3+Olig2+ cells/mm2: 0.9±0.2 in control and 0.4±0.1 in PD:ibot, p=0.2; cleaved caspase3+Olig2- cells/mm2: 0.7±0.2 in control and 0.6±0.1 in PD:ibot, p=0.6; cleaved caspase3+PDGFRα+ cells/mm2: 0.3±0.2 in control and 0.04±0.04 in PD:ibot, p=0.3. (H–J) Quantification of the density of cleaved caspase3+ cells in the cerebral cortex of PD:ibot and control mice at P30. N=4 mice per group. All control mice were ibot only (black dots). Paired two-tailed T-test. Cleaved caspase3+Olig2+ cells/mm2: 0.2±0.1 in control and 0.5±0.2 in PD:ibot, p=0.4; cleaved caspase3+Olig2- cells/mm2: 0.4±0.1 in control and 0.5±0.2 in PD:ibot, p=0.7; cleaved caspase3+PDGFRα+ cells/mm2: 0.2±0.1 in control and 0.3±0.1 in PD:ibot, p=0.6.
-
Figure 3—figure supplement 1—source data 1
It contains original data points for Figure 3—figure supplement 1B, C, D and E.
- https://cdn.elifesciences.org/articles/77441/elife-77441-fig3-figsupp1-data1-v2.xlsx
Figure 3—figure supplement 2
Ibot-GFP-expressing cells contribute to the population of surviving differentiated oligodendrocytes.
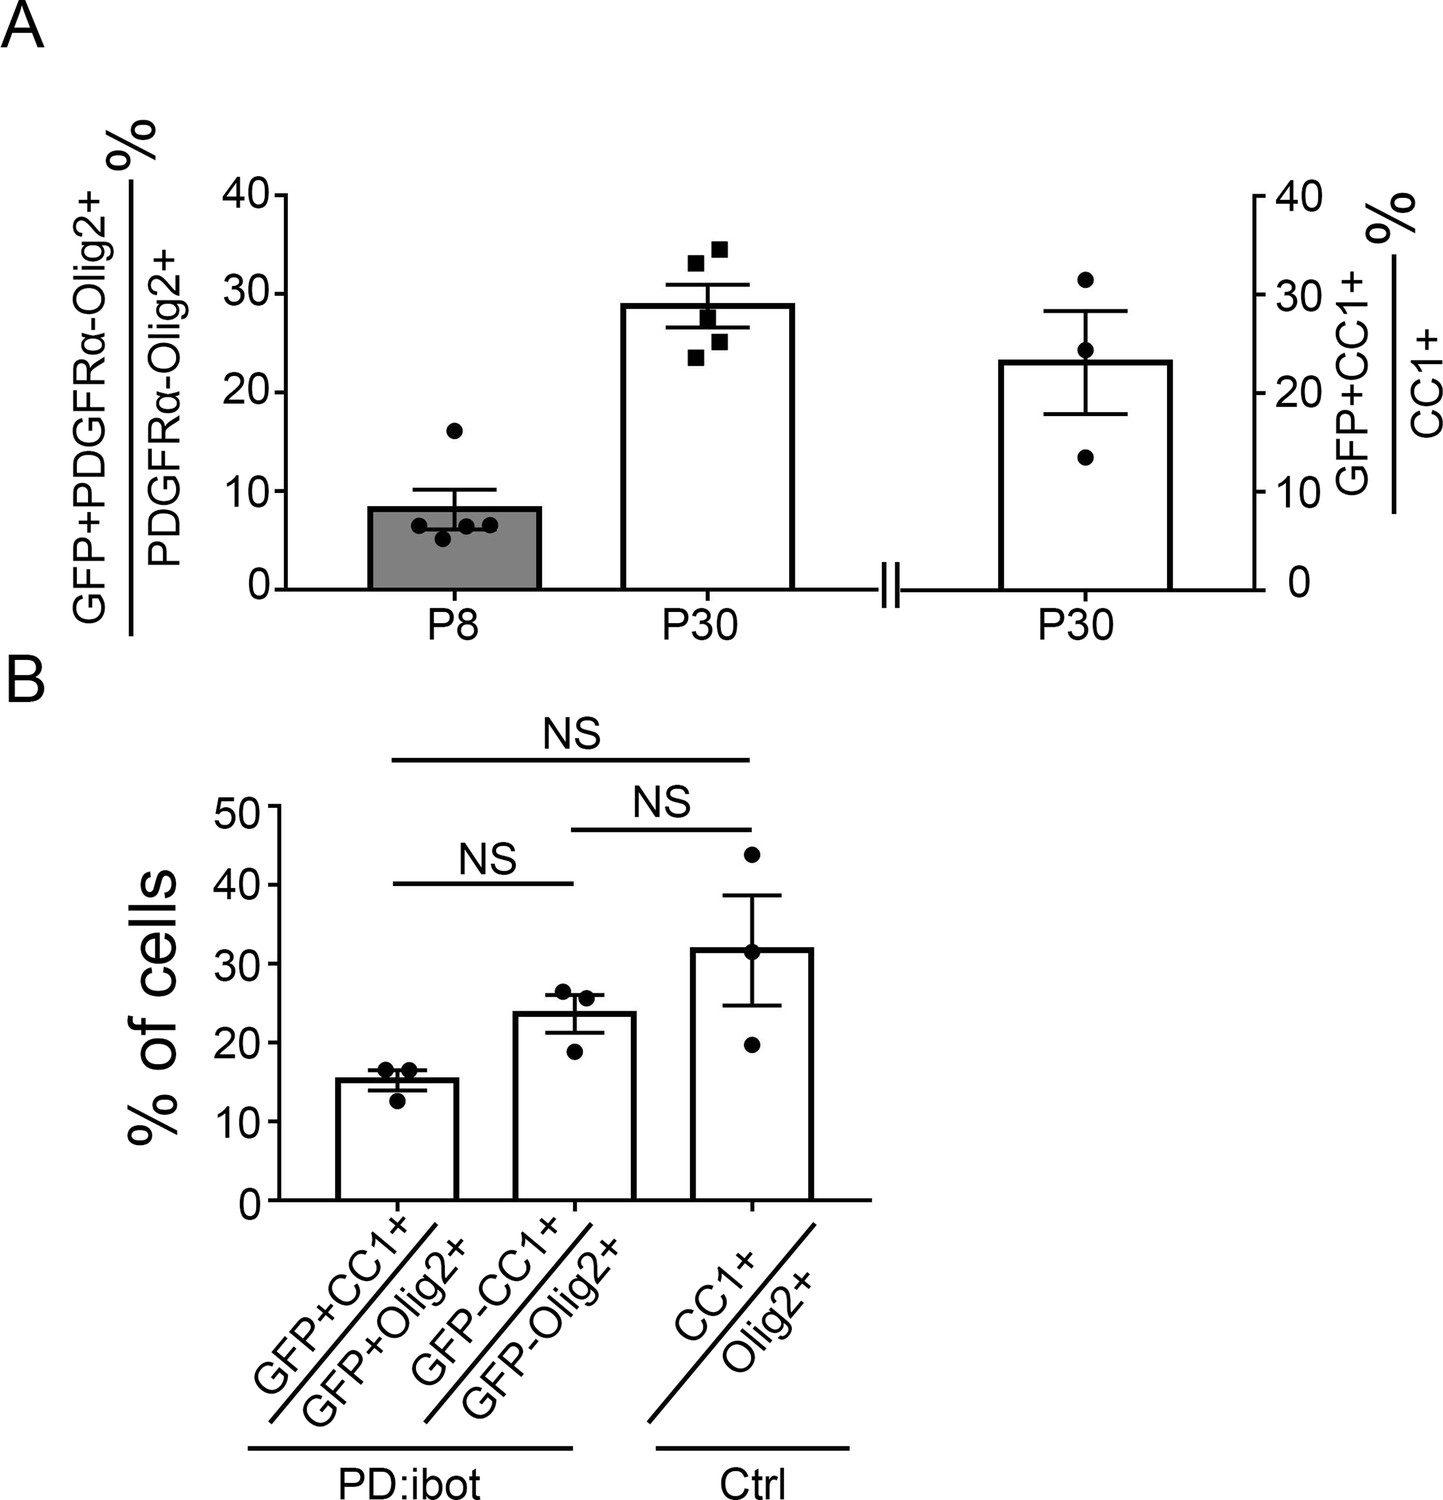
(A) Quantification of the percentage of ibot-GFP-expressing cells within differentiated oligodendrocytes (Olig2+PDGFRα– cells at P8 and P30 and CC1+ cells at p30). 8.1 ± 2.0% of Olig2+PDGFRα– cells at P8 and 28.8 ± 2.2% Olig2+PDGFRα– cells at P30 express ibot-GFP; 23.1±5.2% CC1+ cells at P30 express ibot-GFP. (B) Quantification of the ratios of CC1+ cells to Olig2+ cells in GFP+ cells in PD:ibot mice, GFP– cells in PD:ibot mice and control mice at P30. N=3 mice per group. 15.2 ± 1.3% of GFP+Olig2+ cells are GFP+CC1+, 23 ± 2.4% of GFP–Olig2+ are GFP–CC1+ in PD:ibot mice, whereas 31.7 ± 7.0% of Olig2+ cells are CC1+ in control mice. One-way ANOVA with Benjamini, Krieger, and Yekutieli’s two-stage linear step-up FDR procedure for multiple comparisons. Every group was compared with every other group. GFP+ cells vs. GFP– cells in PD:ibot mice: p=0.054; GFP+ cells in PD:ibot mice vs. cells in control mice: p=0.28; GFP– cells in PD:ibot mice vs. cells in control mice: p=0.50.
-
Figure 3—figure supplement 2—source data 1
It contains original data points for Figure 3—figure supplement 2A.
- https://cdn.elifesciences.org/articles/77441/elife-77441-fig3-figsupp2-data1-v2.xlsx
Figure 3—figure supplement 3
Increase in the percentage of Ki-67+ proliferating OPCs in PD:ibot mice at P8.
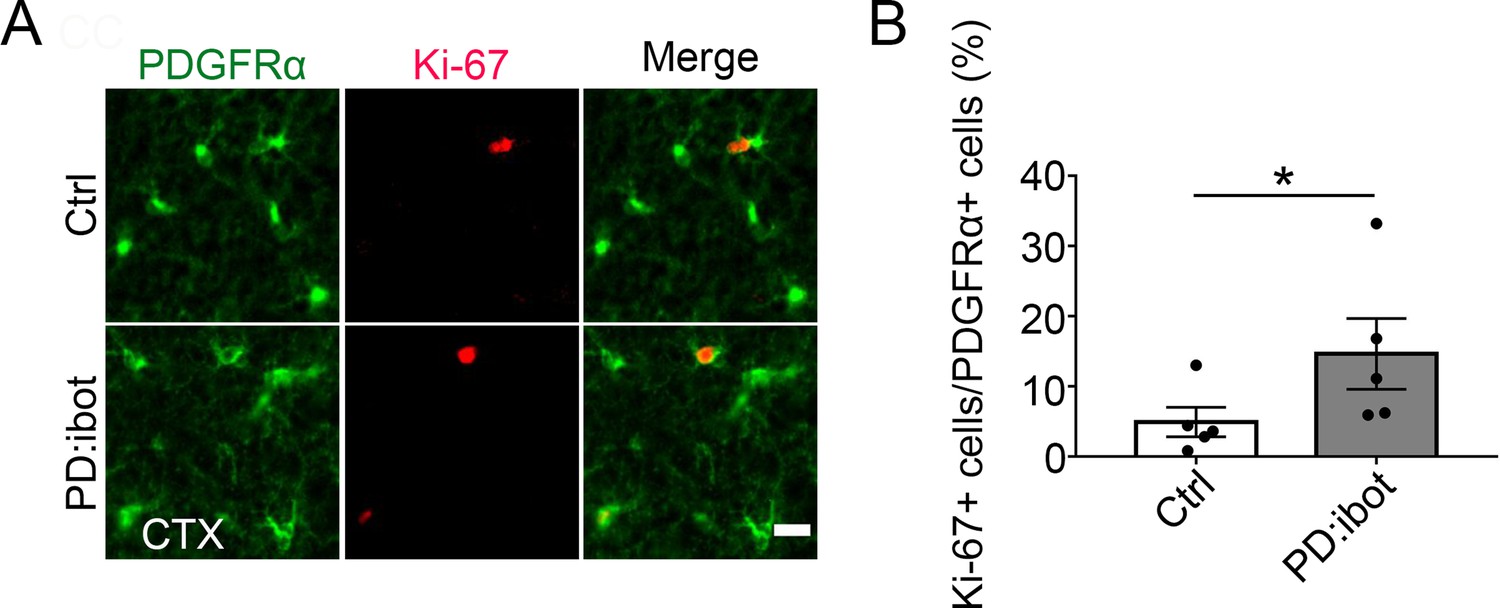
(A) Colocalization of PDGFRα and Ki-67 in the cortex of control and PD:ibot mice. Scale bar: 20 μm. (B) Quantification of the percentage of Ki-67+ proliferating OPCs in the cortex of control mice and PD:ibot mice. N=5 per group. Paired two-tailed T-test. Ki-67+PDGFRα+/PDGFRα+ (%): 4.9±2.1 in ctrl mice and 14.6±5.0 in PD:ibot mice, p=0.04.
-
Figure 3—figure supplement 3—source data 1
It contains original data points for Figure 3—figure supplement 3B.
- https://cdn.elifesciences.org/articles/77441/elife-77441-fig3-figsupp3-data1-v2.xlsx
Figure 4 with 1 supplement
Transcriptome changes of purified glial cells from PD:ibot mice.
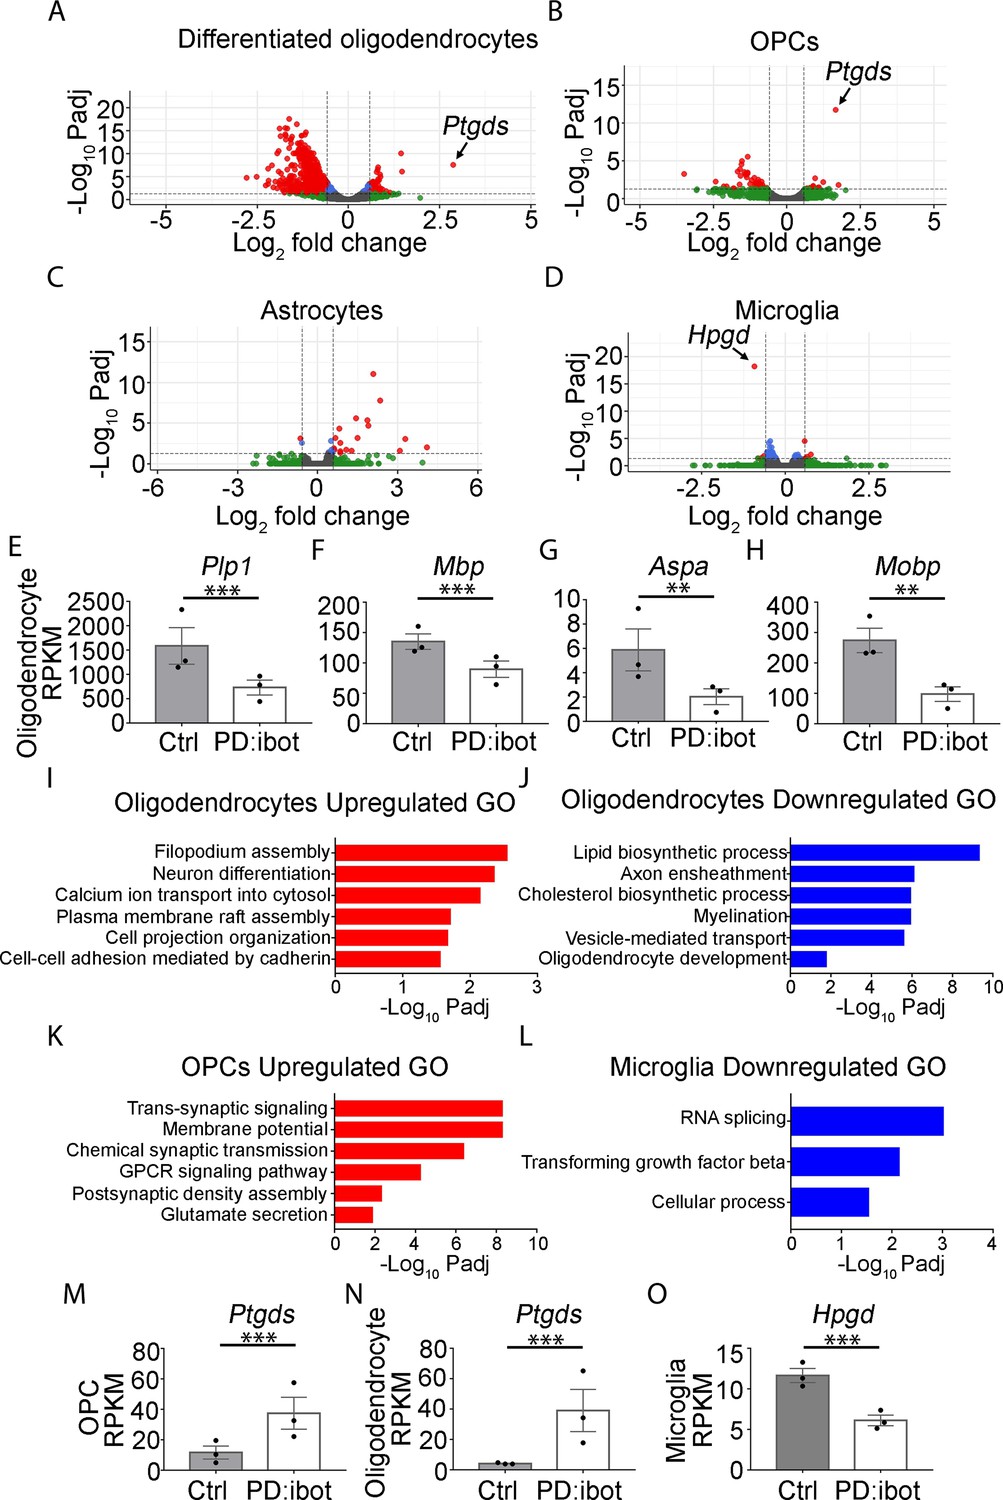
(A–D) Differentiated oligodendrocytes, OPCs, astrocytes, and microglia were purified by immunopanning from whole brains of P17 PD:ibot and littermate control mice. Anti-GalC hybridoma was used to purify differentiated oligodendrocytes; anti-O4 hybridoma was used to isolate OPCs; anti-HepaCAM antibody was used to purify astrocytes; anti-CD45 antibody was used to isolate microglia. More details can be found in the method section. Gene expression was determined by RNA-seq. Genes exhibiting significant changes (P-value adjusted for multiple comparisons, Padj <0.05, fold change >1.5) are shown in red. (E–H) Examples of mature oligodendrocyte marker gene expression by oligodendrocytes purified from PD:ibot and control mice at P17. N=3 mice per group. Significance is determined by DESeq2. Plp1: 1586±375.9 in control and 729.3±152.4 in PD:ibot, p=3.96 × 10⁻¹³; Mbp: 135.2±12.8 in control and 89.8±13.5 in PD:ibot, p=4.76 × 10⁻⁵; Aspa: 5.9±1.7 in control and 2.0±0.6 in PD:ibot, p=0.003; Mobp: 274.4±40.1 in control and 97.5±24.0 in PD:ibot, p=0.0004. (I–L) Examples of GO terms associated with genes upregulated in oligodendrocytes (I), downregulated in oligodendrocytes (J), upregulated in OPCs (K), and downregulated in microglia (L). There are no GO terms significantly associated with genes downregulated in OPCs or upregulated in microglia. (M, N) Expression of Ptgds by OPCs and oligodendrocytes purified from PD:ibot and control mice at P17. N=3 mice per group. Significance is determined by DESeq2. Ptgds in OPCs: 11.6±4.3 in control and 34.5±10.5 in PD:ibot, p=1.79 × 10⁻¹²; Ptgds in oligodendrocytes: 4.1±0.3 in control and 39.1±13.9 in PD:ibot, p=3.14 × 10⁻⁸. (O) Expression of Hpgd by microglia purified from PD:ibot and control mice at P17. (E–H, M–O) Expression is shown in RPKM. N=3 mice per group. Significance is determined by DESeq2. Hpgd in microglia: 11.7±0.9 in control and 6.1±0.7 in PD:ibot, p=6.34 × 10⁻¹⁹.
-
Figure 4—source data 1
It contains original data points for Figure 4E, F, G, H, M, N and O.
- https://cdn.elifesciences.org/articles/77441/elife-77441-fig4-data1-v2.xlsx
Figure 4—figure supplement 1
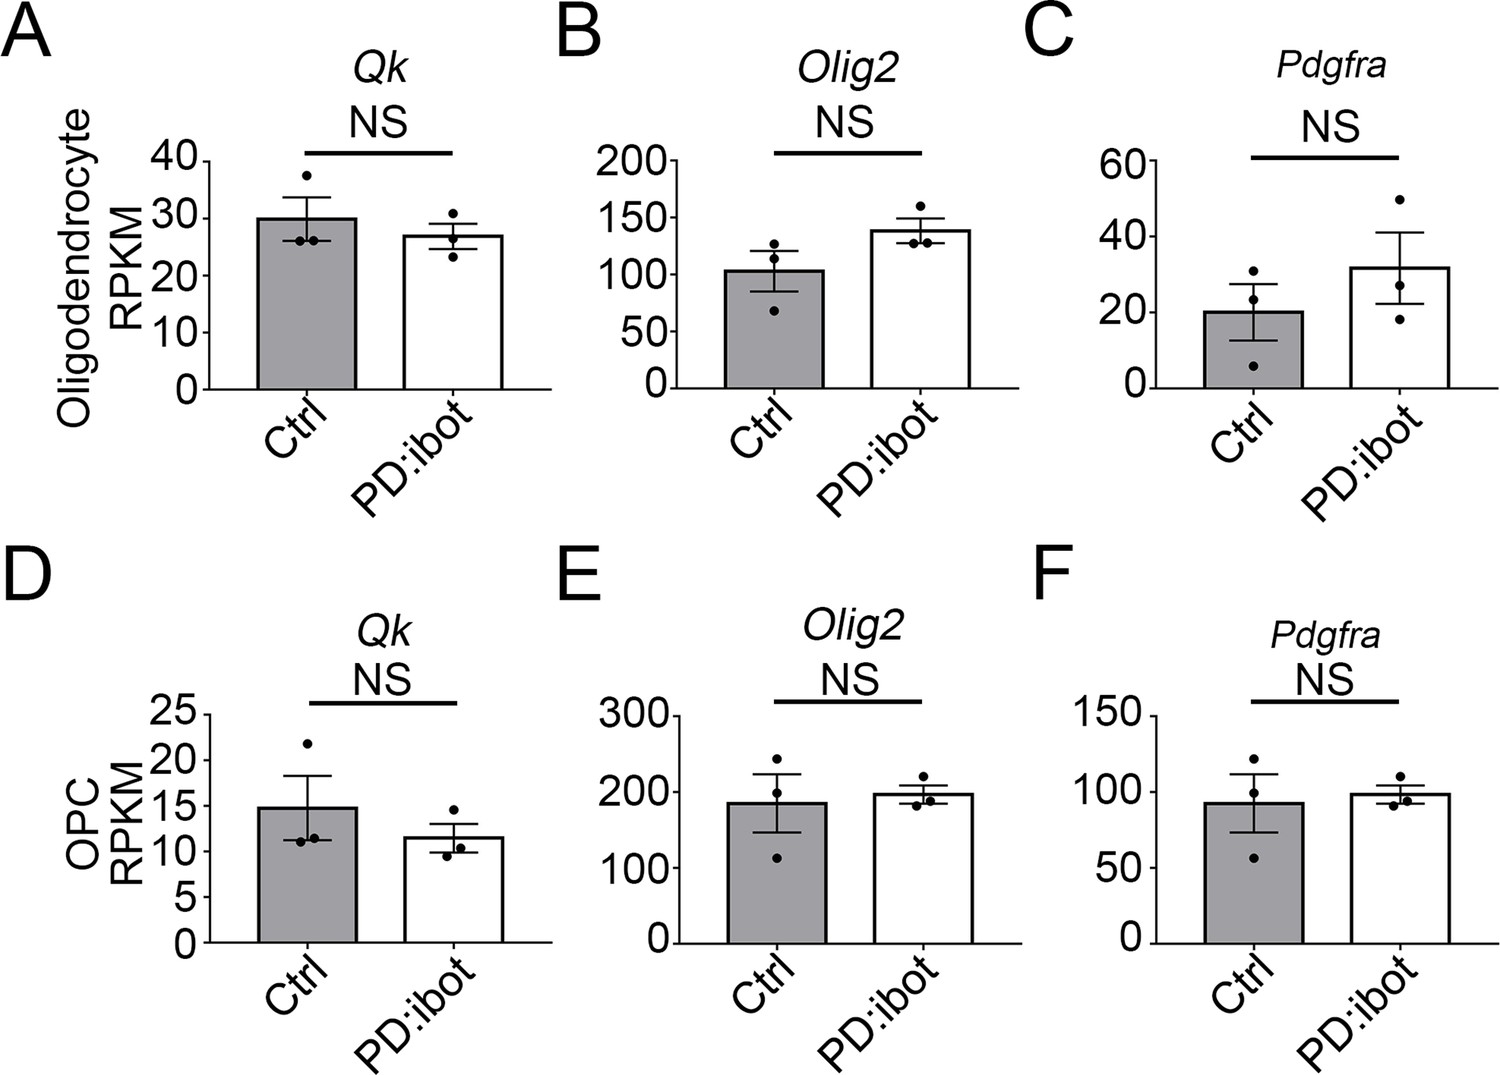
The expression of Qk, Olig2, and Pdgfra did not change in the oligodendrocyte-lineage cells in PD:ibot mice at P17 (A–C) Expression of Qk, Olig2, and Pdgfra by oligodendrocytes purified from PD:ibot and control mice.
Expression is shown in RPKM. N=3 mice per group. Significance is determined by DESeq2. Qk: 29.9±3.8 in ctrl and 26.9±2.2 in PD:ibot, p=0.1; Olig2: 102.9±17.8 in ctrl and 138.4±10.9 in PD:ibot, p=0.2; Pdgfra: 20.1±7.4 in ctrl and 31.7±9.4 in PD:ibot, p=0.2. (D–F) Expression of Qk, Olig2, and Pdgfra by OPCs purified from PD:ibot and control mice. Expression is shown in RPKM. N=3 mice per group. Significance is determined by DESeq2. Qk: 14.8±3.5 in ctrl and 11.5±1.6 in PD:ibot, p=0.5; Olig2: 185.2±38.4 in ctrl and 196.9±12.0 in PD:ibot, p=1.0; Pdgfra: 73.2±21.4 in ctrl and 87.9±12.4 in PD:ibot, p=0.9.
-
Figure 4—figure supplement 1—source data 1
It contains original data points for Figure 4—figure supplement 1A,B,C,D,E and F.
- https://cdn.elifesciences.org/articles/77441/elife-77441-fig4-figsupp1-data1-v2.xlsx
Figure 5 with 1 supplement
In vitro development defect of oligodendrocytes purified from PD:ibot mice.
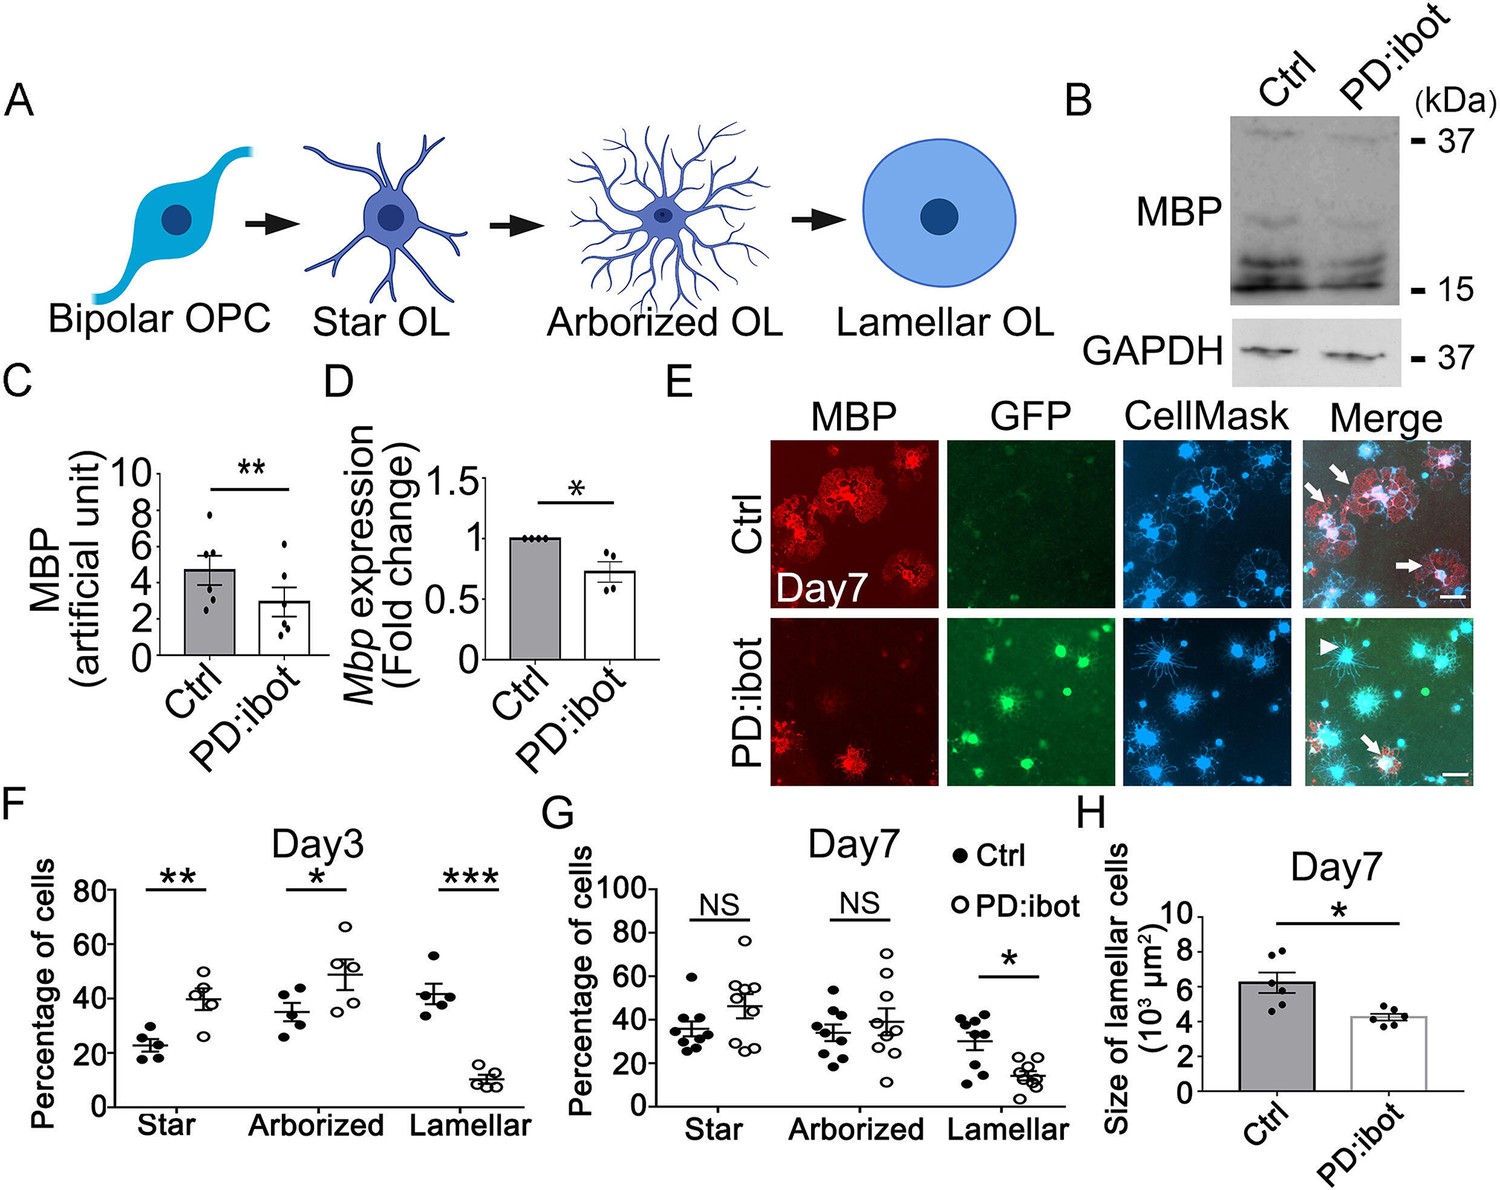
(A) A diagram of the morphological changes during oligodendrocyte differentiation in vitro. OPCs exhibit a bipolar morphology. Differentiating oligodendrocytes first grow multiple branches (star-shaped and arborized) and then develop myelin-like membrane extension and exhibit a lamellar morphology. (B) Western blot for MBP in oligodendrocyte cultures after 7 days of differentiation. (C) Quantification of MBP proteins from Western blot. N=6 mice per group. Paired two-tailed T-test. MBP intensity: 4.7±0.8 in control and 2.9±0.8 in PD:ibot, p=0.001. (D) Quantification of Mbp mRNAs based on qPCR. N=4 mice per group. Paired two-tailed T-test. Mbp relative expression: 1±0.0 in control and 0.7±0.08 in PD:ibot, p=0.05. (E) Oligodendrocyte cultures after 7 days of differentiation. Red, MBP. Green, ibot:GFP. Blue, CellMask, which labels all cells. Arrows point to examples of lamellar cells and an arrowhead points to an example of a star-shaped oligodendrocyte. Scale bars: 50 μm. (F–G) Quantification of the percentage of cells at the star-shaped, arborized, and lamellar stages after 3 (F) and 7 (G) days of differentiation. Filled circles, control. Open circles, PD:ibot. N=5 mice per group on day 3 and N=9 mice per group on day 7. Multiple T-test with two-stage set-up method of Benjamini, Krieger, and Yekutieli for multiple comparisons. Star stage at day 3 (%): 22.8±2.3 in control and 39.8±4.0 in PD:ibot, p=0.003; arborized stage at day 3 (%): 35.1±3.4 in control and 48.8±5.6 in PD:ibot, p=0.014; lamellar stage at day 3 (%): 41.7±3.7 in control and 10.3±1.7 in PD:ibot, p=0.3 × 10⁻⁵. Star stage at day 7 (%): 35.9±3.5 in control and 46.3±5.6 in PD:ibot, p=0.1; arborized stage at day 7 (%): 34.0±3.8 in control and 39.1±6.2 in PD:ibot, p=0.4; lamellar stage at day 7 (%): 30.1±4.0 in control and 14.2±2.1 in PD:ibot, p=0.01. (H) Quantification of the size of lamellar cells in oligodendrocyte cultures obtained from PD:ibot and littermate control mice after 7 days of differentiation. N=6 cultures from 4 mice per group. Paired two-tailed T-test. 6237±587.5 μm2 in control and 4253±193.7 μm2 in PD:ibot; p=0.016.
-
Figure 5—source data 1
It contains original data points for Figure 5C, D, G, F, G and H.
- https://cdn.elifesciences.org/articles/77441/elife-77441-fig5-data1-v2.xlsx
-
Figure 5—source data 2
It contains figures with the uncropped blots with the relevant bands clearly labelled (A) and original blot images (B and C).
- https://cdn.elifesciences.org/articles/77441/elife-77441-fig5-data2-v2.zip
Figure 5—figure supplement 1
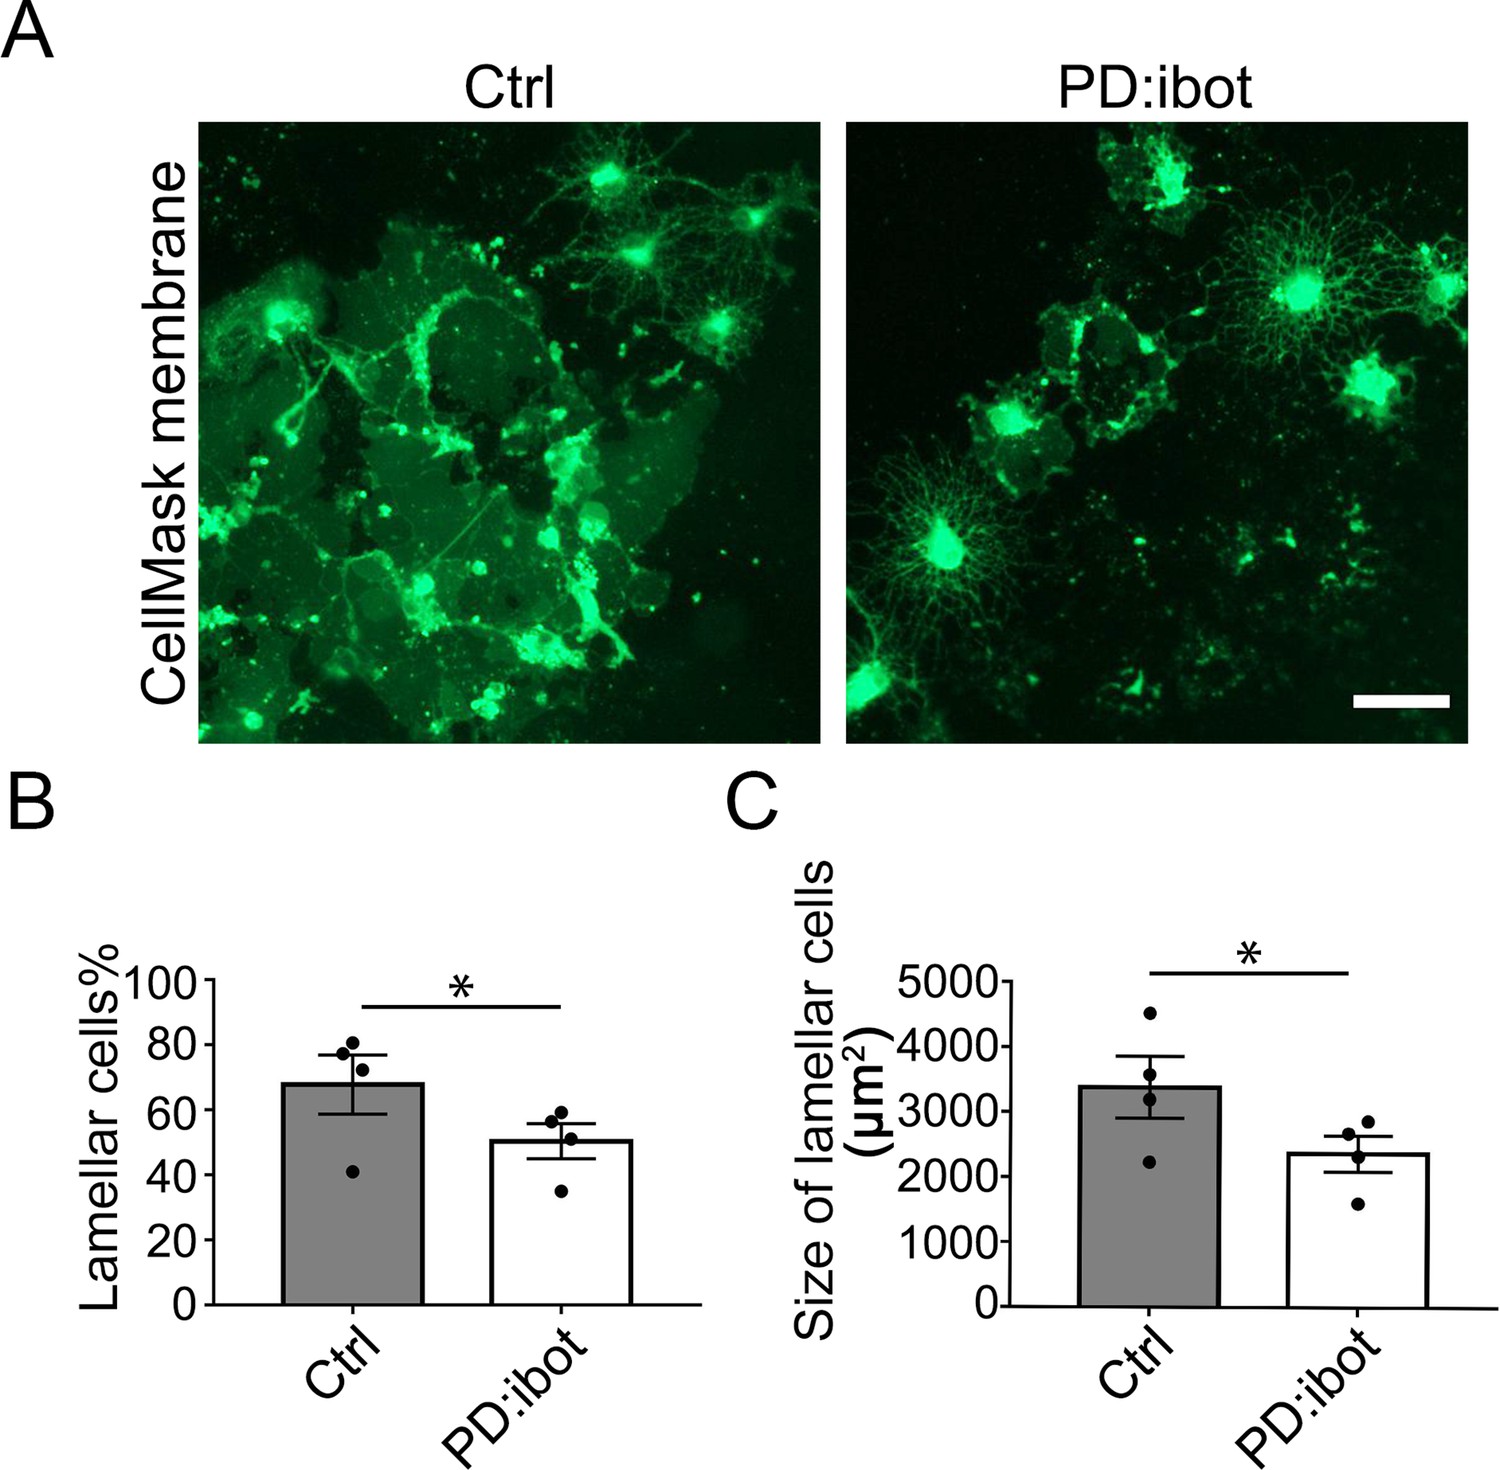
In vitro development defect of oligodendrocytes purified from PD:ibot mice (A) Oligodendrocyte cultures after 7 days of differentiation.
Green: Membrane version of CellMask, which labels membranes of all cells. Blue: DAPI. Scale bars: 50 μm. (B) Quantification of percentage of cells with lamellar morphology. N=4 mice per group. Paired two-tailed T-test. Lamellar cell percentage: 67.8±9.1 in control and 50.4±5.4 in PD:ibot; p=0.035. (C) Quantification of the size of cells with lamellar morphology. N=4 mice per group. Paired two-tailed T-test. 3384±475.2 μm2 in control and 2370±279.6 μm2 in PD:ibot; p=0.02.
-
Figure 5—figure supplement 1—source data 1
It contains original data points for Figure 5—figure supplement 1B and C.
- https://cdn.elifesciences.org/articles/77441/elife-77441-fig5-figsupp1-data1-v2.xlsx
Figure 6 with 1 supplement
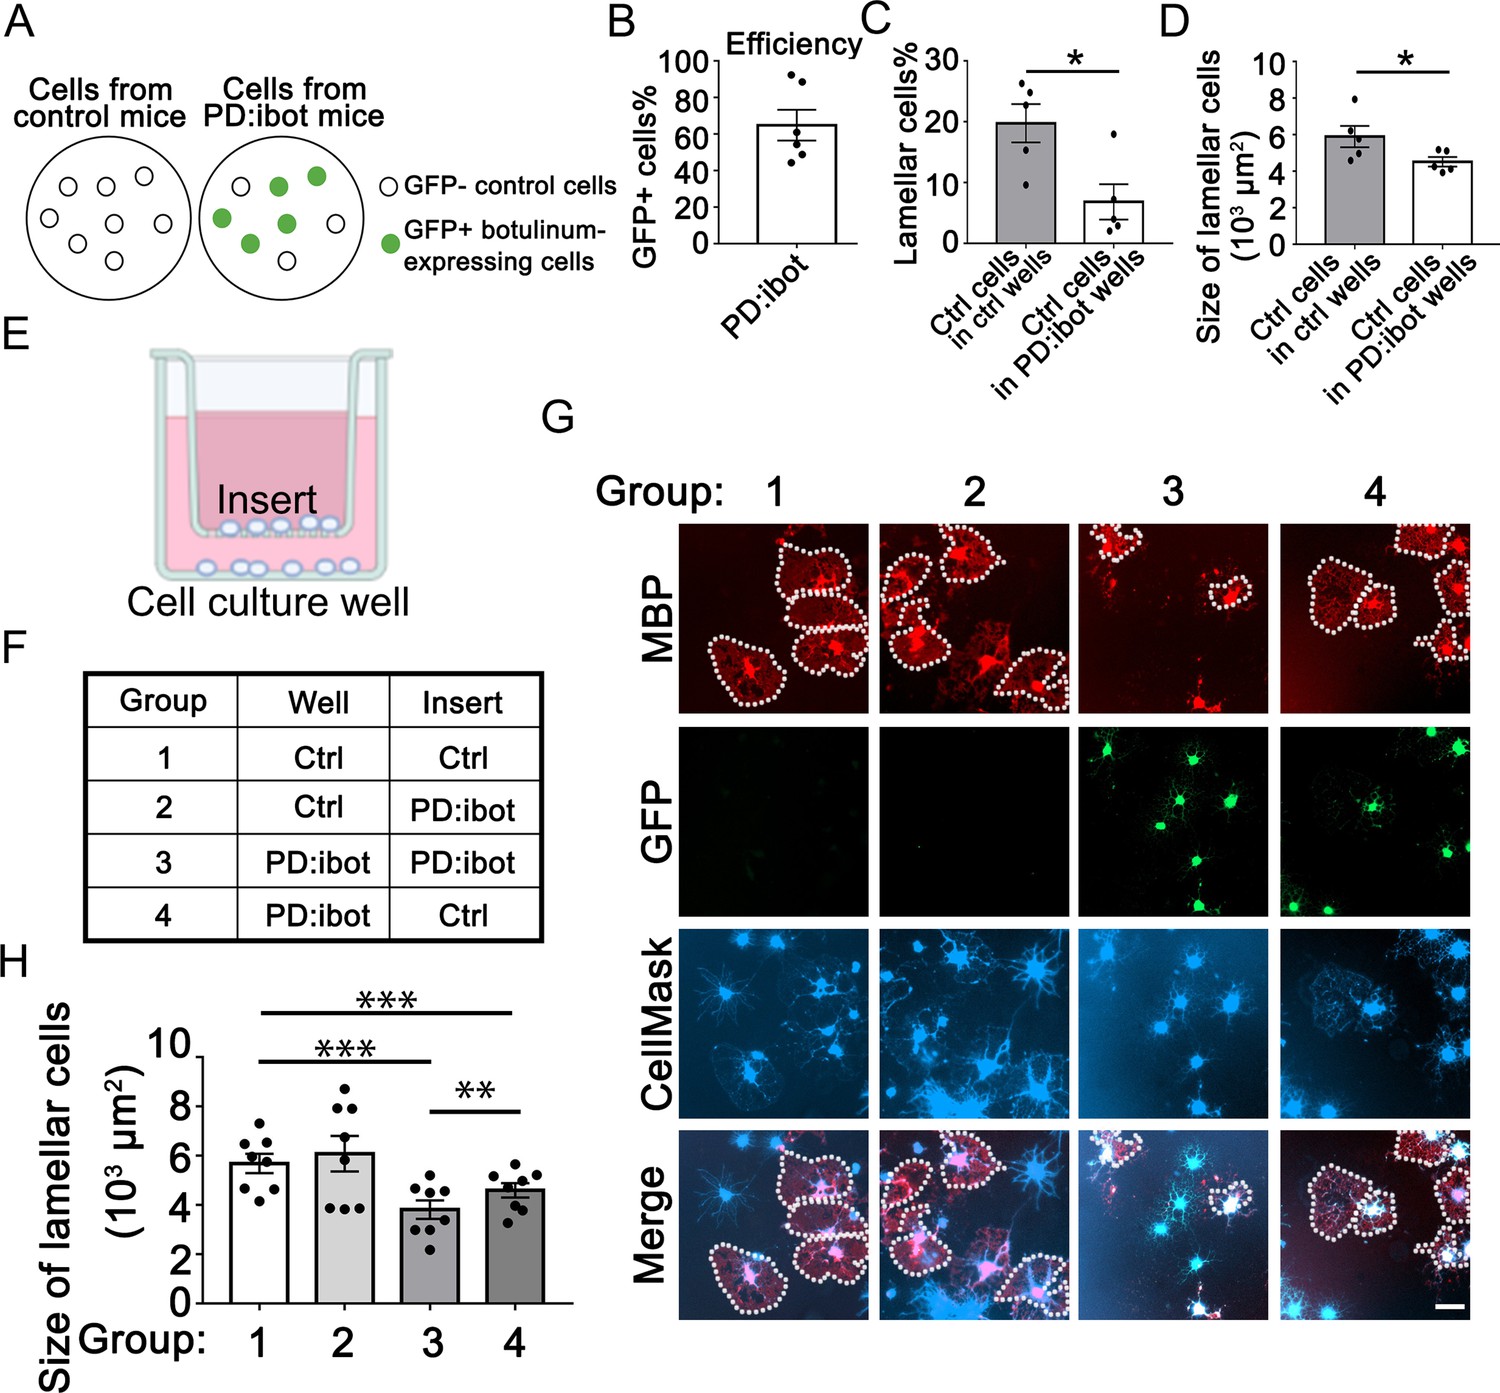
Cell non-autonomous effect of botulinum toxin-B in oligodendrocyte development in vitro.
(A) A diagram of GFP– control cells and GFP +botulinum-expressing cells in control culture and PD:ibot culture. (B) Quantification of the percentage of GFP + cells in PD:ibot cultures. N=6 mice. (C) Quantification of the percentage of lamellar cells after 7 days of differentiation. N=5 mice per group. Paired two-tailed T-test. Lamellar cell percentage (%): 19.76±3.16 in control and 6.82±2.92 in PD:ibot; p=0.023. (D) Quantification of the size of lamellar cells after 7 days of differentiation. N=5 mice per group. Paired two-tailed T-test. 5897±585.4 μm2 in control and 4520±261.6 μm2 in PD:ibot; p=0.027. (E) A diagram of the cocultures of cells separated by a porous insert with 1 μm pore size. (F) The genotype of cells on the inserts and wells in each group. The differentiation of the cells on the bottom of the wells was examined. (G) Oligodendrocyte cultures after 7 days of differentiation. Red, MBP. Green, ibot:GFP. Blue, CellMask, which labels all cells. Dotted lines delineate examples of lamellar cells. Scale bars: 50 μm. (H) Quantification of the size of lamellar cells. N=8 cultures from 5 mice per condition. Both GFP+ and GFP– cells were included in the quantification. One-way ANOVA with Benjamini, Krieger, and Yekutieli’s two-stage linear step-up FDR procedure for multiple comparisons. Every group was compared with every other group. Group 3 vs. group 4: p=0.0010. Group 1 vs. group 3: p=<0.0001. Group 2 vs. group 3: p=0.0006. Group 1 vs. group 4: p=0.0006. Group 2 vs. group 4: p=0.0055. Group 1 vs. group 2: p=0.064. Size of lamellar cells: group 1: 5691±391 μm2; group 2: 6087±720.7 μm2; group 3: 3810±376 μm2; group 4: 4594±293.3 μm2.
-
Figure 6—source data 1
It contains original data points for Figure 6B, C, D and H.
- https://cdn.elifesciences.org/articles/77441/elife-77441-fig6-data1-v2.xlsx
-
Figure 6—source data 2
It contains raw data for table in Figure 6F.
- https://cdn.elifesciences.org/articles/77441/elife-77441-fig6-data2-v2.xlsx
Figure 6—figure supplement 1
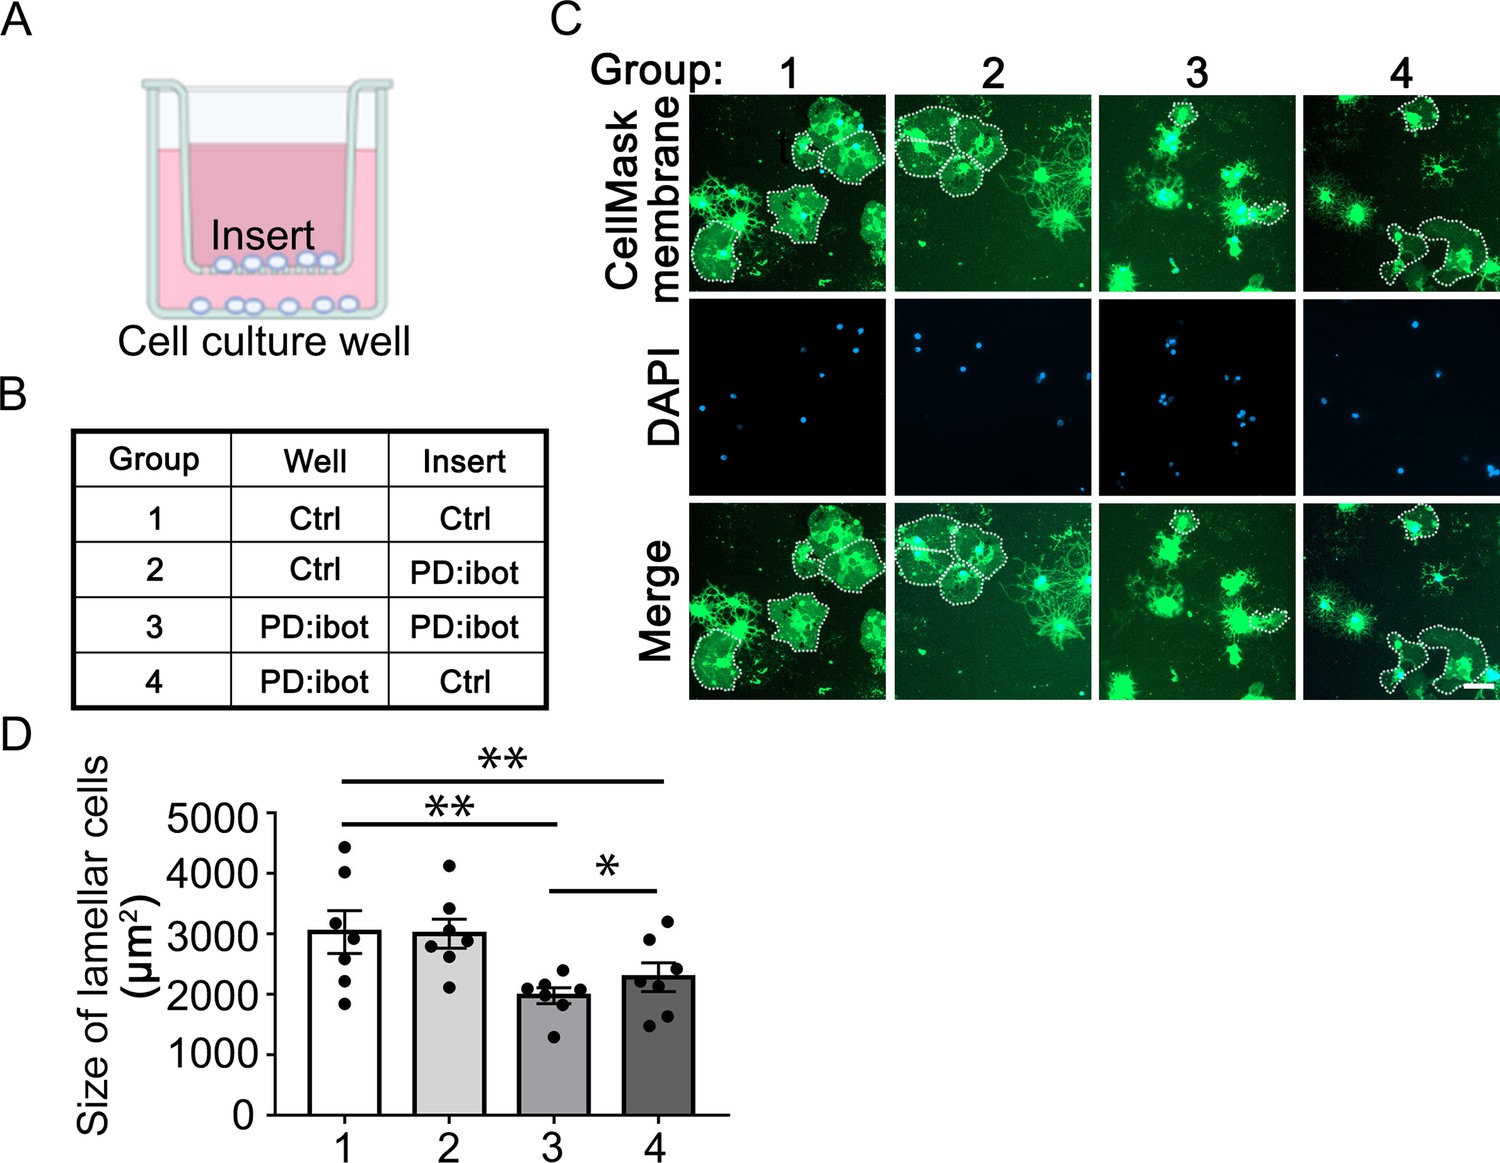
Cell non-autonomous effect of botulinum toxin-B in oligodendrocyte development in vitro (A) A diagram of the cocultures of cells separated by a porous insert with 1 μm pore size.
(B) The genotype of cells on the inserts and wells in each group. The differentiation of the cells on the bottom of the wells was examined. (C) Oligodendrocyte cultures after 7 days of differentiation. Green: Membrane version of CellMask, which labels the membranes of all cells. Blue: DAPI. Scale bars: 50 μm. (D) Quantification of the size of lamellar cells. N=7 mice per condition. One-way ANOVA with Benjamini, Krieger, and Yekutieli’s two-stage linear step-up FDR procedure for multiple comparisons. Every group was compared with every other group. Group 3 vs. group 4: p=0.042. Group 1 vs. group 3: p=0.0032. Group 2 vs. group 3: p=0.0010. Group 1 vs. group 4: p=0.0017. Group 2 vs. group 4: p=0.0017. Group 1 vs. group 2: p=0.31. Size of lamellar cells: group 1: 3030±353.9 μm2; group 2: 3004±240.9 μm2; group 3: 1977±131.4 μm2; group 4: 2285±236.1 μm2.
-
Figure 6—figure supplement 1—source data 1
It contains original data points for Figure 6—figure supplement 1D.
- https://cdn.elifesciences.org/articles/77441/elife-77441-fig6-figsupp1-data1-v2.xlsx
-
Figure 6—figure supplement 1—source data 2
It contains raw data for table in Figure 6—figure supplement 1B.
- https://cdn.elifesciences.org/articles/77441/elife-77441-fig6-figsupp1-data2-v2.xlsx
Figure 7 with 2 supplements
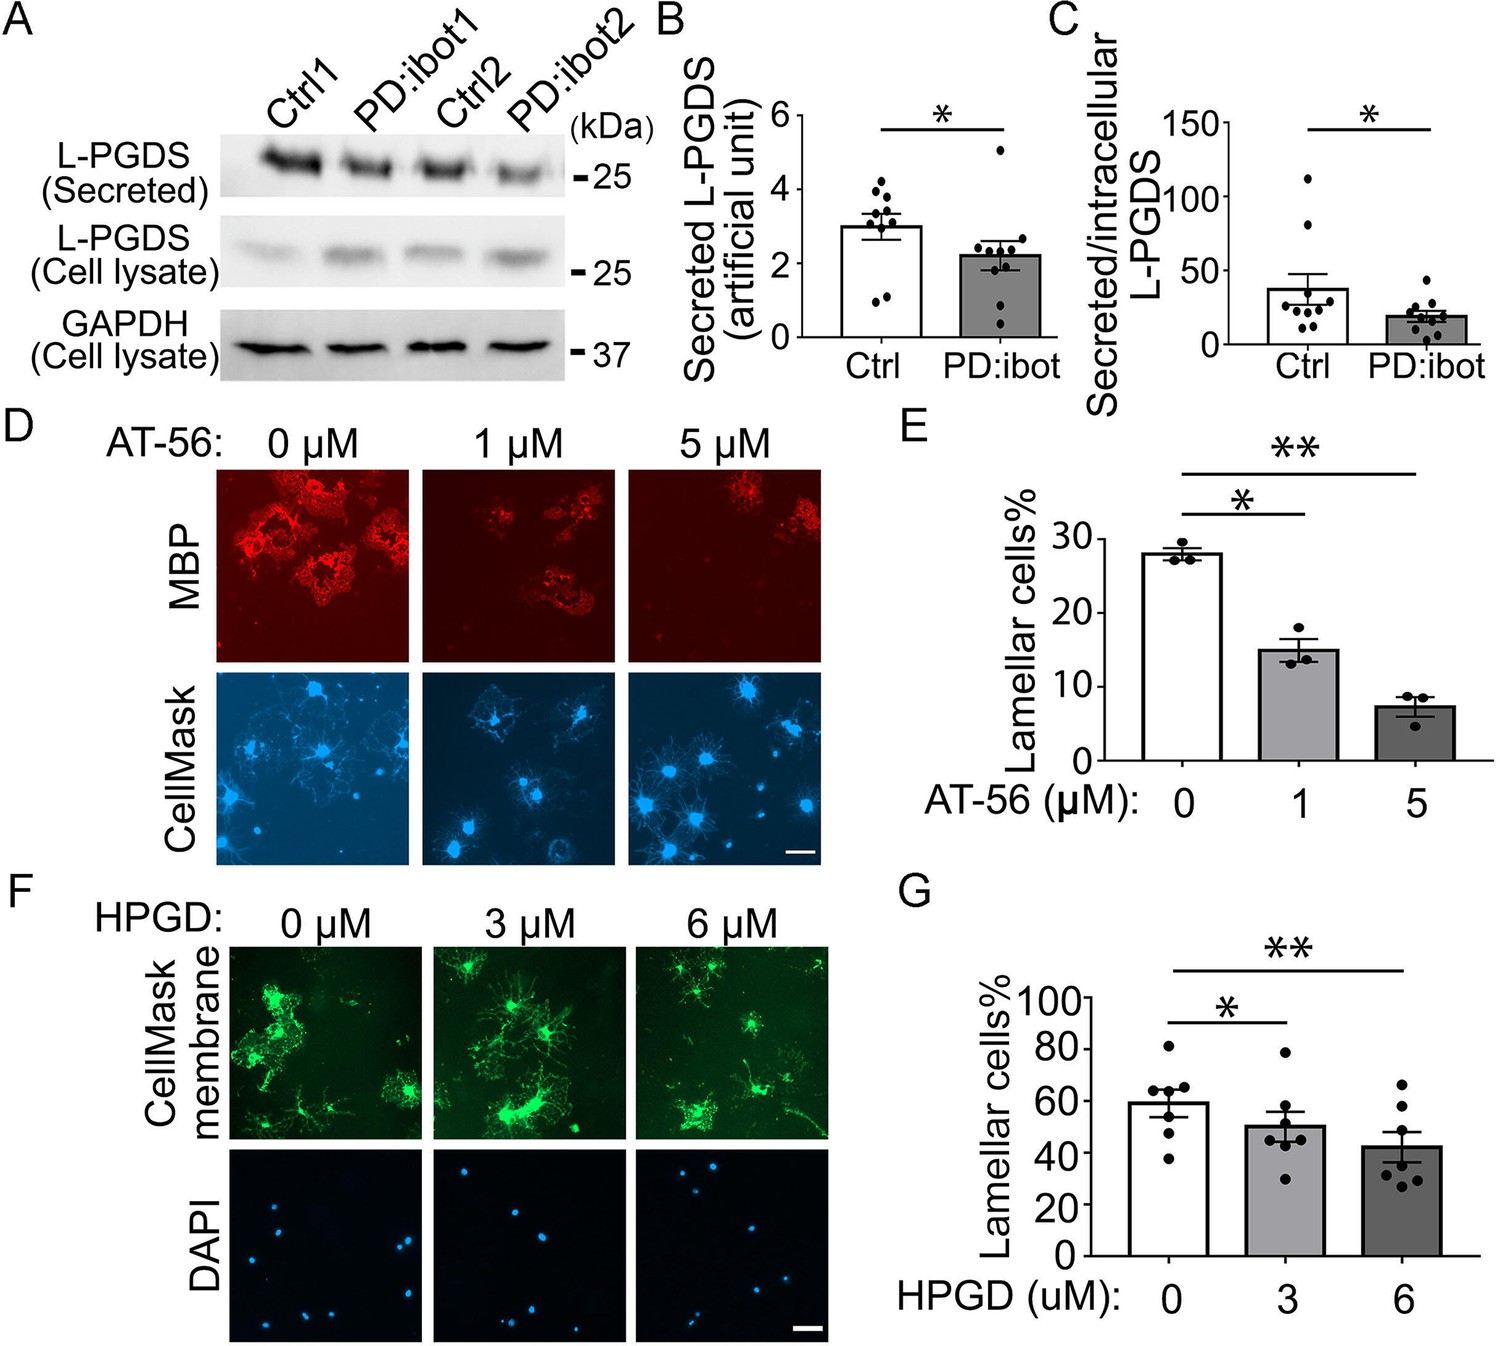
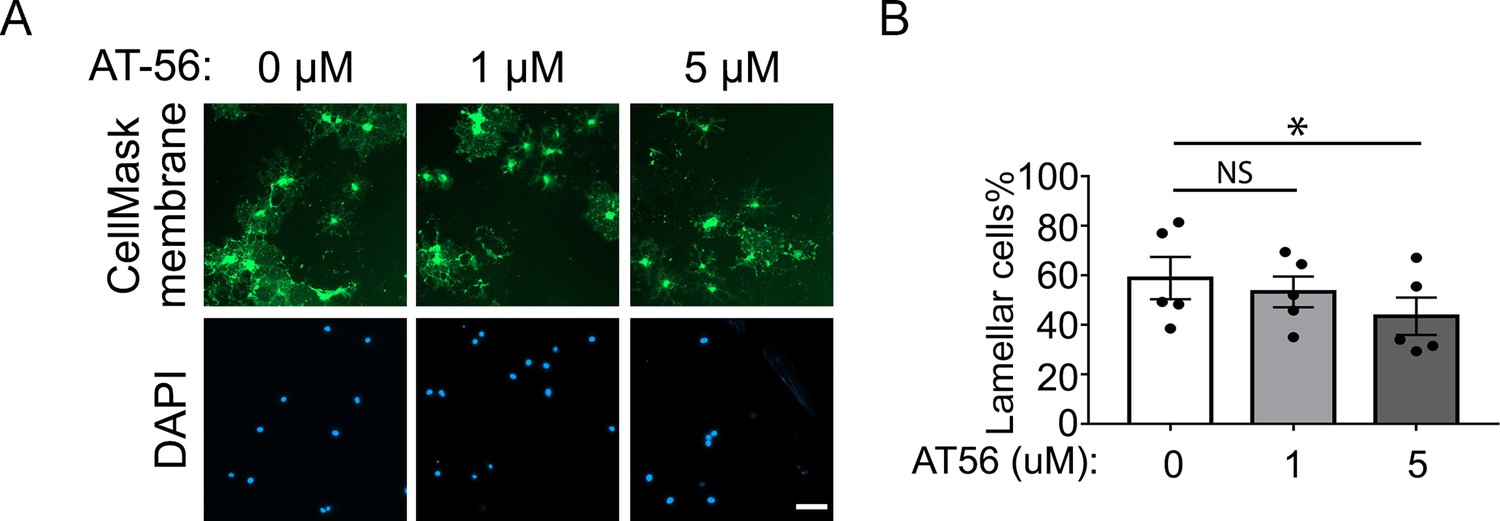
The effect of the L-PGDS inhibitor, AT-56, and HPGD, which inactivates PGD2, on oligodendrocyte development in vitro.
(A) Immunoblot of secreted and intracellular L-PGDS protein from oligodendrocyte cultures from PD:ibot and littermate control mice. (B) Quantification of the immunoblot signal intensity of secreted L-PGDS. N=10 mice per group. Paired two-tailed T-test. Secreted L-PGDS intensity: 3.0±0.4 in control and 2.2±0.4 in PD:ibot, p=0.0104. (C) Quantification of the ratio of secreted and intracellular L-PGDS. N=10 mice per group. Paired two-tailed T-test. Ratio of secreted and intracellular L-PGDS: 37.2±10.4 in control and 18.9±3.7 in PD:ibot, p=0.05. (D) Oligodendrocyte cultures from wild-type mice after 7 days of differentiation in the presence and absence of the L-PGDS inhibitor AT-56. Red: MBP immunofluorescence. Blue: CellMask, which labels all cells. Scale bars: 50 μm. (E) Quantification of cells with lamellar morphology. One-way ANOVA with Benjamini, Krieger, and Yekutieli’s two-stage linear step-up FDR procedure for multiple comparisons. N=3 cultures from 3 mice per group. Lamellar cells%: DMSO control: 28±0.8; 1 μM AT-56: 15±1.6, p=0.024; 5 μM AT-56: 7.3±1.3, p=0.0068. (F) Oligodendrocyte cultures from wild-type mice after 7 days of differentiation in the presence and absence of HPGD. Green: Membrane version of CellMask, which labels the membranes of all cells. Blue: DAPI. Scale bars: 50 μm. (G) Quantification of cells with lamellar morphology. One-way ANOVA with Benjamini, Krieger, and Yekutieli’s two-stage linear step-up FDR procedure for multiple comparisons. N=7 cultures from 6 mice per group. Lamellar cells%: 0 μM HPGD: 59.10±5.33; 3 μM HPGD: 50.09±5.80, p=0.034; 6 μM HPGD: 42.20±5.87, p=0.0090.
-
Figure 7—source data 1
It contains original data points for Figure 7B, C, E and G.
- https://cdn.elifesciences.org/articles/77441/elife-77441-fig7-data1-v2.xlsx
-
Figure 7—source data 2
It contains figures with the uncropped blots with the relevant bands clearly labelled (A) and original blot images (B and C).
- https://cdn.elifesciences.org/articles/77441/elife-77441-fig7-data2-v2.zip
Figure 7—figure supplement 1
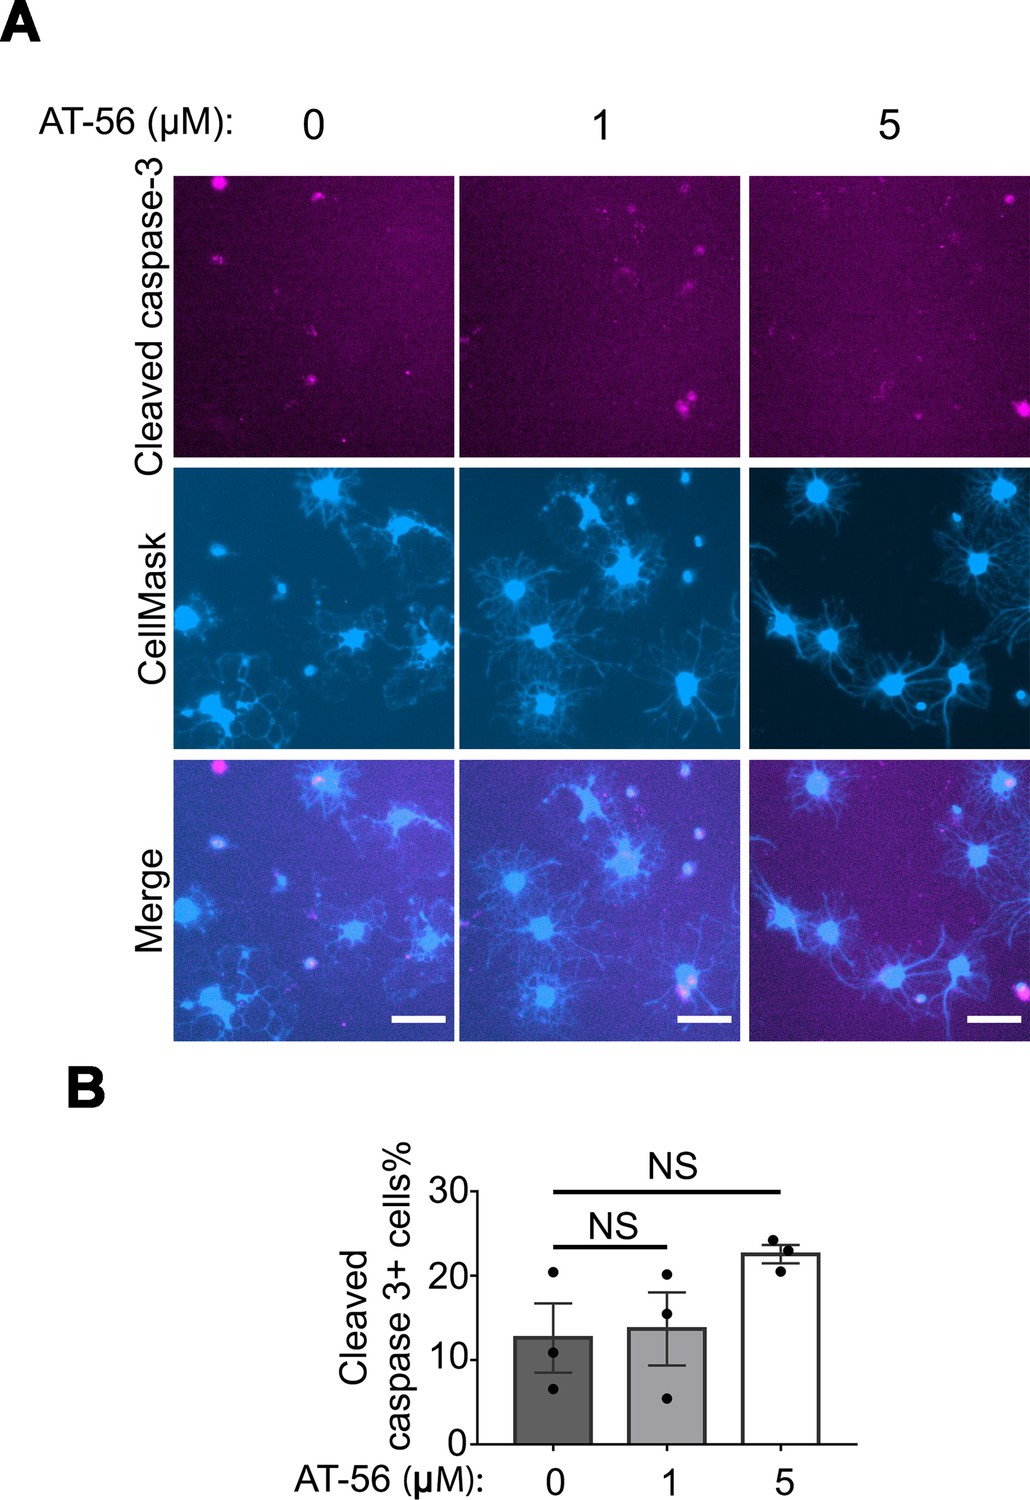
No change in the percentage of apoptotic cells in AT-56 treatment.
(A) Oligodendrocyte culture from wildtype mice after 7 days of differentiation in the presence and absence of the LPGDS inhibitor AT-56. Magenta: cleaved caspase 3. Blue: CellMask, which labels all cells. Scale bars: 40 μm. (B) Quantification of cleaved caspase3+ cells. One-way ANOVA with Benjamini, Krieger, and Yekutieli’s two-stage linear step-up FDR procedure for multiple comparisons. N=3 cultures from 3 mice per group. Every group was compared with 0 μM AT-56 group. Cleaved caspase3+ cells percentage: 12.6 ± 4.1% in 0 μM AT-56 group, 13.7 ± 4.3% in 1 μM AT-56 group, p=1.0, 22.6 ± 1.1% in 5 μM AT-56 group, p=0.2.
-
Figure 7—figure supplement 1—source data 1
It contains original data points for Figure 7—figure supplement 1B.
- https://cdn.elifesciences.org/articles/77441/elife-77441-fig7-figsupp1-data1-v2.xlsx
Figure 7—figure supplement 2
AT-56 inhibit oligodendrocytes development in vitro.
(A) Oligodendrocyte cultures after 7 days of differentiation. Green: Membrane-staining version of CellMask, which labels the membranes of all cells. Blue: DAPI. Scale bars: 50 μm. (B) Quantification of the percentage of cells with lamellar morphology. N=5 mice per group. One-way ANOVA with Benjamini, Krieger, and Yekutieli’s two-stage linear step-up FDR procedure for multiple comparisons. Every group was compared with DMSO control. Lamellar cell percentage: 58.9±8.5 in DMSO control; 53.3±6.2 in 1 μM AT-56, p=0.07; 43.5±7.5 in 5 μM AT-56, p=0.01.
-
Figure 7—figure supplement 2—source data 1
It contains original data points for Figure 7—figure supplement 2B.
- https://cdn.elifesciences.org/articles/77441/elife-77441-fig7-figsupp2-data1-v2.xlsx
Figure 8
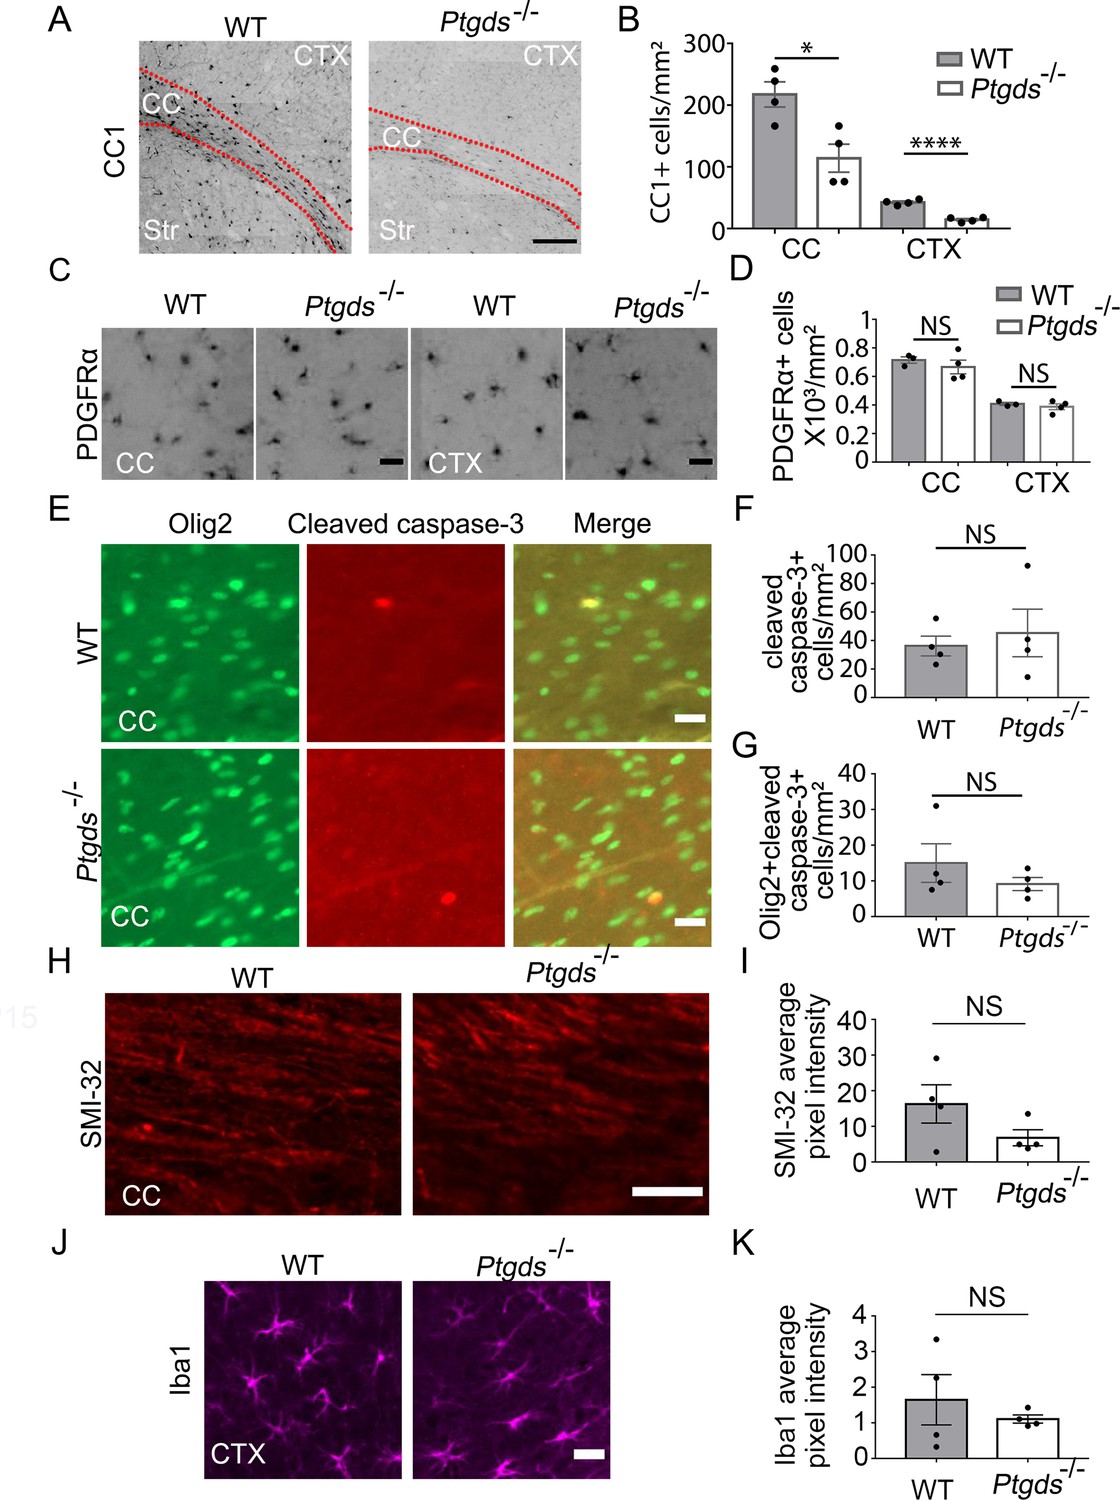
Oligodendrocyte defect in L-PGDS-knockout mice.
(A) CC1 immunofluorescence at P9. The dashed lines delineate the corpus callosum (CC). Ctx, cortex. Str, striatum. Scale bar: 200 μm. (B) Quantification of the density of CC1+ cells. N=4 mice per genotype. Corpus callosum: 217.6±20.3 /mm2 in control, 114±22.8 in knockout, p=0.015; cerebral cortex: 42.5±2.2 in control, 14.3±2.0 in knockout, p=0.0001. Unpaired two-tailed T-test in all quantifications in this figure. (C) PDGFRα immunofluorescence at P9 in the corpus callosum and the cerebral cortex. Scale bar: 20 μm. (D) Quantification of the density of PDGFRα+ cells. Corpus callosum: 715.3±22.7 in control, 667±48.0 in knockout, p=0.46; cerebral cortex: 406.2±10.3 in control, 388.3±20.8 in knockout, p=0.48. (E) Cleaved caspase-3 immunofluorescence in L-PGDS-knockout and littermate control mice. Scale bar: 20 μm. (F) Quantification of the density of cleaved caspase-3+ cells in the corpus callosum. 36.2±6.9 in control, 45.3±16.7 in knockout, p=0.63. (G) Quantification of the density of cleaved caspase-3+ oligodendrocyte-lineage cells in corpus callosum. 15.0±5.4 in control, 9.1±1.8 in knockout, p=0.34. (H) SMI-32 immunofluorescence at P9 in the corpus callosum. Scale bar: 50 μm. (I) Quantification of the average pixel intensity of SMI-32 in the corpus callosum. Unpaired two-tailed T-test. N=4 mice per genotype. 16.3±5.4 in control, 6.8±2.3 in knockout, p=0.16. (J) Iba1 immunofluorescence at P9 in the cortex. Scale bar: 20 μm. (K) Quantification of the average pixel intensity of Iba1 in the cortex. Unpaired two-tailed T-test. N=4 mice per genotype. 1.6±0.71 in control, 1.1±0.12 in knockout, p=0.48.
-
Figure 8—source data 1
It contains original data points for Figure 8B, D, F, G, I and K.
- https://cdn.elifesciences.org/articles/77441/elife-77441-fig8-data1-v2.xlsx
Figure 9
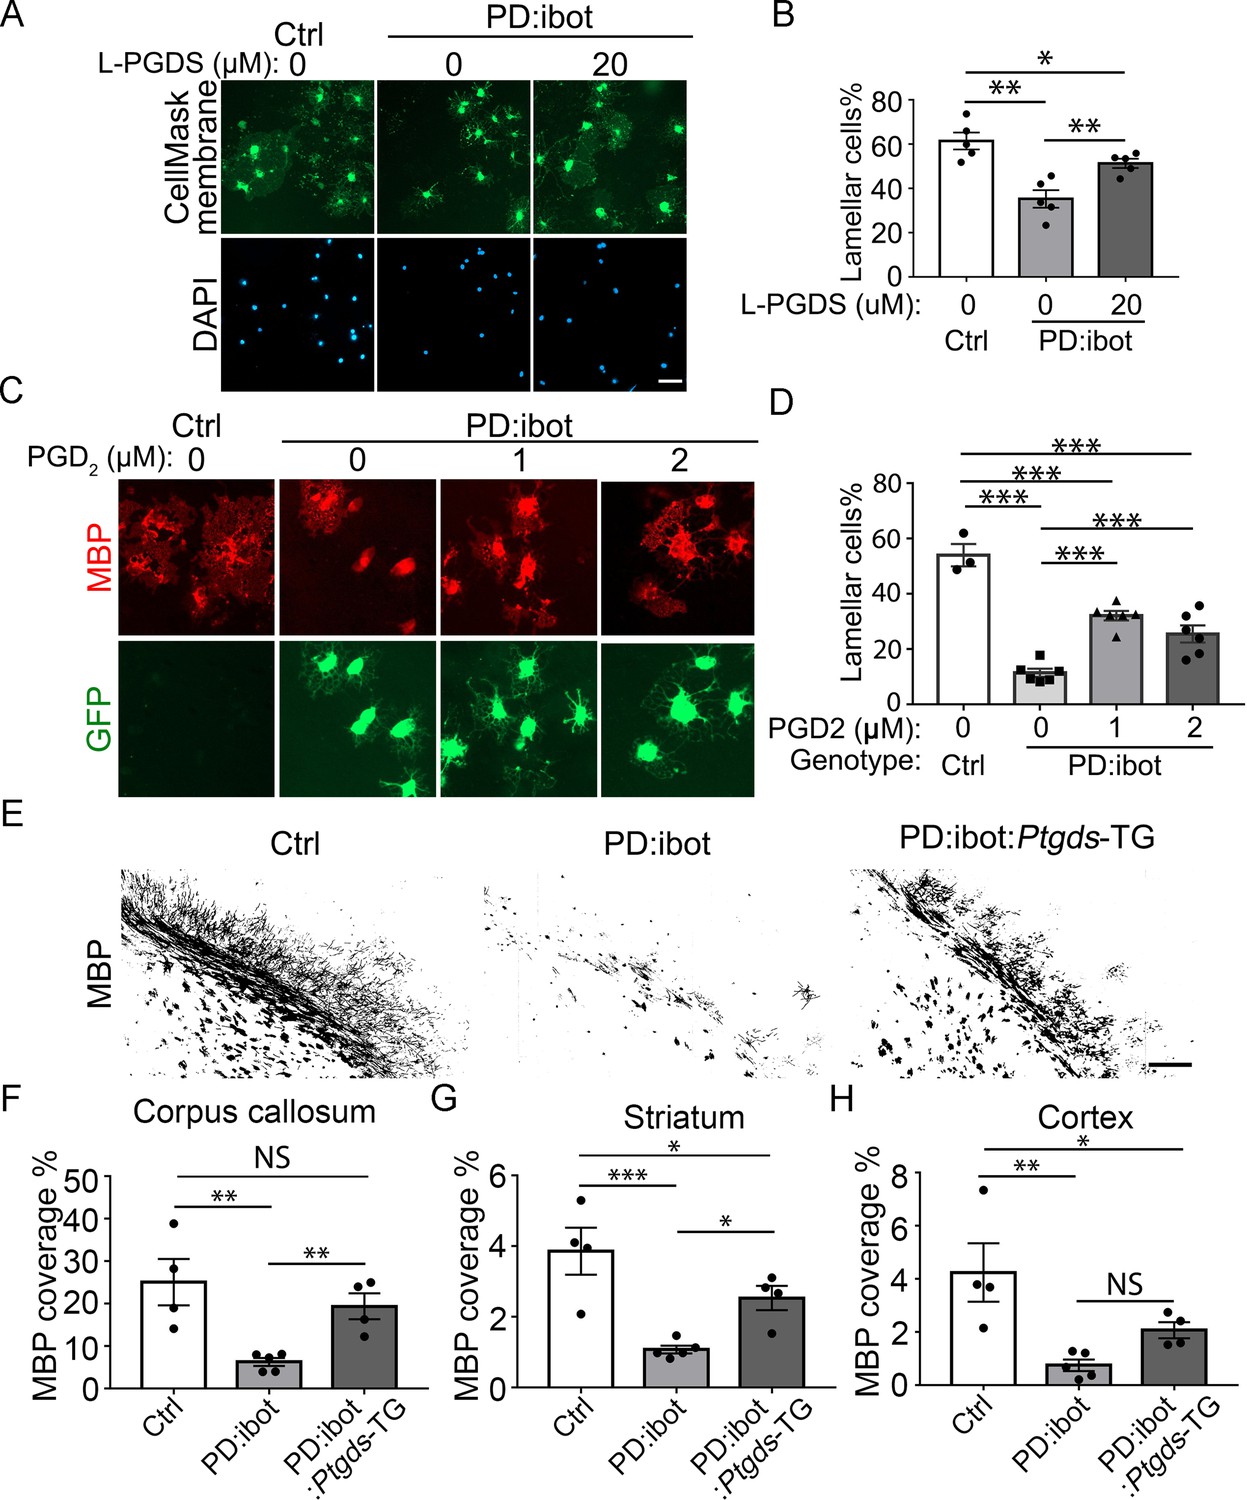
Rescue of oligodendrocyte deficit in PD:ibot by L-PGDS protein, PGD2 in vitro, and myelination deficit in PD:ibot by L-PGDS overexpressing transgenic mice.
(A) Oligodendrocyte cultures from wild-type mice after 7 days of differentiation in the presence and absence of L-PGDS protein. Green: Membrane-staining version of CellMask, which labels the membranes of all cells. Blue: DAPI. Scale bars: 50 μm. (B) Quantification of cells with lamellar morphology. One-way ANOVA with Benjamini, Krieger, and Yekutieli’s two-stage linear step-up FDR procedure for multiple comparisons. Every group was compared with every other group. N=5 cultures from 4 mice per group. Control vs. PD:ibot, L-PGDS 0 μM: p=0.0082; PD:ibot, L-PGDS 0 μM vs. PD:ibot, L-PGDS 20 μM: p=0.0082; control vs. PD:ibot, L-PGDS 20 μM: p=0.049. Lamellar cells%: Control: 61.5±3.9; PD:ibot, 0 μM L-PGDS: 35.3±4.0; PD:ibot, 20 μM L-PGDS: 51.3±2.1. (C) Partial rescue of oligodendrocyte differentiation by PGD2. Oligodendrocytes from PD:ibot and control mice in culture after 7 days of differentiation. Red: MBP immunofluorescence. Green: ibot-GFP, only present in cells from PD:ibot mice. Scale bars: 50 μm. (D) Quantification of the percentage of lamellar cells. One-way ANOVA with Benjamini, Krieger, and Yekutieli’s two-stage linear step-up FDR procedure for multiple comparisons. Every group was compared with every other group. For control, N=3 cultures from 3 mice per group. For all others, N=6 cultures from 6 mice per group. wild type control vs. PD:ibot +DMSO: p=<0.0001; PD:ibot +DMSO vs. PD:ibot, PGD2 1 μM: p=<0.0001; PD:ibot +DMSO vs. PD:ibot, PGD2 2 μM: p=0.0001; wild type control vs. PD:ibot, PGD2 1 μM: p=<0.0001; wild type control vs. PD:ibot, PGD2 2 μM: p=<0.0001; PD:ibot, PGD2 1 μM vs. PD:ibot, PGD2 2 μM: p=0.01. Lamellar cells%: wild type control: 54.0±4.0, PD:ibot +DMSO; 11.4±1.5; PD:ibot +1 μM PGD2: 32.1±1.7, PD:ibot +2 μM PGD2: 25.5±3.1. (E) MBP immunofluorescence at P9 in control, PD:ibot, and PD:ibot:Ptgds-TG brains. Scale bar: 200 μm. (F–H) Quantification of MBP+ area in the the corpus callosum (F), striatum (G), and cortex (H) at P9. All control mice are ibot only. One-way ANOVA with Benjamini, Krieger, and Yekutieli’s two-stage linear step-up FDR procedure for multiple comparisons. Every group was compared with every other group. For control and PD:ibot:Ptgds-TG, N=4 mice per group; For PD:ibot, N=5 mice per group. In corpus callosum, control vs. PD:ibot: p=0.0026; control vs. PD:ibot:Ptgds-TG, p=0.097; PD:ibot vs. PD:ibot:Ptgds-TG, p=0.0099. In striatum, control vs. PD:ibot: p=0.0006; control vs. PD:ibot:Ptgds-TG, p=0.017; PD:ibot vs. PD:ibot:Ptgds-TG, p=0.014. In cortex, control vs. PD:ibot: p=0.0049; control vs. PD:ibot:Ptgds-TG, p=0.040; PD:ibot vs. PD:ibot:Ptgds-TG, p=0.11. MBP coverage in the corpus callosum (%): 25.1±5.5 in control, 6.3±0.9 in PD:ibot, and 19.4±3.1 in PD:ibot:Ptgds-TG; MBP coverage in the striatum (%): 3.9±0.7 in control, 1.1±0.11 in PD:ibot, and 2.5±0.35 in PD:ibot:Ptgds-TG. MBP coverage in the cortex (%): 4.2±1.1 in control, 0.75±0.22 in PD:ibot, and 2.07±0.30 in PD:ibot:Ptgds-TG.
-
Figure 9—source data 1
It contains original data points for Figure 9B, D, F, G and H.
- https://cdn.elifesciences.org/articles/77441/elife-77441-fig9-data1-v2.xlsx
Tables
Appendix 1—key resources table
| Reagent type (species) or resource | Designation | Source or reference | Identifiers | Additional information |
|---|---|---|---|---|
| Strain, strain background (C57BL/6 x SJL) | Pdgfra-CreER | Jackson Laboratories | Cat#: 018280 | |
| Strain, strain background (FVB/N) | ibot | Jackson Laboratories | Cat# 018056 | |
| Strain, strain background (BALB/c x C57BL/6 NHsd) | Gfap-Cre | Jackson Laboratories | #024098 | |
| Strain, strain background (C3H x C57BL/6) | Tek-Cre | Jackson Laboratories | #004128 | |
| Strain, strain background (C57BL/6) | Ptgds–/– | Urade and Hayaishi, 2000 | originally from Urade, cryopreserved by Garret FitzGerald | |
| Strain, strain background (FVB/N) | Human Ptgds-TG mice | Pinzar et al., 2000 | originally from Urade, cryopreserved by JCRB Laboratory Animal Resource Bank | |
| Antibody | Anti-GFP antibody, host (chicken), Polyclonal | Aves Labs | Cat #GFP-1020; RRID: AB_10000240 | IHC: 1:500 ICC: 1:1000 |
| Antibody | Anti-PDGFRα antibody, host (goat), Polyclonal IgG | R&D Systems | Cat# AF1062; RRID: AB_2236897 | IHC: 1:500 |
| Antibody | Anti-Olig2 antibody, host (mouse), monoclonal IgG | Millipore | Cat# MABN50; RRID: AB_10807410 | IHC: 1:500 |
| Antibody | Anti-APC (Ab-7) (CC-1) antibody, host (mouse), monoclonal IgG | Millipore | Cat# OP80; RRID: AB_2057371 | IHC: 1:500 |
| Antibody | Anti-Myelin Basic Protein Antibody, host (rat), monoclonal | Abcam | Cat# ab7349; RRID: AB_305869 | IHC: 1:500 ICC: 1:1000 WB: 1:1000 |
| Antibody | Anti-cleaved caspase-3 (Asp175) Antibody, host (rabbit), polyclonal | Cell Signaling Technology | Cat# 9661; RRID: AB_2341188 | IHC: 1:500 ICC: 1:1000 |
| Antibody | Anti-Ki-67 Antibody (SP6), Antibody, host (rabbit), monoclonal | Thermo Fisher Scientific | Cat# MA5-14520; RRID: AB_10979488 | IHC: 1:500 |
| Antibody | Anti-C. botulinum BoNT-B Light Chain Antibody, host (sheep), polyclonal | R&D Systems | Cat# AF5420; RRID: AB_2044644 | IHC: 1:500 WB: 1:1000 |
| Antibody | Anti-PGD2 synthase Antibody (F-7), host (mouse), monoclonal IgG | Santa Cruz Biotechnology | Cat# sc-390717; RRID: AB_2800545 | IHC: 1:500 WB: 1:1000 |
| Antibody | Anti- GADPH antibody, host (mouse), monoclonal IgG | Millipore | Cat# CB1001; RRID: AB_2107426 | WB: 1:1000 |
| Antibody | Anti-CD45 antibody, host (rat), monoclonal IgG | BD Pharmingen | Cat#550539; RRID: AB_2174426 | Panning: 1.25 µg/ml |
| Antibody | Anti-HepaCAM antibody, host (mouse), monoclonal IgG | R&D Systems | Cat# MAB4108; RRID: AB_2117687 | Panning: 1 µg/ml |
| Antibody | Anti-VAMP3 antibody, host (rabbit), polyclonal | Novus Biological | Cat # NB300-510-0.025mg | WB: 1:1000 |
| Antibody | Anti-VAMP2 antibody, host (mouse), monoclonal IgG | Synaptic Systems | Cat #104 211; RRID: AB_887811 | ICC: 1:100 WB: 1:1000 |
| Antibody | Anti-VAMP3 antibody, host (rabbit), polyclonal | Synaptic Systems | Cat #104 103; RRID: AB_887812 | ICC: 1:500 |
| Antibody | Anti-Iba1 antibody, host (rabbit) | FUJIFILM Wako | Cat# 019–19741; RRID: AB_839504 | IHC: 1:1000 |
| Antibody | Anti-SMI-32 antibody, host (mouse), monoclonal | BioLegend | Cat# 801702; RRID: AB_2715852 | IHC: 1:500 |
| Chemical compound, drug | AT-56 | Cayman Chemicals | Cat#13160; CAS: 162640-98-4 | See Materials and Methods, Section “Drug and treatment”. |
| Chemical compound, drug | Prostaglandin D2 | Cayman Chemicals | Cat# 12010; CAS: 41598-07-6 | See Materials and Methods, Section “Drug and treatment”. |
| Chemical compound, drug | Thyroid hormone | Sigma | Cat #T6397-100MG | 40 ng/ml for induction of OPC differentiation |
| Chemical compound, drug | 4-hydroxy-tamoxifen | Sigma | H7904-25mg | See Materials and Methods, Section “Drug and treatment”. |
| Peptide, recombinant protein | PDGF | Peprotech | Cat #100–13 A | See Materials and Methods, Section “OPC purification and culture”. |
| Peptide, recombinant protein | CNTF | Peprotech | Cat #450–13 | See Materials and Methods, Section “OPC purification and culture”. |
| Peptide, recombinant protein | NT-3 | Peprotech | Cat #450–03 | See Materials and Methods, Section “OPC purification and culture”. |
| Peptide, recombinant protein | HPGD protein | R&D system | Cat#5660-DH-010 | See Materials and Methods, Section “Drug and treatment”. |
| Peptide, recombinant protein | L-PGDS protein | Cayman Chemicals | Cat#10006788 | See Materials and Methods, Section “Drug and treatment”. |
| Software, algorithm | ImageJ | Schneider et al., 2012 | https://imagej.nih.gov/ij/ | |
| Software, algorithm | Prism 8 | Graphpad | https://www.graphpad.com/scientific-software/prism/ | |
| Software, algorithm | Photoshop | Adobe | https://www.adobe.com/products/photoshop/free-trial-download.html | |
| Software, algorithm | STAR package | Dobin et al., 2013 | https://github.com/alexdobin/STAR | |
| Software, algorithm | HTSEQ | Anders et al., 2015 | https://htseq.readthedocs.io/en/release_0.11.1/count.html | |
| Software, algorithm | EdgeR-Limma-Voom | Law et al., 2016 | http://bioconductor.org/packages/release/workflows/html/RNAseq123.html | |
| Software, algorithm | DESeq2 | Love et al., 2014 | http://bioconductor.org/packages/release/bioc/vignettes/DESeq2/inst/doc/DESeq2.html | |
| Sequence-based reagent | Mbp_F | This paper | PCR primers | 5’-TCACAGCGATCC AAGTACCTG-3’ |
| Sequence-based reagent | Mbp_R | This paper | PCR primers | 5’-CCCCTGTCACC GCTAAAGAA-3’ |
| Sequence-based reagent | Gapdh_F | This paper | PCR primers | 5’-TATGTCGTGGAGTC TACTGGTGTCTTC-3’ |
| Sequence-based reagent | Gapdh_R | This paper | PCR primers | 5’-GTTGTCATATTTCTCG TGGTTCACACCC-3’ |
| Other | CellMask stain | Invitrogen | Cat# H32720 | ICC: 1:1000 |
| Other | CellMask membrane stain | Invitrogen | Cat#C37608 | ICC: 1:1000 |
| Other | GalC hybridoma | From Ben A. Barres’s lab | Pannning: 1:4 dilution | |
| Other | O4 Hybridoma | From Ben A. Barres’s lab | Pannning: 1:4 dilution |
Additional files
-
Supplementary file 1
Gene expression (RPKM) of OPCs, oligodendrocytes, microglia, and astrocytes from PD:ibot and littermate control mice at P17 determined by RNA-seq.
Reads per kilobase of transcripts per million mapped reads (RPKM) are shown.
- https://cdn.elifesciences.org/articles/77441/elife-77441-supp1-v2.xlsx
-
Supplementary file 2
Differentially expressed genes in OPCs, oligodendrocytes, microglia, and astrocytes from PD:ibot and littermate control mice at P17.
Genes with adjusted P-values <0.05 are shown. We used DESeq2 to determine differential gene expression.
- https://cdn.elifesciences.org/articles/77441/elife-77441-supp2-v2.xlsx
-
Supplementary file 3
Gene ontology terms associated with differentially expressed genes in OPCs, oligodendrocytes, microglia, and astrocytes from PD:ibot and littermate control mice at P17.
No gene ontology terms were significantly enriched in genes downregulated in OPCs, astrocytes, or upregulated in microglia in PD:ibot mice.
- https://cdn.elifesciences.org/articles/77441/elife-77441-supp3-v2.xlsx
-
Transparent reporting form
- https://cdn.elifesciences.org/articles/77441/elife-77441-transrepform1-v2.docx
Download links
A two-part list of links to download the article, or parts of the article, in various formats.
Downloads (link to download the article as PDF)
Open citations (links to open the citations from this article in various online reference manager services)
Cite this article (links to download the citations from this article in formats compatible with various reference manager tools)
Oligodendrocyte-lineage cell exocytosis and L-type prostaglandin D synthase promote oligodendrocyte development and myelination
eLife 12:e77441.
https://doi.org/10.7554/eLife.77441


