BIRC6 modifies risk of invasive bacterial infection in Kenyan children
- Department of Paediatrics, University of Oxford, United Kingdom
- MRC–Weatherall Institute of Molecular Medicine, University of Oxford, United Kingdom
- Wellcome Centre for Human Genetics, University of Oxford, United Kingdom
- KEMRI-Wellcome Trust Research Programme, Centre for Geographic Medicine Research-Coast, Kenya
- Centre for Tropical Medicine and Global Health, Nuffield Department of Medicine, University of Oxford, United Kingdom
- Mahidol Oxford Tropical Medicine Research Unit, Faculty of Tropical Medicine, Mahidol University, Thailand
- Institute of Computer Science, University of Tartu, Estonia
- Wellcome Sanger Institute, United Kingdom
- The Jenner Institute, University of Oxford, United Kingdom
- Division of Medicine, Imperial College, United Kingdom
- Department of Infectious Disease Epidemiology, London School of Hygiene & Tropical Medicine, United Kingdom
- Institute for Global Health Innovation, Department of Surgery and Cancer, Imperial College, United Kingdom
Figures
Figure 1 with 1 supplement
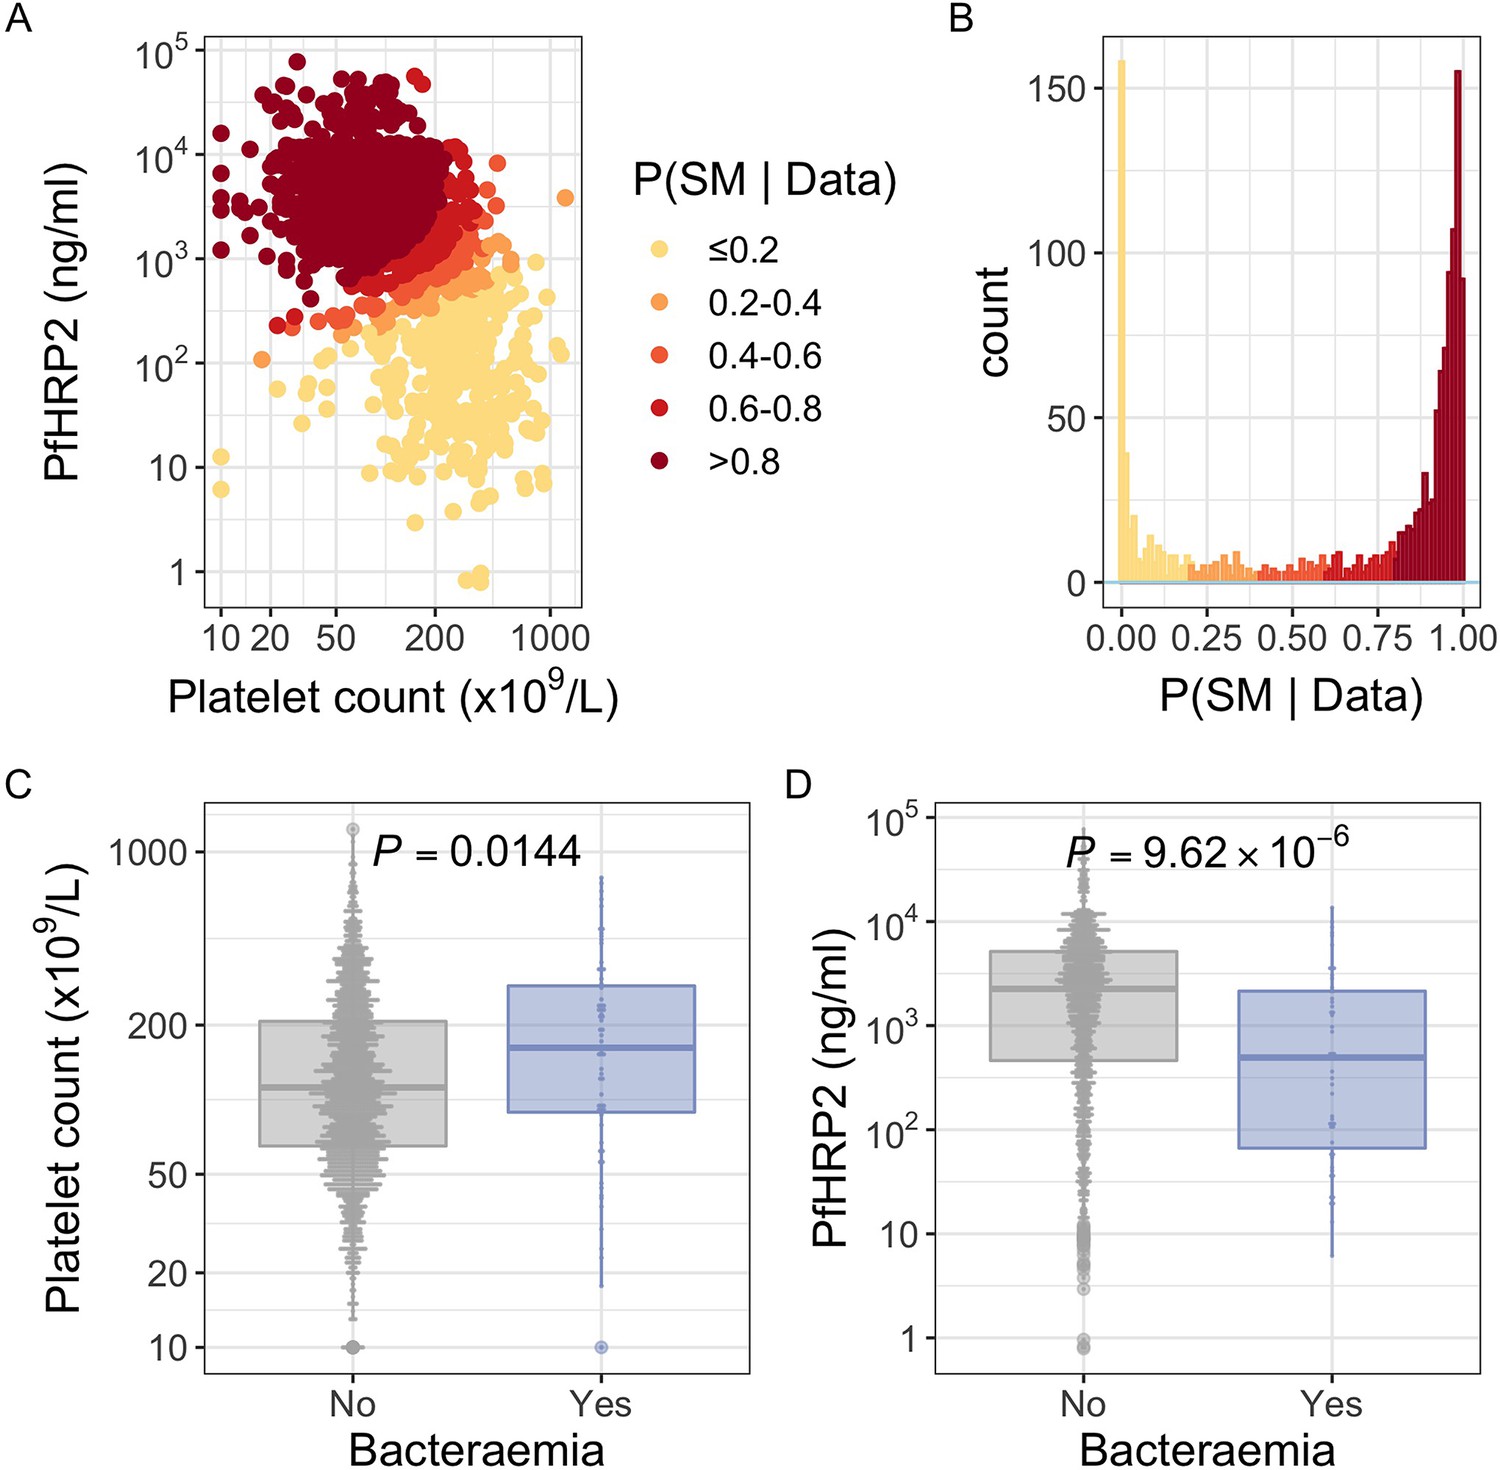
PfHRP2 and platelet count as predictors of severe malaria.
(A) Distribution of PfHRP2 concentrations and platelet count among Kenyan children (n=1400) with a clinical diagnosis of severe malaria. Points are coloured according to the probability of ‘true’ severe malaria given the data. (B) Distribution of ‘true’ severe malaria probabilities estimated from platelet count and plasma PfHRP2 concentrations. (C) Platelets counts in children with a clinical diagnosis of severe malaria with and without concomitant bacteraemia. (D) PfHRP2 concentrations in children with a clinical diagnosis of severe malaria with and without concomitant bacteraemia. Box and whisker plots; boxes depict the upper and lower quartiles of the data, and whiskers depict the range of the data excluding outliers (outliers are defined as data-points > 1.5 × the inter-quartile range from the upper or lower quartiles). Comparisons of platelet count and plasma PfHRP2 concentrations in children with and without bacteraemia were performed with logistic regression.
Figure 1—figure supplement 1
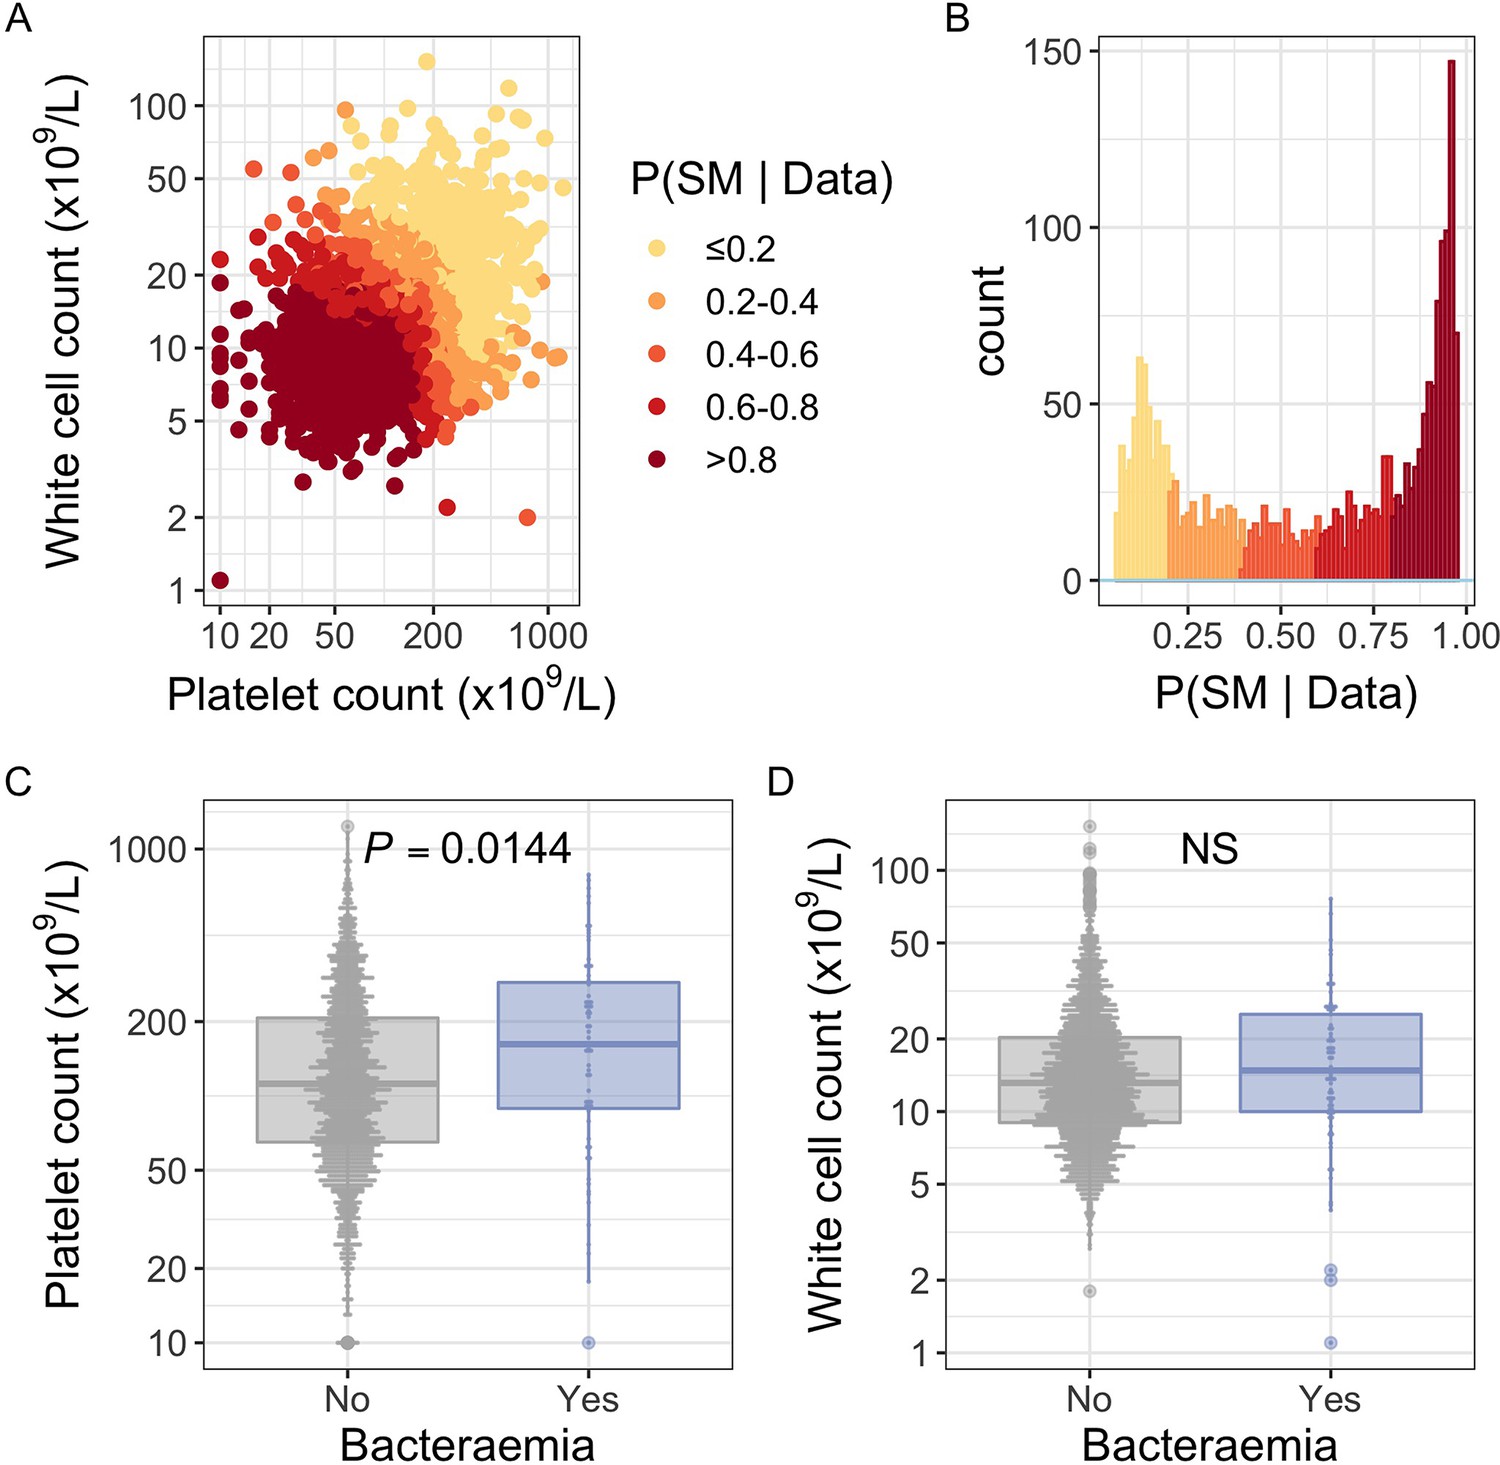
White blood cell and platelet count as predictors of severe malaria.
(A) Distribution of white blood cell and platelet count among Kenyan children (n=2200) with a clinical diagnosis of severe malaria. Points are coloured according to the probability of ‘true’ severe malaria given the data. (B) Distribution of ‘true’ severe malaria probabilities estimated from platelet count and white blood cell count. (C) Platelets counts in children with a clinical diagnosis of severe malaria with and without concomitant bacteraemia. (D) White blood cell counts in children with a clinical diagnosis of severe malaria with and without concomitant bacteraemia. Box and whisker plots; boxes depict the upper and lower quartiles of the data, and whiskers depict the range of the data excluding outliers (outliers are defined as data-points > 1.5 × the inter-quartile range from the upper or lower quartiles). Comparisons of platelet and white cell count in children with and without bacteraemia were performed with logistic regression.
Figure 2
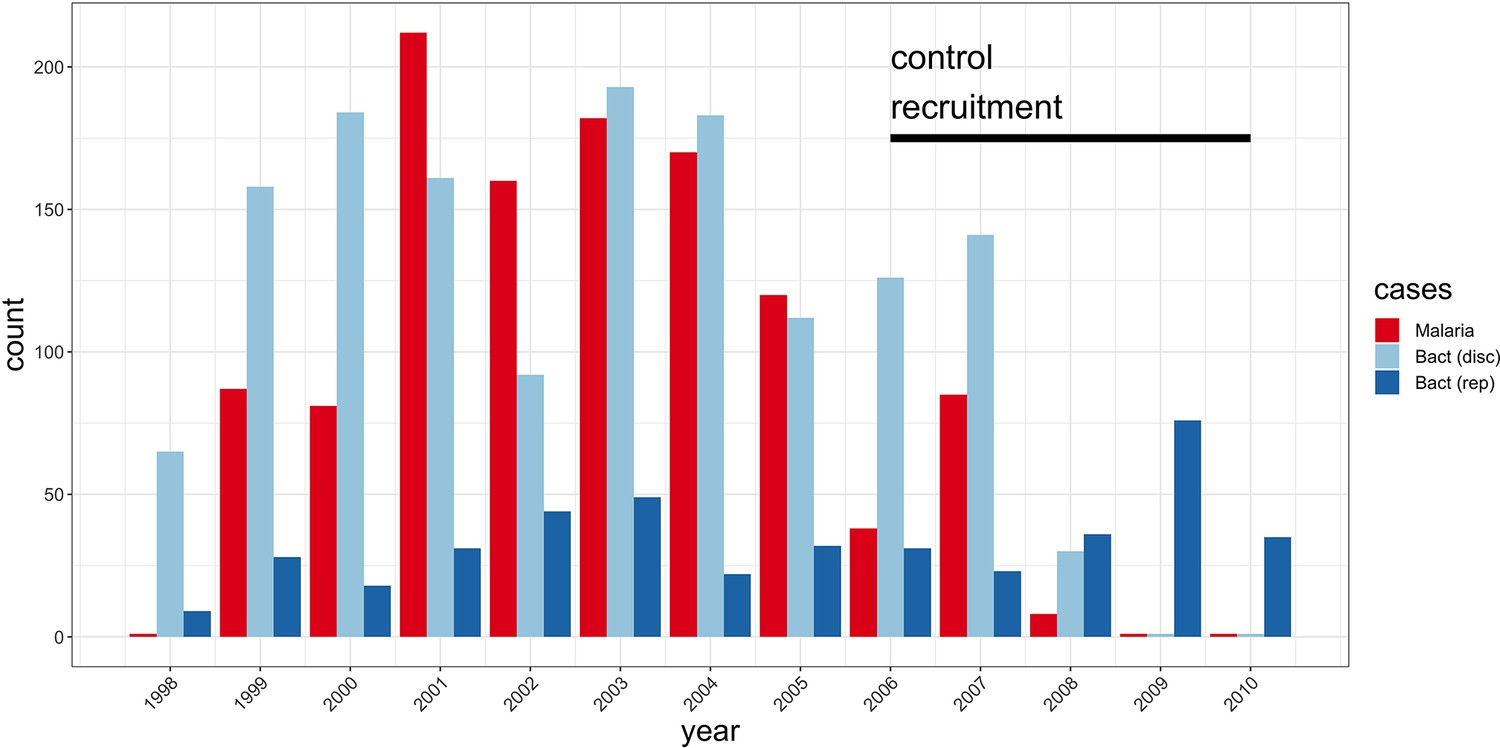
Study sample recruitment.
Recruitment of severe malaria cases (n=1143), discovery analysis bacteraemia cases (n=1445), and replication analysis bacteraemia cases (n=434) between 1998 and 2010. The time period during which control samples (n=2812) were recruited is also highlighted (black bar). Sample numbers represent children with genome-wide genotype data, who passed quality control filters and were included in this study.
Figure 3 with 4 supplements
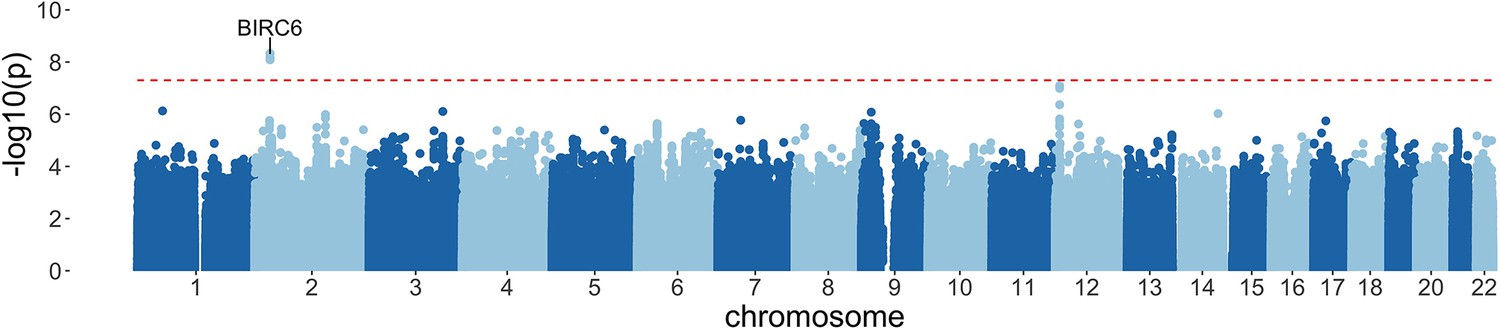
Manhattan plot of invasive bacterial infection in Kenyan children.
Evidence for association with invasive bacterial disease at genotyped and imputed autosomal SNPs and indels (n=14,010,600) in Kenyan children (bacteraemia cases =1445, severe malaria cases =1143, controls = 2812). Association statistics represent additive association. The red, dashed line denotes .
Figure 3—figure supplement 1
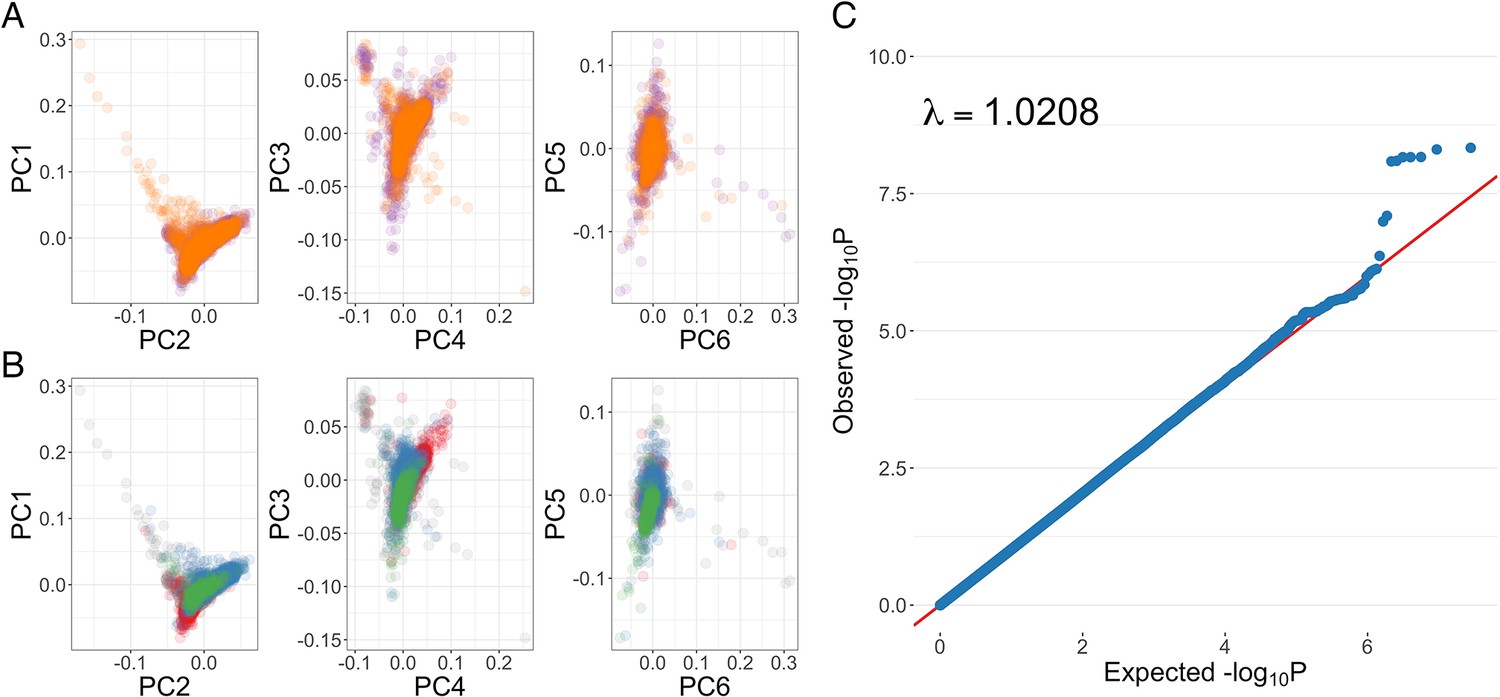
Genome-wide association analysis quality control.
(A) Principal components of genome-wide genotyping data in discovery samples. Individuals are colour-coded according to genotyping platform; Affymetrix SNP 6.0 in purple, Illumina Omni 2.5M in orange. (B) Principal components of genome-wide genotyping data in discovery samples. Individuals are colour-coded according to self-reported ethnicity; Chonyi in red, Giriama in blue, Kauma in green, and other in grey. (C) Quantile-quantile plot of invasive bacterial infection in Kenyan children. QQ plot of weighted logistic regression genome-wide association study (GWAS) of invasive bacterial disease in Kenyan children (2588 cases, 2812 controls).
Figure 3—figure supplement 2

Principal components of genome-wide genotyping data in discovery samples.
Outlier samples identified by ABERRANT (n=22) are highlighted (orange).
Figure 3—figure supplement 3
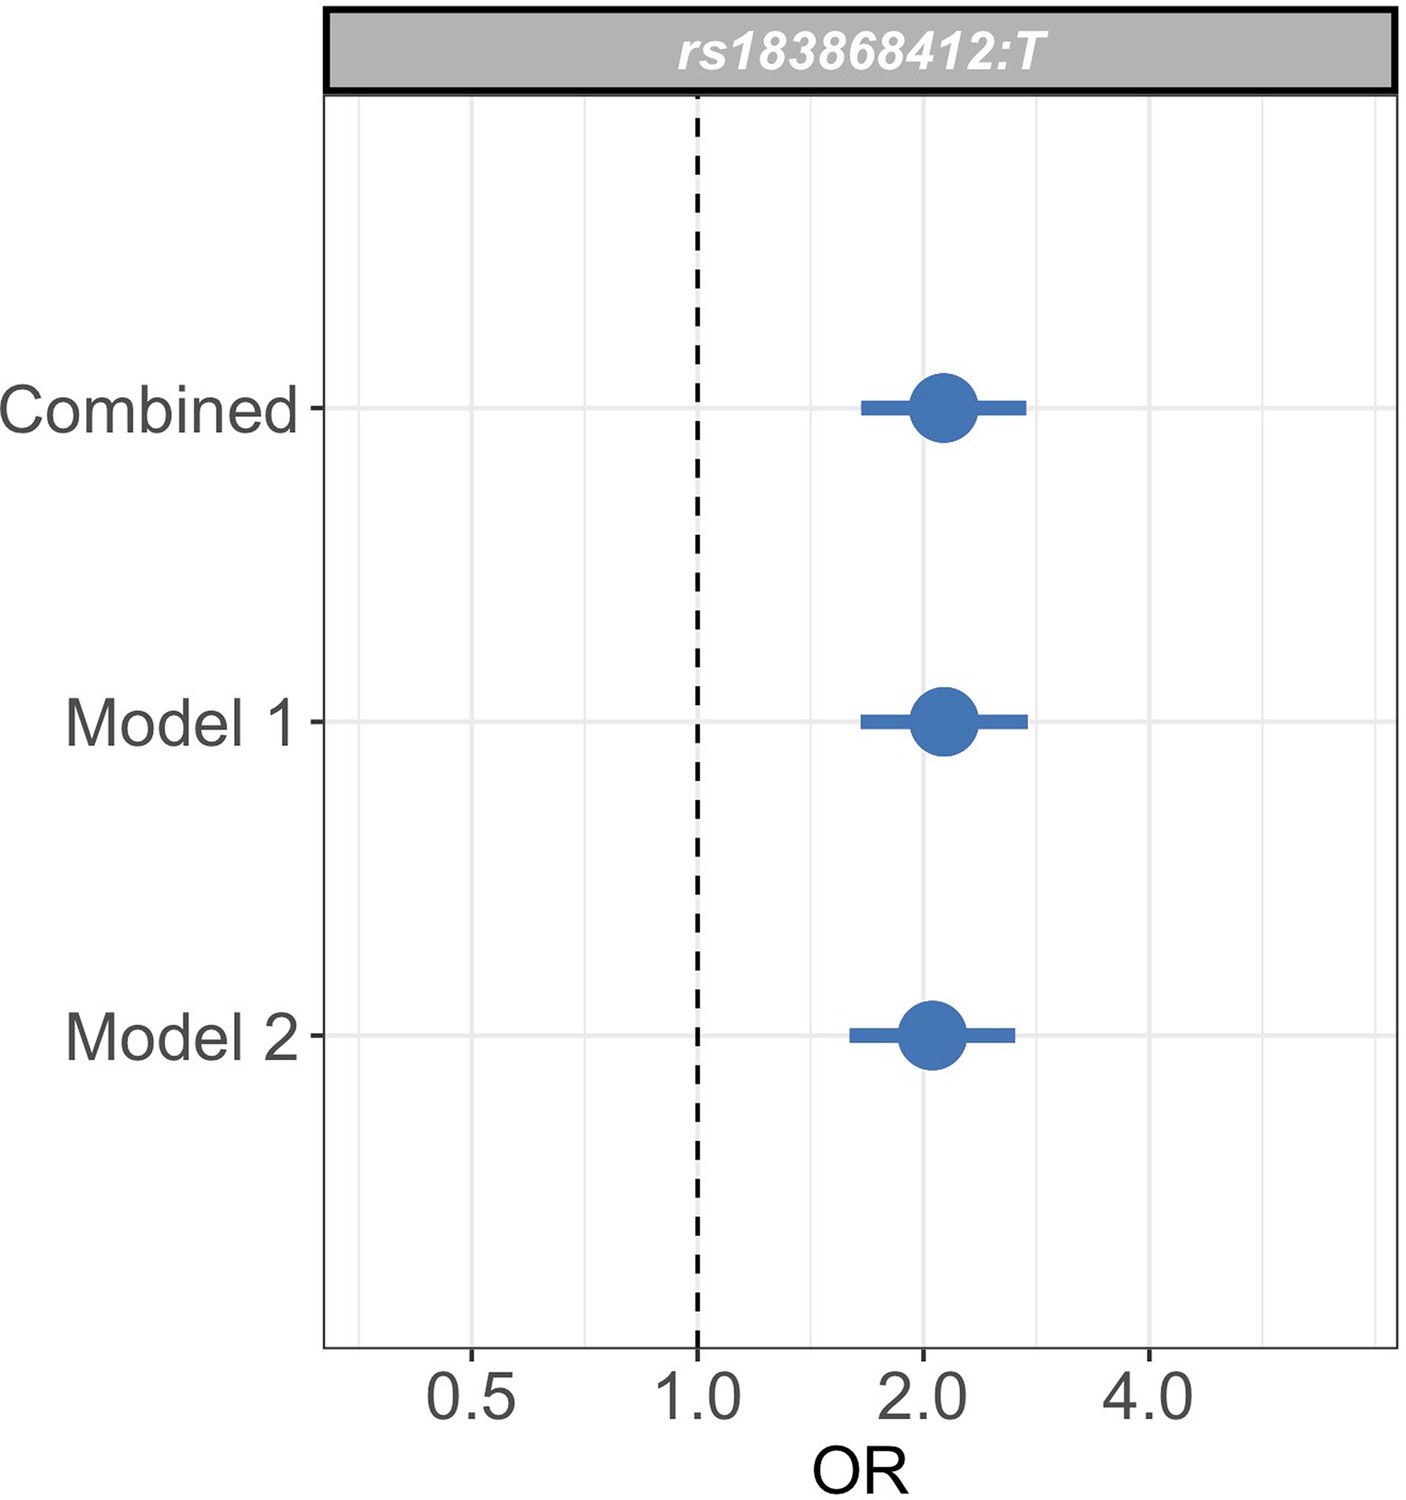
Sensitivity analysis of case weights.
Comparison of effect sizes (odds ratios and 95% confidence intervals) of the rs183868412:T association with invasive bacterial infection in the combined analysis (bacteraemia cases = 1445, severe malaria cases = 1143, controls = 2812), and restricted to cases with weights calculated with PfHRP2 plasma concentration and platelet count (Model 1; bacteraemia cases = 1445, severe malaria cases = 909, controls = 2812) or white cell count and platelet count (Model 2; bacteraemia cases = 1445, severe malaria cases = 909, controls = 2812). Effect estimates were calculated with weighted logistic regression.
Figure 3—figure supplement 4
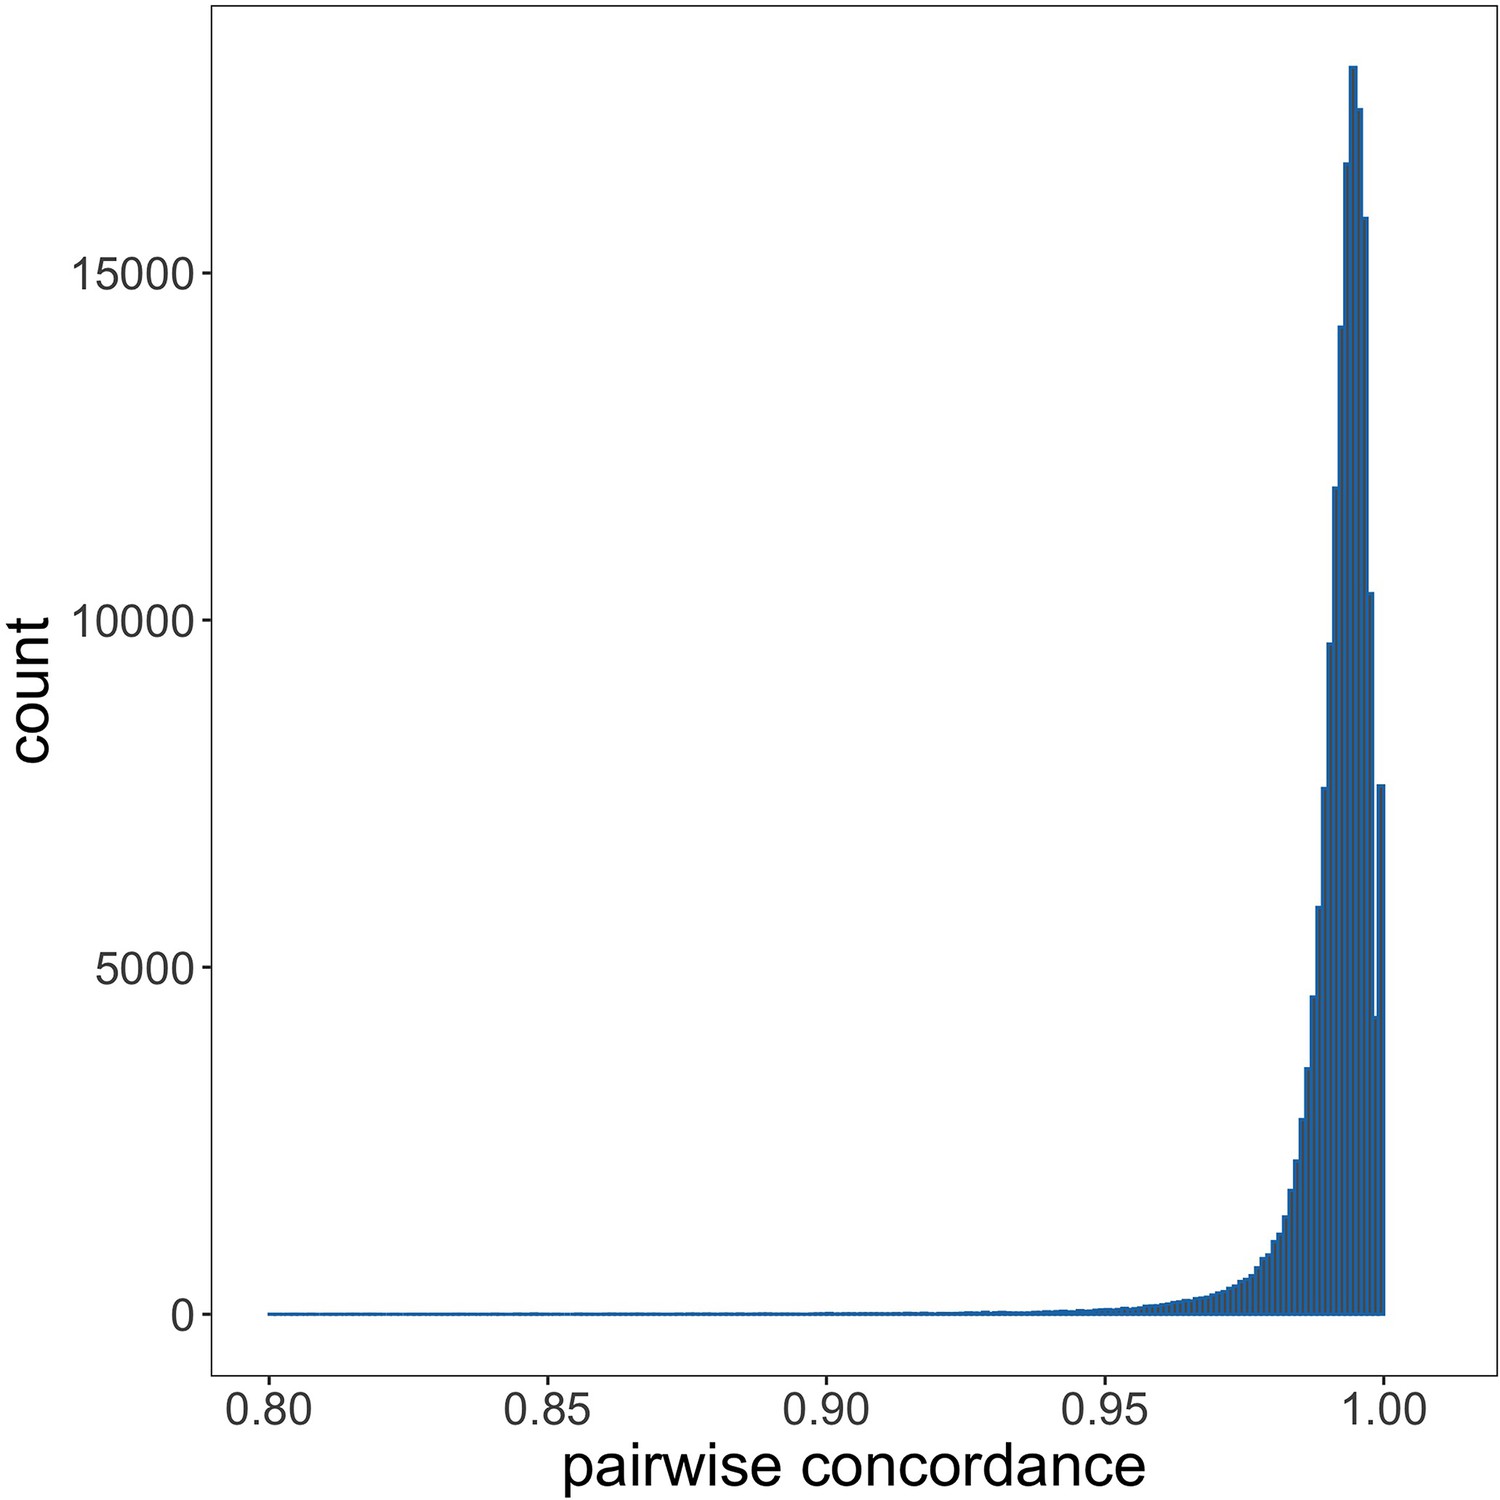
Genotyping concordance between Illumina and Affymetrix platforms.
Pairwise genotyping concordance between samples genotyped on both Affymetrix SNP 6.0 and Illumina Omni 2.5M platforms.
Figure 4 with 1 supplement
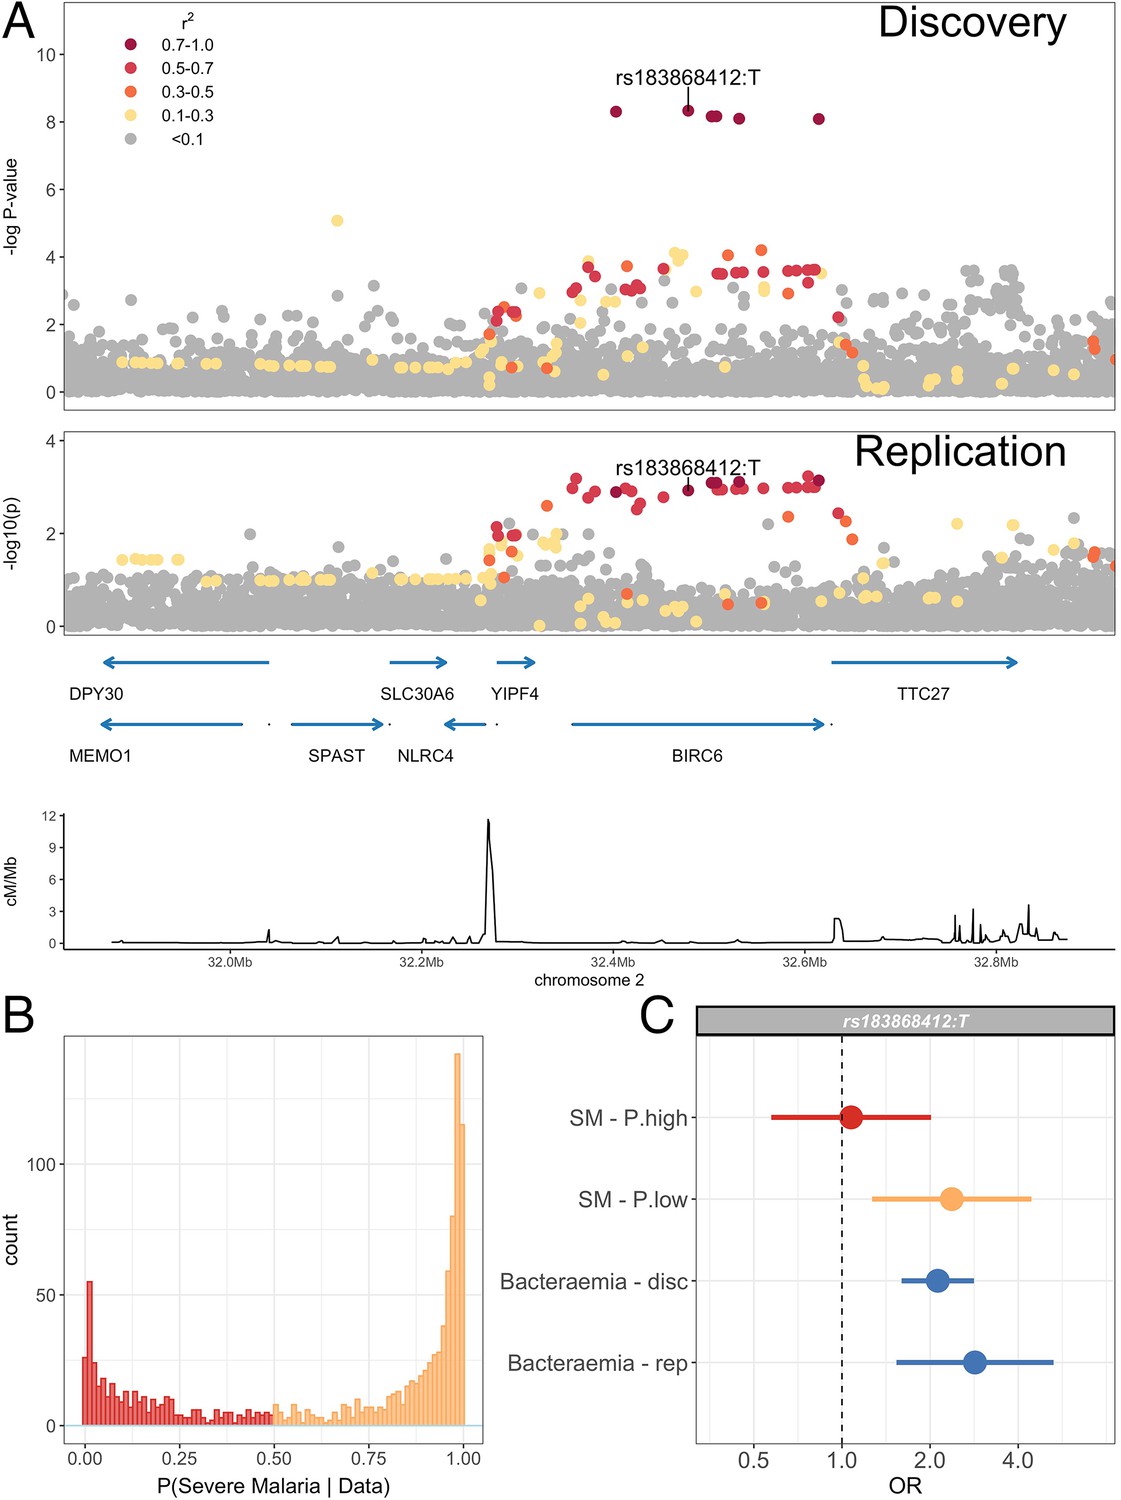
Association with invasive bacterial disease at the BIRC6 locus.
(A) Regional association plot of invasive bacterial disease association at the BIRC6 locus in the discovery and replication analyses. SNPs are coloured according to linkage disequilibrium to rs183868412. Genomic coordinates are GRCh38. (B) Distribution of ‘true’ severe malaria probabilities among malaria cases estimated from plasma PfHRP2 concentration and platelet count (n=909) and white blood cell count and platelet count (n=234). (C) Odds ratios and 95% confidence intervals of rs183868412 association with disease stratified by malaria cases with high (p>0.5, red) and low (p<0.5, orange) probabilities of ‘true’ severe malaria and culture-proven invasive bacterial disease (blue). P(SM|Data) represents the probability of ‘true’ severe malaria estimated from plasma PfHRP2 concentration and platelet count (n=909) or white blood cell count and platelet count (n=234). Effect estimates were calculated with multinomial logisitic regression (SM - P.high, SM - P.low, Bacteraemia - disc) and logistic regression (Bacteraemia - rep).
Figure 4—figure supplement 1
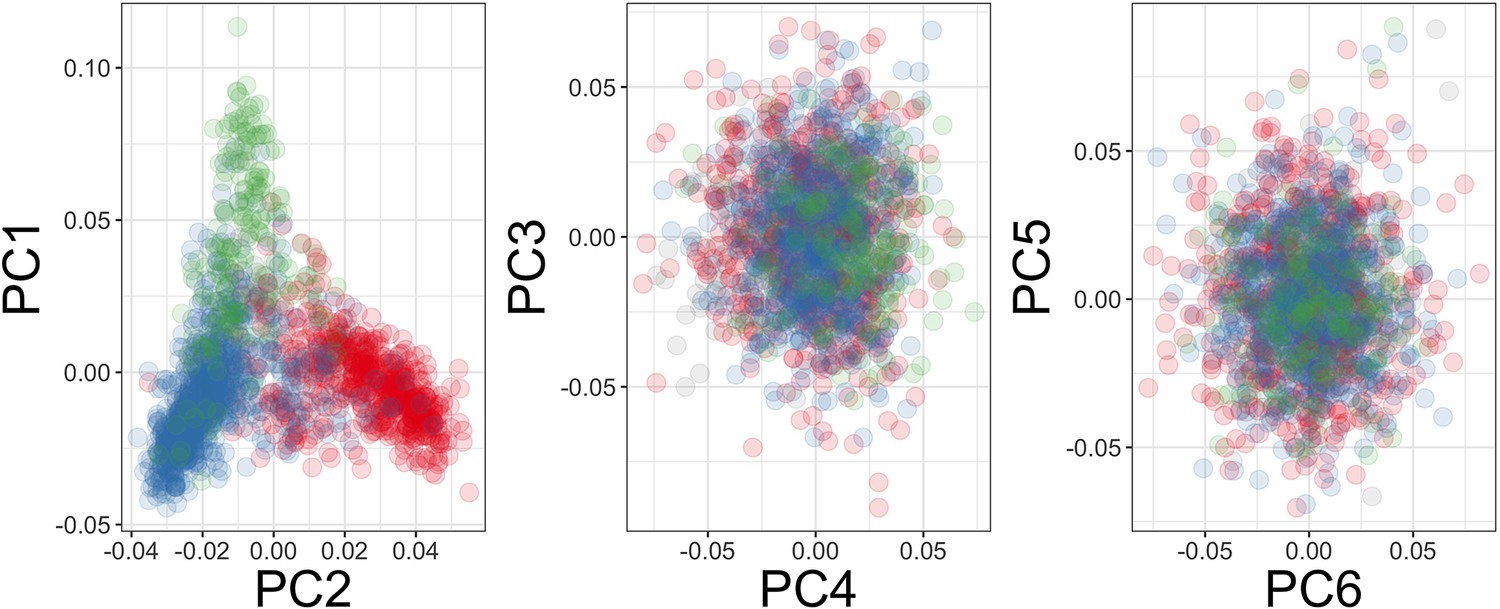
Principal components of genome-wide genotyping data in replication samples.
Individuals are colour-coded according to self-reported ethnicity; Chonyi in red, Giriama in blue, Kauma in green, and other in grey.
Figure 5
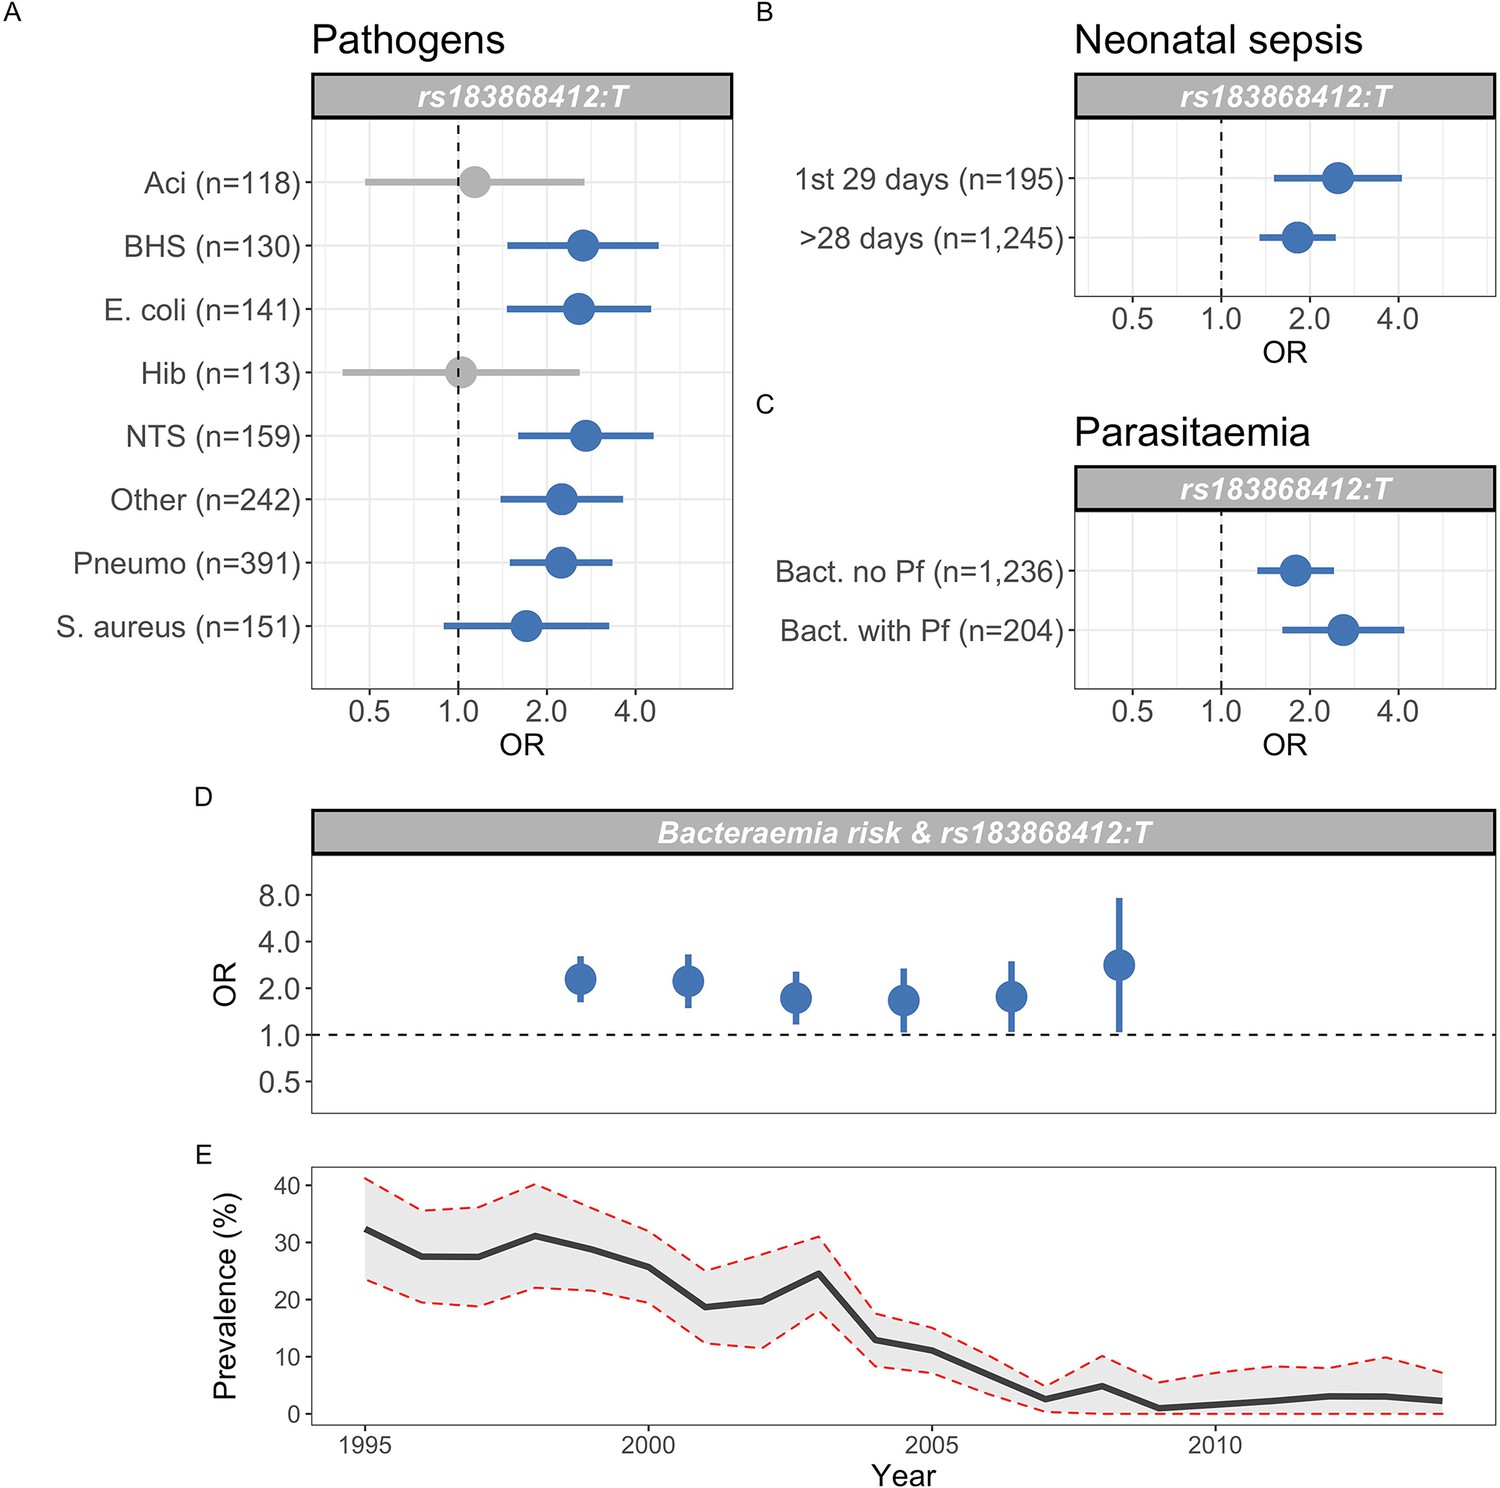
Genetic variation at BIRC6 confers broad susceptibility to invasive bacterial disease.
Odds ratios and 95% confidence intervals of rs183868412 association with invasive bacterial disease stratified by pathogen (A), neonatal and non-neonatal sepsis (B), and bacteraemia with and without malaria parasitaemia (C). Odds ratios and 95% confidence intervals of rs183868412 association with invasive bacterial disease stratified by year (D), compared to age-standardised, annual malaria parasite prevalence in Kilifi, Kenya, as estimated from parasite prevalence among trauma admissions (E).We calculated effect estimates using multinomial logistic regression. We compared models of association across strata using a Bayesian approach (see Materials and methods). Strata associated with rs183868412 genotype in the most likely model in each analysis are highlighted in blue.
Figure 6
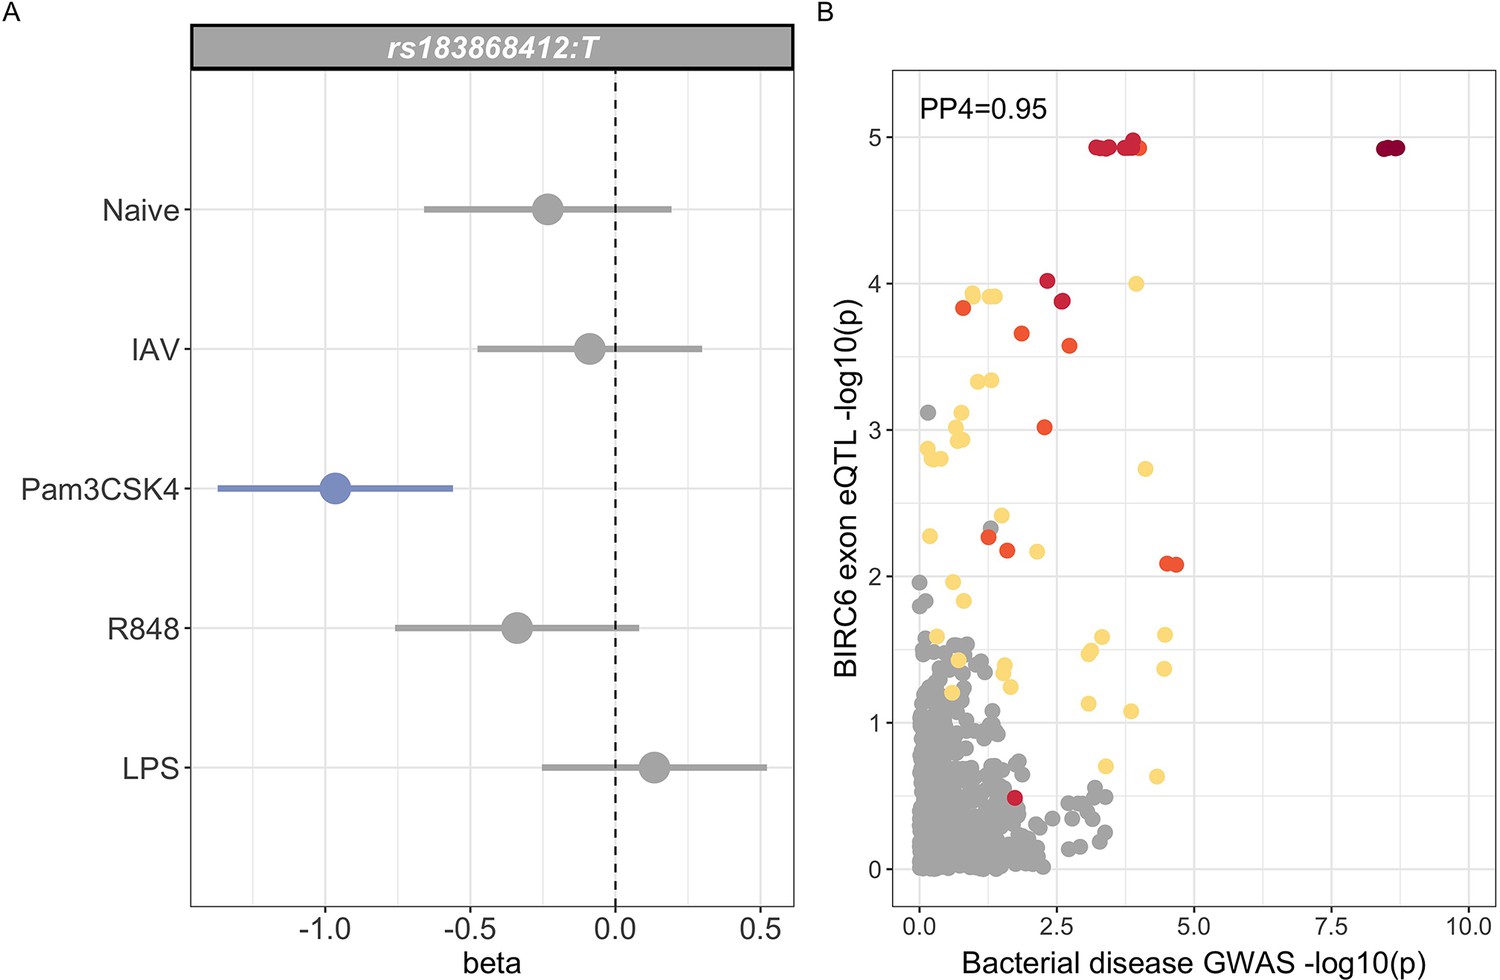
Regulatory function of rs183868412 monocytes.
(A) Betas and 95% confidence intervals of rs183868412 association with expression of a 12 bp BIRC6 exonic sequence (chr2:32,453,943–32,453,954) in monocytes. Monocytes are naive or stimulated with LPS (lipopolysaccharide), IAV (influenza A virus), Pam3CSK4, and R848. (B) Colocalisation of the BIRC6 exon eQTL in Pam3CSK4-stimulated monocytes colocalises with the risk locus for invasive bacterial disease (). SNPs are coloured according to linkage disequilibrium to rs183868412. Effect estimates are calculated by linear regression.
Tables
Table 1
Demographics and clinical characteristics of Kenyan children with severe malaria.
| Model | Numbers | Sex (female) | Age (months) | Bacteraemia | Mortality |
|---|---|---|---|---|---|
| PfHRP2/Plt | Total (n=1400) | 695 (49.6%) | 29 (17–44) | 51 (3.6%) | 155 (11.1%) |
| P(SM|Data)>0.5 (n=975) | 497 (51.0%) | 29 (18–45) | 23 (2.4%) | 94 (7.4%) | |
| P(SM|Data)<0.5 (n=425) | 198 (46.6%) | 28 (16–43) | 28 (6.6%) | 61 (14.4%) | |
| WBC/Plt | Total (n=2220) | 1,074 (48.4%) | 28 (15–43) | 78 (3.5%) | 256 (11.6%) |
| P(SM|Data)>0.5 (n=1279) | 623 (48.7%) | 29 (17–44) | 32 (2.5%) | 106 (8.4%) | |
| P(SM|Data)<0.5 (n=941) | 451 (47.9%) | 25 (13–40) | 46 (4.9%) | 150 (15.9%) |
-
Mortality reflects in-patient deaths. Figures are absolute numbers with percentages or interquartile ranges in parentheses. P(SM|Data) reflects the probability of ‘true’ severe malaria estimated from each model (PfHRP2/Platelet count, White blood cell count/Platelet count).
Table 2
Demographics and clinical characteristics of genome-wide association study (GWAS) study samples.
| Severe malaria subtypes | Concurrent infection | |||||||
|---|---|---|---|---|---|---|---|---|
| Numbers | Sex (female) | Age (months) | SMA | CM | Malaria | Bacteraemia | Mortality | |
| Bacteraemia (overall) | 1445 | 614 (43%) | 14 (5–34) | 94 (12%) | 358 (26%) | |||
| Acinetobacter | 118 | 45 (38%) | 13 (3–28) | 11 (13%) | 12 (10%) | |||
| β-Haemolytic streptococci | 130 | 60 (46%) | 5 (1–20) | 6 (8%) | 37 (30%) | |||
| Escherichia coli | 141 | 58 (41%) | 11 (6–25) | 12 (15%) | 45 (34%) | |||
| Hib | 113 | 53 (47%) | 12 (5–25) | 3 (8%) | 29 (26%) | |||
| NTS | 159 | 75 (47%) | 15 (9–26) | 15 (25%) | 31 (20%) | |||
| Streptococcus pneumoniae | 390 | 151 (39%) | 23 (9–61) | 20 (9%) | 86 (23%) | |||
| Staphylococcus aureus | 152 | 64 (42.1%) | 26 (9–88) | 15 (15%) | 22 (15%) | |||
| Other | 242 | 110 (46%) | 10 (1–28) | 10 (8%) | 96 (41%) | |||
| Malaria (overall) | 1143 | 559 (49%) | 27 (16–41) | 298 (26%) | 697 (61%) | 40 (4%) | 140 (12%) | |
| P(SM|Data)<0.5 | 375 | 176 (47%) | 28 (17–42) | 62 (17%) | 262 (70%) | 23 (6%) | 62 (17%) | |
| P(SM|Data)>0.5 | 768 | 383 (50%) | 26 (15–40) | 236 (31%) | 435 (57%) | 17 (2%) | 17 (2%) | |
| Controls (SNP 6.0) | 1895 | 955 (50%) | * | |||||
| Controls (Omni 2.5M) | 917 | 451 (49.2%) | ||||||
-
P(SM|Data) reflects the probability of ‘true’ severe malaria estimated from PfHRP2 concentration and platelet count or white blood cell count and platelet count. Blood cultures were taken from all children severe malaria at admission. *Control children were recruited between 3 and 12 months of age and have been subject to longitudinal follow-up. SMA, severe malarial anaemia; CM, cerebral malaria.
Table 3
95% credible SNP set of invasive bacterial disease association.
| SNP | Effect allele | Chr | BP | MAF | Info score | OR (95% CI) | p-Value |
|---|---|---|---|---|---|---|---|
| rs183868412 | T | 2 | 32,478,169 | 0.021 | 0.956 | 2.13 (1.65–2.74) | |
| rs139827594 | G | 2 | 32,402,640 | 0.020 | 0.966 | 2.12 (1.65–2.73) | |
| rs144257579 | G | 2 | 32,507,619 | 0.021 | 0.954 | 2.11 (1.64–2.72) | |
| rs145056232 | C | 2 | 32,503,024 | 0.021 | 0.955 | 2.11 (1.64–2.72) | |
| rs145315025 | G | 2 | 32,502,654 | 0.021 | 0.955 | 2.11 (1.64–2.72) | |
| rs143909151 | T | 2 | 32,531,452 | 0.021 | 0.962 | 2.11 (1.64–2.71) | |
| rs150430979 | T | 2 | 32,614,746 | 0.021 | 0.955 | 2.11 (1.64–2.72) |
-
MAF, minor allele frequency. CI, confidence interval. Genomic coordinates are GRCh38.
Table 4
Effect of rs183868412 genotype on risk of invasive bacterial disease stratifies by self-reported ethnicity.
| Discovery population | Numbers | Genotypes | MAF | OR (95% CI) | p-Value | ||
|---|---|---|---|---|---|---|---|
| Giriama | Cases | Overall | 1232 | 0/56/1176 | 0.023 | 1.97 (1.30–3.01) | |
| Bacteraemia | 558 | 0/38/520 | 0.034 | ||||
| SM − P(SM|Data)<0.5 | 199 | 0/12/187 | 0.030 | ||||
| SM − P(SM|Data)>0.5 | 475 | 0/6/469 | 0.006 | ||||
| Controls | 1269 | 0/41/1228 | 0.016 | ||||
| Chonyi | Cases | Overall | 503 | 0/38/465 | 0.038 | 2.18 (1.34–3.54) | |
| Bacteraemia | 238 | 0/27/211 | 0.057 | ||||
| SM − P(SM|Data)<0.5 | 105 | 0/4/101 | 0.019 | ||||
| SM − P(SM|Data)>0.5 | 160 | 0/7/153 | 0.022 | ||||
| Controls | 1057 | 0/43/1014 | 0.020 | ||||
| Kauma | Cases | Overall | 154 | 0/8/146 | 0.026 | 1.20 (0.50–2.85) | |
| Bacteraemia | 70 | 0/6/64 | 0.043 | ||||
| SM − P(SM|Data)<0.5 | 25 | 0/1/24 | 0.020 | ||||
| SM − P(SM|Data)>0.5 | 59 | 0/1/58 | 0.008 | ||||
| Controls | 318 | 0/20/298 | 0.031 | ||||
| Other | Cases | Overall | 219 | 1/16/202 | 0.041 | 2.46 (1.01–5.96) | |
| Bacteraemia | 101 | 1/8/92 | 0.050 | ||||
| SM − P(SM|Data)<0.5 | 38 | 0/5/33 | 0.066 | ||||
| SM − P(SM|Data)>0.5 | 80 | 0/3/77 | 0.019 | ||||
| Controls | 165 | 0/7/158 | 0.021 | ||||
| Total | Cases | Overall | 2588 | 3/164/2421 | 0.033 | 2.13 (1.65–2.74) | |
| Bacteraemia | 1445 | 3/125/1317 | 0.045 | ||||
| SM − P(SM|Data)<0.5 | 375 | 0/20/355 | 0.027 | ||||
| SM − P(SM|Data)>0.5 | 768 | 0/19/749 | 0.012 | ||||
| Controls | 2812 | 0/111/2701 | 0.020 |
-
Self-reported ethnicity data is missing in 482 samples (480 of which are cases). Effect estimates derived with weighted logistic regression. p(SM|Data) represent the probability of ‘true’ severe malaria estimated from plasma PfHRP2 concentration and platelet count (n=909) or white blood cell count and platelet count (n=234). OR, odds ratio. MAF, minor allele frequency. CI, confidence interval.
Table 5
Effect of rs183868412 genotype on risk of invasive bacterial disease in Kenyan children.
| Numbers | Genotypes | MAF | OR (95% CI) | p-Value | |||
|---|---|---|---|---|---|---|---|
| Discovery | Cases | Overall | 2588 | 3/164/2421 | 0.033 | 2.13 (1.65–2.74) | |
| Bacteraemia* | 1445 | 3/125/1317 | 0.045 | 2.12 (1.60–2.82) | |||
| SM − P(SM|Data)<0.5* | 375 | 0/20/355 | 0.027 | 2.37 (1.27–4.43) | |||
| SM − P(SM|Data)>0.5* | 768 | 0/19/749 | 0.012 | 1.07 (0.57–2.01) | |||
| Controls | 2812 | 0/111/2701 | 0.020 | ||||
| Replication | Cases | 434 | 0/24/410 | 0.028 | 2.85 (1.54–5.28) | ||
| Controls | 1258 | 0/28/1230 | 0.011 | ||||
| Meta-analysis | Cases | 3022 | 3/188/2831 | 0.032 | 2.23 (1.76–2.80) | ||
| Controls | 4070 | 0/139/3931 | 0.017 |
-
*
Estimates derived from multinomial logistic regression model. P(SM|Data) represent the probability of ‘true’ severe malaria estimated from plasma PfHRP2 concentration and platelet count (n=909) or white blood cell count and platelet count (n=234). SM, severe malaria. MAF, minor allele frequency. CI, confidence interval.
Table 6
rs183868412 frequencies in Africa.
| Population | Number | MAF |
|---|---|---|
| Gambia | 2605 | 0.011 |
| Mali | 183 | 0.021 |
| Burkina Faso | 596 | 0.009 |
| Ghana | 320 | 0.014 |
| Nigeria | 22 | 0.024 |
| Cameroon | 685 | 0.031 |
| Malawi | 1317 | 0.034 |
| Tanzania | 402 | 0.028 |
| Kenya | 1681 | 0.017 |
-
Numbers reflect healthy control samples. MAF, minor allele frequency.
Additional files
Download links
A two-part list of links to download the article, or parts of the article, in various formats.
Downloads (link to download the article as PDF)
Open citations (links to open the citations from this article in various online reference manager services)
Cite this article (links to download the citations from this article in formats compatible with various reference manager tools)
BIRC6 modifies risk of invasive bacterial infection in Kenyan children
eLife 11:e77461.
https://doi.org/10.7554/eLife.77461


