DIP2 is a unique regulator of diacylglycerol lipid homeostasis in eukaryotes
- CSIR-Centre for Cellular and Molecular Biology, India
- Department of Biology, Indian Institute of Science Education and Research (IISER), India
- Academy of Scientific and Innovative Research (AcSIR), India
Figures
Figure 1 with 2 supplements
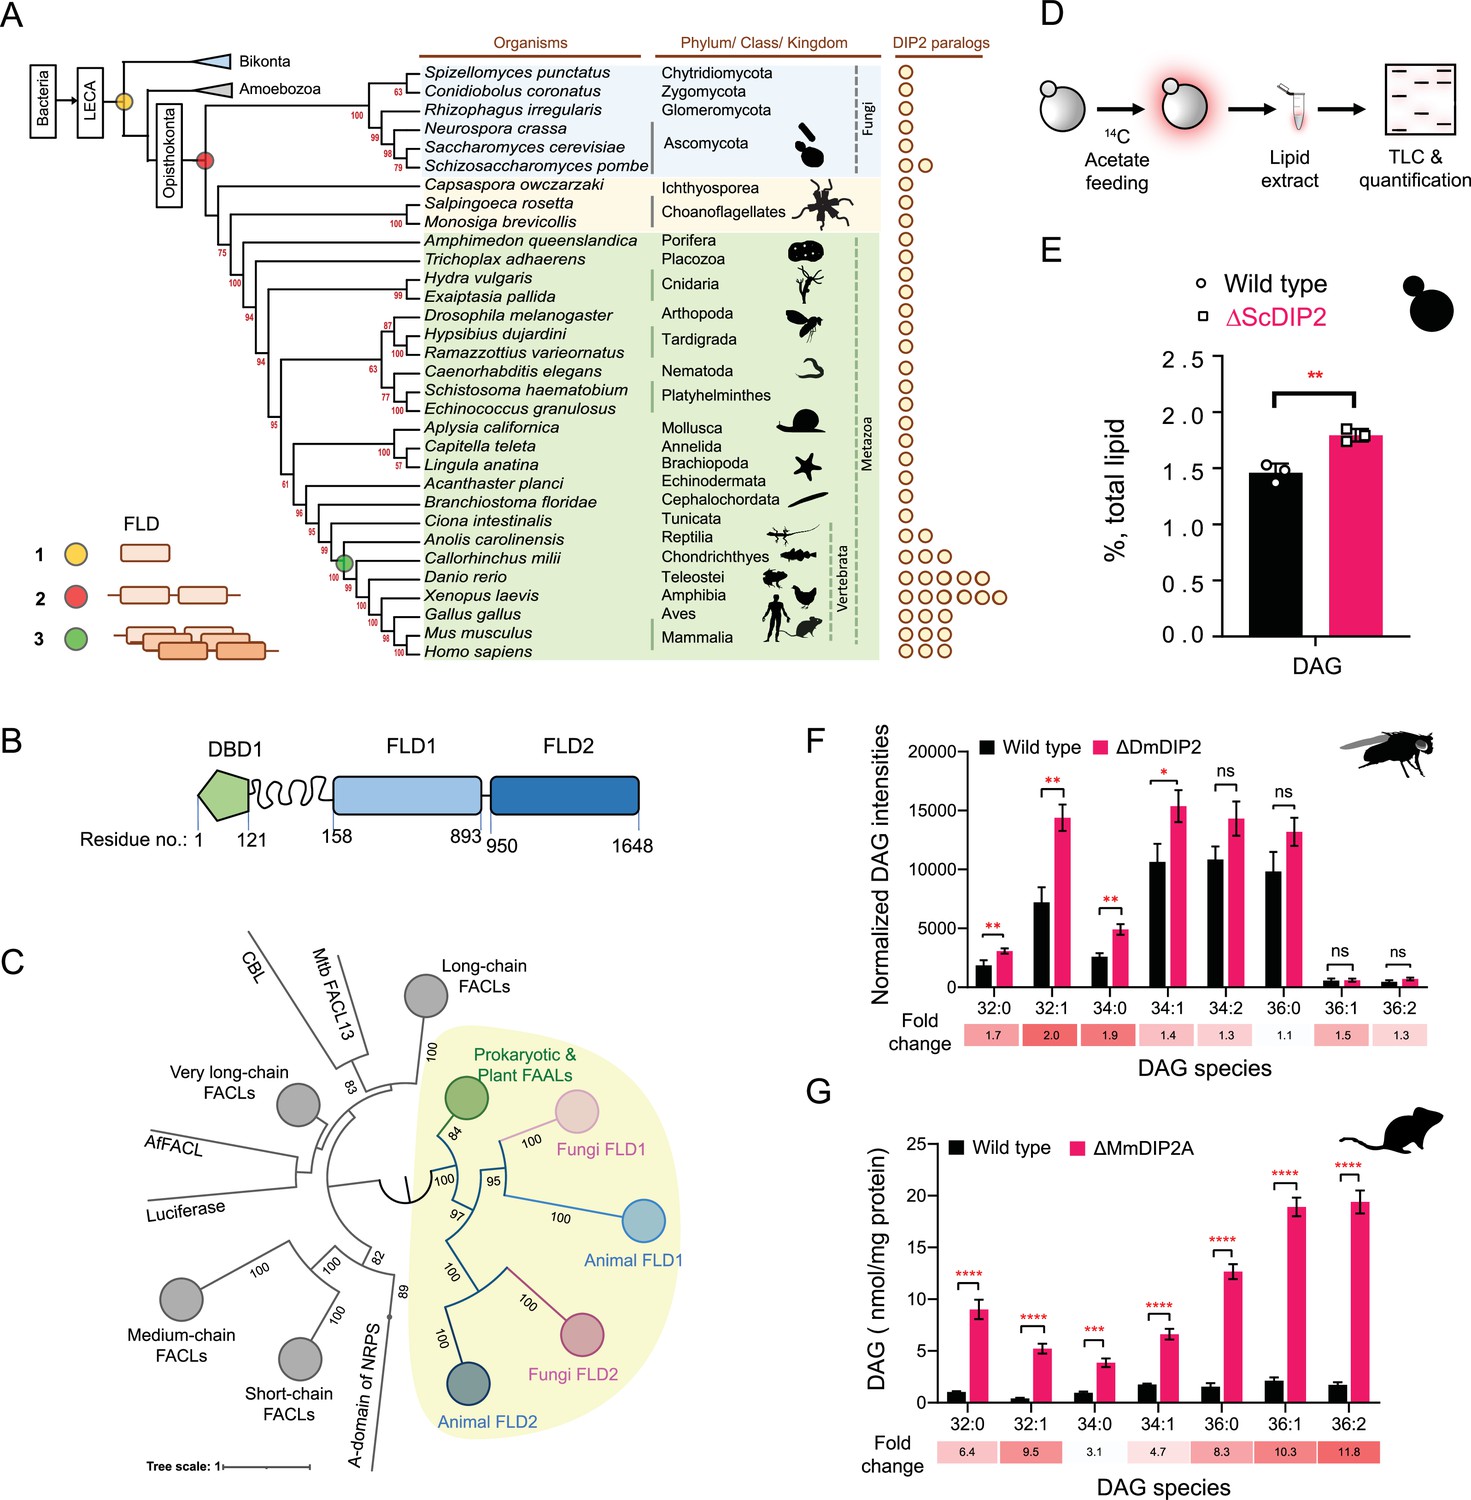
Tandem fatty acyl-AMP ligase (FAAL)-like domains (FLDs) containing protein DIP2 is a new player in the diacylglycerol (DAG) metabolism of Opisthokonta.
(A) The distribution of FLDs in Eukaryota: three events in FLD evolution are indicated on a representative phylogenetic tree, (1) recruitment of bacteria-like standalone FLDs in eukaryotes (yellow circle), (2) domain duplication resulting in tandem FLDs in opisthokonts (red circle), and (3) whole gene duplications resulting in paralogues in vertebrates (green circle). (B) Domain architecture and predicted domain boundaries of yeast DIP2 homologue. Amino acid numbers are indicated for each domain boundary. DBD1, DMAP1-Binding Domain 1; FLD1, FAAL-like Domain 1; FLD2, FAAL-like Domain 2. (C) Phylogenetic distribution of ANL family of enzymes shows the close association of FLDs of DIP2 (FLD1 and FLD2) with prokaryotic/plant FAAL and divergence from fatty acyl-CoA ligases (FACLs) of both prokaryotic and eukaryotic origins (nodes in grey colour). FLD cluster is highlighted in a yellow background. (D) A schematic for the metabolic labelling of the total lipid pool by feeding the yeast with radioactive [1-14C] acetic acid. The percentage for each lipid is calculated as a percentage of the total 14C-radiolabel incorporated in the lipidome. (E) The estimated DAG levels show accumulation in a ∆ScDIP2 mutant yeast in comparison to a wild type. Data are representative of three independent experiments, mean ± standard deviation (SD). **p < 0.01. (F) Liquid chromatography–mass spectrometry (LC–MS)-based quantification of DAGs from total lipid extract from 5-day-old adult Drosophila melanogaster shows an accumulation of DAGs. (G) The accumulation of DAGs is seen in the lipidome isolated from the embryonic stem cells generated from MmDIP2A−/− mice in CD1 background. In F and G, the average of estimated DAGs is shown on y-axis and the specific lipid length (combined number of carbons in two acyl chains) of DAGs is indicated on x-axis. Data are represented as mean ± standard error of the mean (SEM) (n = 6; unpaired, two-tailed Student’s t-test; *p < 0.05; **p < 0.01; ***p < 0.001; ****p < 0.0001 ns = not significant). The fold change for each DAG species is indicated below the bar graphs.
-
Figure 1—source data 1
Pairwise sequence identity calculation and analysis for fatty acyl-AMP ligase (FAAL)-like domains (FLDs) from representative organisms shown in Figure 1C.
- https://cdn.elifesciences.org/articles/77665/elife-77665-fig1-data1-v2.xlsx
-
Figure 1—source data 2
Quantification of total diacylglycerol (DAG) from metabolic radiolabelling experiment in yeast represented in Figure 1E.
- https://cdn.elifesciences.org/articles/77665/elife-77665-fig1-data2-v2.xlsx
-
Figure 1—source data 3
Quantification of diacylglycerol (DAG) species from Drosophila lines shown in Figure 1F.
- https://cdn.elifesciences.org/articles/77665/elife-77665-fig1-data3-v2.xlsx
-
Figure 1—source data 4
Quantification of diacylglycerol (DAG) species from mouse embryonic stem cell lines shown in Figure 1G.
- https://cdn.elifesciences.org/articles/77665/elife-77665-fig1-data4-v2.xlsx
Figure 1—figure supplement 1
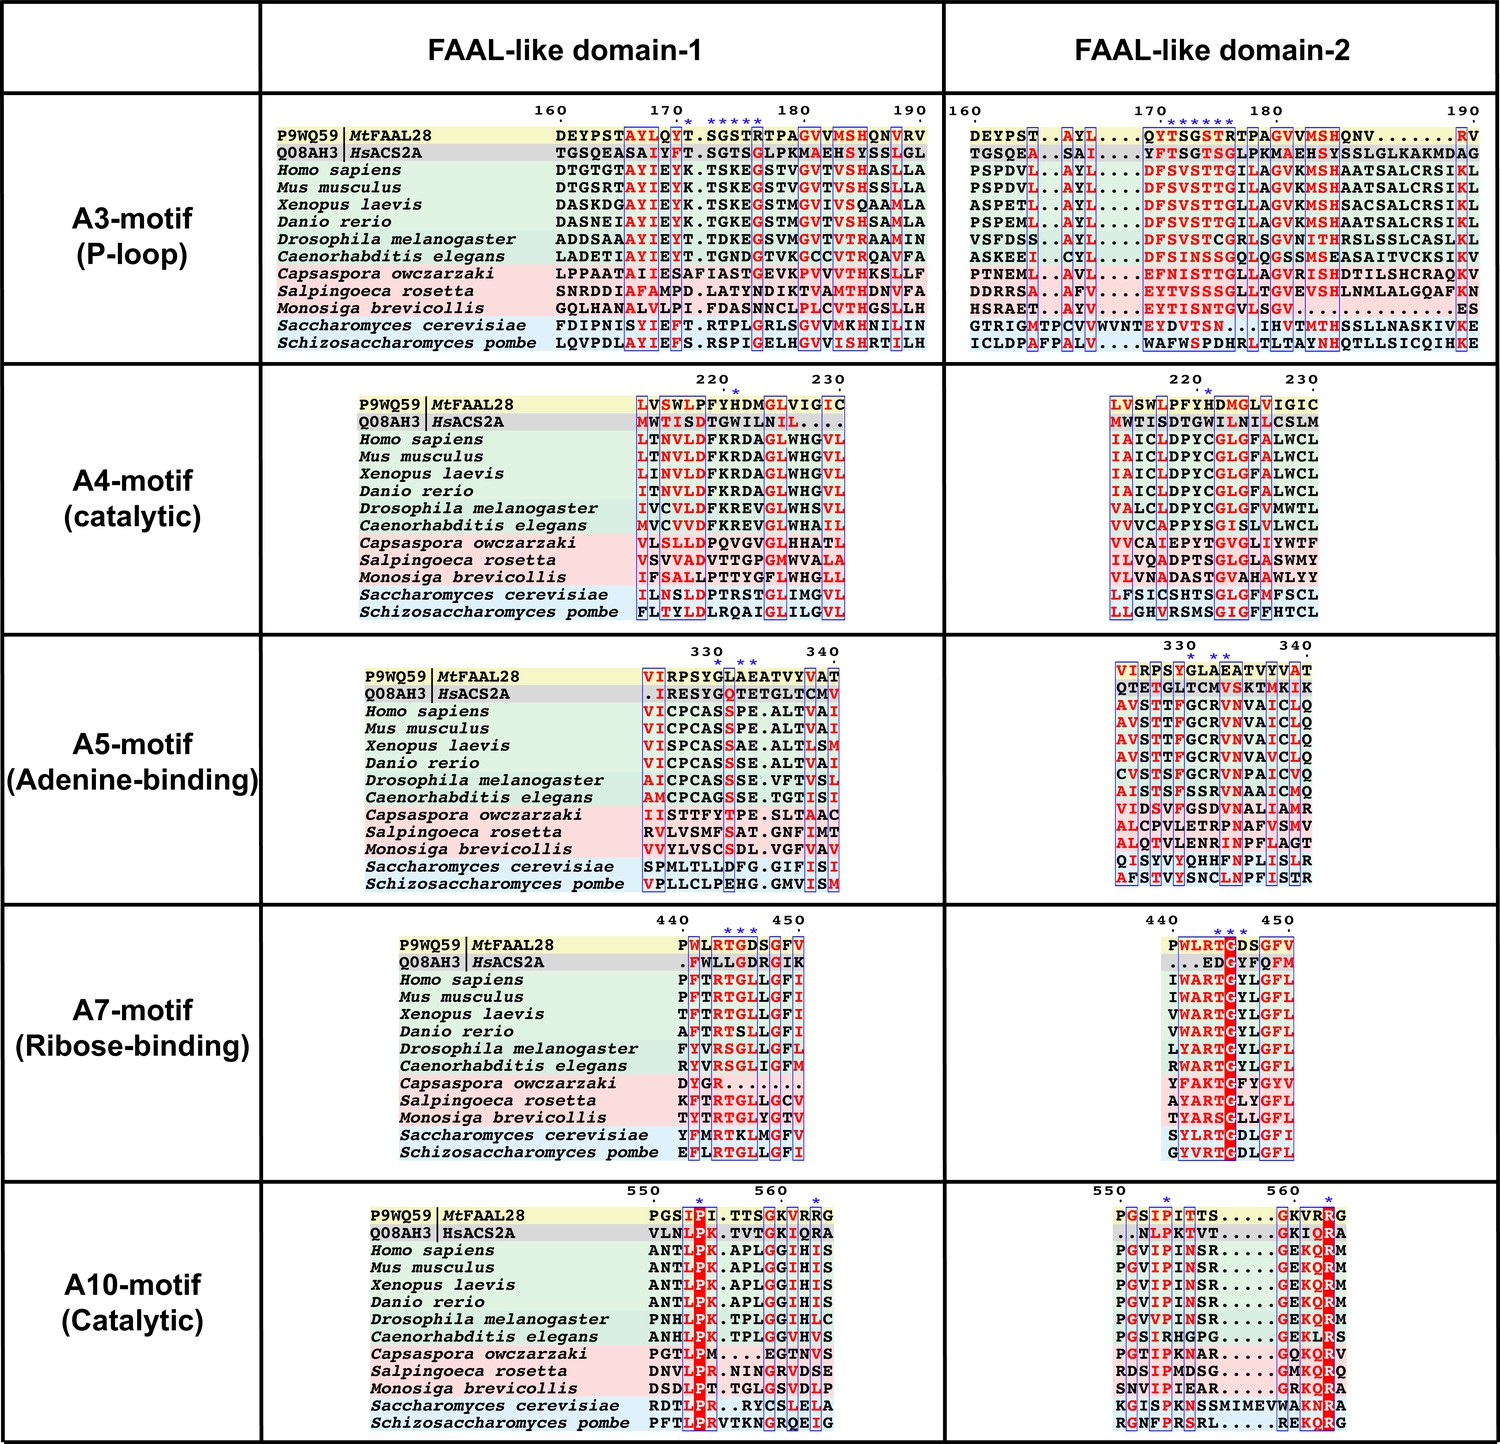
Conservation and diversification of ANL superfamily motifs in FLD1 and FLD2 of DIP2.
Some of the important motifs that are conserved across the ANL superfamily such as A3 (P-loop; important for binding phosphates), A4 (Catalytic; facilitating a nucleophilic substitution on acyl-AMP), A5 (Adenine-binding; stacks against the adenine ring), A7 (Ribose-binding; tethers the hydroxyls moieties of ribose in ATP), and A10 (Catalytic; important for acyl-AMP formation) are shown. The sequence alignment shows that all these important motifs show systematic changes that are unique to each FLD and different for fungal and animal FLDs. The crucial residues of the motifs are marked with blue star sign (*). Representative fatty acyl-AMP ligase (FAAL), fatty acyl-CoA ligase (FACL), animal FLDs, choanoflagellate FLDs, and fungal FLDs are highlighted with yellow, grey, green, red, and blue background colours, respectively.
Figure 1—figure supplement 2
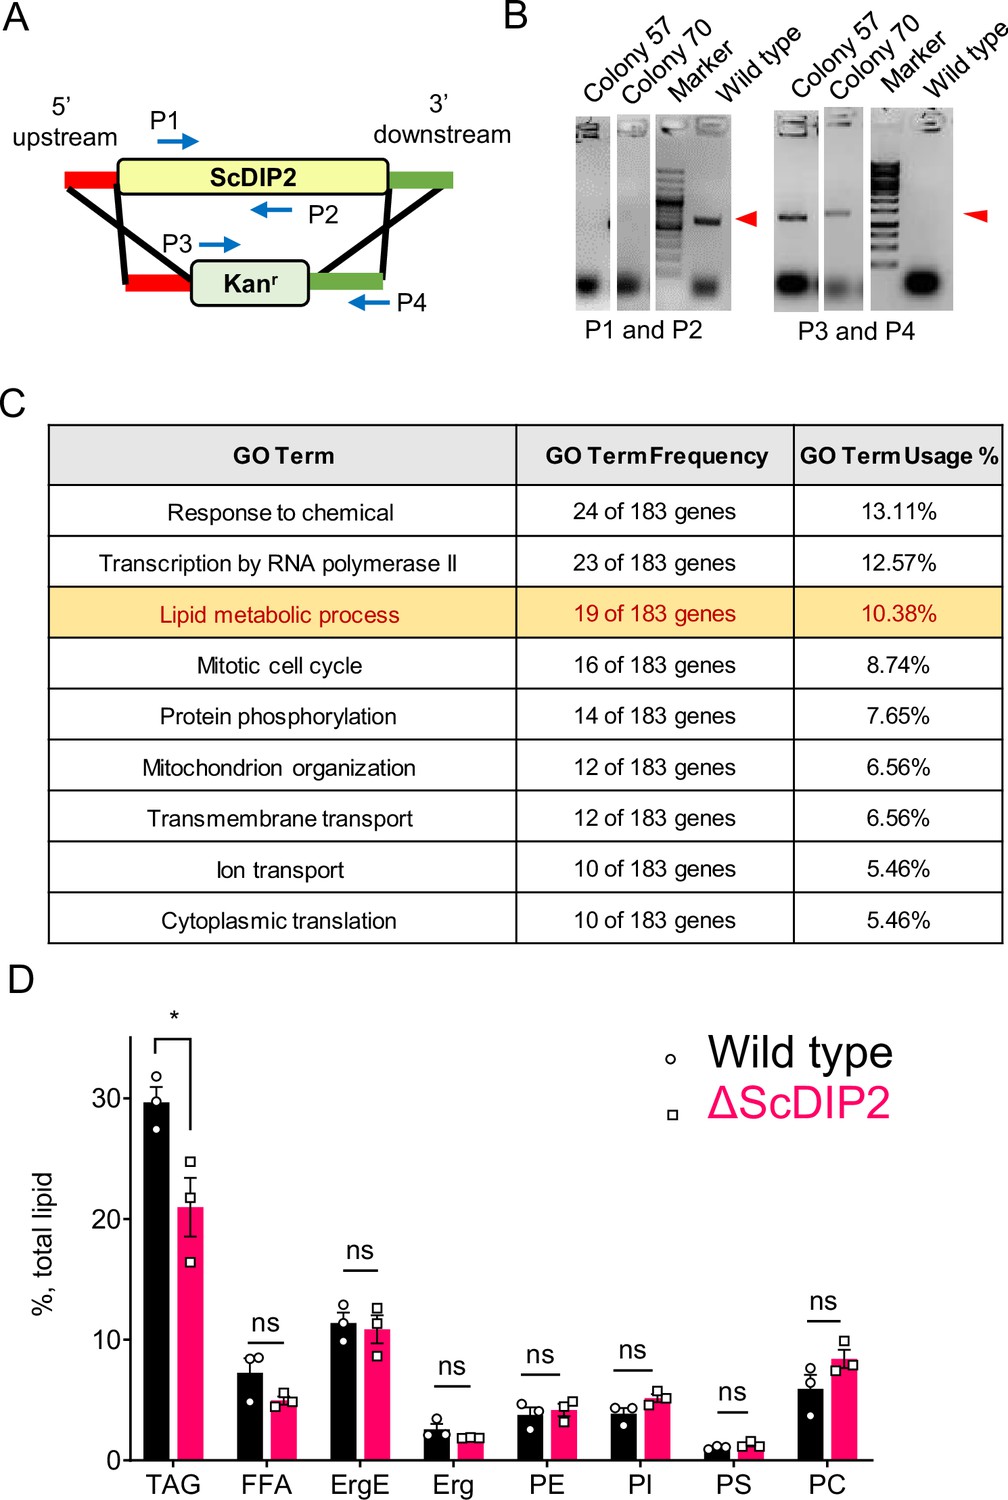
ScDIP2 null mutant generation and metabolic radiolabelling of total lipid pool of yeast.
(A) Schematic for homologous recombination-based gene knock-out strategy. P1 and P2: ScDIP2-specific primers, P3 and P4: primers to confirm gene replacement. (B) Polymerase-chain reaction (PCR)-based confirmation of ScDIP2 null mutant colonies (colony 57, YSM57 and colony 70, YSM70) using abovementioned primers. PCR product bands are indicated using red arrowhead. (C) Genetic interactors (both positive and negative) of ScDIP2 were classified according to the Gene ontology terms. Genes involved in lipid metabolism process are among the highest interacting partners. GO terms comprising up to 5% of total interactors are shown in the table (further description in Materials and methods). (D) Radio-TLC-based quantification of major membrane lipids show no significant change between wild-type and ∆ScDIP2 cells. Neutral lipid, TAG shows moderate but significant depletion in ∆ScDIP2 cells. All data are represented by the mean ± standard error of the mean (SEM) of at least three independent experiments. *p < 0.05; ns = not significant. DAG, diacylglycerol; TAG, triacylglycerol; Erg, ergosterol; ErgE, ergosterol esters; FFA, free fatty acids; PC, phosphotidylcholine; PE, phosphotidylethanolamine; PI, phosphatidylinositol; PS, phosphatidylserine.
-
Figure 1—figure supplement 2—source data 1
Uncropped labelled agarose gel images for confirmation of ScDIP2 null mutant lines shown in Figure 1—figure supplement 2A, B.
- https://cdn.elifesciences.org/articles/77665/elife-77665-fig1-figsupp2-data1-v2.pdf
-
Figure 1—figure supplement 2—source data 2
Full raw unedited files of Figure 1—figure supplement 2—source data 1.
- https://cdn.elifesciences.org/articles/77665/elife-77665-fig1-figsupp2-data2-v2.zip
-
Figure 1—figure supplement 2—source data 3
Quantification of major lipid classes from metabolic radiolabelling experiment in yeast shown in Figure 1—figure supplement 2D.
- https://cdn.elifesciences.org/articles/77665/elife-77665-fig1-figsupp2-data3-v2.xlsx
Figure 2 with 3 supplements

DIP2 regulates selective diacylglycerol (DAG) pools by facilitating their conversion to corresponding triacylglycerols (TAGs).
(A) Liquid chromatography–mass spectrometry (LC–MS) analysis of the ΔScDIP2 reveals a massive accumulation of C36:0 and C36:1 DAGs. Chemical structures of indicated DAGs are shown in the inset. (B) Genetic complementation of the mutant with native and galactose-inducible promoter-driven ScDIP2 expression. (C) Deletion of ScDIP2 resulted in depletion of TAGs. The decreased level of TAGs with various chain lengths in ∆ScDIP2 are shown as a linear gradient (n = 6) and normalized to the corresponding wild-type level (set at 100%). (D) Overexpression of ScDIP2 (GAL1 promoter) leads to accumulation of TAG species. The increased level of TAGs with various chain lengths in ScDIP2-OE is shown as a linear gradient (n = 6) and normalized to the corresponding wild-type level (set at 100%). (E) The DAG levels reduced significantly below the basal level upon overexpression of ScDIP2. All data are represented as mean ± standard error of the mean (SEM) (n ≥ 5; unpaired, two-tailed Student’s t-test; *p < 0.05; **p < 0.01; ***p < 0.001; ****p < 0.0001; ns = not significant). The fold change for each DAG species is indicated below the bar graphs. (F) An illustration summarizing the role of DIP2 in facilitating the conversion of chemically distinct DAG to TAG (depicted by respective chemical structures).
-
Figure 2—source data 1
Quantification of diacylglycerol (DAG) species from wild-type and ScDIP2 mutant yeast strains shown in Figure 2A.
- https://cdn.elifesciences.org/articles/77665/elife-77665-fig2-data1-v2.xlsx
-
Figure 2—source data 2
Quantification of diacylglycerol (DAG) species from genetically complemented yeast strains shown in Figure 2B.
- https://cdn.elifesciences.org/articles/77665/elife-77665-fig2-data2-v2.xlsx
-
Figure 2—source data 3
Quantification of triacylglycerol (TAG) species from wild-type and ScDIP2 mutant yeast strains shown in Figure 2C.
- https://cdn.elifesciences.org/articles/77665/elife-77665-fig2-data3-v2.xlsx
-
Figure 2—source data 4
Quantification of triacylglycerol (TAG) species from wild-type and ScDIP2 overexpression yeast strains shown in Figure 2D.
- https://cdn.elifesciences.org/articles/77665/elife-77665-fig2-data4-v2.xlsx
-
Figure 2—source data 5
Quantification of diacylglycerol (DAG) species from wild-type and ScDIP2 overexpression yeast strains shown in Figure 2E.
- https://cdn.elifesciences.org/articles/77665/elife-77665-fig2-data5-v2.xlsx
Figure 2—figure supplement 1
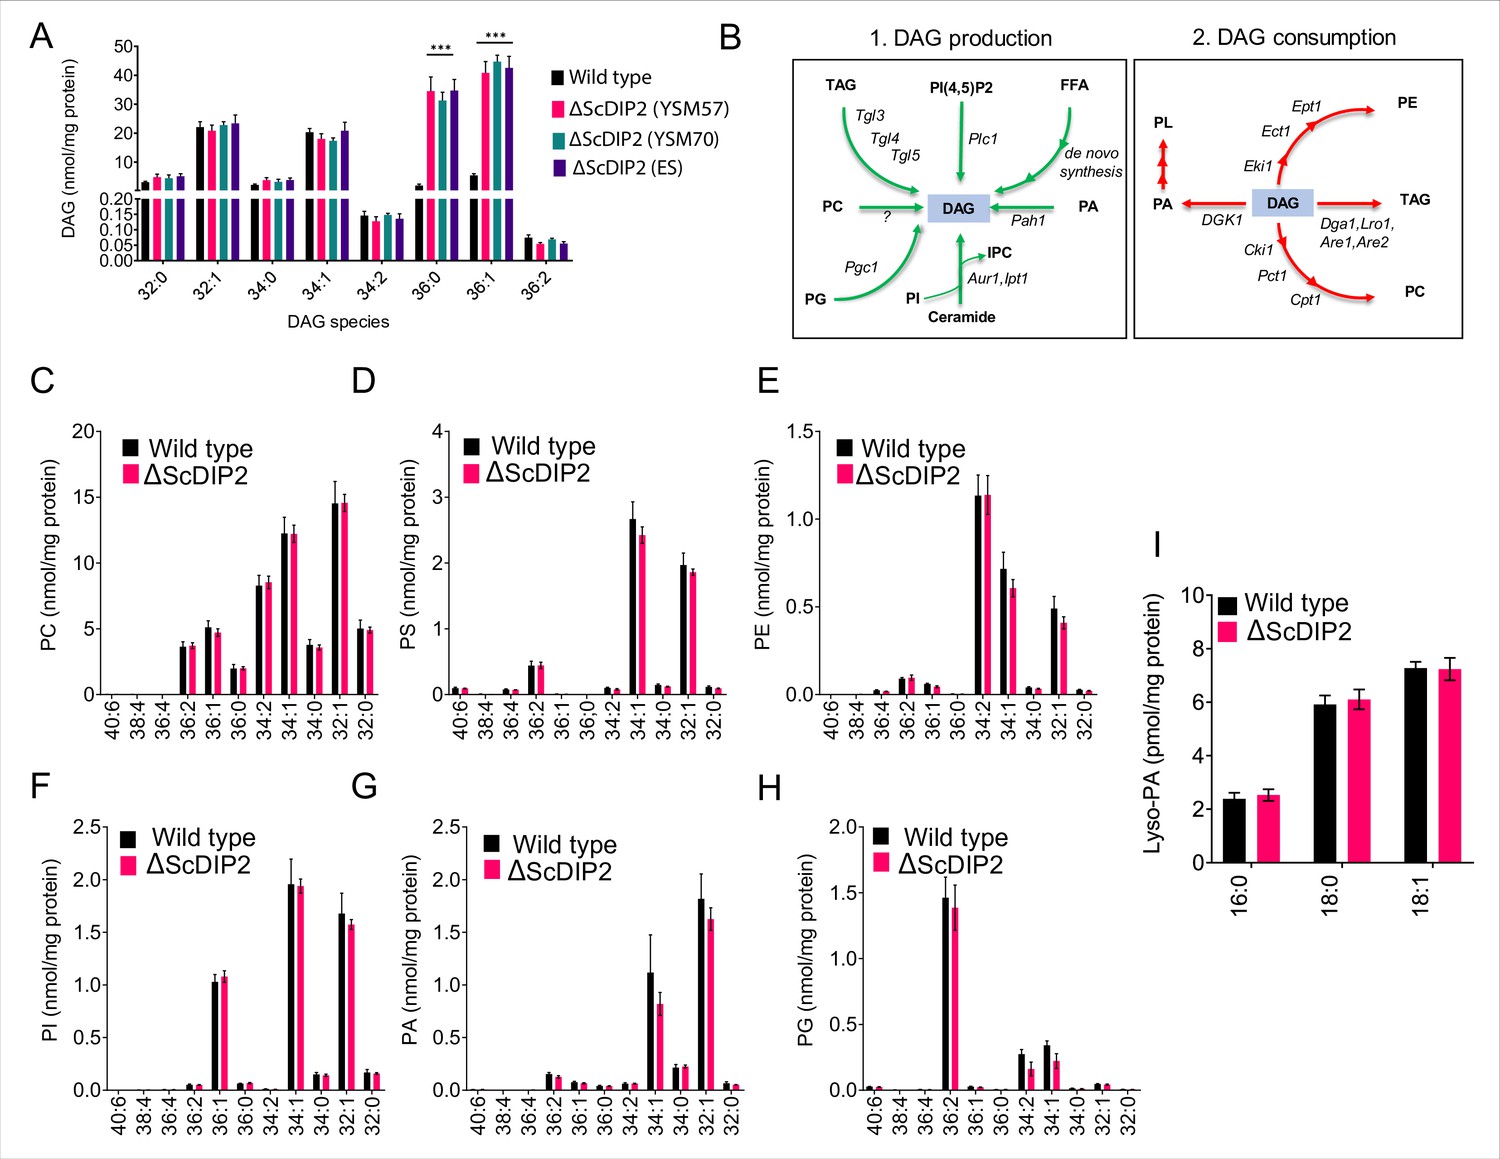
Liquid chromatography–mass spectrometry (LC–MS)-based lipid profiling of yeast strains.
(A) The accumulation of diacylglycerols (DAGs) is seen in multiple strains of mutant such as the mutant obtained from EUROSCARF (ES; strain Y01869) along with the two mutant colonies generated in the laboratory (∆ScDIP2 YSM57 and YSM70: in-house knock-out lines; YSM57 has been used for all other experiments in the current work) as shown in the LC–MS data. All data are represented as mean ± standard error of the mean (SEM). ***p < 0.001; unpaired, two-tailed Student’s t-test (n = 6). (B) A schematic showing multiple routes for DAG synthesis and utilization. The multiple arrowheads denote multistep processes. The corresponding enzyme names are written on the arrows in italics while the lipid metabolites are shown in bold fonts. (C–I) Major phospholipids and lipid precursors (PC, PS, PE, PI, PA, PG, and lyso-PA) quantified using LC–MS showed no significant change in ∆ScDIP2 cells while compared with wild-type cells. Specific lipid lengths (combined number of carbons in two acyl chains) are indicated on x-axis. Data are represented as mean ± SEM (n = 4). PA, phosphatidic acid; lyso-PA, lyso phosphatidic acid; PG, phosphatidylglycerol; IPC, inositolphosphoryl-ceramides; PI(4,5)P2, phosphatidylinositol 4,5-bisphosphate.
-
Figure 2—figure supplement 1—source data 1
Quantification of diacylglycerol (DAG) species from wild-type and three biological replicates of ScDIP2 mutant yeast strains shown in Figure 2—figure supplement 1A.
- https://cdn.elifesciences.org/articles/77665/elife-77665-fig2-figsupp1-data1-v2.xlsx
-
Figure 2—figure supplement 1—source data 2
Quantification of major phospholipid species from wild-type and ScDIP2 mutant yeast strains shown in Figure 2—figure supplement 1C-I.
- https://cdn.elifesciences.org/articles/77665/elife-77665-fig2-figsupp1-data2-v2.xlsx
Figure 2—figure supplement 2
Liquid chromatography–mass spectrometry (LC–MS)-based quantification of triacylglycerol (TAG) and its lipolysis products from yeast strains.
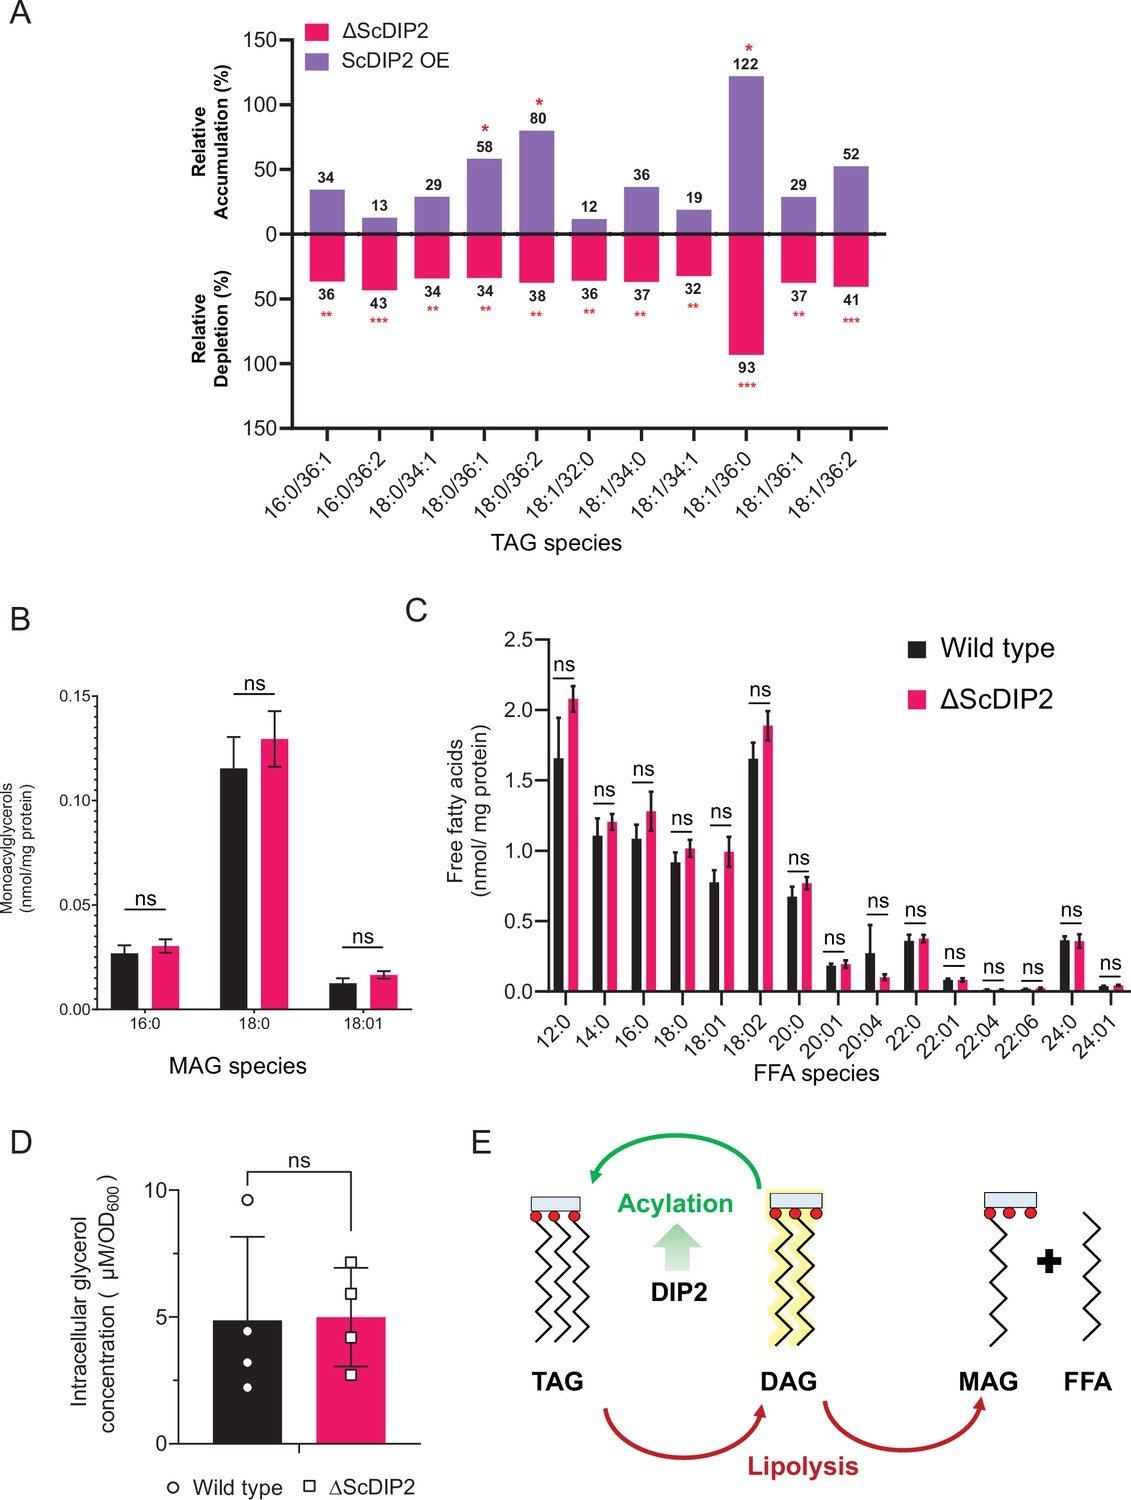
(A) Depletion and accumulation TAG upon deletion and overexpression of ScDIP2, respectively. Relative percent changes are shown numerically, normalized to respective wild-type TAG levels (n = 6; unpaired, two-tailed Student’s t-test; *p < 0.05; **p < 0.01; ***p < 0.001; ns = not significant). (B, C) Lipidomic analysis of monoacylglycerol (MAG) and free fatty acid (FFA) showed no significant changes in ∆ScDIP2 cells compared with wild type (n = 6; unpaired, two-tailed Student’s t-test; ns = not significant). (D) Estimation of intracellular glycerol concentration showed no significant changes in ∆ScDIP2 cells compared with wild type. Data are represented as mean ± standard deviation (SD) (n = 4; unpaired, two-tailed Student’s t-test; ns = not significant). (E) A schematic showing TAG as a metabolic source as well as the sink for the diacylglycerol (DAG) pool. DAGs can be directly converted to TAGs via acylation reaction, while TAG lipolysis can also result in the formation of DAG, which further breaks down into MAG and FFA. Data suggest that the loss of DIP2 results in insufficient acylation of DAG to produce TAGs.
-
Figure 2—figure supplement 2—source data 1
Quantification of free fatty acid (FFA) and monoacylglycerol (MAG) species from wild-type and ScDIP2 mutant yeast strains shown in Figure 2—figure supplement 2B, C.
- https://cdn.elifesciences.org/articles/77665/elife-77665-fig2-figsupp2-data1-v2.xlsx
-
Figure 2—figure supplement 2—source data 2
Quantification of intracellular glycerol concentration from wild-type and ScDIP2 mutant yeast strains shown in Figure 2—figure supplement 2D.
- https://cdn.elifesciences.org/articles/77665/elife-77665-fig2-figsupp2-data2-v2.xlsx
Figure 2—figure supplement 3
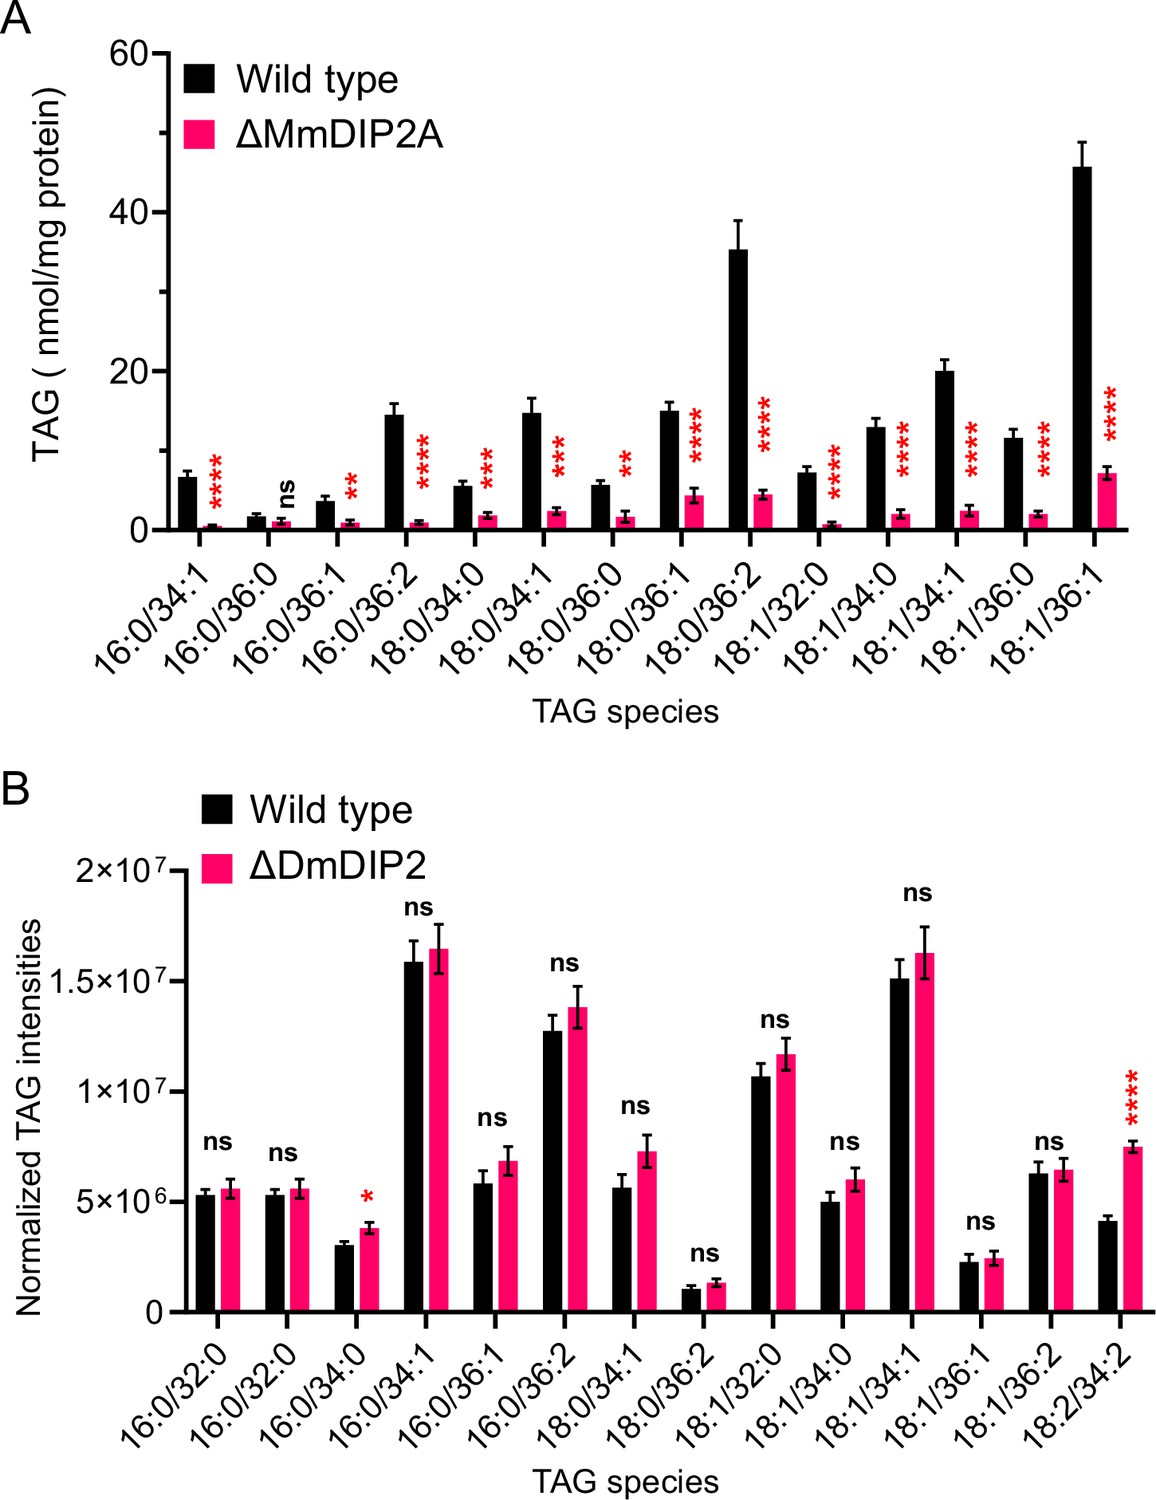
Liquid chromatography–mass spectrometry (LC–MS)-based triacylglycerol (TAG) quantification from DIP2 knock-out mouse embryonic stem cells and Drosophila.
(A) LC–MS-based quantification of TAGs from mouse embryonic stem cells (mES) shows that multiple TAGs have depleted in mutant, which is consistent with the multiple diacylglycerol (DAG) species that accumulated in mutant as compared to wild type. (B) TAGs from of 5-day-old adult Drosophila DIP2 mutant show no significant change as compared to wild type. Unlike yeast and mES, the lipids of Drosophila were isolated from the whole body which can neutralize the chances of observing any tissue-specific accumulation of TAG. Data are represented as mean ± standard error of the mean (SEM) (n > 5; unpaired, two-tailed Student’s t-test, *p < 0.05; **p < 0.01; ***p < 0.001; ****p < 0.0001; ns = not significant).
-
Figure 2—figure supplement 3—source data 1
Quantification of triacylglycerol (TAG) species from mouse embryonic stem cell lines shown in Figure 2—figure supplement 3A.
- https://cdn.elifesciences.org/articles/77665/elife-77665-fig2-figsupp3-data1-v2.xlsx
-
Figure 2—figure supplement 3—source data 2
Quantification of triacylglycerol (TAG) species from Drosophila lines shown in Figure 2—figure supplement 3B.
- https://cdn.elifesciences.org/articles/77665/elife-77665-fig2-figsupp3-data2-v2.xlsx
Figure 3 with 3 supplements
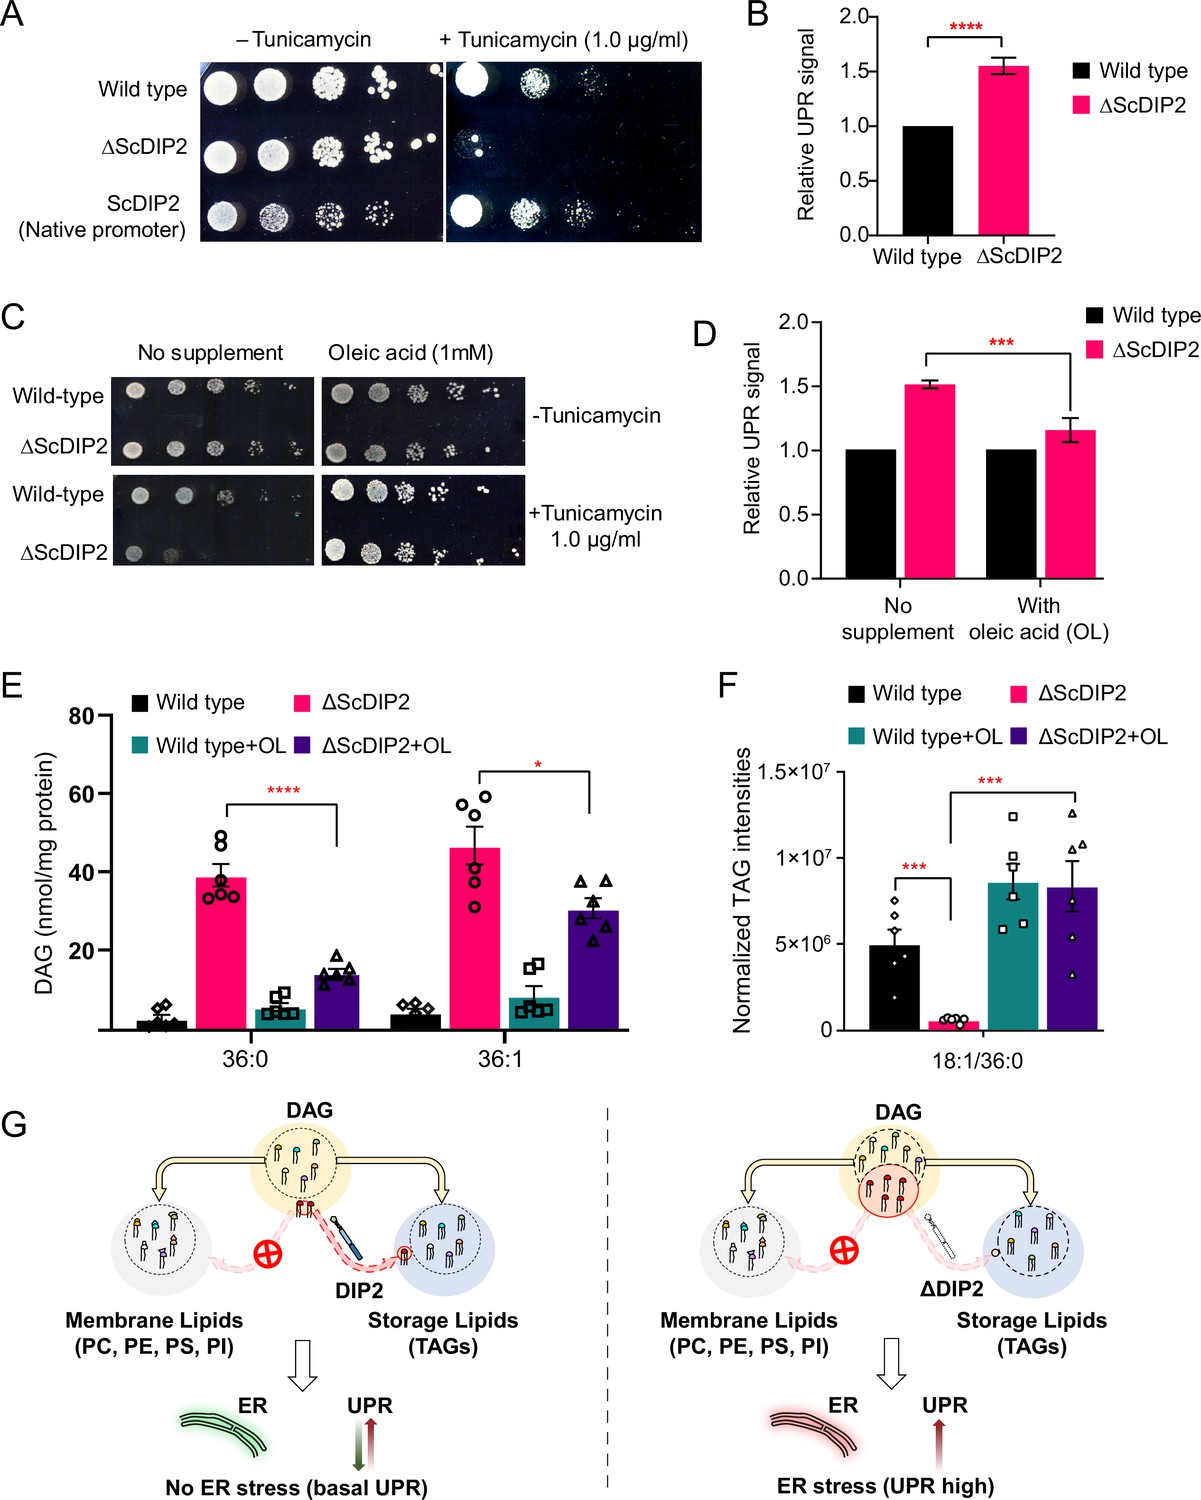
Restoration of selective diacylglycerol (DAG) level alleviates constitutive ER stress in DIP2 mutant yeast.
(A) Serial dilution assay of yeast with indicated strains shows that ∆ScDIP2 cells are sensitive to tunicamycin-induced ER stress. A representative image of the assay where expression of ScDIP2 using native promotor (genetic complementation) rescuing ER stress in ∆ScDIP2 is shown. (B) The 4X-UPRE reporter-based quantification of unfolded protein response (UPR) signalling level. The fractional increase in RFP signal intensity (UPR signal) measured in the mutant cells from the log phase relative to wild-type cells in the log phase is represented. Data are represented as mean ± standard deviation (SD) (unpaired, two-tailed Student’s t-test; n = 6; ****p > 0.0001). (C) Serial dilution assay with chemical supplementation of OL (1 mM) shows rescue of ER stress sensitivity in ΔScDIP2 cells. (D) 4X-UPRE reporter assay for wild type and ΔScDIP2 grown with 1 mM OL. The data show a reduction in UPR signal in ΔScDIP2 cells when supplemented with OL. Data are represented as mean ± SD (n = 4; unpaired, two-tailed Student’s t-test; ***p < 0.001). (E, F) The lipidomics analysis of the oleic acid supplemented ΔScDIP2 cells shows that the accumulated C36:0 and C36:1 DAG species are significantly reduced. Corresponding triacylglycerol (TAG) species (C18:1/36:0) is also normalized to basal level upon oleic acid supplementation. Data are represented as mean ± standard error of the mean (SEM) (n > 5; unpaired, two-tailed Student’s t-test; *p < 0.05; ***p < 0.001; ****p < 0.0001; ns = not significant). (G) A schematic representing the redirection of the selective DAG pool (red circle) to TAG by ScDIP2 helps in balancing the compositional diversity of DAG which is critical for ER homeostasis. Bulk DAG pool is utilized for membrane lipid and storage lipid (TAG) generation (shown via yellow arrow) while selective DAG pool can only be redirected to TAG (shown via red arrow).
-
Figure 3—source data 1
Quantification of relative unfolded protein response (UPR) signals from yeast strains shown in Figure 3B.
- https://cdn.elifesciences.org/articles/77665/elife-77665-fig3-data1-v2.xlsx
-
Figure 3—source data 2
Quantification of relative unfolded protein response (UPR) signals from yeast strains supplemented with oleic acid shown in Figure 3D.
- https://cdn.elifesciences.org/articles/77665/elife-77665-fig3-data2-v2.xlsx
-
Figure 3—source data 3
Quantification of diacylglycerol (DAG) species from yeast strains supplemented with oleic acid shown in Figure 3E.
- https://cdn.elifesciences.org/articles/77665/elife-77665-fig3-data3-v2.xlsx
-
Figure 3—source data 4
Quantification of triacylglycerol (TAG) species from yeast strains supplemented with oleic acid shown in Figure 3F.
- https://cdn.elifesciences.org/articles/77665/elife-77665-fig3-data4-v2.xlsx
Figure 3—figure supplement 1
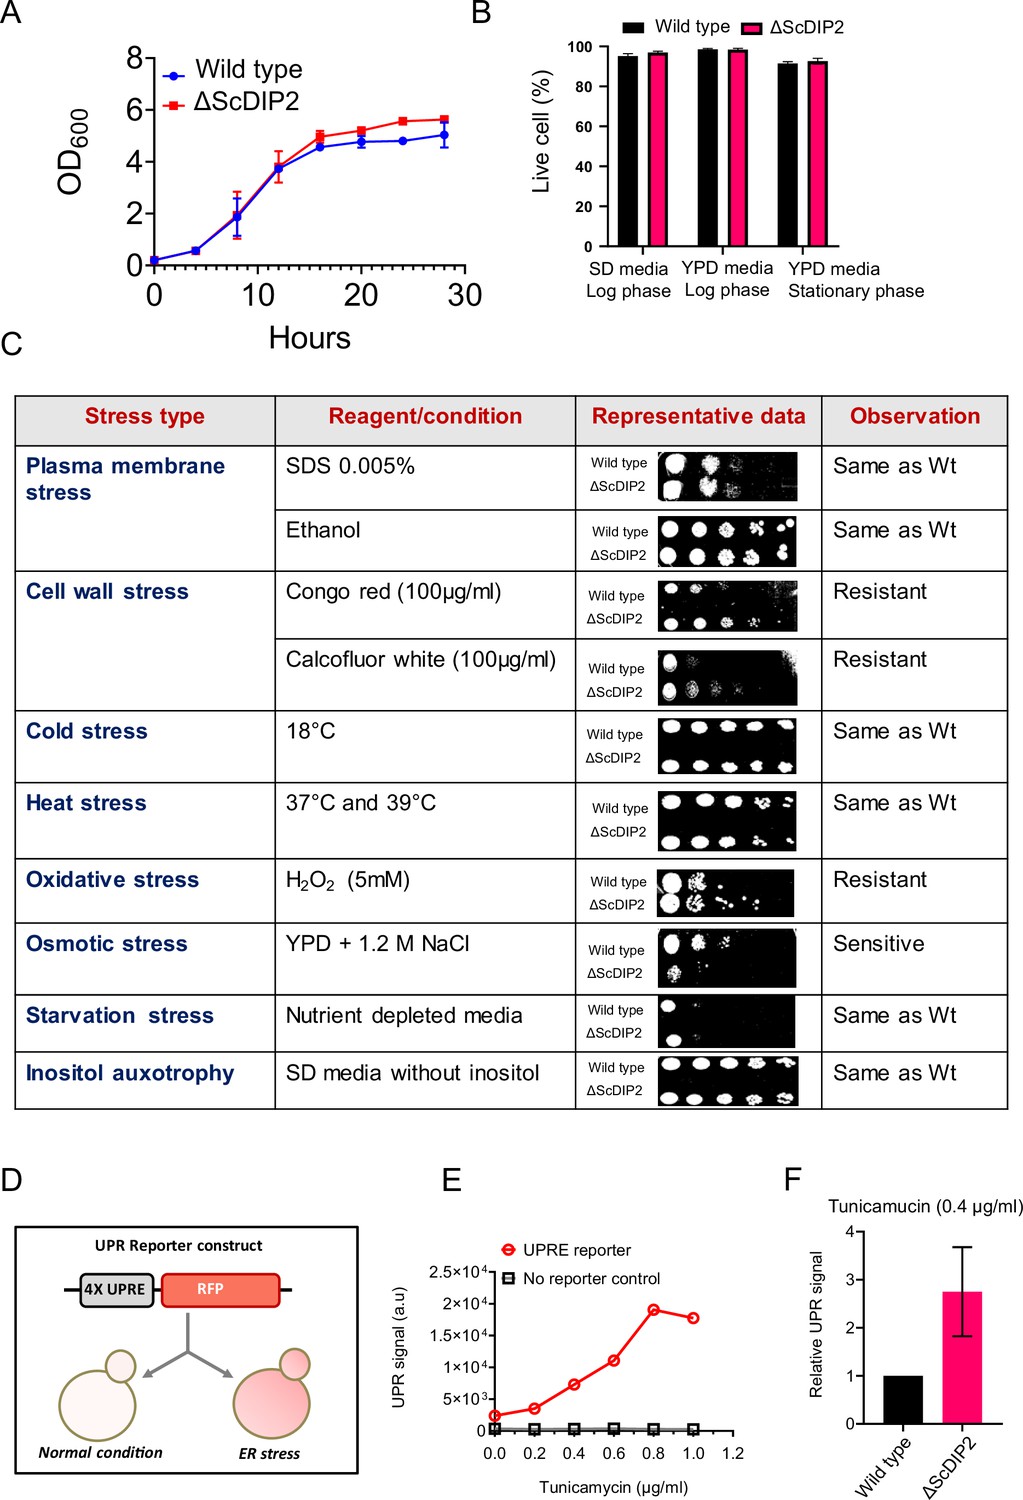
Growth phenotype and stress responses by ∆ScDIP2 cells.
(A, B) Deletion of ScDIP2 shows no growth defect as demonstrated using the growth curve and cell viability assay. Growth curve of wild type and ∆ScDIP2 strain was generated at 30°C, in SD media (n = 3) and cell viability assay was performed in different growth phases and growth media (n = 300, triplicate). (C) Stress phenotype screening using spot dilution assay is shown. Growth of ∆ScDIP2 cells was compared with wild-type cells in indicated stress conditions. Experiments were repeated for a minimum of three times and representative data are shown. (D) A graphical representation of UPRE reporter assay is shown. Cells harbouring 4xUPRE-RFP (mCherry) plasmid express a basal level of RFP in normal condition while, any stimuli that activates unfolded protein response (UPR) pathway, will amplify RFP expression. (E) Fluorescence intensity of RFP was measured using fluorescence-activated cell sorting (FACS), which shows increase in signal intensity with increasing tunicamycin concentration in log-phase yeast cells harbouring the reporter plasmid. (F) The signal intensity from the reporter plasmid in ∆ScDIP2 cells when treated with tunicamycin at concentration of 0.4 µg/ml is shown and compared to the signal output from wild-type cells (mean ± standard deviation [SD]; n = 3).
-
Figure 3—figure supplement 1—source data 1
Growth curve assay for wild-type and ScDIP2 mutant yeast strains shown in Figure 3—figure supplement 1A.
- https://cdn.elifesciences.org/articles/77665/elife-77665-fig3-figsupp1-data1-v2.xlsx
-
Figure 3—figure supplement 1—source data 2
Cell viability assay for wild-type and ScDIP2 mutant yeast strains shown in Figure 3—figure supplement 1B.
- https://cdn.elifesciences.org/articles/77665/elife-77665-fig3-figsupp1-data2-v2.xlsx
-
Figure 3—figure supplement 1—source data 3
Validation of UPRE reporter assay shown in Figure 3—figure supplement 1E, F.
- https://cdn.elifesciences.org/articles/77665/elife-77665-fig3-figsupp1-data3-v2.xlsx
Figure 3—figure supplement 2
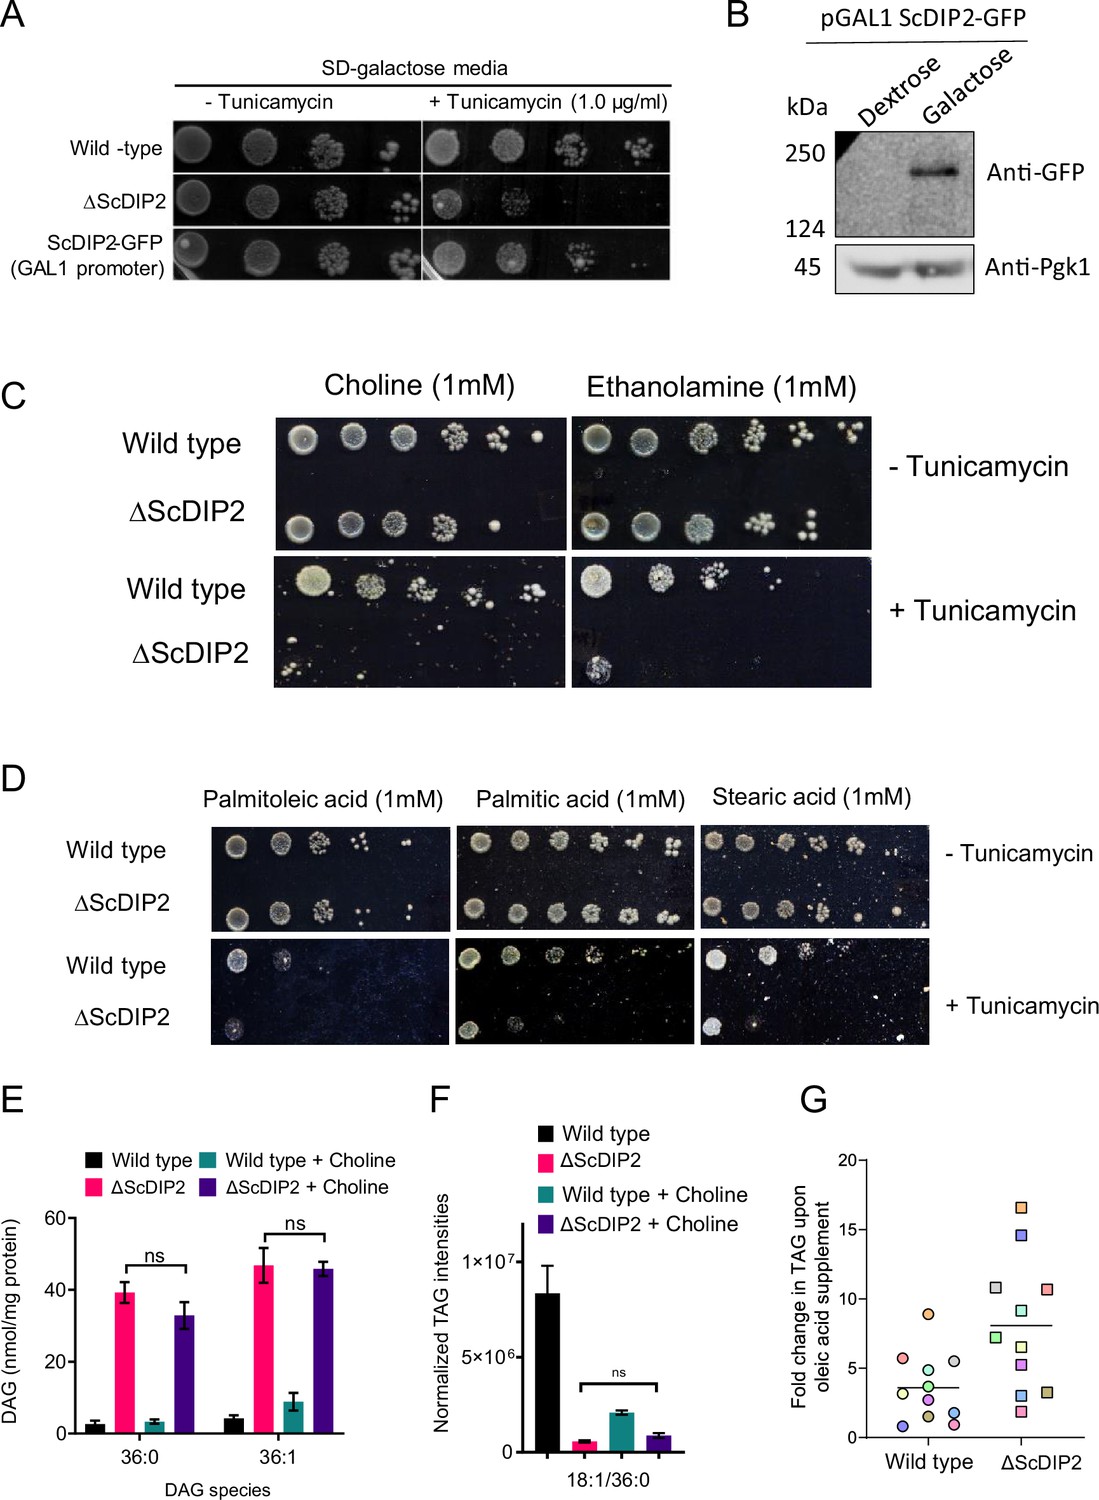
Genetic complementation and chemical supplementation assay.
(A) Genetic complementation of tunicamycin-mediated ER stress sensitivity in ΔScDIP2 with galactose-inducible (GAL1 promoter) ScDIP2-GFP expression. (B) Western blot image is showing the full-length ScDIP2-GFP expression in galactose-supplemented growth media. Pgk1 is used as the loading control. (C) Screening for ER stress rescue by supplementing media with different phospholipid biosynthesis precursors like choline and ethanolamine. (D) Screening for ER stress rescue by supplementing with physiologically abundant fatty acids, indicated in the images. (E, F) No changes in selective diacylglycerol (DAG) and triacylglycerol (TAG) levels were observed when ∆ScDIP2 cells were supplemented with choline, which is known to redirect DAG pool to phosphatidylcholine synthesis. Data are represented as mean ± standard error of the mean (SEM) (n > 5; unpaired, two-tailed Student’s t-test; ns = not significant). (G) Fold increase in TAG production upon OL supplementation in wild-type and ∆ScDIP2 cells. Each data point denotes different TAG species (colour coded).
-
Figure 3—figure supplement 2—source data 1
Uncropped labelled western blot images showing the expression of full-length ScDIP2 protein under GAL1 promoter in yeast shown in Figure 3—figure supplement 2B.
- https://cdn.elifesciences.org/articles/77665/elife-77665-fig3-figsupp2-data1-v2.pdf
-
Figure 3—figure supplement 2—source data 2
Full raw unedited files of Figure 3—figure supplement 2—source data 1.
- https://cdn.elifesciences.org/articles/77665/elife-77665-fig3-figsupp2-data2-v2.zip
-
Figure 3—figure supplement 2—source data 3
Quantification of diacylglycerol (DAG) species from yeast strains supplemented with choline shown in Figure 3—figure supplement 2E.
- https://cdn.elifesciences.org/articles/77665/elife-77665-fig3-figsupp2-data3-v2.xlsx
-
Figure 3—figure supplement 2—source data 4
Quantification of triacylglycerol (TAG) species from yeast strains supplemented with oleic acid shown in Figure 3—figure supplement 2F.
- https://cdn.elifesciences.org/articles/77665/elife-77665-fig3-figsupp2-data4-v2.xlsx
-
Figure 3—figure supplement 2—source data 5
Quantification of fold change in triacylglycerol (TAG) species upon oleic acid supplementation in wild-type and ScDIP2 null mutant yeast shown in Figure 3—figure supplement 2G.
- https://cdn.elifesciences.org/articles/77665/elife-77665-fig3-figsupp2-data5-v2.xlsx
Figure 3—figure supplement 3
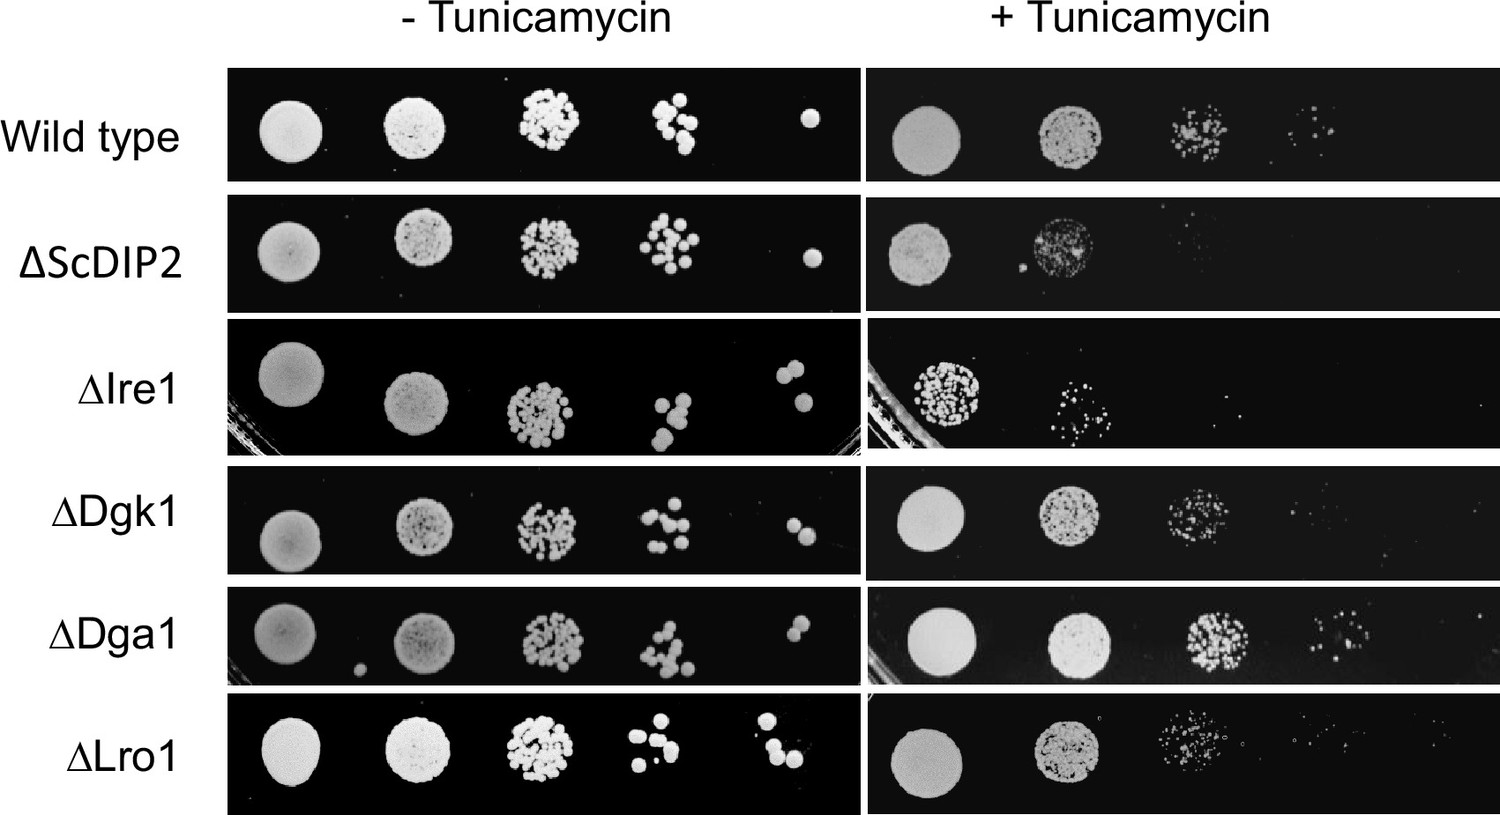
ER stress sensitivity assay with null mutants of bulk diacylglycerol (DAG) metabolizing enzymes.
The null mutant strains for canonical DAG metabolizing enzymes, viz. ∆Dga1, ∆ Lro1, and ∆Dgk1 (procured from EUROSCARF collection center, Germany) show less or no sensitivity to tunicamycin treatment unlike ∆ScDIP2 strain (n = 3, Tunicamycin concentration = 1.0 µg/ml). Null mutant of Ire1 (∆Ire1), the sensor protein of ER stress, serves as a positive control in this assay.
Figure 4
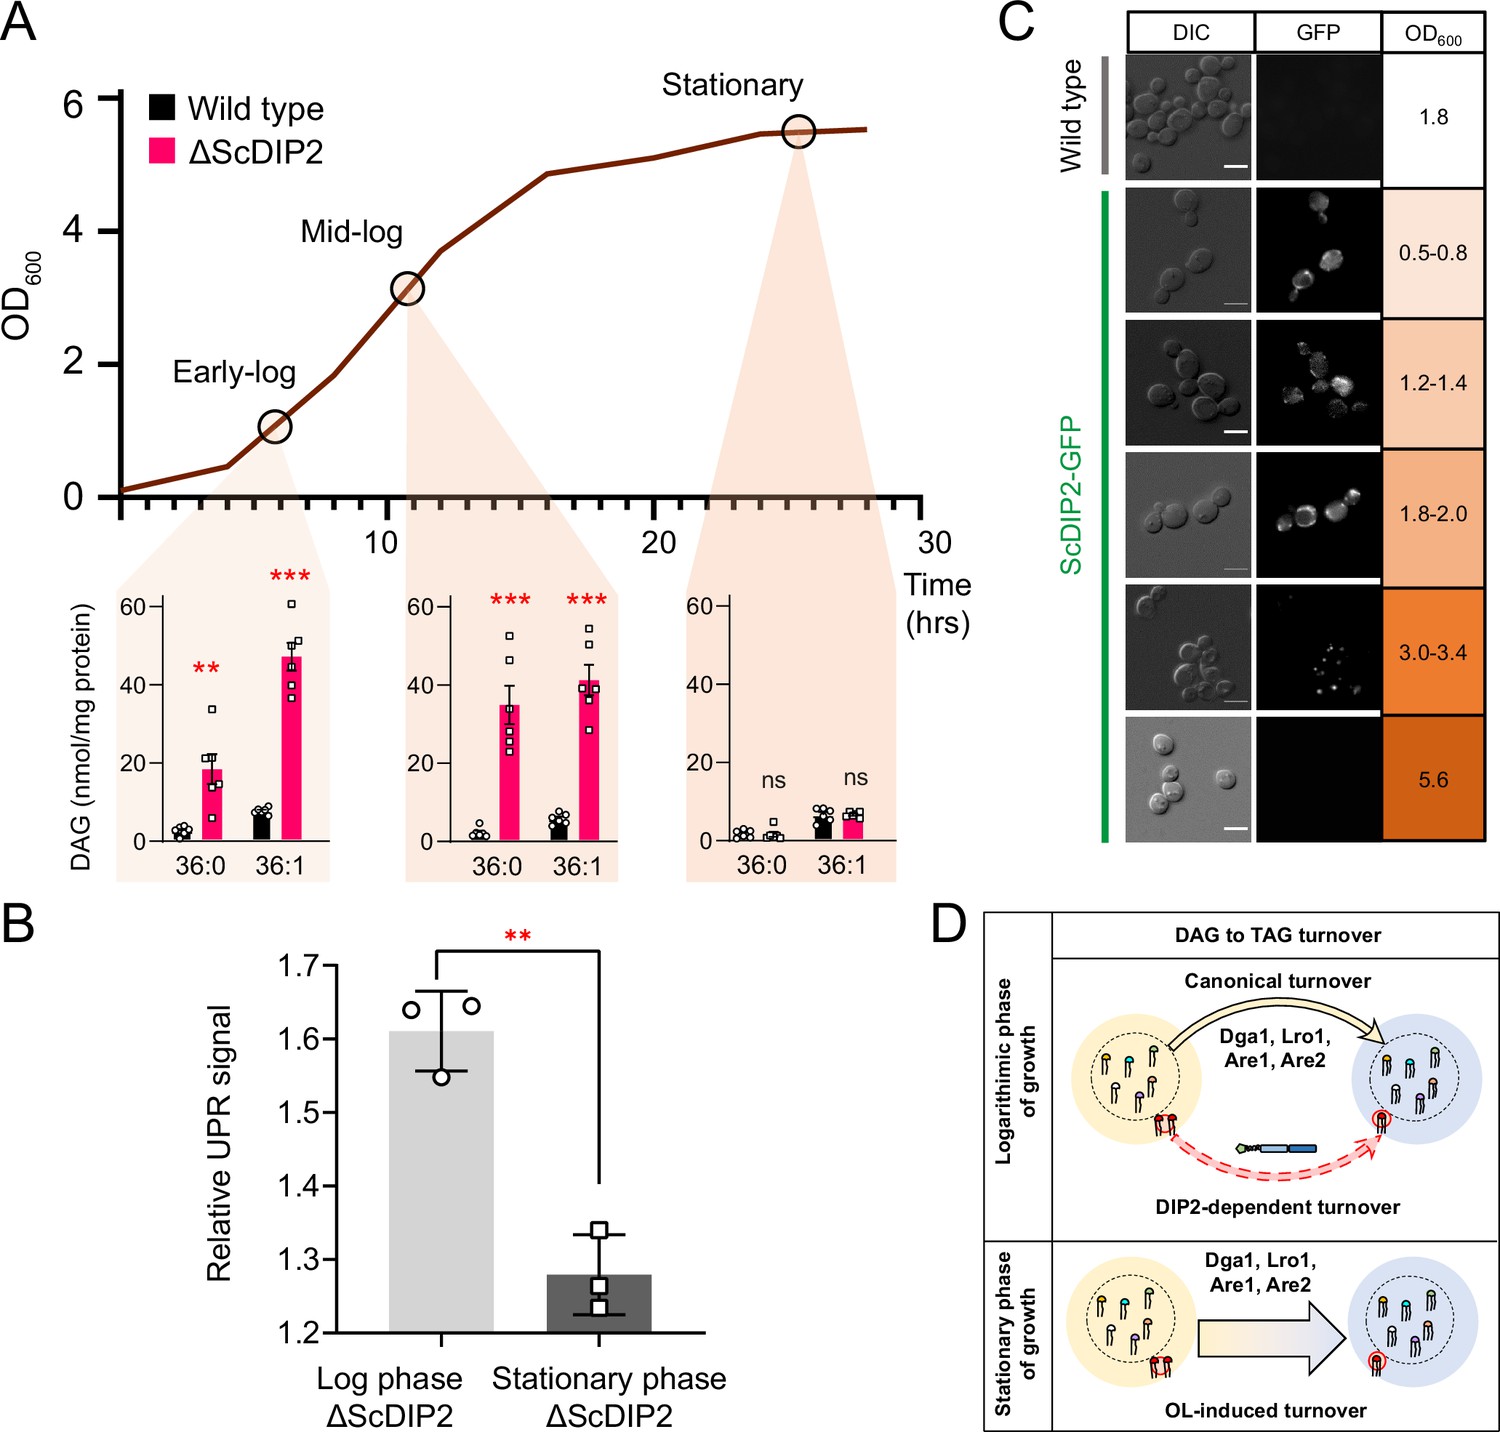
Growth phase-dependent regulation of selective diacylglycerols (DAGs) by DIP2 ensures ER homeostasis in yeast.
(A) Tracking the level of selective DAGs in ΔScDIP2 cells across the growth phases: early-log, mid-log, and stationary phase. Data are represented as mean ± standard error of the mean (SEM) (n > 5; unpaired, two-tailed Student’s t-test; **p < 0.01; ***p < 0.001; ns = not significant). (B) The 4X-UPRE reporter assay shows a reduced level of unfolded protein response (UPR) activation when ΔScDIP2 cells are grown till the stationary phase. Data represent fold change in ΔScDIP2 relative to respective wild-type control (mean ± standard deviation [SD]; n = 3; unpaired, two-tailed Student’s t-test; **p < 0.01). (C) Growth-phase-dependent expression of ScDIP2 is shown via the fluorescence signal of GFP tagged with C-terminal ScDIP2 in its genomic locus. Scale bar = 5 µm. (D) A schematic showing DIP2-dependent selective DAG to triacylglycerol (TAG) turnover is operative in the log phase while a surge in OL-induced TAG biosynthesis during the stationary phase restores the overall DAG level.
-
Figure 4—source data 1
Quantification of diacylglycerol (DAG) species from wild-type and ScDIP2 mutant yeast strains across growth phases shown in Figure 4A.
- https://cdn.elifesciences.org/articles/77665/elife-77665-fig4-data1-v2.xlsx
-
Figure 4—source data 2
Quantification of relative unfolded protein response (UPR) signals from yeast strains at stationary phase shown in Figure 4B.
- https://cdn.elifesciences.org/articles/77665/elife-77665-fig4-data2-v2.xlsx
Figure 5 with 1 supplement
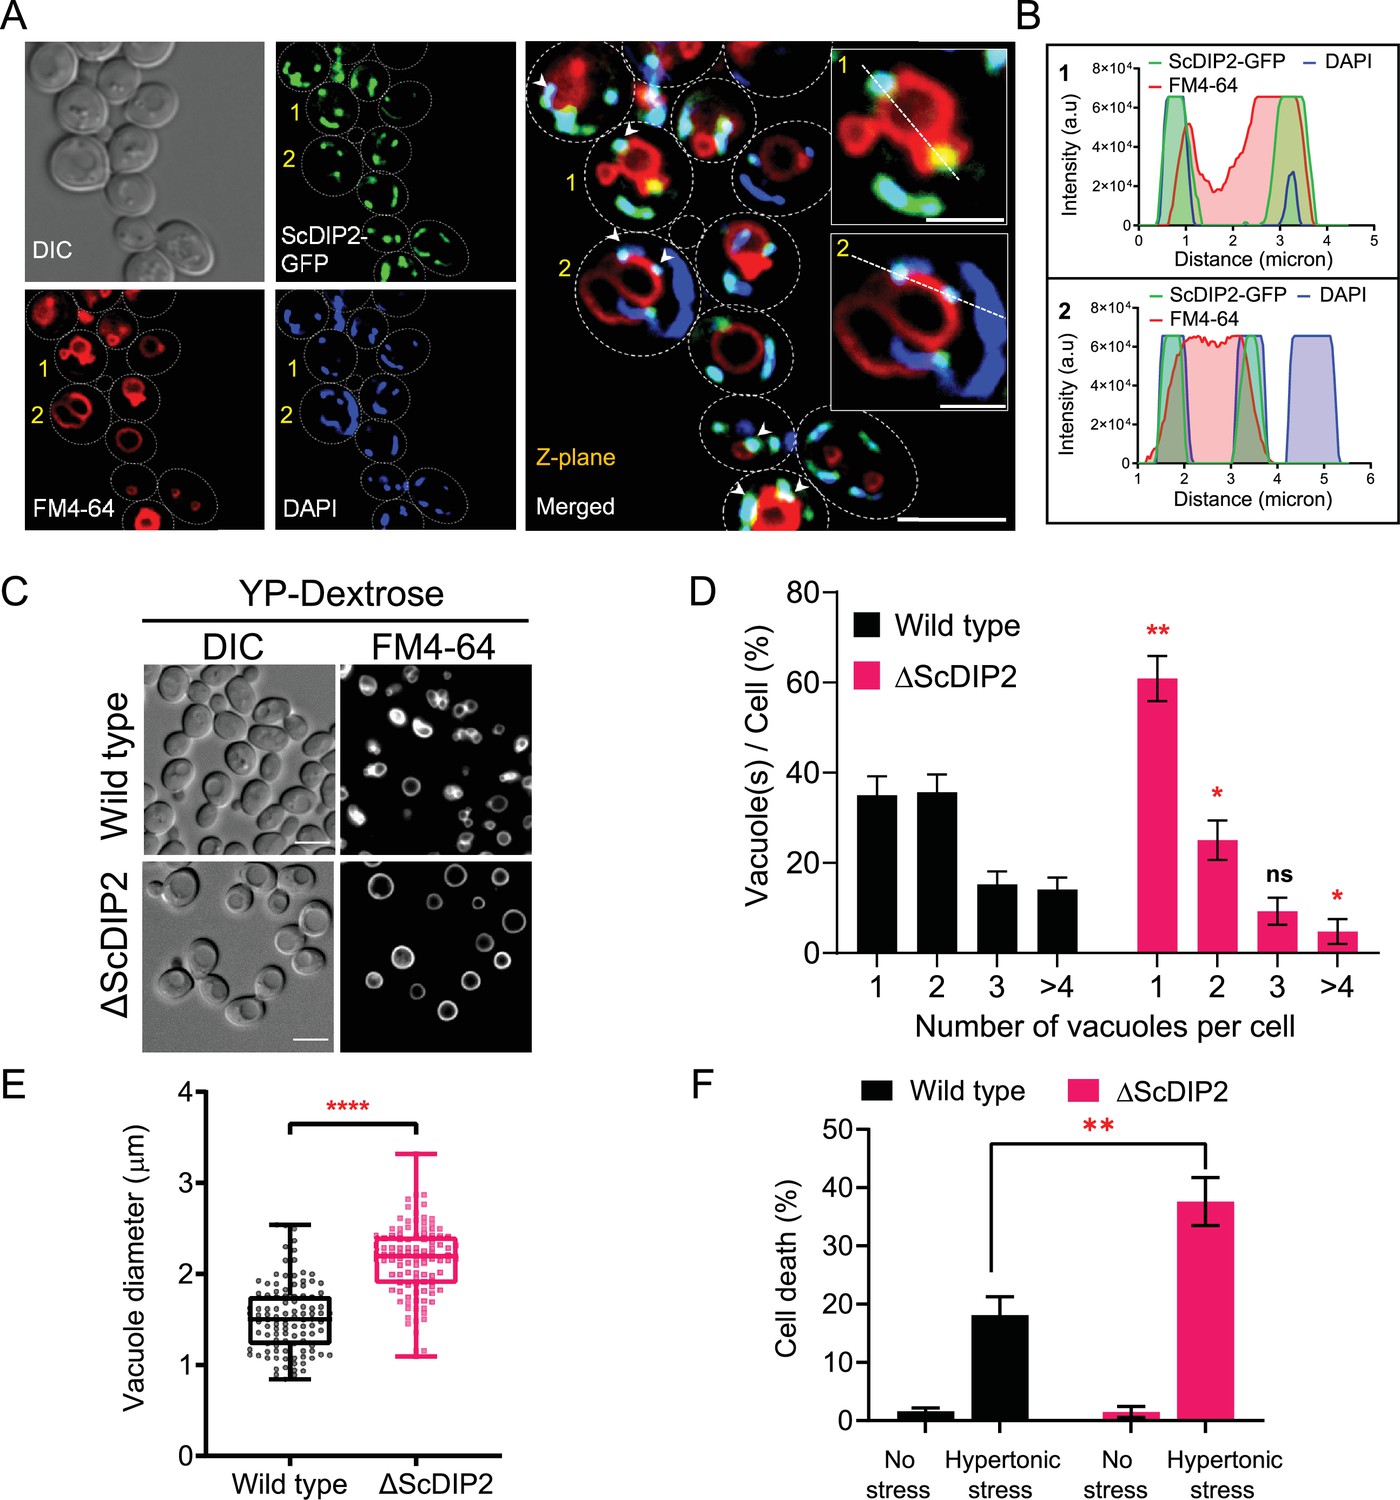
Loss of DIP2 results in aberrant vacuolar fusion leading to failure in osmoadaptation in yeast.
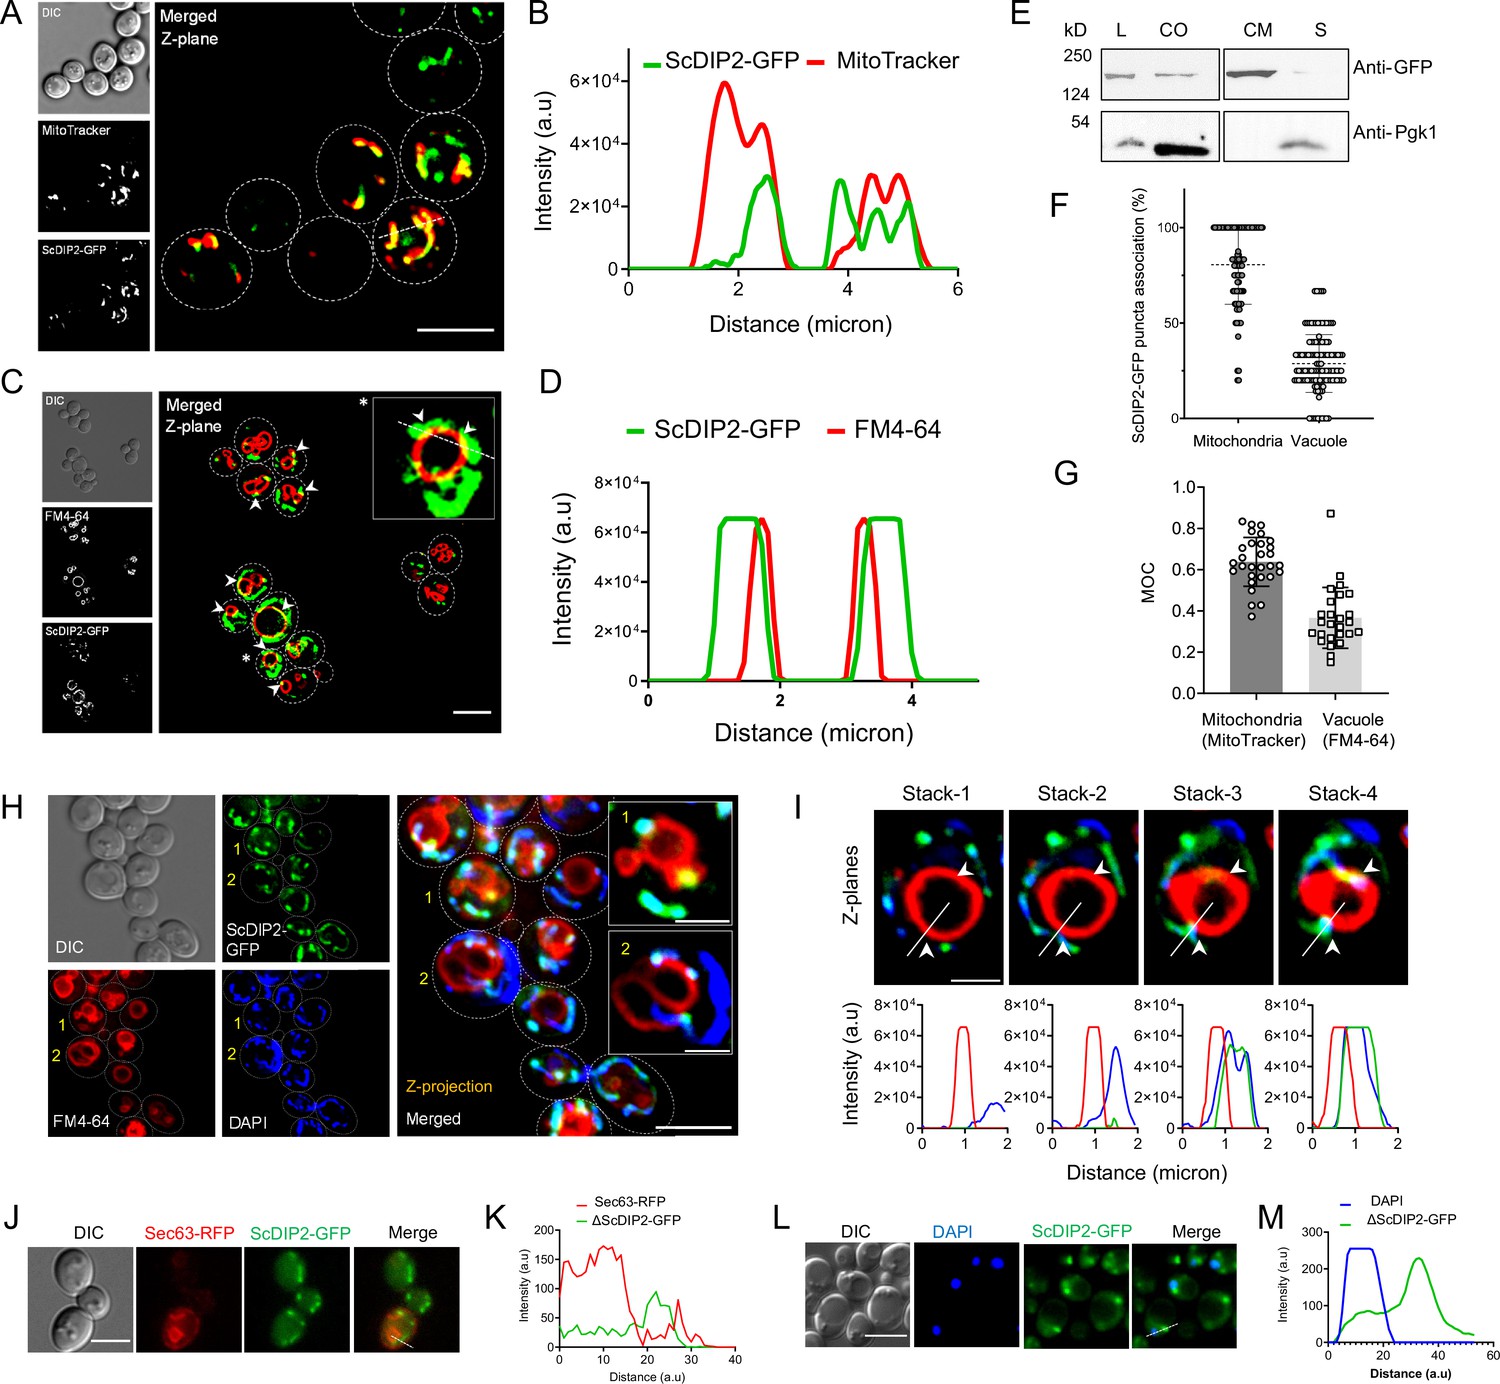
(A) Live cell imaging of ScDIP2-GFP knock-in yeast strain for subcellular localization study. ScDIP2-GFP cells (at logarithmic growth phase) are stained with vacuole membrane marker, FM4-64 (red) dye and DAPI to visualize mitochondrial DNA. The images were obtained using a widefield epifluorescence microscope. The enlarged images of representative cells (marked with 1 and 2) are shown in inset. Single plane image is displayed, and white arrowhead denotes the colocalization sites. Cell outlines were drawn over DIC images. Scale bar represents 5 µm for merged image and 2 µm for inset images. (B) Line scan of signal intensity along the white lines shown in inset images of (A), marked with 1 and 2. (C) Representative images of vacuole morphology of the indicated strains grown till log phase in YP-dextrose media. Cells were stained with FM4-64. Scale bar = 5 µm. (D) Quantitation of vacuoles observed per cell of indicated strains imaged in (C). Data were represented as mean ± standard deviation (SD) (n = 3; >100 cells per strain; unpaired, two-tailed Student’s t-test; *p < 0.05; **p < 0.01; ns, not significant). (E) Vacuole diameter has been measured by line scan analysis of FM4-64-stained vacuoles from yeast cells at the budding stage. Each dot represents a single vacuole per cell (>100 cells per strain) and box and whisker plot representing diameters (in µm) of the largest vacuole of indicated strains. Data are representative of at least three independent experiments (unpaired, two-tailed Student’s t-test; ****p < 0.0001). (F) ΔScDIP2 and wild-type cells are subjected to hypertonic stress and then stained with trypan blue for assessing cell viability. Data are represented as mean ± SD (n > 3; unpaired, two-tailed Student’s t-test; *p < 0.05; **p < 0.01; ****p < 0.0001; ns = not significant).
-
Figure 5—source data 1
Percentage of yeast cell harbouring different numbers of vacuoles in logarithmic phase of growth shown in Figure 5D.
- https://cdn.elifesciences.org/articles/77665/elife-77665-fig5-data1-v2.xlsx
-
Figure 5—source data 2
Quantification of vacuole diameter from wild-type and ScDIP2 mutant yeast strains shown in Figure 5E.
- https://cdn.elifesciences.org/articles/77665/elife-77665-fig5-data2-v2.xlsx
-
Figure 5—source data 3
Percentage of yeast cell death upon hypertonic stress shown in Figure 5F.
- https://cdn.elifesciences.org/articles/77665/elife-77665-fig5-data3-v2.xlsx
Figure 5—figure supplement 1
Subcellular localization study of ScDIP2.
(A) Colocalization of ScDIP2-GFP signal with mitochondria marker, MitoTracker (red). Single Z-plane image is displayed. Scale bar = 5 µm. (B) Line scan analysis along the dotted line to show significant colocalization of fluorescence signal from indicated channels shown in (A). (C) Colocalization of ScDIP2-GFP signal with vacuole membrane marker, FM4-64 (red). An enlarged image of a representative cell (marked with *) is shown in inset. Single plane image is displayed, and white arrowhead denotes the colocalization sites. Scale bar = 5 µm. (D) Line scan analysis along the dotted line to show significant colocalization of fluorescence signal from indicated channels shown in (C). (E) Western blot of the fractionated lysate from ScDIP2-GFP knock-in cells. ScDIP2-GFP was probed using anti-GFP antibody and Pgk1 is a control cytosolic protein. L = total lysate, CO = crude organelle lysate (devoid of cell wall debris and nuclei), CM = crude membrane fraction, S = membrane less supernatant. The data show the association of ScDIP2-GFP with crude membrane fraction. (F) Quantification of colocalization between ScDIP2-GFP puncta and vacuole and mitochondria marker signal. Data are mean ± standard deviation (SD); n > 100. (G) Manders’ overlap coefficients (MOCs) measuring the degree of colocalization between ScDIP2-GFP and vacuole and mitochondria marker are reported. Data are mean ± SD; n > 28. (H) Localization of ScDIP2-GFP relative to vacuole membrane marker (FM4-64) and mitochondrial DNA marker (DAPI). The maximum intensity projection from five Z-planes is shown for all the channels. The enlarged images of representative cells (marked with 1 and 2) are shown in inset. Scale bar represents 5 µm for merged image and 2 µm for inset images. (I) Visualization of ScDIP2 association with vacuole membrane marker (FM4-64) and mitochondrial DNA marker (DAPI) across different focal planes. Four representative Z-stacks (0.5 µm per step) and corresponding line profiles across the white line are shown. White arrowhead indicates the site of mitochondria–vacuole contact which is also overlapped with ScDIP2-GFP signal. (J, L) ScDIP2-GFP shows no significant subcellular association with ER marker, Sec63-RFP, and nuclear stain, DAPI (stained after fixing the cells). Scale bar = 5 µm. (K, M) Line scan analysis along the dotted line shows no significant colocalization of fluorescence signal from indicated channels shown in (J) and (L).
-
Figure 5—figure supplement 1—source data 1
Uncropped labelled western blot images showing subcellular association of ScDIP2 protein shown in Figure 5—figure supplement 1E.
- https://cdn.elifesciences.org/articles/77665/elife-77665-fig5-figsupp1-data1-v2.pdf
-
Figure 5—figure supplement 1—source data 2
Full raw unedited files of Figure 5—figure supplement 1—source data 1.
- https://cdn.elifesciences.org/articles/77665/elife-77665-fig5-figsupp1-data2-v2.zip
-
Figure 5—figure supplement 1—source data 3
Quantification of colocalization between ScDIP2-GFP puncta and vacuole and mitochondria marker signal shown in Figure 5—figure supplement 1F, G.
- https://cdn.elifesciences.org/articles/77665/elife-77665-fig5-figsupp1-data3-v2.xlsx
Figure 6
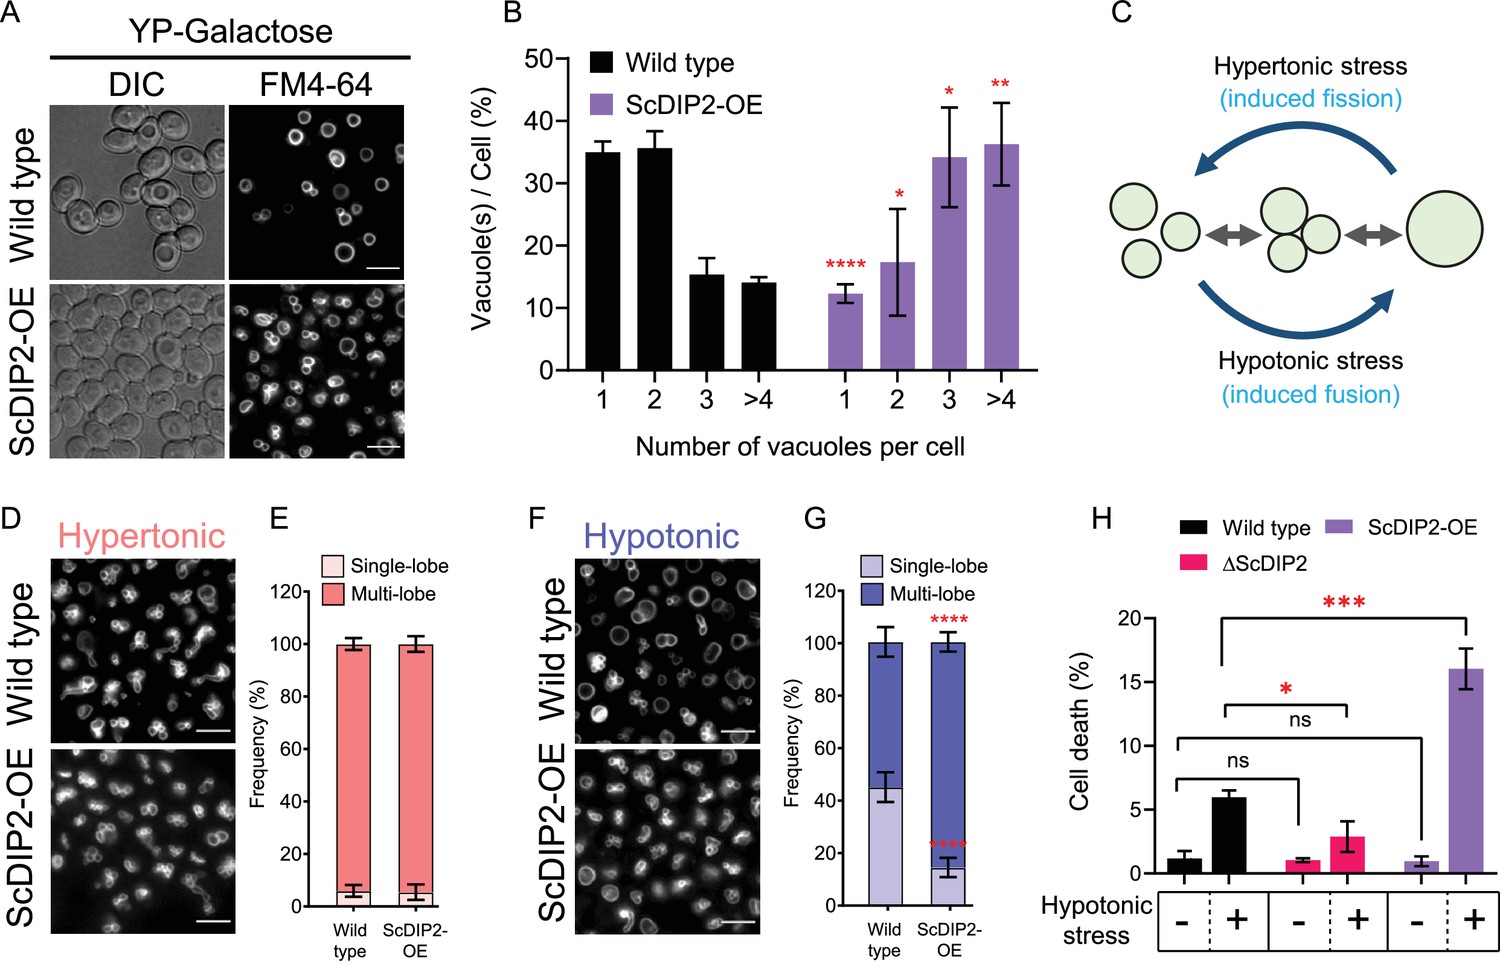
Depletion of diacylglycerol (DAG) upon DIP2 overexpression destabilizes vacuolar fusion–fission homeostasis in yeast.
(A) Representative images of vacuole morphology in indicated strains grown till log phase in YP-galactose media. Vacuoles are stained with FM4-64. Scale bar = 5 µm. (B) Quantitation of vacuoles observed per cell of indicated strains imaged in (A). Data are represented as mean ± standard deviation (SD) (n = 3; >100 cells per strain; unpaired, two-tailed Student’s t-test; *p < 0.05; **p < 0.01; ****p < 0.0001; ns = not significant). (C) A schematic depicting the vacuole fusion–fission assay utilizing the osmotic response of yeast to different concentrations of NaCl. (D, F) Representative images of FM4-64-stained vacuoles from indicated strains after treating with hypertonic (YPD + 0.4 M NaCl) condition for 10 min, followed by hypotonic (water) condition for 10 min. (E, G) Quantification of vacuoles in hypertonic conditions (shades of pink) and hypotonic conditions (shades of blue). Frequency percentage of single-lobe (fused) and multi-lobe (fragmented) vacuole per cell from indicated strains imaged in D and F. Cells with three or more vacuoles were combined as ‘multi-lobe vacuole’ set (n = 6, >100 cells per strain; unpaired, two-tailed Student’s t-test; ****p < 0.0001). (H) Indicated strains are subjected to hypotonic shock by incubating in water for 10–15 min and then stained with trypan blue for cell viability. Data are represented as mean ± SD (n > 3: two-tailed Student’s t-test; *p < 0.05; **p < 0.01; ***p < 0.001; ****p < 0.0001; ns = not significant).
-
Figure 6—source data 1
Percentage of yeast cell harbouring different numbers of vacuoles in logarithmic phase of growth shown in Figure 6B.
- https://cdn.elifesciences.org/articles/77665/elife-77665-fig6-data1-v2.xlsx
-
Figure 6—source data 2
Quantification of induced vacuole fusion in yeast strains shown in Figure 6E, G.
- https://cdn.elifesciences.org/articles/77665/elife-77665-fig6-data2-v2.xlsx
-
Figure 6—source data 3
Percentage of yeast cell death upon hypotonic stress shown in Figure 6H.
- https://cdn.elifesciences.org/articles/77665/elife-77665-fig6-data3-v2.xlsx
Figure 7 with 2 supplements
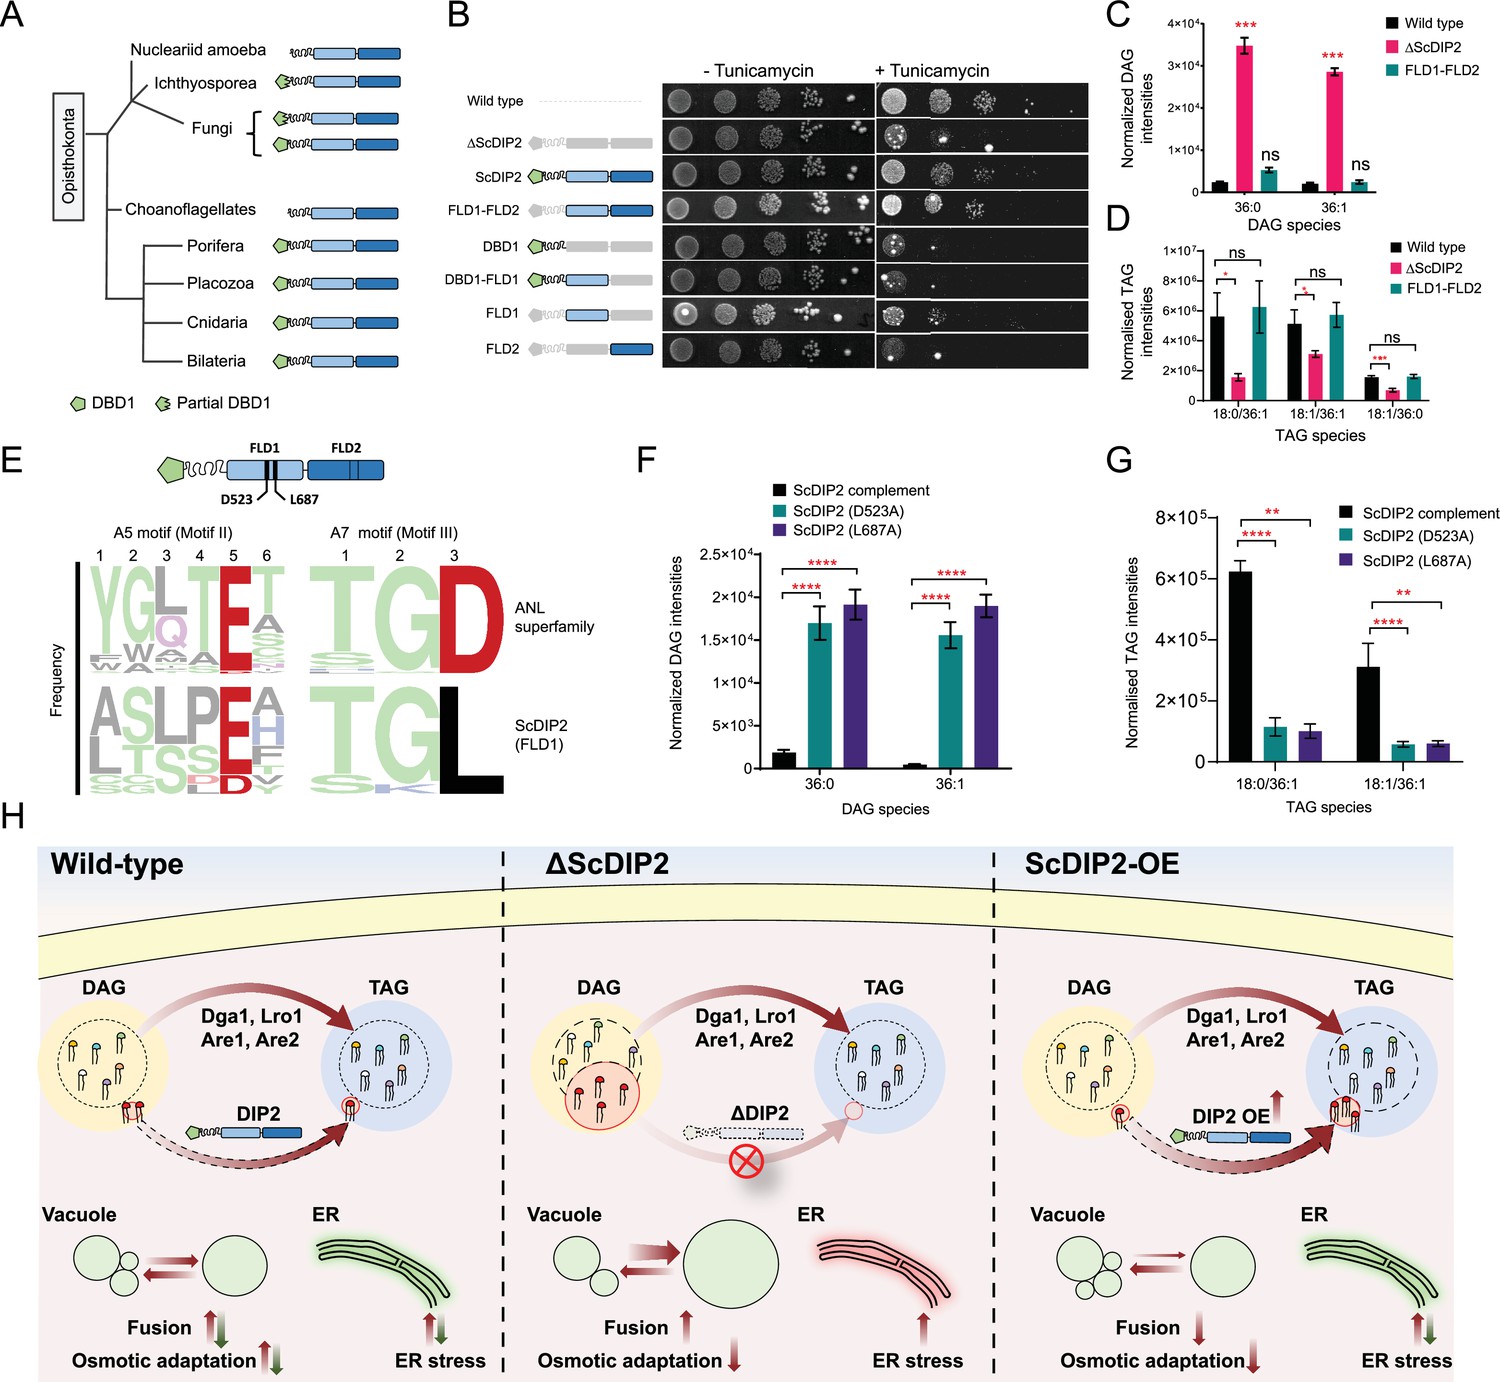
Catalytic activity along with tandem FLD-didomain organization is critical for the function of DIP2.
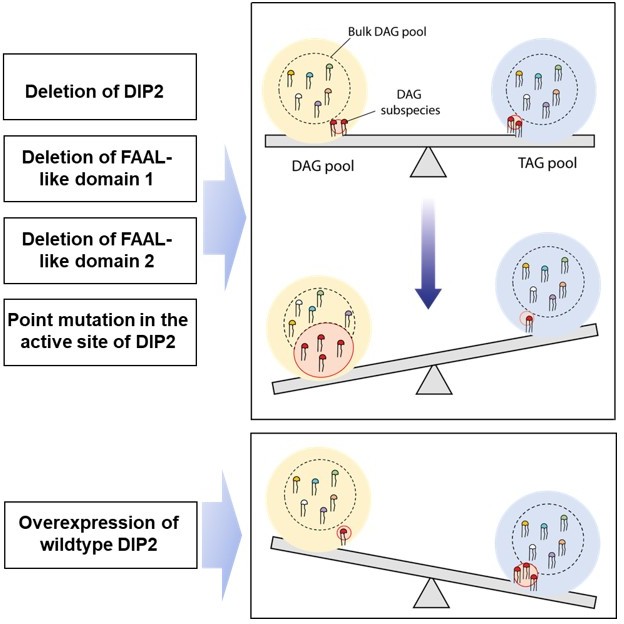
(A) A graphical representation of the phylogenetic distribution of DIP2 across Opisthokonta showing conservation of FLD1–FLD2 didomain. (B) Tunicamycin-mediated ER stress rescue assay by complementing ΔScDIP2 with different domain-truncated versions of ScDIP2. Deleted domains are shown in grey colour. (C, D) Increased diacylglycerols (DAGs) in ΔScDIP2 are restored to wild-type level upon complementation with FLD1–FLD2 didomain, along with an increase in related triacylglycerol (TAG) levels. (E) Graphical representation to show the crucial residues of adenylation motifs of ScDIP2 FLD1 and sequence logo images depicting the conservation of adenylation motifs of ANL superfamily in DIP2. (F) Adenylation mutants of ScDIP2 are not able to restore accumulated DAGs to basal level due to failure in fatty-acyl activation. (G) Selective TAG level is not restored to wild-type level upon expression of adenylation mutants of ScDIP2. Data are represented as mean ± standard error of the mean (SEM) (n > 5; unpaired, two-tailed Student’s t-test; *p < 0.05; **p < 0.01; ***p < 0.001; ****p < 0.0001; ns = not significant). (H) A model depicting the role of DIP2-mediated selective DAG regulation for cellular homeostasis and adaptation. The DAG subspecies, representing a small fraction (shown in red head colours) of the total DAG pool, are regulated without altering the levels of bulk DAGs (multiple head colours) by redirecting them to TAGs (shown in red) which is facilitated by DIP2 in yeast. Such a regulation of minor DAG subspecies is essential for optimal vacuole (shown as green circle) fusion–fission dynamics leading to efficient osmotic adaptation and maintenance of ER homeostasis. In ΔScDIP2, the accumulation of these minor DAG subspecies results in ER stress, increased vacuole fusion and reduced osmotic adaptation capability. On the contrary, in ScDIP2-OE, these DAGs are depleted below the basal level, resulting in restored ER stress but reduced vacuole fusion along with the defect in osmotic adaptation.
-
Figure 7—source data 1
Quantification of diacylglycerol (DAG) species from FLD-didomain complemented yeast strains shown in Figure 7C.
- https://cdn.elifesciences.org/articles/77665/elife-77665-fig7-data1-v2.xlsx
-
Figure 7—source data 2
Quantification of triacylglycerol (TAG) species from FLD-didomain complemented yeast strains shown in Figure 7D.
- https://cdn.elifesciences.org/articles/77665/elife-77665-fig7-data2-v2.xlsx
-
Figure 7—source data 3
Quantification of diacylglycerol (DAG) species from yeast strains complemented with adenylation mutants of ScDIP2 shown in Figure 7F.
- https://cdn.elifesciences.org/articles/77665/elife-77665-fig7-data3-v2.xlsx
-
Figure 7—source data 4
Quantification of triacylglycerol (TAG) species from yeast strains complemented with adenylation mutants of ScDIP2 shown in Figure 7G.
- https://cdn.elifesciences.org/articles/77665/elife-77665-fig7-data4-v2.xlsx
Figure 7—figure supplement 1

Expression validation and lipidomics of ScDIP2 domain-truncated constructs.
(A, B) Representative fluorescence microscopy images and western blots of various C-terminal GFP-tagged domain-truncated constructs of ScDIP2 (expressed under GAL1 promoter). Deleted part of domains is shown in grey colour. The constructs were used for the ER stress rescue assay by complementing ΔScDIP2 strains and subsequent lipidomic analysis. Scale bar = 5 µm. (C) Liquid chromatography–mass spectrometry (LC–MS) quantification of C36:0 and C36:1 diacylglycerols (DAGs) from ∆ScDIP2 cells complemented with individual FLD domains (FLD1 and FLD2) and full-length ScDIP2 expressed under GAL1 promoter. Unlike the full-length ScDIP2, individual FLD expression is not able to restore selective DAG level. Data are represented as mean ± standard error of the mean (SEM) (n > 5; unpaired, two-tailed Student’s t-test).
-
Figure 7—figure supplement 1—source data 1
Uncropped labelled image showing expression of ScDIP2 protein and its different domain-truncated versions shown in Figure 7—figure supplement 1B.
- https://cdn.elifesciences.org/articles/77665/elife-77665-fig7-figsupp1-data1-v2.pdf
-
Figure 7—figure supplement 1—source data 2
Full raw unedited files of Figure 7—figure supplement 1—source data 1.
- https://cdn.elifesciences.org/articles/77665/elife-77665-fig7-figsupp1-data2-v2.zip
-
Figure 7—figure supplement 1—source data 3
Quantification of diacylglycerol (DAG) species from FLD1 and FLD2 complemented yeast strains shown in Figure 7—figure supplement 1C.
- https://cdn.elifesciences.org/articles/77665/elife-77665-fig7-figsupp1-data3-v2.xlsx
Figure 7—figure supplement 2
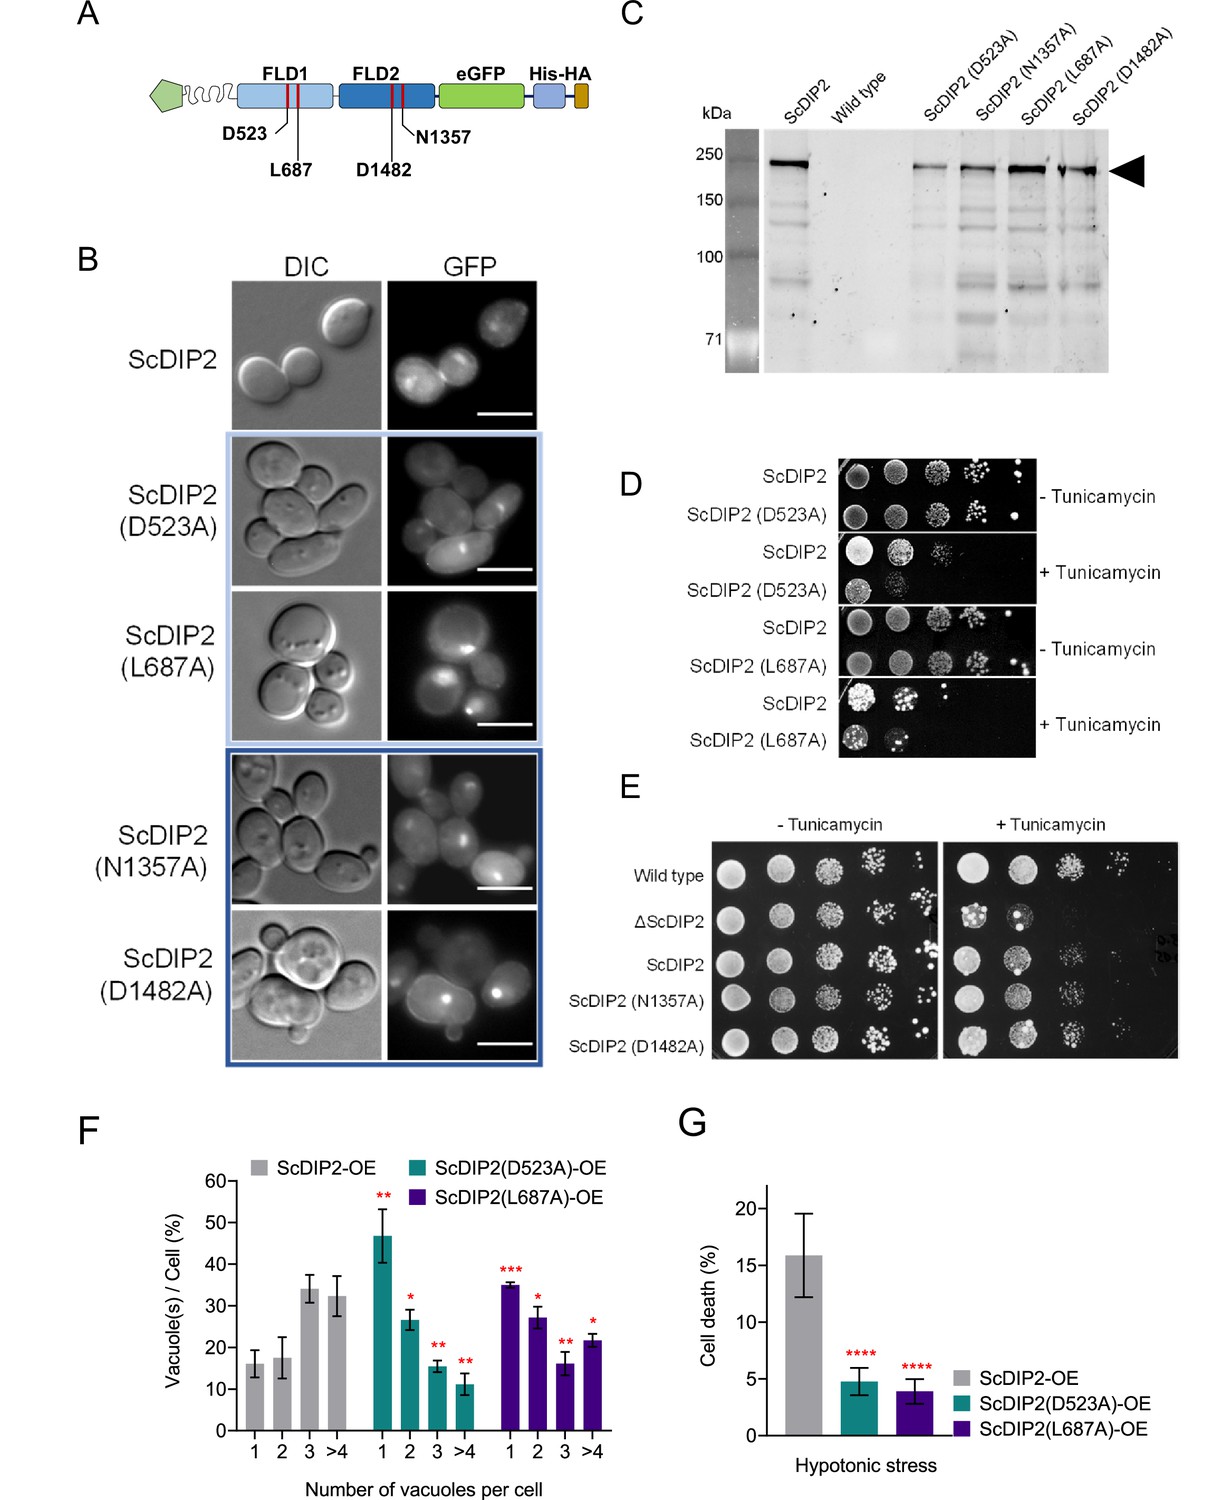
Probing the catalytic role of ScDIP2 via mutational analysis of FLDs.
(A) A schematic to depict the residue names and positions that were used for mutational analysis. (B) Fluorescence microscopy images of wild-type and mutant ScDIP2 variants. Scale bar = 5 µm. (C) Expression of the full-length mutant ScDIP2 variants checked in sodium dodecyl sulphate–polyacrylamide gel electrophoresis (SDS–PAGE) through GFP fluorescence channel (at 488 nm). (D, E) Representative images of tunicamycin-induced ER stress assay to screen loss of function in mutant ScDIP2 variants (n = 3, tunicamycin concentration = 1.0 µg/ml). (F) Quantitation of vacuoles per cell from indicated yeast strains. Dataset from ScDIP2 point mutants (D523A and L687A) overexpression strains were compared with the wild-type ScDIP2 overexpression strain. Data were represented as mean ± standard deviation (SD) (n = 3; >100 cells per strain; unpaired, two-tailed Student’s t-test; *p < 0.05; **p < 0.01; ***p < 0.001; ****p < 0.0001; ns = not significant). (G) Quantification of cell death upon hypotonic stress in indicated yeast strains. Data are represented as mean ± SD (n = 3: two-tailed Student’s t-test; ****p < 0.0001; ns = not significant).
-
Figure 7—figure supplement 2—source data 1
Uncropped labelled image showing expression of ScDIP2 protein and its adenylation mutant versions shown in Figure 7—figure supplement 2C.
- https://cdn.elifesciences.org/articles/77665/elife-77665-fig7-figsupp2-data1-v2.pdf
-
Figure 7—figure supplement 2—source data 2
Full raw unedited files of Figure 7—figure supplement 2—source data 1.
- https://cdn.elifesciences.org/articles/77665/elife-77665-fig7-figsupp2-data2-v2.zip
-
Figure 7—figure supplement 2—source data 3
Quantification of vacuoles and cell death in hypotonic stress upon overexpression of point mutant ScDIP2 shown in Figure 7—figure supplement 2F, G.
- https://cdn.elifesciences.org/articles/77665/elife-77665-fig7-figsupp2-data3-v2.xlsx
Author response image 1
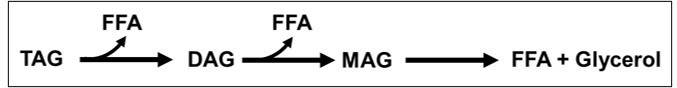
A schematic showing lipolysis of TAGs to form DAGs, MAGs, FFA and Glycerol.
Author response image 2

A schematic showing the lyso-PA and PA as the precursor of DAG synthesis.
Author response image 3
Author response image 4

A sausage representation of the homology model of the FAAL-like domain-1 shows the overall residue depth (Chakravarty and Varadarajan, 1999; Tan et al., 2013).
The core regions appear thicker than the surface regions, which are also coloured accordingly. Residues deep within the core are coloured red, while those at the surface are coloured blue. This representation shows that the mutated residues, D523 and L687 (spheres), are part of the core and deeply buried. A scatter plot showing the depth (Y-axis) of each residue (X-axis) in the region of interest, also shows that the residues are deeply buried in the core (3rd quartile or > 75% percentile).
Additional files
-
Supplementary file 1
Tabulation of DIP2 associated phenotypes and disorders in different organisms.
- https://cdn.elifesciences.org/articles/77665/elife-77665-supp1-v2.docx
-
Supplementary file 2
List of yeast strains.
- https://cdn.elifesciences.org/articles/77665/elife-77665-supp2-v2.docx
-
Supplementary file 3
List of primers.
- https://cdn.elifesciences.org/articles/77665/elife-77665-supp3-v2.docx
-
Supplementary file 4
List of plasmids.
- https://cdn.elifesciences.org/articles/77665/elife-77665-supp4-v2.docx
-
Transparent reporting form
- https://cdn.elifesciences.org/articles/77665/elife-77665-transrepform1-v2.docx
Download links
A two-part list of links to download the article, or parts of the article, in various formats.
Downloads (link to download the article as PDF)
Open citations (links to open the citations from this article in various online reference manager services)
Cite this article (links to download the citations from this article in formats compatible with various reference manager tools)
DIP2 is a unique regulator of diacylglycerol lipid homeostasis in eukaryotes
eLife 11:e77665.
https://doi.org/10.7554/eLife.77665


