Chronic neurotransmission increases the susceptibility of lateral-line hair cells to ototoxic insults
- Section on Sensory Cell Development and Function, National Institute on Deafness and Other Communication Disorders, National Institutes of Health, United States
- Department of Biology, Johns Hopkins University, United States
Figures
Figure 1 with 2 supplements
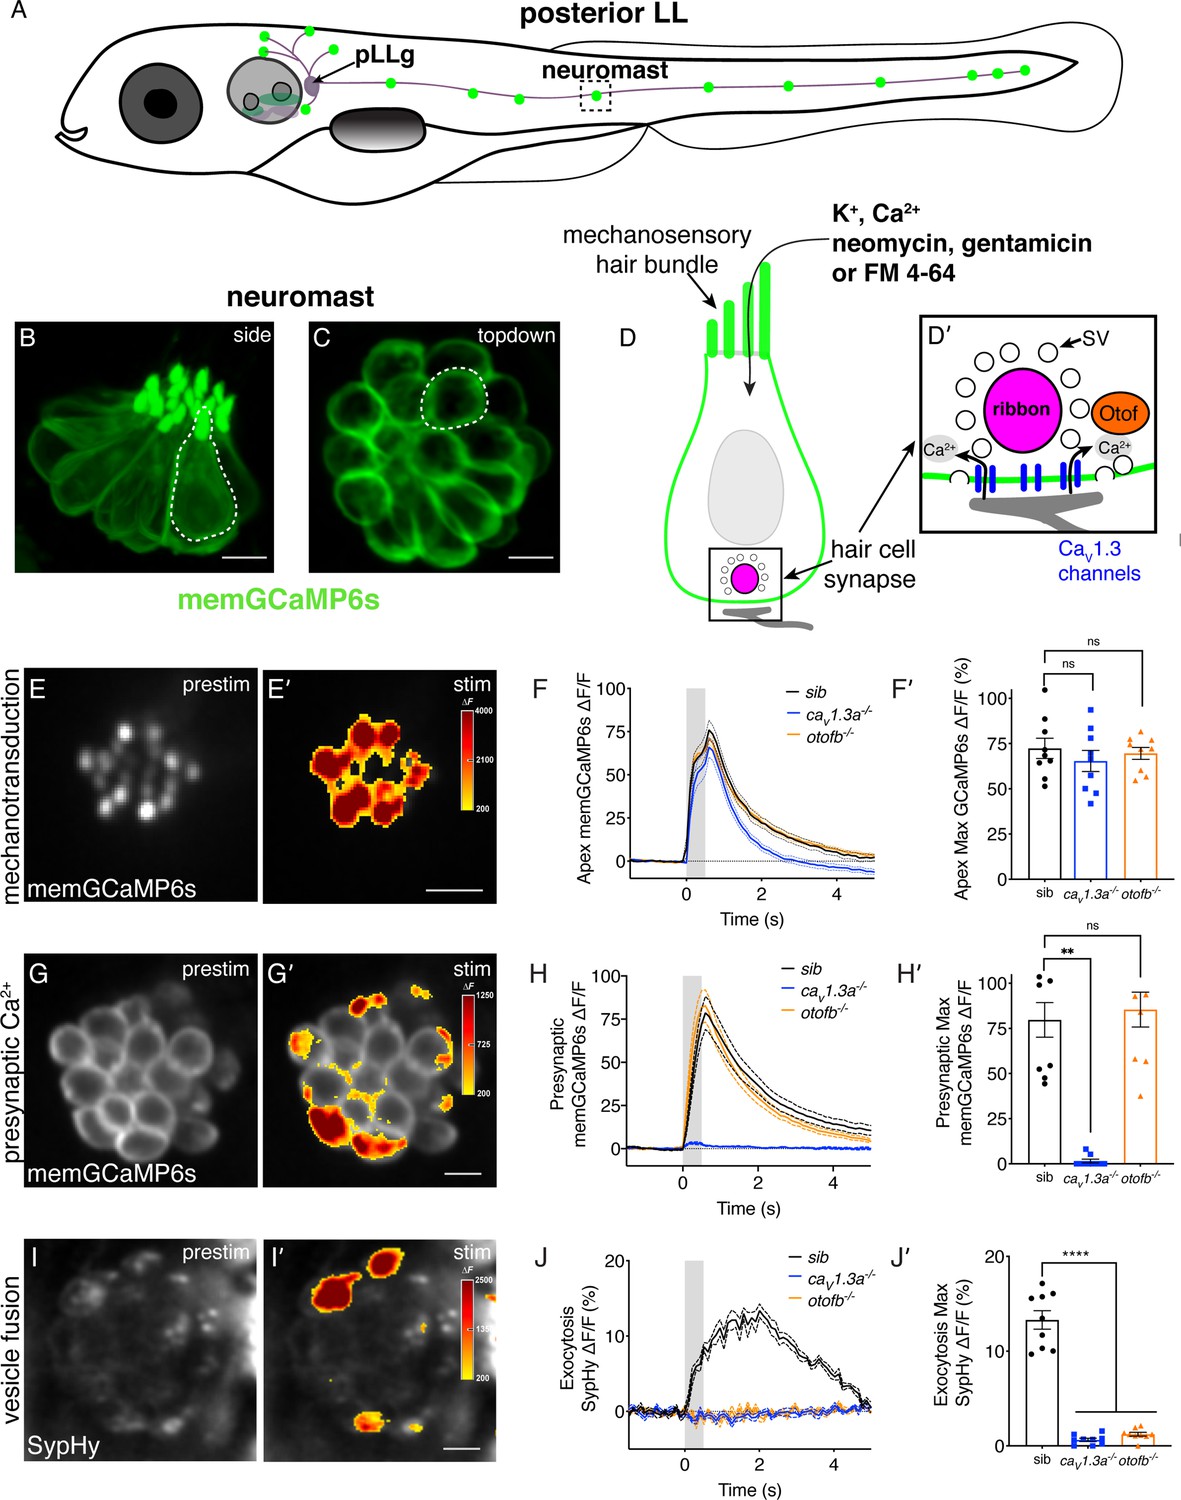
Genetic basis of neurotransmission in the zebrafish posterior-lateral line.
(A) Cartoon drawing of 5 dpf zebrafish larva with the posterior lateral line (LL) highlighted. The LL is made up of clusters of hair cell clusters called neuromasts (green dots). Neuromasts are innervated by neurons that project from the posterior LL ganglion (pLLg). (B–C) Side view (B) and top-down view (C) of neuromast from Tg[myo6b:memGCaMP6s]idc1 fish where the hair-cell membrane is labeled. White dotted line demarcates a single hair cell in each image. (D-D’) Cartoon schematic of a side view of a hair cell. At the apex is the mechanosensory hair bundle. The primary pathway of entry of neomycin, gentamicin, and FM 4–64 is through mechanotransduction channels in the mechanosensory hair bundle. At the base of the hair cell is the ribbon synapse. The presynapse or ribbon (magenta) is surrounded by synaptic vesicles (SV, white circles). When mechanotransduction channels are activated, an influx of cations including calcium enters the hair bundle. Hair bundle activation leads to opening of Cav1.3 voltage-gated calcium channels (blue) and presynaptic calcium influx. The calcium sensor Otoferlin (orange) facilitates fusion by coupling calcium influx with the exocytosis of SVs and the release of glutamate onto the innervating postsynaptic afferent terminal (gray). (E-E’) The spatial patterns of the evoked calcium influx (GCaMP6s ΔF, indicated via the heatmaps) into sibling hair bundles (E’) compared to prestimulus (C). (F-F’) Average traces (F) and dot plots show that the average magnitude of apical (F’) ΔF/F GCaMP6s signals in mechanosensory hair bundles is not different in cav1.3a-/- and otofb-/- mutants compared to siblings. (G-G’) The spatial patterns of the evoked calcium influx (GCaMP6s ΔF, indicated via the heatmaps) at wildtype presynapses (G’) compared to prestimulus (G). (H-H’) Average traces (H) and dot plots show that the average magnitude of presynaptic (H’) ΔF/F GCaMP6s signals is absent in cav1.3a-/- but unaltered in otofb-/- mutants compared to siblings. (I-I’) The spatial patterns of evoked exocytosis (SypHy ΔF, indicated via the heatmaps) at sibling presynapses (I’) compared to prestimulus (I). (J-J’) Averaged traces (J) and dot plots show that presynaptic (J’) ΔF/F SypHy signals are absent in cav1.3a-/- and in otofb-/- mutants. The fluid-jet stimulus depicted as a gray box in F, H, and J. Each point in the dot plots represents one neuromast. All measurements were performed in mature neuromasts at 5–6 dpf on 3 animals and 9 neuromasts per genotype. Error bars: SEM. A one-way AVOVA with a Dunnett’s correction for multiple tests was used in F’ and J’, and a Kruskal-Wallis test with a Dunn’s correction for multiple tests was used in H’. ** p<0.01, **** p<0.0001. Scale bar = 5 µm.
-
Figure 1—source data 1
Mean numbers and statistics for functional analyses.
- https://cdn.elifesciences.org/articles/77775/elife-77775-fig1-data1-v2.xlsx
Figure 1—figure supplement 1
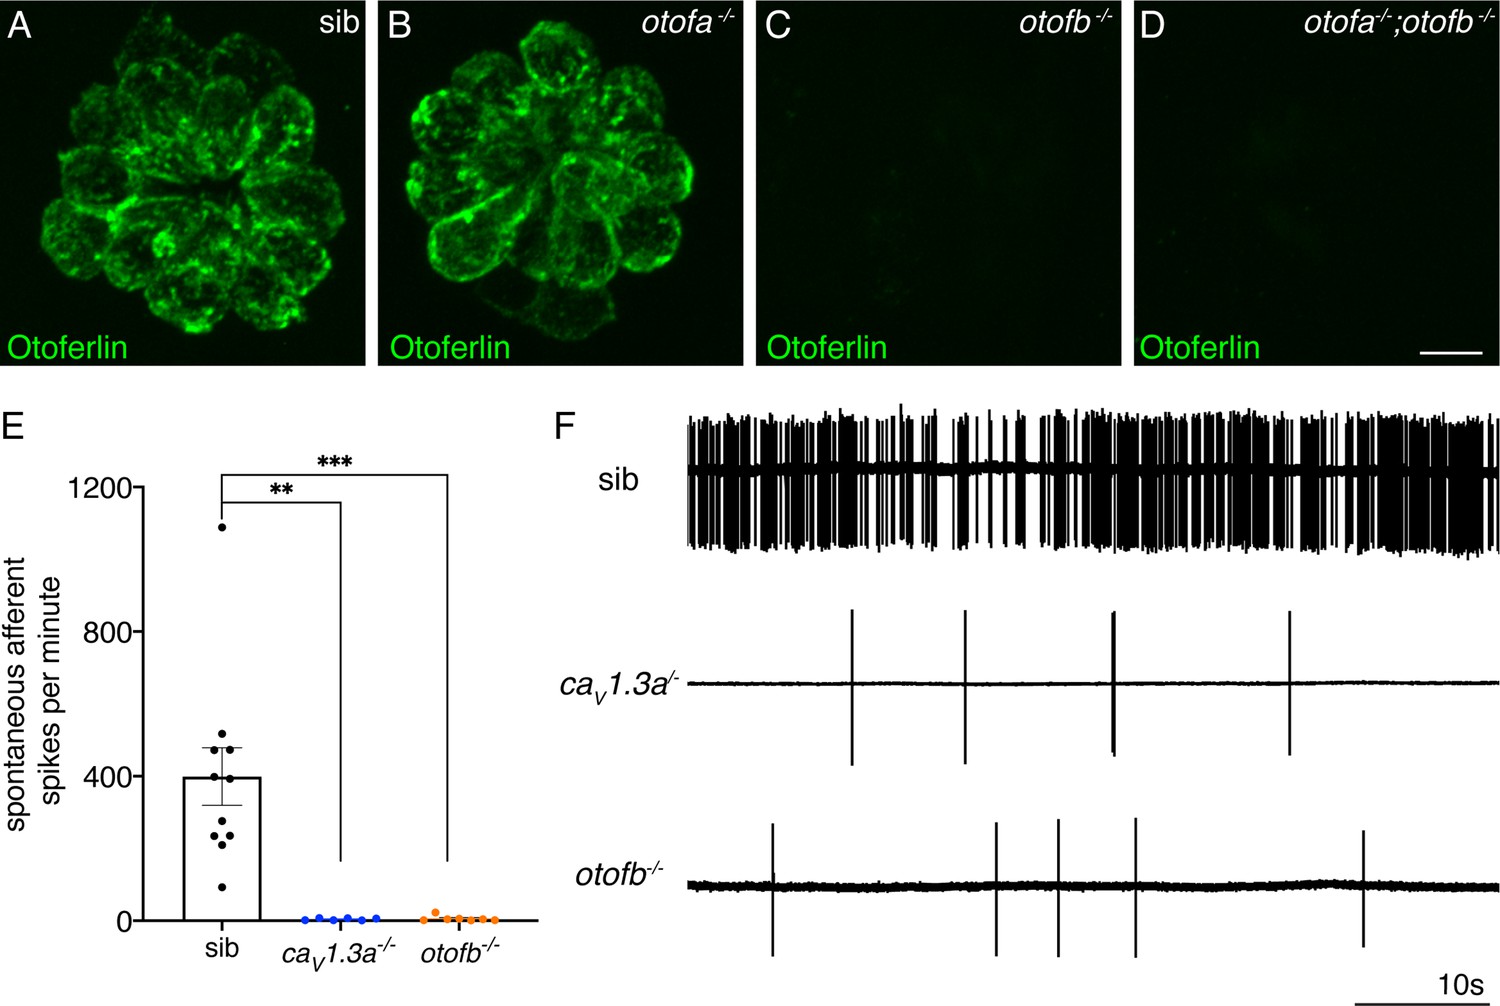
Spontaneous postsynaptic afferent activity is absent in cav1.3a mutant and otofb mutants.
(A–D) Hair cells in neuromasts of wildtype (A), otofa-/- (B), otofb-/- (C), and otofa-/-/otofb-/- mutants (D) immunostained for Otoferlin. Loss of Otofb is sufficient to eliminate Otoferlin in lateral line neuromasts (C). (E) Average dot plots of spontaneous afferent spikes per minute recorded from posterior lateral line ganglion cell bodies in cav1.3a-/- (blue) and otofb-/- (orange) mutants or siblings (black) show that spontaneous afferent activity in both mutants is essentially absent. (F) Representative example traces of 60 second loose-patch recordings of spontaneous afferent spiking activity in sibling, cav1.3a-/- and otofb-/- mutants. Each point in the dot plot in E represents a recording from one afferent neuron. A minimum of 6 animals at 5–6 dpf were examined per group. Error bars: SEM. A Kruskal-Wallis test with a Dunn’s correction for multiple comparisons was used in E. ** p<0.01, *** p<0.001. Scale bar = 5 µm.
-
Figure 1—figure supplement 1—source data 1
Mean numbers and statistics for afferent spikes.
- https://cdn.elifesciences.org/articles/77775/elife-77775-fig1-figsupp1-data1-v2.xlsx
Figure 1—figure supplement 2
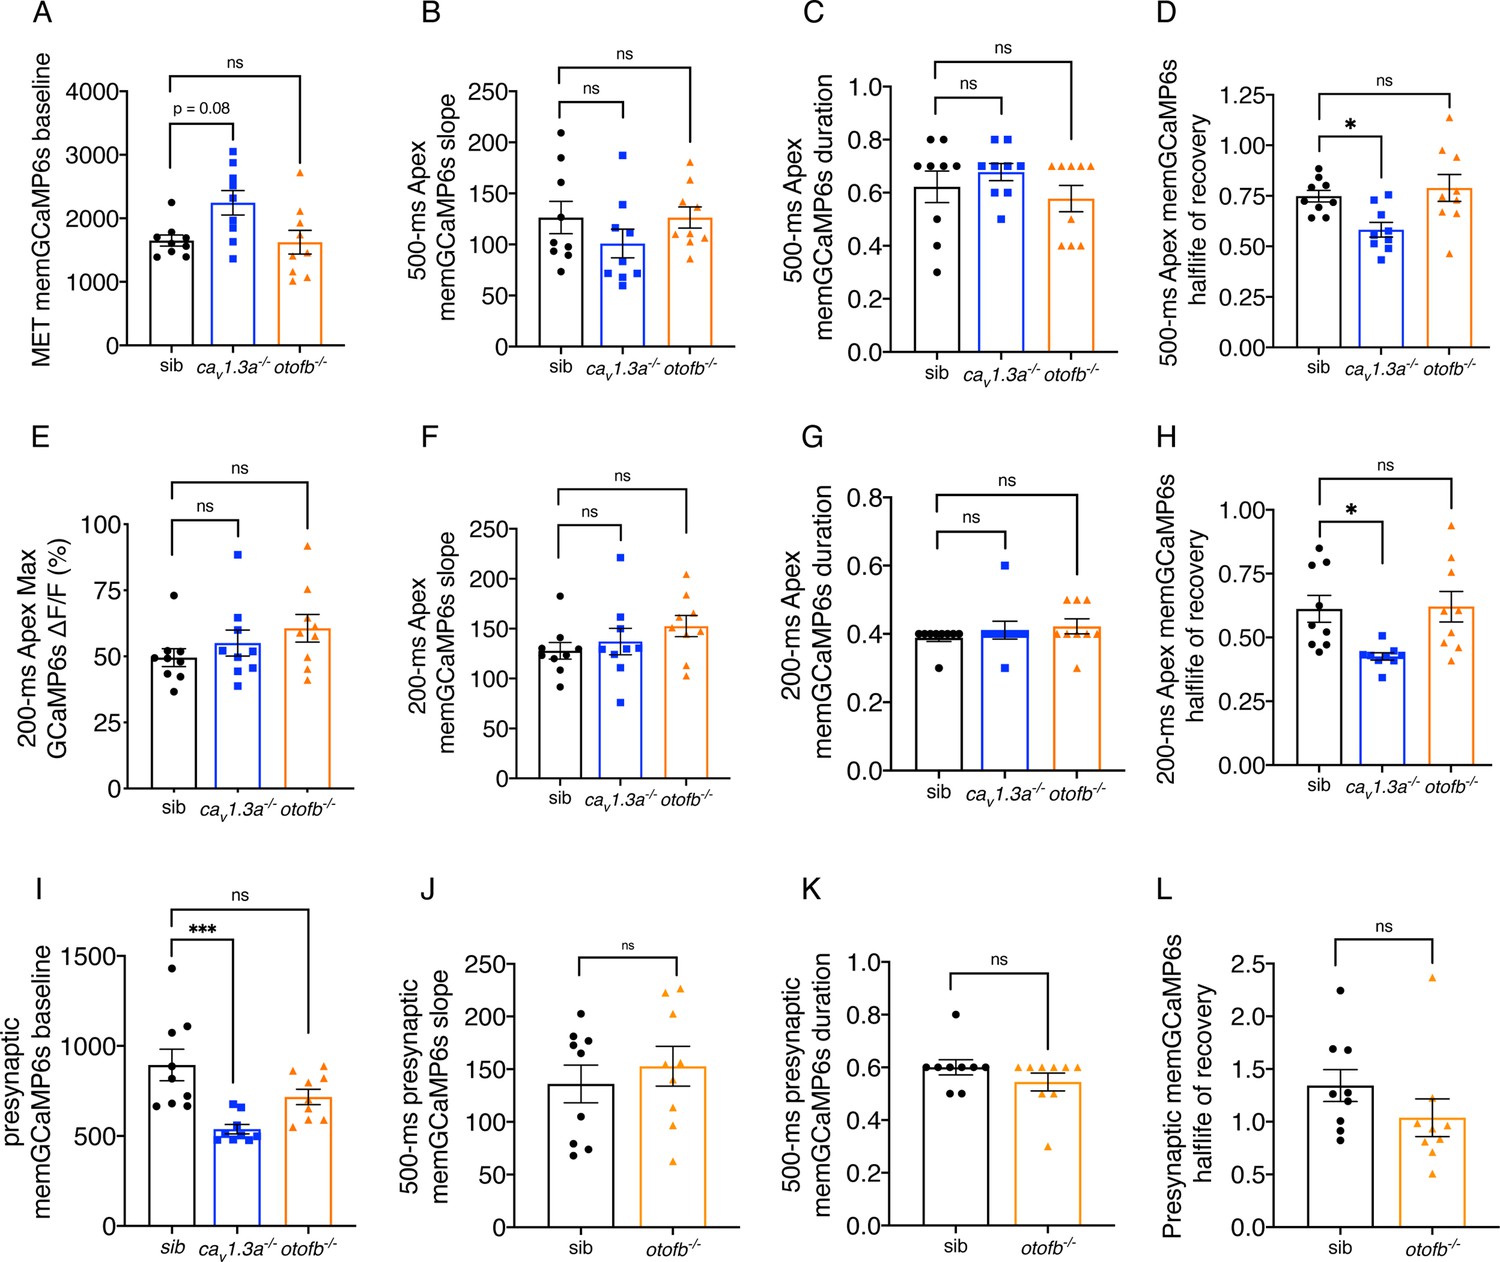
Further characterization of memGCaMP6s responses in cav1.3a and otofb mutants.
(A) Resting memGCaMP6s intensity in apical hair bundles trends higher in cav1.3a-/- mutants but is similar to controls in otofb-/- mutants. (B–D) In response to a 500 ms stimulus, the slope (B) and duration (C) of the GCaMP6s response are not different compared to sibling controls. When fitted with an exponential decay, on average, the half-life of the signal to reach baseline after the 500 ms stimulus is faster in cav1.3a-/- mutants but similar to controls in otofb-/- mutants (D). (E–H) In response to a 200 ms stimulus, the average magnitude of apical ΔF/F GCaMP6s signals in mechanosensory hair bundles is not different in cav1.3a-/- and otofb-/- mutants compared to siblings (E). The slope (F) and duration (G) of the GCaMP6s response are also no different compared to sibling controls. When fitted with an exponential decay, on average, the half-life of the signal to reach baseline after the 200 ms stimulus is faster in cav1.3a-/- mutants but similar to controls in otofb-/- mutants (D). (I) Resting memGCaMP6s intensity at the base or presynaptic region is lower in cav1.3a-/- mutants but similar to controls in otofb-/- mutants. (J–L) In response to a 500 ms stimulus, the slope (J), duration (L) and the half-life of the decay (L) are unchanged in otofb-/- mutants compared to controls. No caV1.3a mutant data is included in J-L due to lack of presynaptic responses. For GCaMP6s measurements 3 animals and 9 neuromasts were examined per genotype. A Kruskal-Wallis test with a Dunn’s correction for multiple comparisons was used in A, C, E, and G. A one-way ANOVA with a Dunnett’s correction for multiple comparisons was used in B, D, F, H-I. An unpaired t-test was used in J-K. A Mann-Whitney test was used in L. * p<0.05, ***p<0.001.
-
Figure 1—figure supplement 2—source data 1
Mean numbers and statistics for functional analyses.
- https://cdn.elifesciences.org/articles/77775/elife-77775-fig1-figsupp2-data1-v2.xlsx
Figure 2 with 2 supplements
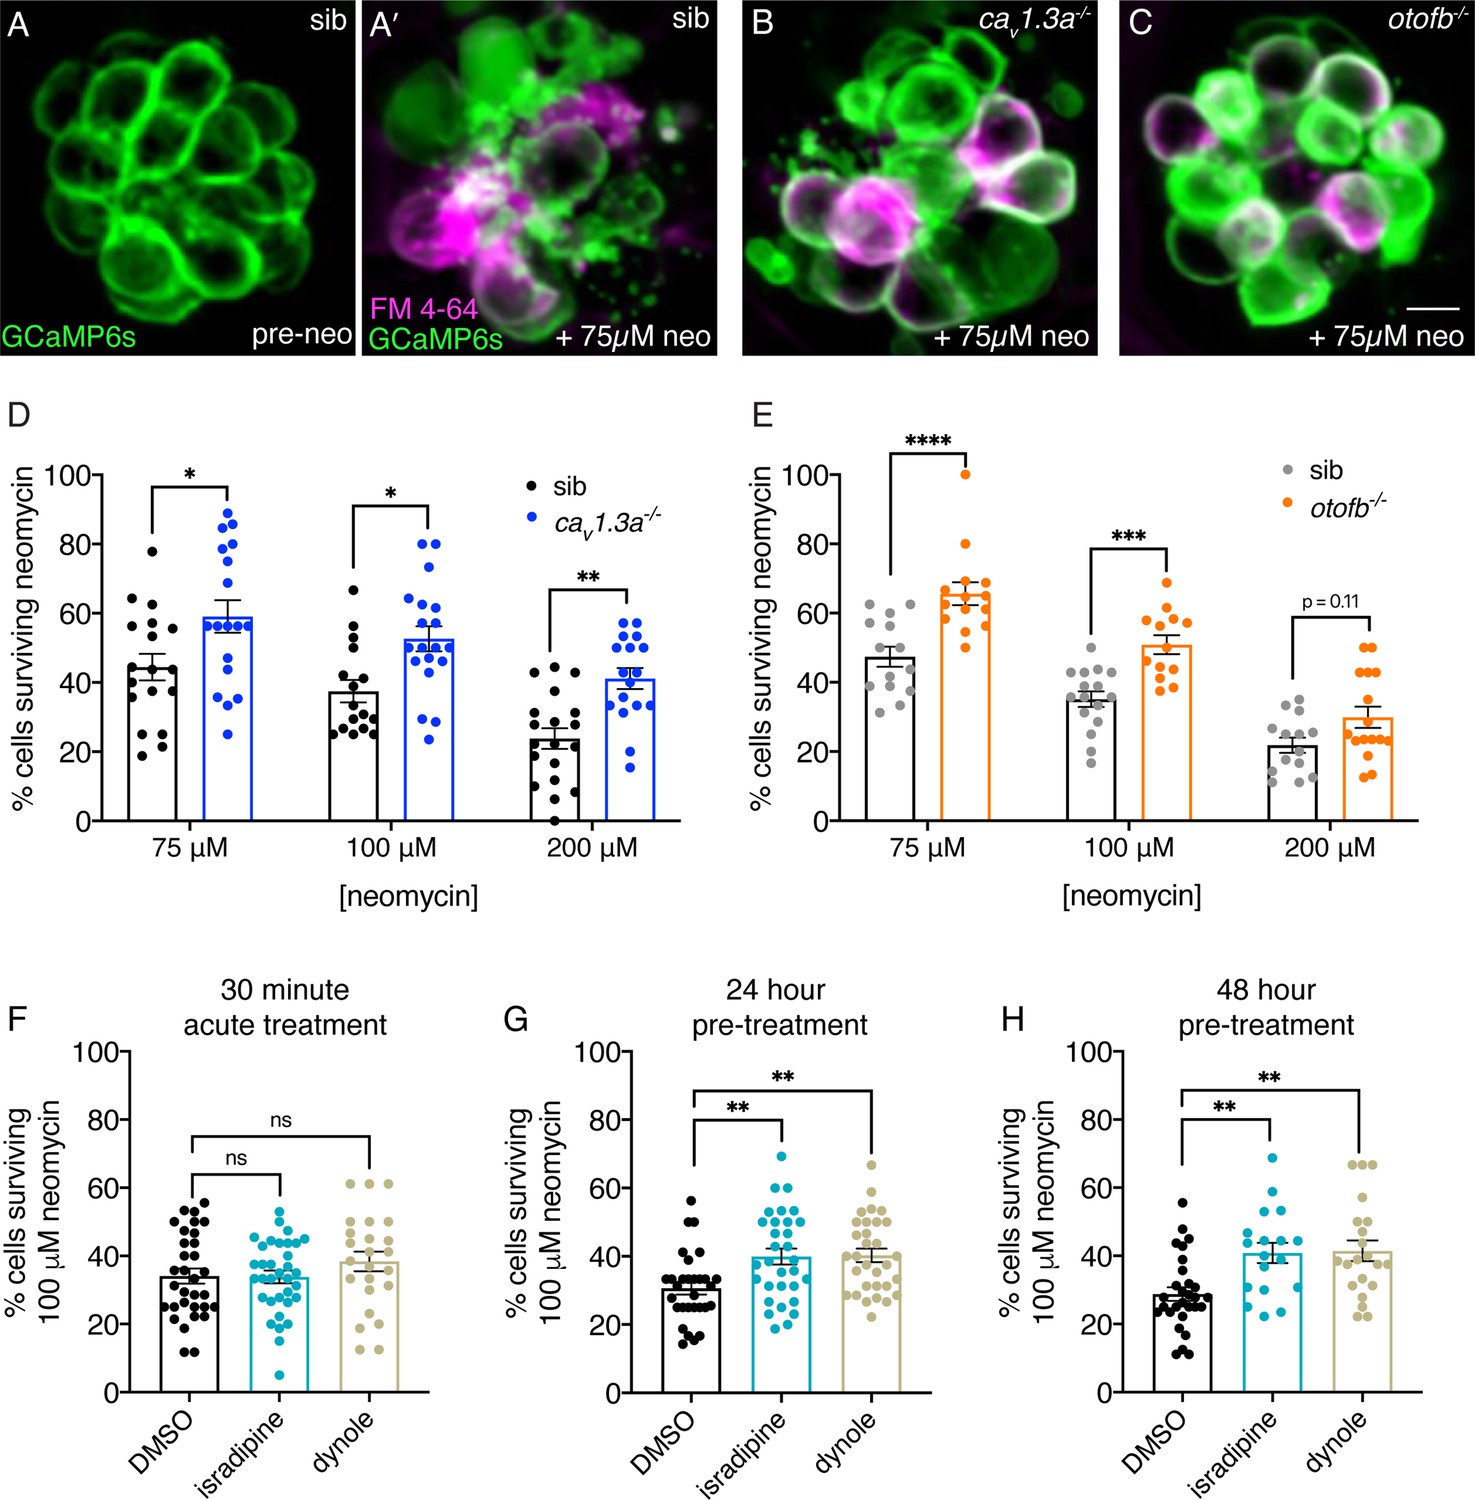
Chronic loss of neurotransmission protects hair cells from the ototoxin neomycin.
(A-A’) Hair cells in siblings before (A) and after a 30-min treatment with 75 µM neomycin (A’). GCaMP6s outlines hair cells. The presence of FM 4–64 in hair cells reveals surviving cells (A’). (B-C’) After a 30-min treatment with 75 µM neomycin GCaMP6s and FM 4–64 more surviving hair cells are found in cav1.3a-/- (B), and otofb-/- (C) mutants. (D–E) A higher percentage of CaV1.3- and Otof-deficient hair cells survive a 30 min treatment with three different neomycin concentrations (75, 100, and 200 µM) compared to sibling controls. For quantification in D-E, neuromasts were examined at 5 or 6 dpf immediately after washout of neomycin solution and application of FM 4–64. (F) Percentage of hair cells per neuromast surviving is not altered when hair cells in wildtype larvae are co-incubated with 0.1% DMSO (control), 10 µM isradipine, or 2.5 µM Dynole 34–2 during the 30-min 100 µM neomycin treatment. (G–H) When wildtype hair cells are incubated with 10 µM isradipine or 2.5 µM Dynole 34–2 for 24 hr (G, 4 to 5 dpf) or for 48 hr (H, 3 to 5 dpf) prior to neomycin treatment significantly more hair cells survive compared to DMSO controls. Each point in the dot plots in D-H represents one neuromast. A minimum of five animals were examined per treatment group. Error bars: SEM. For comparisons, a two-way ANOVA with a Sidak’s correction for multiple comparisons was used in D-E. A one-way AVOVA with a Dunnett’s correction for multiple comparisons was used in F, G and H. * p<0.05, ** p<0.01, *** p<0.001. Scale bar = 5 µm.
-
Figure 2—source data 1
Mean numbers and statistics for ototoxicity analyses.
- https://cdn.elifesciences.org/articles/77775/elife-77775-fig2-data1-v2.xlsx
Figure 2—figure supplement 1
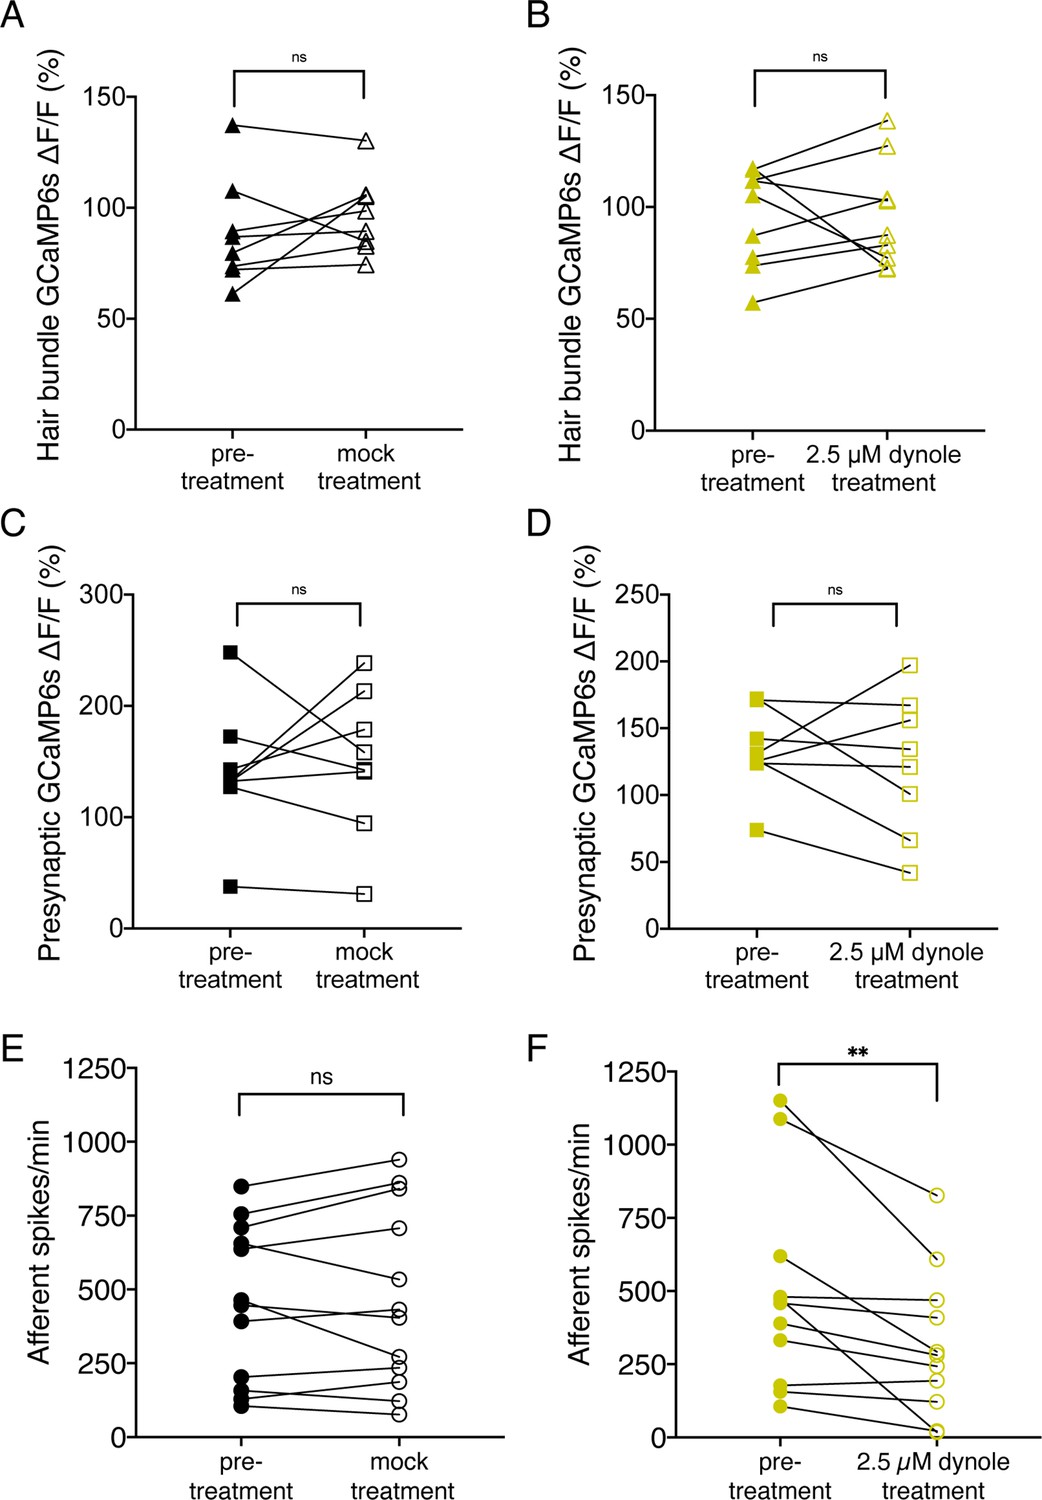
Treatment with 2.5 µM Dynole 34–2 reduces the frequency of afferent spiking and does not affect mechanotransduction or presynaptic calcium influx.
(A–B) Average dot plots of evoked MET (A–B) and presynaptic (C–D) calcium influx (GCaMP6s ΔF/F) in wildtype neuromasts before and after a 10-min mock treatment in 0.1% DMSO (A) or a 10-min incubation in 2.5 µM Dynole 34–2 (B). These data show that Dynole 34–2 treatment does not affect calcium influx. (E–F) Average dot plots of spontaneous afferent spikes/min before (solid circles) and after (empty circles) a 10-min mock treatment in 0.1% DMSO (E) or a 10 min incubation in 2.5 µM Dynole 34–2 (F). These plots show that Dynole 34–2 significantly reduces afferent spiking activity in spikes/min. Each point in the dot plots represents one neuromast (A–D) or one afferent neuron (E–F). A minimum of four animals and eight neuromasts were examined in A-D at 5 dpf. Twelve animals were examined in C-D at 5–6 dpf. Error bars: SEM. For comparisons, a paired t-test (A–E) or a Wilcoxon test (F) were used. ** p<0.01.
-
Figure 2—figure supplement 1—source data 1
Mean numbers and statistics for functional analyses.
- https://cdn.elifesciences.org/articles/77775/elife-77775-fig2-figsupp1-data1-v2.xlsx
Figure 2—figure supplement 2
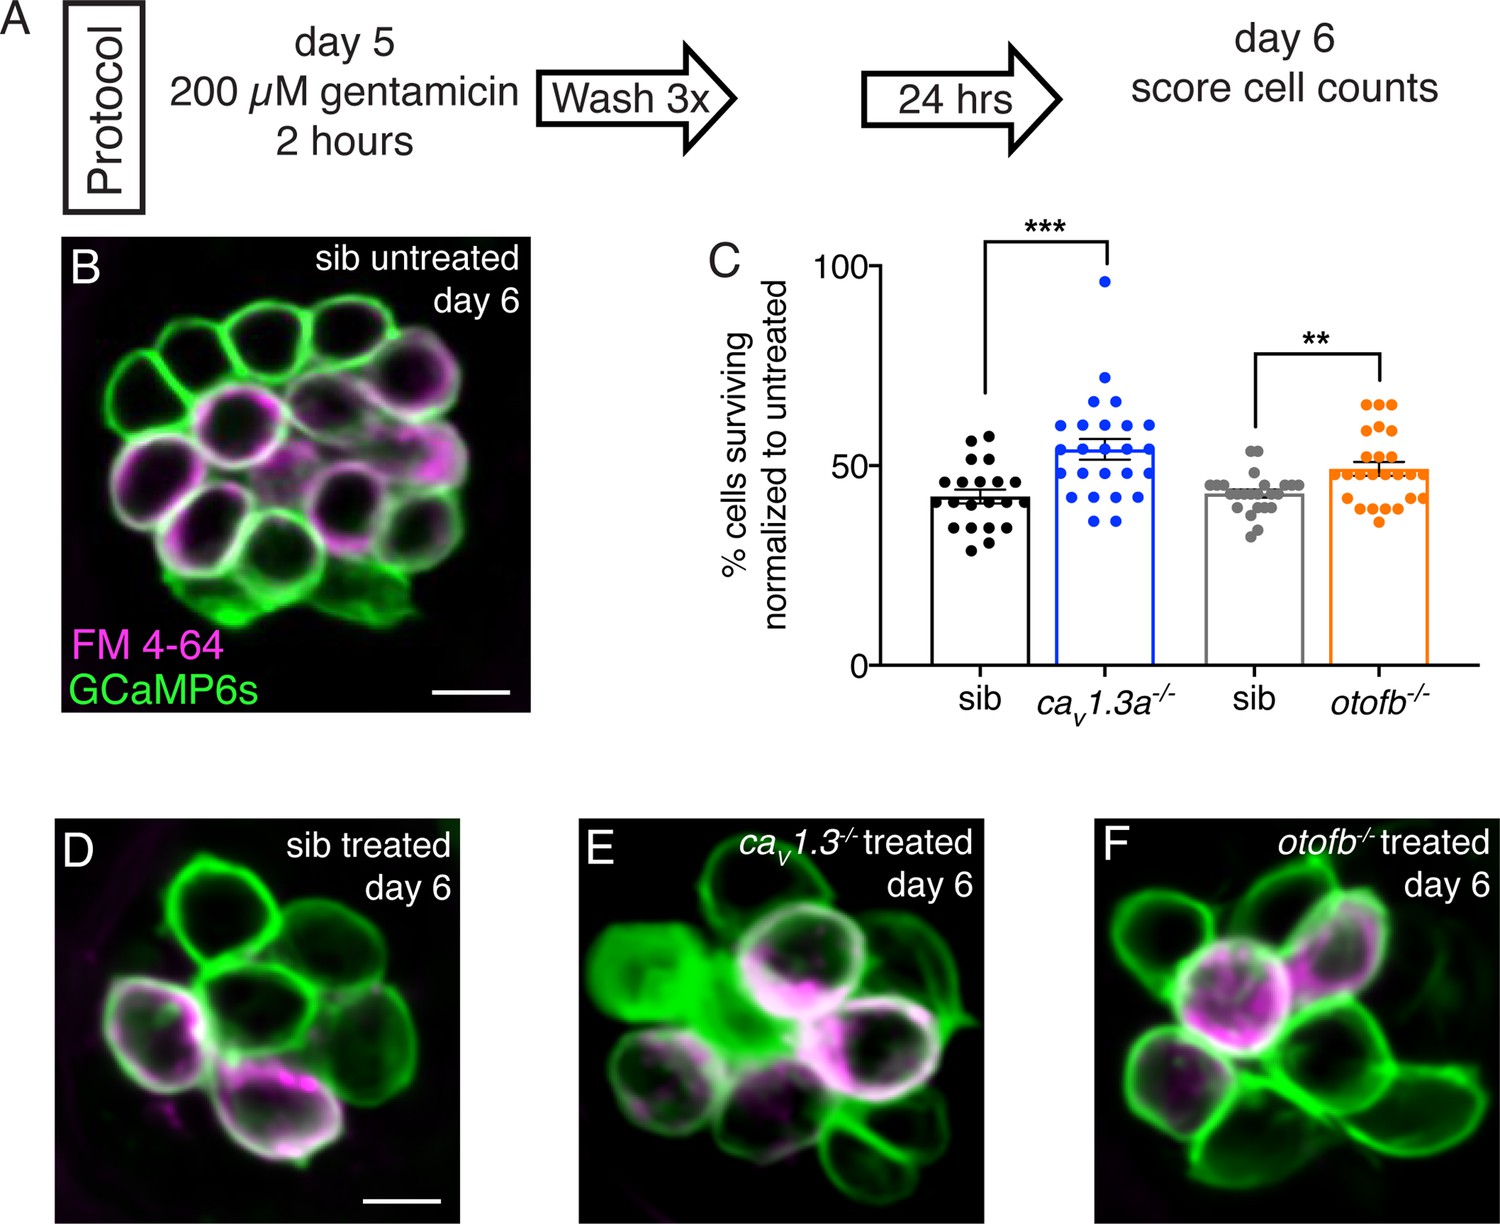
Cav1.3a and otofb mutants are resistant to gentamicin-induced cell death.
(A) Outline of gentamicin treatment protocol. Mutants and siblings are treated with 200 µM gentamicin solution for 2 hr followed by three washes in embryo medium then allowed to recover for 24 hr. At 6 dpf, neuromasts are imaged and analyzed to obtain cell counts both in treated and untreated mutants and siblings. (B–C) Hair cells in a representative untreated wildtype neuromast (B) and gentamicin-treated wildtype (D), cav1.3a-/- (E), and otofb-/- (F) neuromasts at 6 dpf. Cells are stained with FM 4–64 to aid in cell counting and assessing cell maturity. GCaMP6s outlines hair cells. (C) Average dot plots of % of cells present in gentamicin-treated neuromasts normalized to the number of cells present in untreated neuromasts in cav1.3a-/- mutants (blue) and siblings (black) as well as otofb-/- mutants (orange) and siblings (grey) show that more cells survive in mutants than in siblings. Each dot in C represents one neuromast. A minimum of five animals were examined per treatment group. Error bars = SEM. For comparisons, a Mann-Whitney test was used to compare cav1.3a-/- mutants and siblings, and an unpaired t-test was used to compare otofb-/- mutants and siblings in D. ** p<0.01, *** p<0.001. Scale bar = 5 µm.
-
Figure 2—figure supplement 2—source data 1
Mean numbers and statistics for ototoxicity analyses.
- https://cdn.elifesciences.org/articles/77775/elife-77775-fig2-figsupp2-data1-v2.xlsx
Figure 3 with 1 supplement
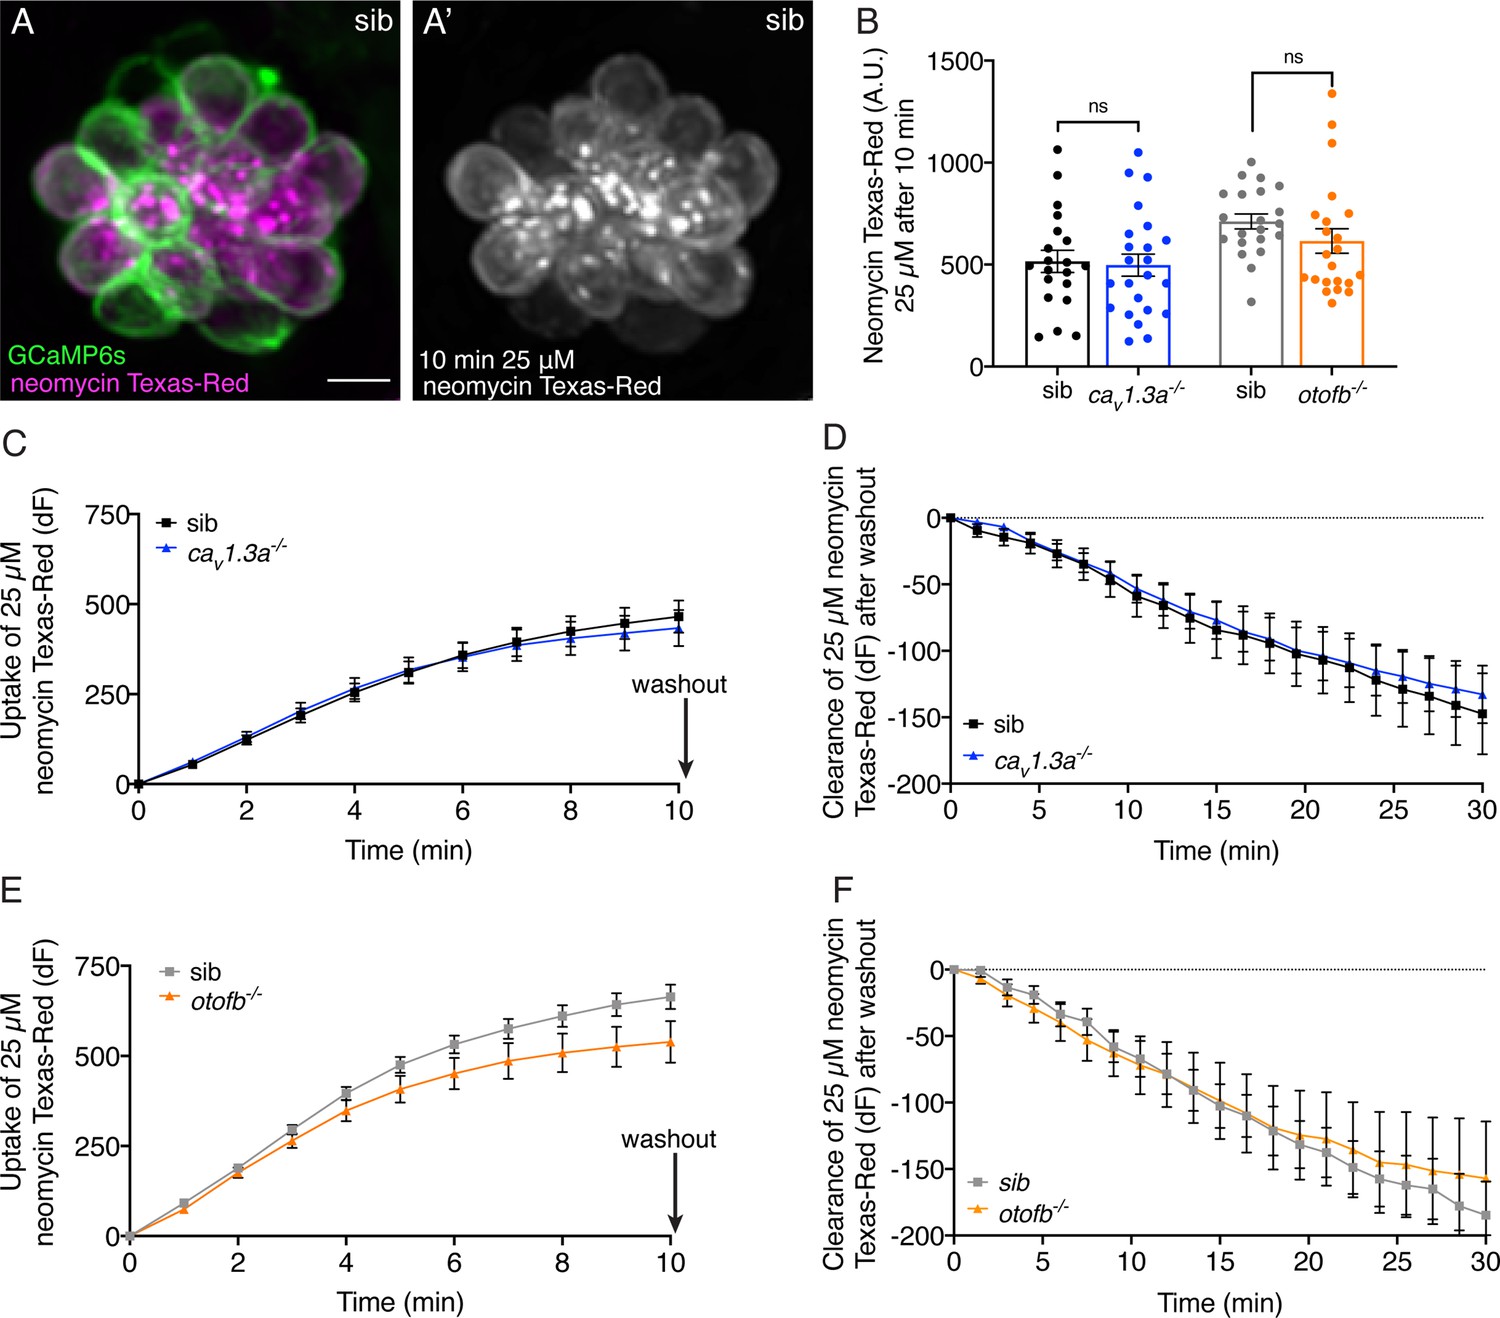
Cav1.3a and otofb mutant hair cells have normal neomycin uptake and retention.
(A-A’) Example of hair cells in a wildtype neuromast after incubation in 25 µM neomycin-Texas Red solution (Neo-TR) for 10 min. GCaMP6s outlines hair cells in A. (B) Average dot plots of Neo-TR fluorescence intensity in neuromasts from cav1.3a-/- (blue) and otofb-/- (orange) mutants and siblings (black and grey, respectively) after a 10-min incubation in 25 µM Neo-TR. No differences in overall neomycin uptake are seen between mutants and siblings. (C–E) Average Neo-TR fluorescence intensity over the course of 10 min 25 µM exposure in cav1.3a-/- mutant neuromasts (blue) and siblings (black) (C) and otofb-/- mutant neuromasts (orange) and siblings (grey) (E). No differences are seen between mutants and siblings in the time course of neomycin uptake. (D–F) Average Neo-TR fluorescence intensity over the course of 30 min following Neo-TR washout in cav1.3a-/- mutant neuromasts (blue) and siblings (black) (D) and otofb-/- mutant neuromasts (orange) and siblings (grey) (F). No significant differences were detected in neomycin clearance or retention between mutants and siblings. Each point in B represents one neuromast. A minimum of 14 neuromasts are averaged for the plots in C-F. A minimum of five animals at 5 dpf were examined per treatment group. Error bars: SEM. For comparisons, unpaired t-tests were used in B, and a two-way ANOVA with a Sidak’s correction for multiple comparisons was used in C-F. Scale bar = 5 µm.
-
Figure 3—source data 1
Mean numbers and statistics for ototoxicity analyses.
- https://cdn.elifesciences.org/articles/77775/elife-77775-fig3-data1-v2.xlsx
Figure 3—figure supplement 1
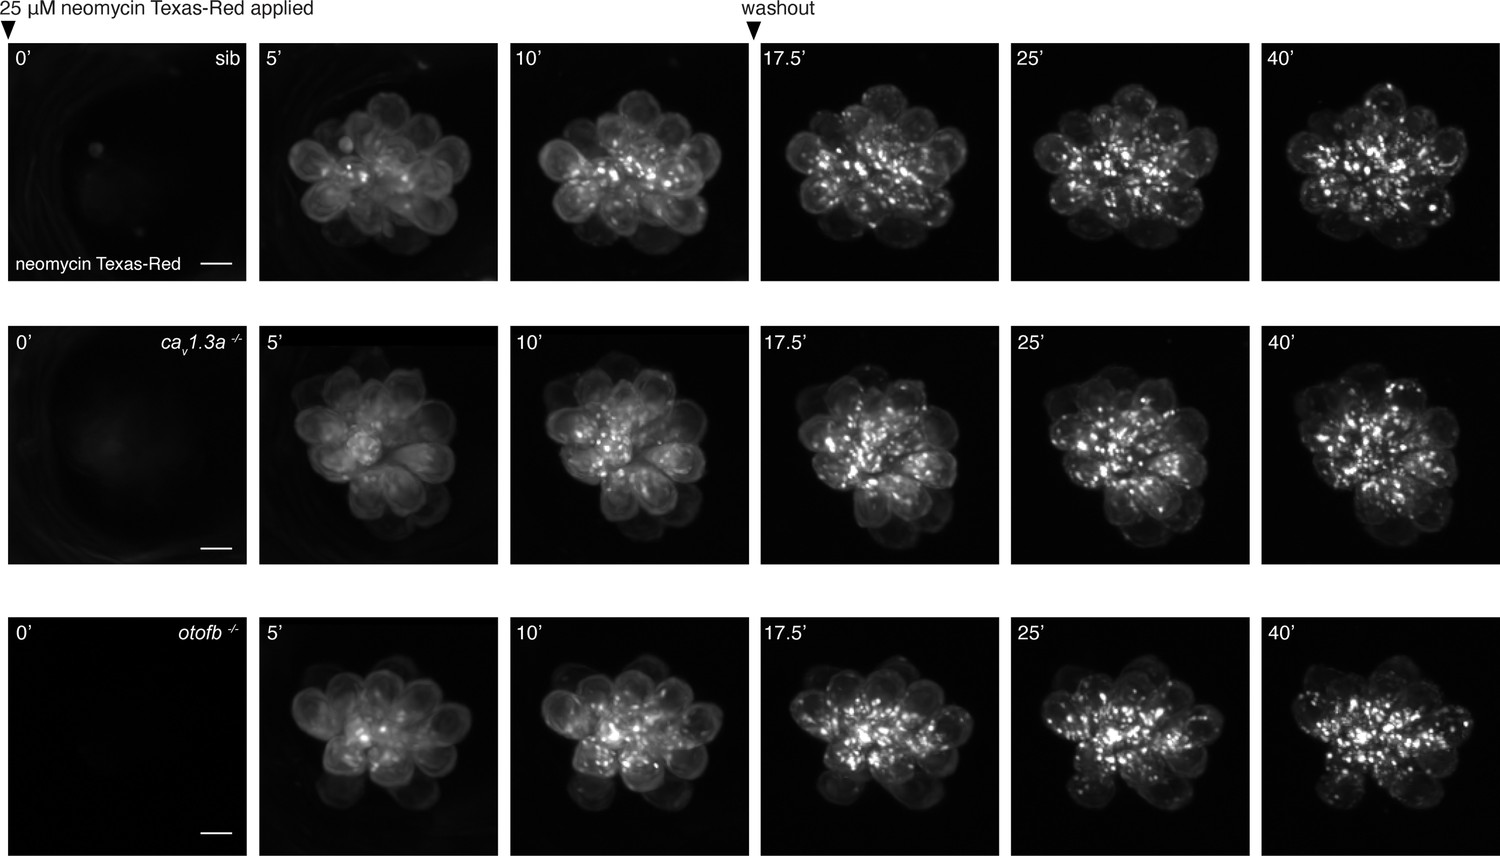
Time course of neomycin uptake and packaging in cav1.3a and otofb mutants and siblings.
(A–C) Representative examples of hair cells in wildtype (A), cav1.3a mutant (B), and otofb mutant (C) during Neo-TR uptake and clearance. Shown at t=0 are neuromasts immediately following application of a 25 µM Neo-TR solution. These images are followed by images taken at 5 and 10 min after application. After 10 min, the Neo-TR solution was washed out, images were acquired from each neuromast (in embryo media) at 17.5, 25, and 40 min from the initial addition of Neo-TR solution. Scale bar = 5 µm.
Figure 4 with 1 supplement
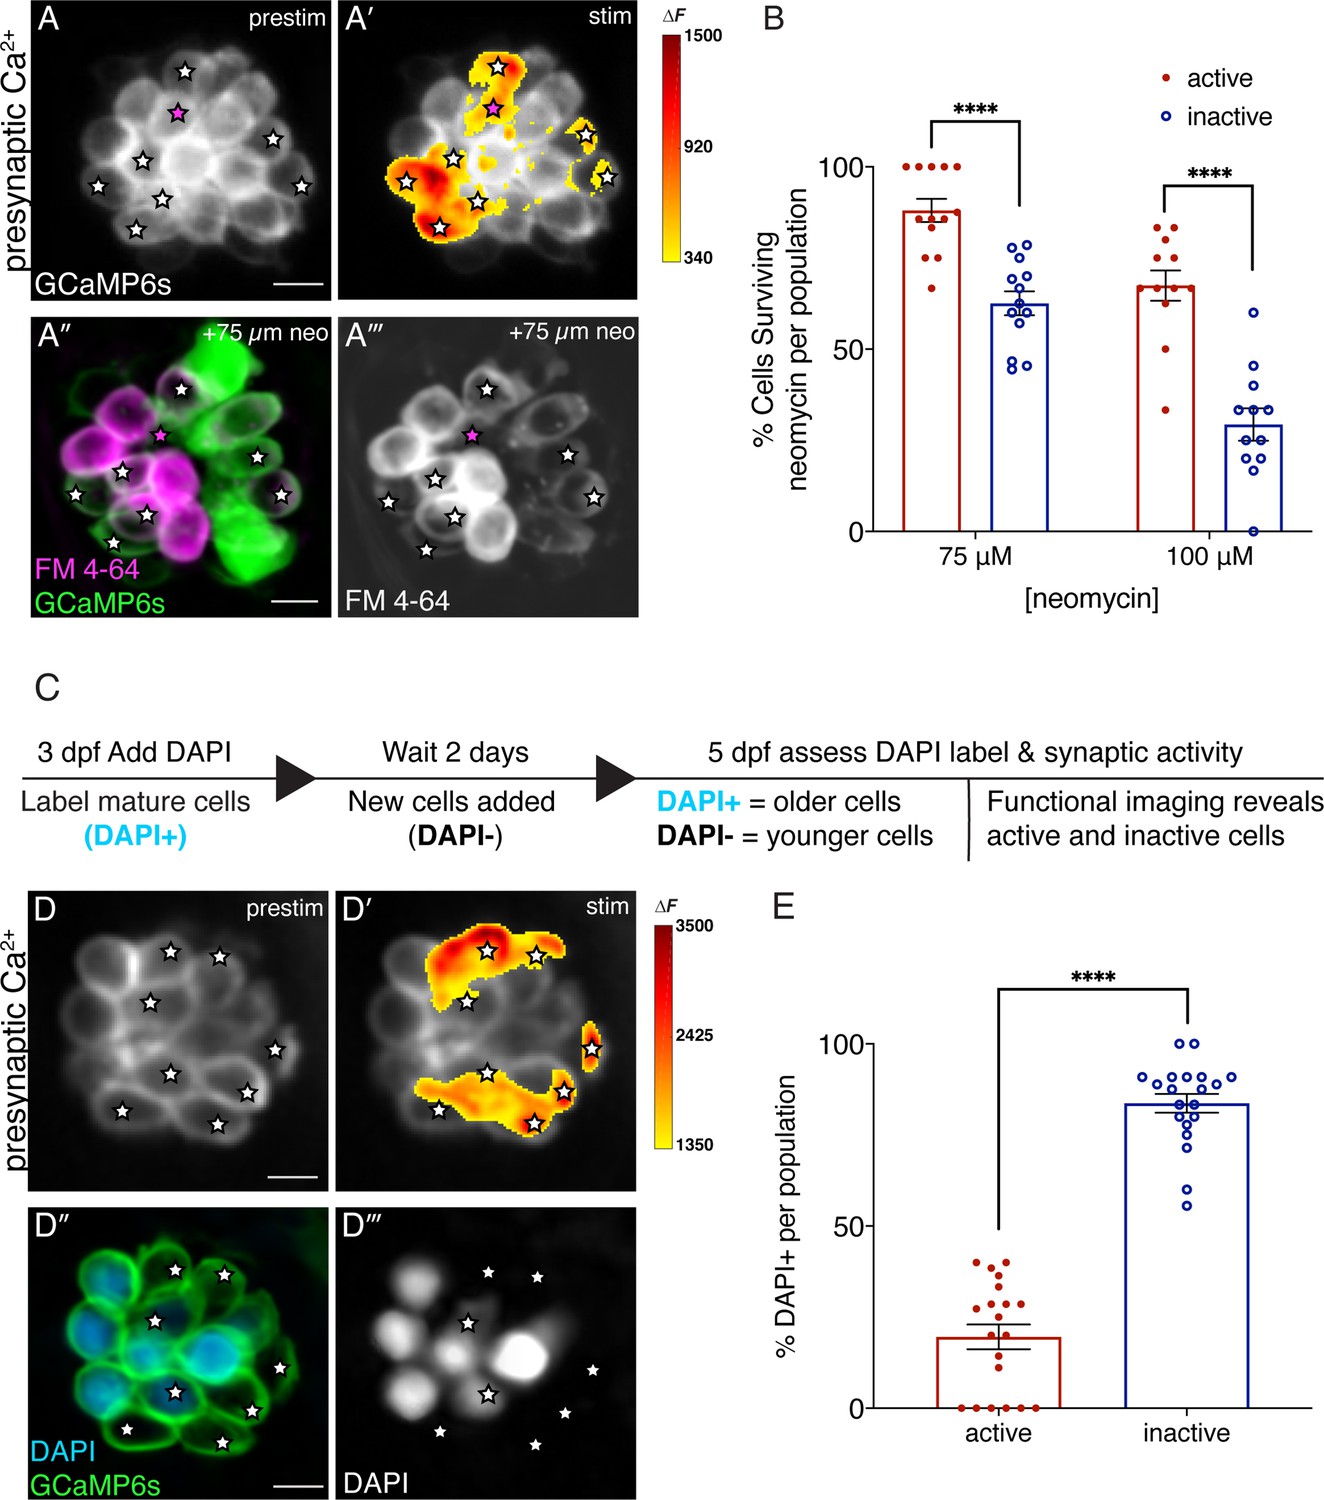
Synaptically active cells are relatively young and more resistant to neomycin.
(A-A’) Hair cells from wildtype 5 dpf fish before and during a 2 s fluid-jet stimulus. The spatial patterns of the evoked calcium influx during stimulation (A’ GCaMP6s ΔF, indicated via the heatmaps) compared to prestimulus (A) reveal synaptically active cells (white stars). (A”-A’’’) Hair cells depicted in A and A’ after a 30-min treatment with 75 µM neomycin solution. Magenta star demarcates an active cell that did not survive neomycin treatment. (B) A higher percentage of active hair cells survive a 30-min treatment with two different neomycin concentrations (75 and 100 µM) compared to inactive cells. Neuromasts were examined at 5 dpf immediately after washout of neomycin solution and application of FM 4–64. (C) Outline of DAPI labeling protocol used to differentiate between older and younger cells within a given neuromast. DAPI is used to label mature hair cells at 3 dpf. At 5 dpf, the hair cells are assessed. (D-D’) Hair cells from wildtype 5 dpf fish before and during a 2 second fluid-jet stimulus. The spatial patterns of the evoked calcium influx during stimulation (D’ GCaMP6s ΔF, indicated via the heatmaps) compared to prestimulus (D) reveal synaptically active cells (white stars). (D’’-D’’’) Hair cells depicted in D and D’ showing DAPI-positive older and DAPI-negative younger cells. (E) DAPI-positive older cells make up a much greater percentage of the inactive cell population than the active cell population. A minimum of five animals were examined per experimental group at 5 dpf. Each dot in B and E represents one neuromast. Error bars: SEM. For comparisons, a two-way ANOVA with a Sidak’s correction for multiple comparisons was used in B. A Mann-Whitney test was used in E. **** p<0.0001. Scale bar = 5 µm.
-
Figure 4—source data 1
Mean numbers and statistics for activity-state analyses.
- https://cdn.elifesciences.org/articles/77775/elife-77775-fig4-data1-v2.xlsx
Figure 4—figure supplement 1
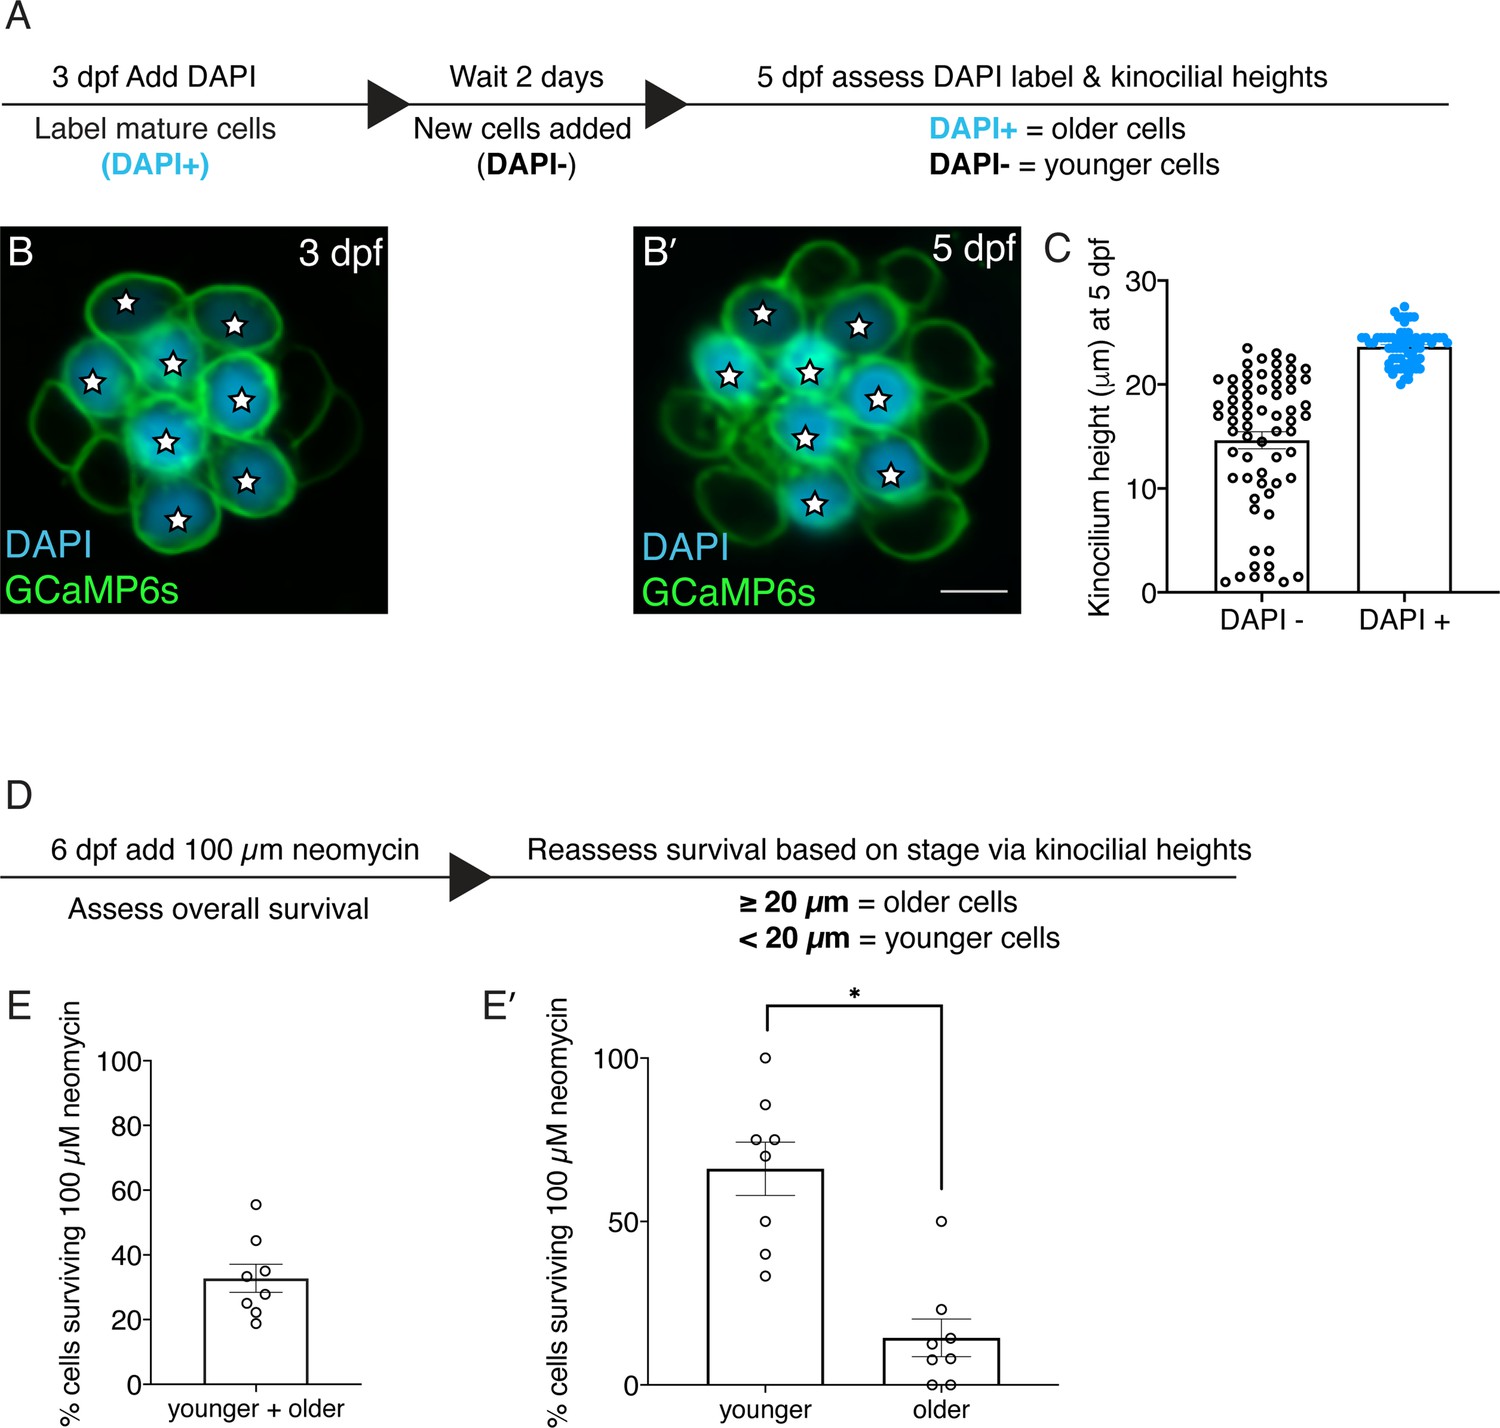
Older hair cells are more susceptible to neomycin.
(A) Overview of procedure to label hair cells and monitor development over time. (B) Example image of functionally mature hair cells in wildtype larvae labeled with DAPI at 3 dpf. (B’) The same neuromast in B reimaged 2 days later at 5 dpf. DAPI-positive cells at 5 dpf represent relatively older hair cells compared to DAPI-negative hair cells. (C) Kinocilial height measurements in DAPI-positive and DAPI-negative hair cells at 5 dpf. The height of the kinocilium in all DAPI-positive hair cells was above 20 µm. In contrast, there is a spread of kinocilial heights in DAPI-negative hair cells from 1 to 23.5 µm. (D) Overview of procedure to relate hair cell survival to age based on kinocilial height. Hair cells with a kinocilial height above 20 µm were classified as older and below 20 µm are relatively younger. (E) After treatment with 100 µM neomycin ~one third of hair cells survived per neuromast. (E’) Of the cells that survive in E, significantly more are older with a kinocilial height >20 µm. 8 neuromasts were examined in C and E-E’. Each dot in C represents one hair cell and each dot in E-E’ represents one neuromast. Error bars: SEM. For comparisons, a Mann-Whitney test was used in E’. * p<0.05. Scale bar in B’=5 µm.
-
Figure 4—figure supplement 1—source data 1
Mean numbers and statistics for cell stage and survival.
- https://cdn.elifesciences.org/articles/77775/elife-77775-fig4-figsupp1-data1-v2.xlsx
Figure 5 with 3 supplements

Cav1.3a and otofb mutants exhibit reduced mitochondrial oxidation and mitochondrial activity.
(A–C) Hair cells in a wildtype, cav1.3a-/- or otofb-/- neuromast (labeled with GCaMP6s) after 30-min incubation with 12.5 µM CellROX. (B) Average dots plots show that CellROX Orange fluorescence intensity is lower in cav1.3a-/- (blue) and otofb-/- (orange) mutants compared to wildtype siblings (black, gray). (E–G) Hair cells in a wildtype, cav1.3a-/- or otofb-/- neuromast (labeled with GCaMP6s) after a 15-min incubation with 5 µM MitoSOX. (H) Average dots plots show that MitoSOX Red fluorescence intensity is lower in cav1.3a-/- (blue) and otofb-/- (orange) mutants compared to wildtype siblings (black, gray). (I–K) Hair cells in a wildtype, cav1.3a-/- or otofb-/- neuromast (labeled with GCaMP6s) following a 30-min incubation with 10 nM TMRE. (L) Average dots plots show that the TMRE fluorescence intensity is reduced in both cav1.3a-/- (blue) and otofb-/- (orange) mutants compared to respective siblings (black, gray). Each dot in D, H, and L represents one neuromast. A minimum of 5 animals were examined at 6 dpf per treatment group. Error bars: SEM. For comparisons, an unpaired t-test was used. i in A-C are not hair cells but ionocytes labeled by CellROX. * p<0.05, ** p<0.01, *** p<0.001. Scale bar = 5 µm.
-
Figure 5—source data 1
Mean numbers and statistics for mitochondrial dye labeling.
- https://cdn.elifesciences.org/articles/77775/elife-77775-fig5-data1-v2.xlsx
Figure 5—figure supplement 1
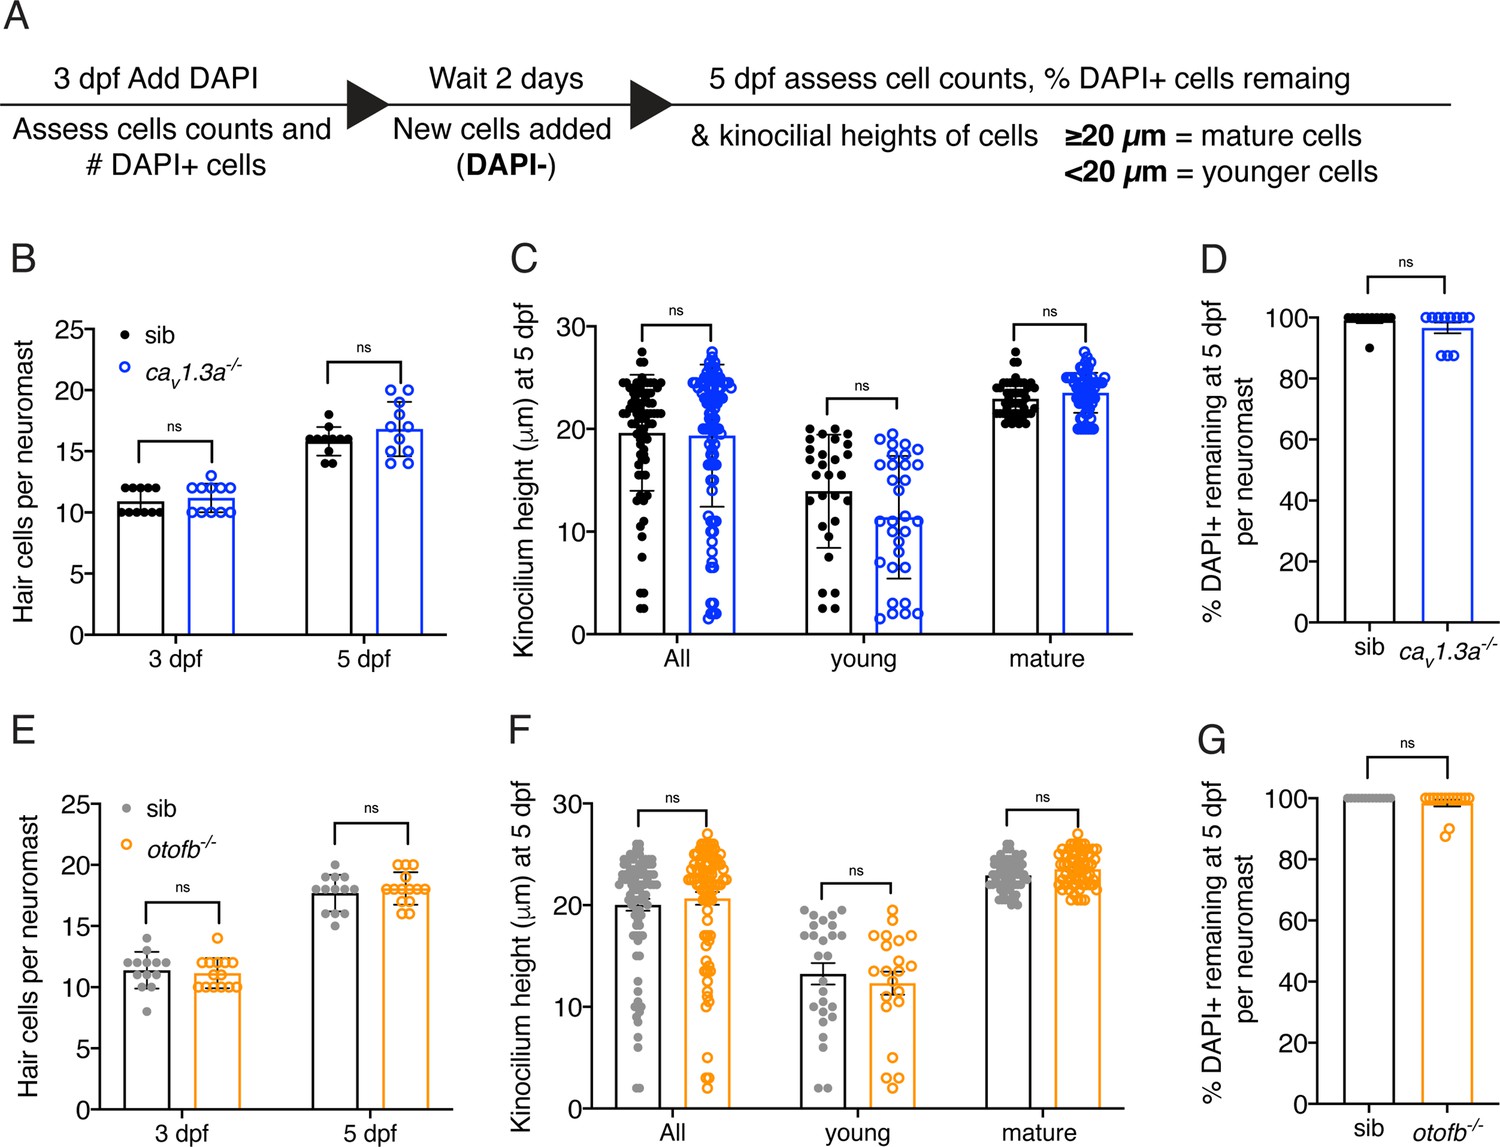
Hair cell development and turnover are largely normal in cav1.3a and otofb mutants.
(A) Overview of procedure to label hair cells and monitor development and turnover overtime. (B, E) At both 3 and 5 dpf, caV1.3a-/- and otofb-/- mutants have the same number of hair cells per neuromast. A hair cell is defined as any hair cell with DAPI labeling. (C, F) Using the average height of the kinocilium (tallest part of the hair bundle) to assess the maturity of hair cells reveals no difference in caV1.3a-/- and otofb-/- mutants compared to controls. In mature neuromasts at 5 dpf, quantification reveals that the average height of the kinocilium in all hair cells, young hair cells and mature hair cells is not significantly different in caV1.3a-/- and otofb-/- mutants compared to controls. (D, G) After labeling mature hair cells with DAPI at 3 dpf, a high percentage of these DAPI + cells remain at 5 dpf in all genotypes. This indicates no significant loss of hair cells in caV1.3a-/- and otofb-/- mutants compared to controls. 8 neuromasts were examined per genotype in B-C and E-F. In D and G at least 11 neuromast were examined per genotype. Each dot in B, D, E, and G represents one neuromast. In C and F, each dot represents a single hair cell. Error bars: SEM. In D and G, a Mann-Whitney test was used, and in B-C and E-F a two-way ANOVA with a Sidak’s correction for multiple comparisons was used to compare differences.
-
Figure 5—figure supplement 1—source data 1
Mean numbers and statistics for cell stage and turnover.
- https://cdn.elifesciences.org/articles/77775/elife-77775-fig5-figsupp1-data1-v2.xlsx
Figure 5—figure supplement 2
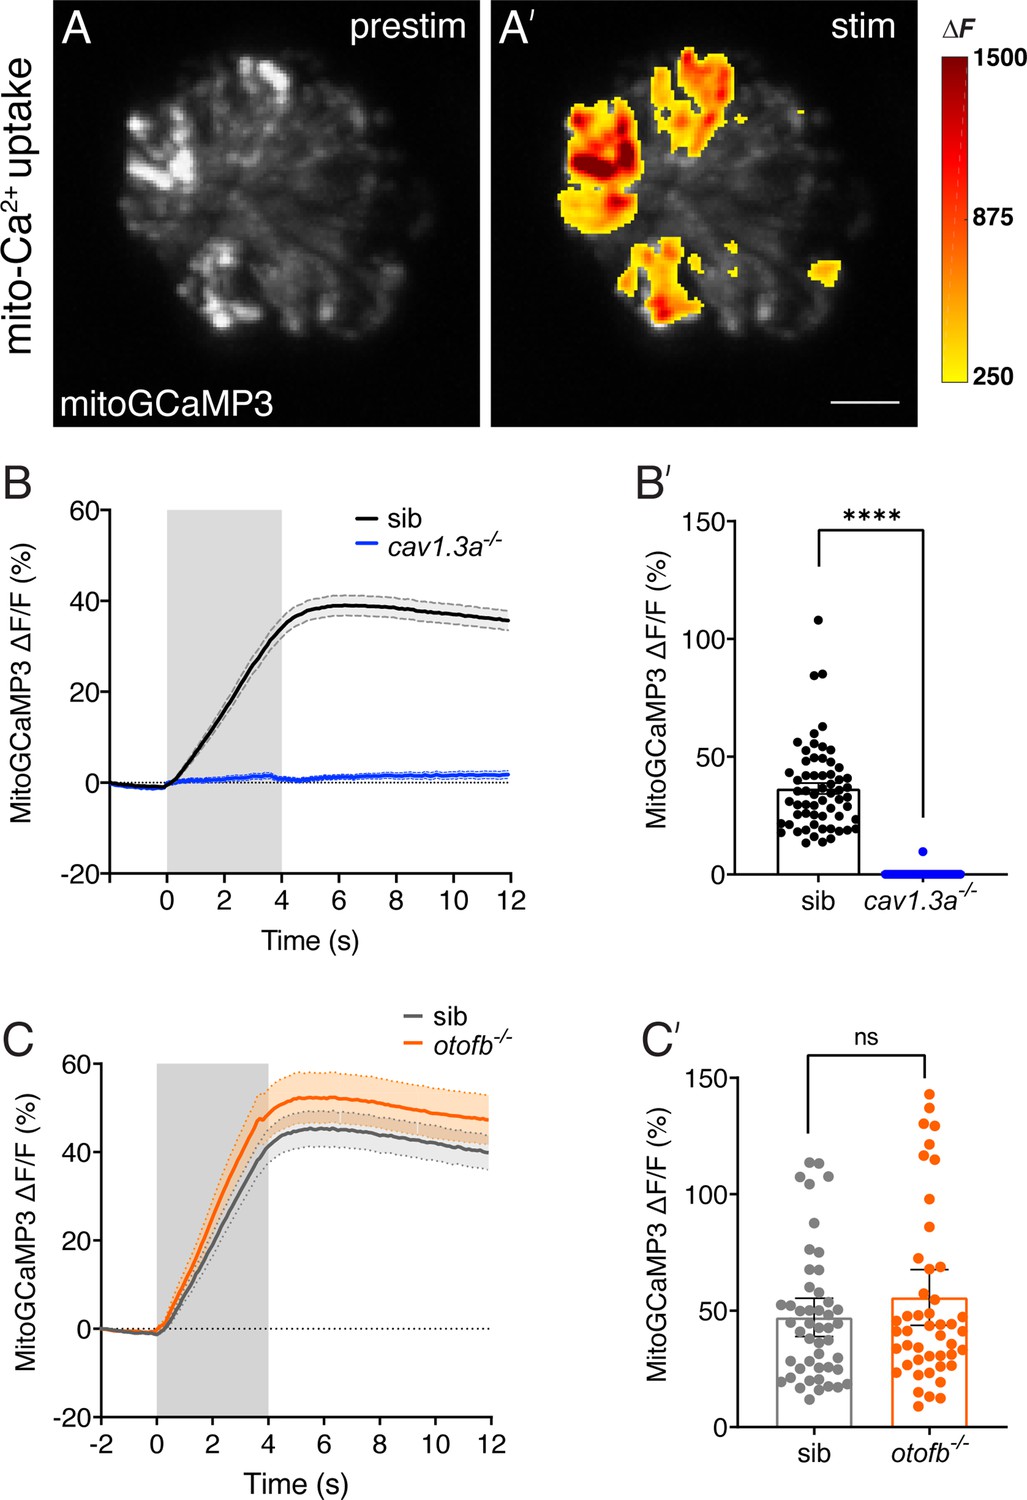
Evoked mitochondrial calcium uptake is normal in otofb mutants and absent in cav1.3a mutants.
(A-A’) Hair cells from a wildtype neuromast expressing mitoGCaMP3 at 5 dpf before and during a 4 second fluid-jet stimulus. The heat map indicates spatial increases in mitochondrial calcium influx (mitoGCaMP3 ΔF) during stimulation (A’) compared to prestimulus (A). (B-B’) Average traces (B) and dot plot (B’) show that presynaptic mitoGCaMP3 signals are absent in cav1.3a-/- mutants. (C-C’) Average traces (C) and dot plot (C’) show that the average magnitude of presynaptic mitoGCaMP3 signals are not different in otofb-/- mutants compared to siblings. In B and C, the fluid-jet stimulus is depicted as a gray box. Each dot in B’ and C’ represents one hair cell. A minimum of 10 neuromasts and 5 animals were examined per treatment group. Error bars = SEM. For comparisons a Mann-Whitney test was used in B’ and C’. **** p<0.0001. Scale bar = 5 µm.
-
Figure 5—figure supplement 2—source data 1
Mean numbers and statistics for mitoGCaMP3 responses.
- https://cdn.elifesciences.org/articles/77775/elife-77775-fig5-figsupp2-data1-v2.xlsx
Figure 5—figure supplement 3
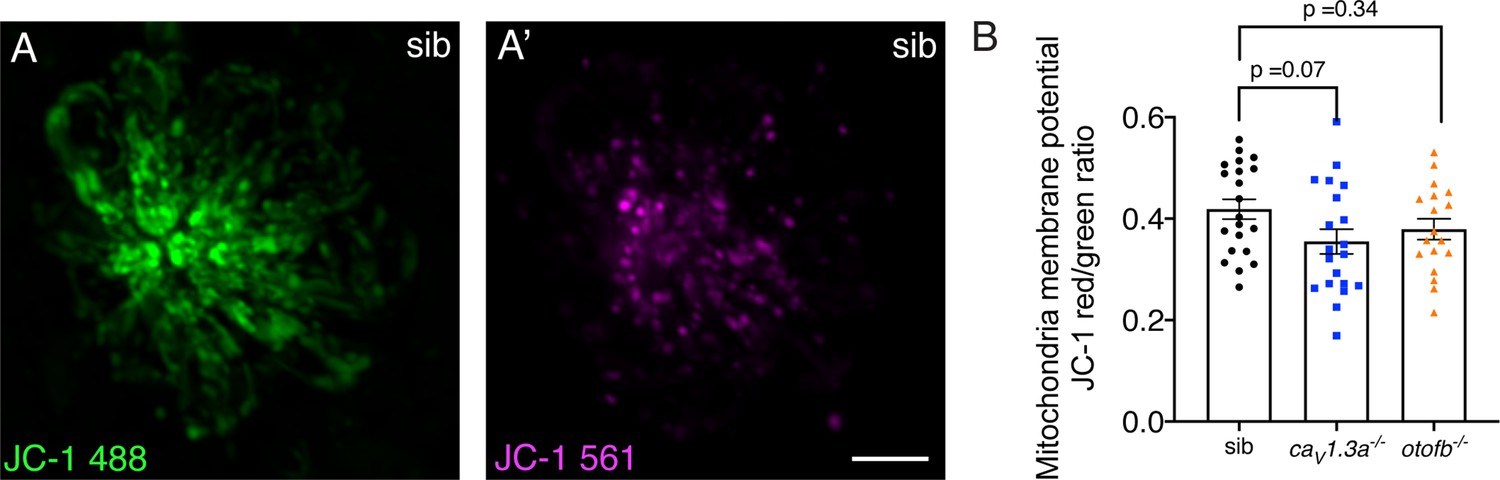
JC-1 shows a trend towards reduced mitochondrial activity in cav1.3a and otofb mutants.
(A-A’) Hair cells in a wildtype neuromast after 5-min incubation with 1.5 µM of JC-1. JC-1 is a ratiometric indicator of mitochondrial membrane potential that shifts from green (A) to an aggregated red form (A’) in more active mitochondria. (B) Although the average dots plots show that JC-1 fluorescence intensity is lower in caV1.3a-/- (blue) and otofb-/- (orange) mutants compared to wildtype siblings (black), the reduction did not reach significance. Each dot represents one neuromast. A minimum of 18 neuromasts were examined at 6 dpf per group. Error bars: SEM. A one-way ANOVA with a Dunnett’s correction for multiple comparisons was used to compare between genotypes.
-
Figure 5—figure supplement 3—source data 1
Mean numbers and statistics for JC-1 labeling.
- https://cdn.elifesciences.org/articles/77775/elife-77775-fig5-figsupp3-data1-v2.xlsx
Figure 6
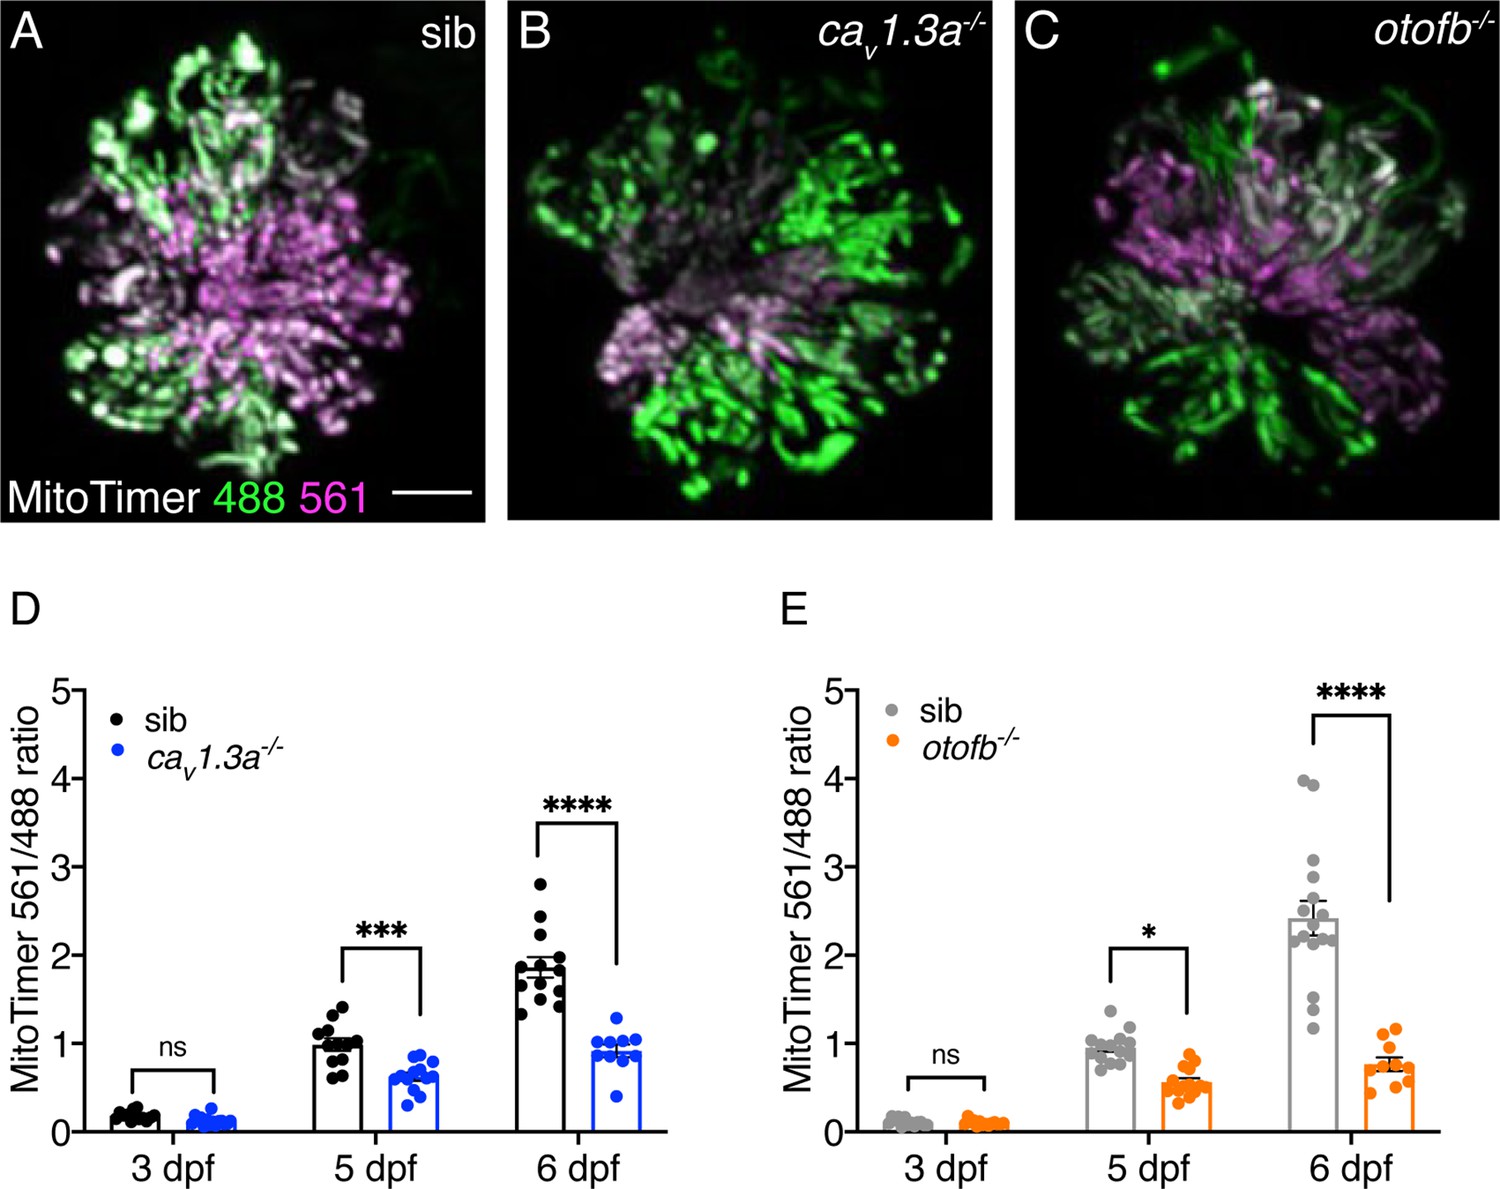
Red-shifted oxidized MitoTimer signal is reduced in cav1.3a and otofb mutants.
(A–C) Hair cells in wildtype (A), cav1.3a-/- mutant (B), and otofb-/- mutant (C) Tg[myosin6b:mitoTimer]w208 neuromasts at 5 dpf. (D–E) Average dot plots of the ratio of red/green MitoTimer fluorescence intensity at 3, 5, and 6 dpf in cav1.3a-/- mutant fish (blue) (D) and otofb-/- mutant fish (orange) (E) and respective siblings (black, gray) show that mutants exhibit reduced mitochondrial oxidation over time. Each dot in D and E represents one neuromast. A minimum of 3 animals and 10 neuromasts were examined per treatment group. Error bars: SEM. For comparisons, a two-way ANOVA with a Sidak’s correction for multiple comparisons was used in D-E. * p<0.05, *** p<0.001, **** p<0.0001. Scale bar = 5 µm.
-
Figure 6—source data 1
Mean numbers and statistics for Mitotimer labeling.
- https://cdn.elifesciences.org/articles/77775/elife-77775-fig6-data1-v2.xlsx
Figure 7

The synaptic vesicle cycle is a major contributor to hair-cell oxidative stress.
(A) Average dot plots show the percentage of cells surviving neomycin treatment per neuromast. A significantly higher percentage of cells survive in otofb-/- mutants (orange) compared to siblings (black) when animals are treated with 0.1% DMSO for 24 hr from 4 to 5 dpf. No additional protection is observed in otofb-/- mutants (open orange) compared to siblings (open black) when animals are treated with 10 µM isradipine for 24 hr from 4 to 5 dpf prior to neomycin challenge. (B) Cartoon schematic of a hair cell with black box around the ribbon (magenta) synapse. (C) Close up of synapse demarcated in (B). Both presynaptic calcium influx (blue) and otoferlin (orange) function consume ATP (red stars) and stimulate ROS (yellow box) production. Blocking calcium influx inhibits both processes and reduces ROS levels. Blocking the synaptic vesicle cycle alone reduces ROS levels to a similar extent as the calcium channel block. Each dot in A represents one neuromast. A minimum of three animals were examined per treatment group. Error bars: SEM. For comparisons, a two-way ANOVA with a Sidak’s correction for multiple comparisons was used in A. * p<0.05.
-
Figure 7—source data 1
Mean numbers and statistics ototoxicity analyses.
- https://cdn.elifesciences.org/articles/77775/elife-77775-fig7-data1-v2.xlsx
Tables
Key resources table
| Reagent type (species) or resource | Designation | Source or reference | Identifiers | Additional information |
|---|---|---|---|---|
| Strain, strain background (Danio rerio) | Tübingen | ZIRC | http://zfin.org/ZDB-GENO-990623-3 | See methods, animals |
| Genetic reagent (Danio rerio) | Tg(myo6b:GCaMP6s-CAAX)idc1; GCaMP6CAAX; | Jiang et al., 2017 | https://zfin.org/ZDB-ALT-170113-3 | Membrane-localized calcium biosensor |
| Genetic reagent (Danio rerio) | Tg(myo6b:mitoGCaMP3)w119Tg; MitoGCaMP3; | Esterberg et al., 2014 | https://zfin.org/ZDB-ALT-141008-1 | Mitochondria-localized calcium biosensor |
| Genetic reagent (Danio rerio) | Tg(myo6b:mitoTimer)w208Tg; MitoTimer | Pickett et al., 2018 | https://zfin.org/ZDB-ALT-190708-1 | Mitochondria-localized ROS biosensor |
| Genetic reagent (Danio rerio) | Tg(myo6b:SypHy)idc6Tg; SypHy | Zhang et al., 2018 | https://zfin.org/ZDB-ALT-171205-5 | Hair-cell localized vesicle fusion indicator |
| Genetic reagent (Danio rerio) | cav1.3atn004 mutants; gemini; cacna1da | Sidi et al., 2004 | https://zfin.org/ZDB-GENE-030616-135 | Mutants lacking functional Cav1.3 channels |
| Genetic reagent (Danio rerio) | otofb | This paper | https://zfin.org/ZDB-ALT-211124-4 | Crispr-Cas9 mutant. See Materials and Methods, “Animals” |
| Genetic reagent (Danio rerio) | otofa | This paper | https://zfin.org/ZDB-ALT-211124-3 | Crispr-Cas9 mutant. See Materials and Methods, “Animals” |
| Sequence-based reagent | otofa guide | This paper | PCR primers | 5’- GGGCACCTTCAAACTAGACG(TGG)–3’, made by IDT |
| Sequence-based reagent | otofb guide | This paper | PCR primers | 5’-GGAGCTCCACTGAGGTGCAGG(TGG)–3’, made by IDT |
| Sequence-based reagent | OTOFA FWD | This paper | PCR primers | 5’-ATCAAACCTCCATTGGAAACAG-3’, made by Integrated DNA Technologies (IDT) |
| Sequence-based reagent | OTOFA REV | This paper | PCR primers | 5’-CCCATTTGTGATGAAACTGATG-3’, made by IDT |
| Sequence-based reagent | OTOFB FWD | This paper | PCR primers | 5’- CTGGTTCATTCGTAGGCTTTCT-3’, made by IDT |
| Sequence-based reagent | OTOFB REV | This paper | PCR primers | 5’-TGCTTACATCAGAGATGTTGGG-3’, made by IDT |
| Antibody | Otoferlin (mouse monoclonal) | Developmental Studies Hybridoma Bank | RRID:AB_10804296 HCS-1 | Use at 1:1000 |
| Antibody | Alexa Fluor 488 (goat polyclonal) | ThermoFisher | A-11001 | Use at 1:1000 |
| Other | Prolong Gold | ThermoFisher | P10144 | See methods, immunohistochemistry |
| Peptide, recombinant protein | α-bungarotoxin | Tocris | 2133 | See methods, paralysis and immobilization |
| Chemical compound, drug | Isradipine; Israd | Sigma-Aldrich | I6658 | See methods, cell-death assays |
| Chemical compound, drug | Tricaine; MESAB | Sigma-Aldrich | A5040 | See methods, paralysis and immobilization |
| Chemical compound, drug | Dynole 34–2 | Tocris Biosciences | 4222 | See methods, cell-death assays |
| Chemical compound, drug | Neomycin; Neo | Sigma-Aldrich | N1142 | See methods, cell-death assays |
| Chemical compound, drug | Gentamicin; Gent | Sigma-Aldrich | G1272 | See methods, cell-death assays |
| Other | FM 4–64 | ThermoFisher | T3166 | See methods, cell-death assays |
| Other | Texas Red-x-succinimidyl ester | ThermoFisher | T20175 | See methods, Neomycin-Texas Red uptake |
| Other | CellROX Orange | ThermoFisher | C10444 | See methods, live imaging |
| Other | MitoSOX Red | ThermoFisher | M36008 | See methods, live imaging |
| Other | TMRE | ThermoFisher | T669 | See methods, live imaging |
| Other | DAPI | ThermoFisher | D1306 | See methods, live imaging |
| Software, algorithm | Prism (v. 8) | Graphpad Software | RRID:SCR_002798; https://www.graphpad.com | See methods, statistics |
| Software, algorithm | Adobe Illustrator | Adobe | RRID:SCR_014198; https://www.adobe.com | See figures |
| Software, algorithm | FIJI is just ImageJ | NIH | RRID:SCR_003070; https://fiji.sc | See methods, image analysis |
| Software, algorithm | PolyPeak Parser | Hill et al., 2014 | http://yosttools.genetics.utah.edu/PolyPeakParser/ | See methods, animals |
| Software, algorithm | Zen | Zeiss | RRID:SCR_01367; https://www.zeiss.com/microscopy/int/products/microscope-software/zen.html | See methods, immunohistochemistry |
| Software, algorithm | Prairie View | Bruker Corporation | RRID:SCR_017142; https://www.bruker.com/products/fluorescence-microscopes/ultima-multiphoton-microscopy/ultima-in-vitro/overview.html | See methods, functional imaging |
| Software, algorithm | G*Power | Faul et al., 2009 | RRID:SCR_013726; https://doi.org/10.3758/BRM.41.4.1149 http://www.gpower.hhu.de/ | See methods, statistics |
| Software, algorithm | Igor Pro | Wavemetrics | RRID:SCR_000325; http://www.wavemetrics.com/products/igorpro/igorpro.htm | See methods, electrophysiology |
| Software, algorithm | pClamp 10 | Molecular Devices | RRID:SCR_011323; http://www.moleculardevices.com/products/software/pclamp.html | See methods, electrophysiology |
Additional files
Download links
A two-part list of links to download the article, or parts of the article, in various formats.
Downloads (link to download the article as PDF)
Open citations (links to open the citations from this article in various online reference manager services)
Cite this article (links to download the citations from this article in formats compatible with various reference manager tools)
Chronic neurotransmission increases the susceptibility of lateral-line hair cells to ototoxic insults
eLife 11:e77775.
https://doi.org/10.7554/eLife.77775


