The evolution and biological correlates of hand preferences in anthropoid primates
- Department of General Zoology, University of Duisburg-Essen, Germany
- Department of Game Management and Wildlife Biology, Faculty of Forestry and Wood Sciences, Czech University of Life Sciences, Czech Republic
- Institute for Theoretical Biology, Department of Biology, Humboldt-Universität zu Berlin, Germany
- Independent researcher, Brazil
Figures
Figure 1
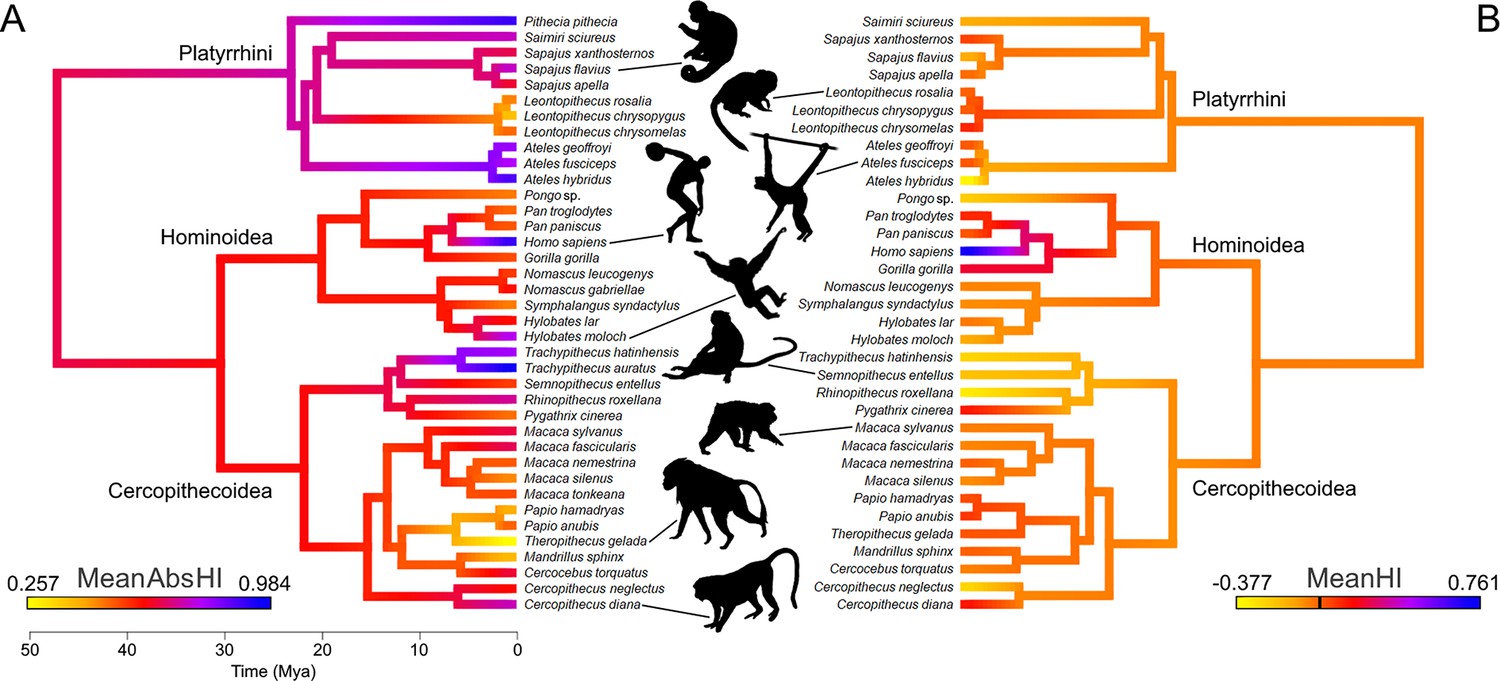
A color-coded phylogeny of hand preferences in anthropoid primates.
The strength (A) and direction (B) of laterality, expressed by the mean absolute handedness index (MeanAbsHI) and the mean handedness index (MeanHI; 0 is marked by the black bar on the color scale), respectively, calculated for each species and inferred for each tree node by maximum likelihood estimates. Silhouettes by Kai R Caspar, except Ateles (by Yan Wong, public domain) and Homo (public domain).
Figure 2

Violin plots of hand preference distribution in 22 genera of anthropoid primates and the genus-specific expression of three potential biological correlates (ecology, habitual foraging-related tool use, and absolute brain size).
Attributions only apply to the species that represent the respective genus within our sample. Color coding: Ecology – green: arboreal, yellow: terrestrial; Habitual tool use – gray: present; white: absent. Brain size is visualized here as the log-transformed genus average of female endocranial volume.
Figure 3
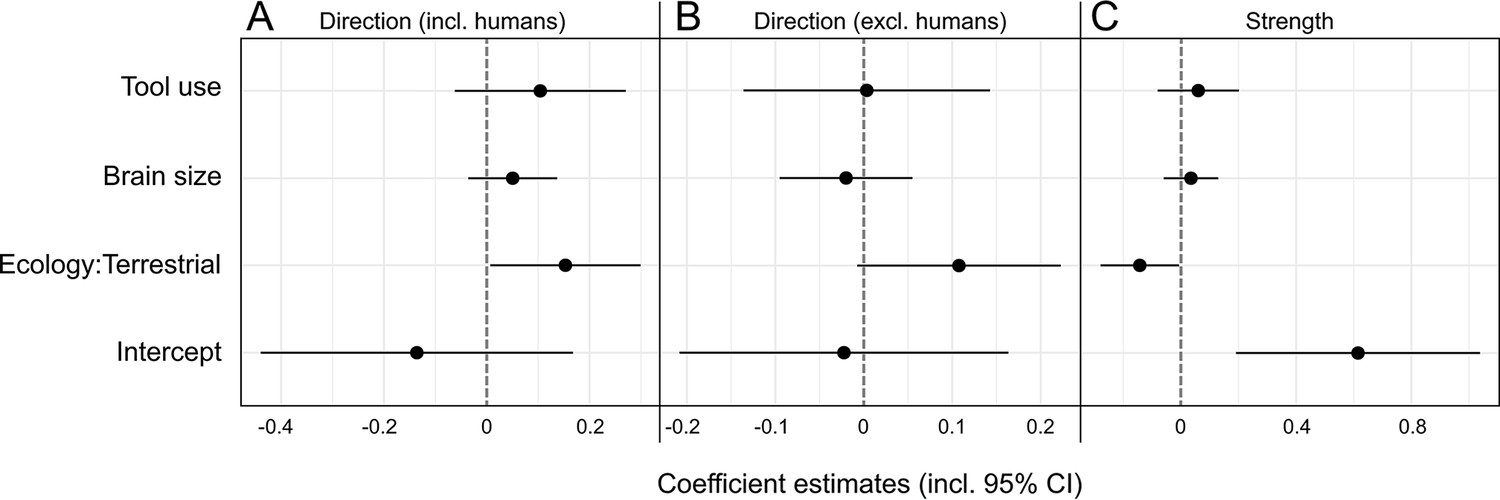
Visualization of phylogenetic generalized least squares (PGLS) coefficient estimates (including 95% confidence intervals) for the influence of brain size, tool use, and ecology on lateralization direction (A, B) as well as strength (C) in anthropoid primates.
Two models for lateralization direction were computed, one including (A), the other one excluding humans (B). The strength model encompassed humans as well (C).
Figure 4
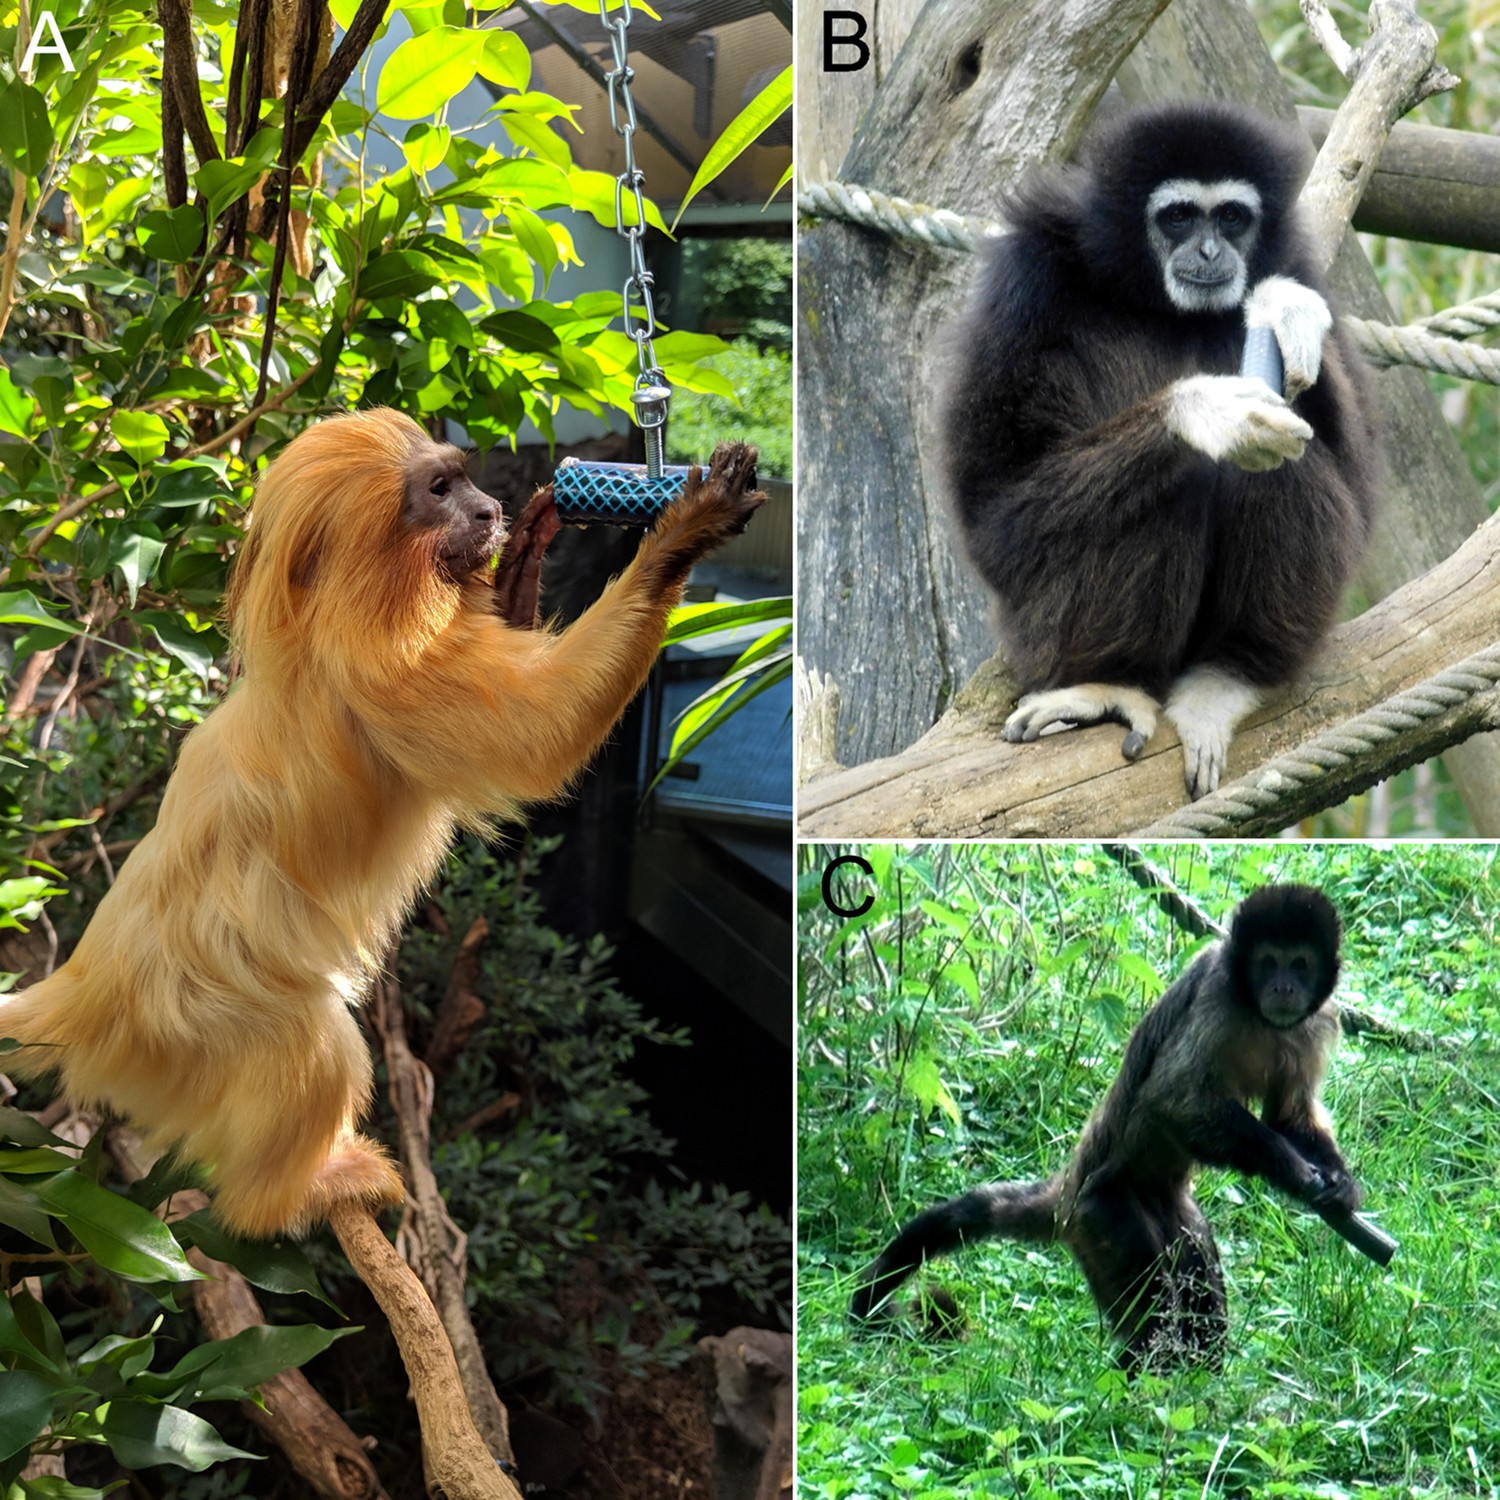
Various anthropoid primates engaging in the tube task.
(A) Golden lion tamarin (Leontopithecus rosalia) manipulating a small tube at Zoo Frankfurt, Germany. (B) White-handed gibbon (Hylobates lar) handling a large tube at Bioparc de Doué-la-Fontaine, France. Note that the thumb is used to probe into the tube, an insertion pattern characteristic of gibbons. (C) Yellow-breasted capuchin (Sapajus xanthosternos) engaging in the task with a medium-sized tube while adopting an erect bipedal stance at ZooParc Overloon, the Netherlands. Photographs by Kai R Caspar.
Tables
Table 1
Hand preferences of anthropoid species as recovered by the tube task.
Bold numbers indicate significant results. Results marked with an asterisk (*) remain significant after Bonferroni correction.
| Species | N | # Left (%) | # Right (%) | # Ambipreferent (%) | MeanHI | MeanAbsHI | Species direction bias (HI), p value | Species L/R/A distribution, p value | nGenus | Genus direction bias (HI), p value | Genus L/R/A distribution, p value |
|---|---|---|---|---|---|---|---|---|---|---|---|
| Ateles fusciceps | 46 | 20 (43.5) | 22 (47.8) | 4 (8.7) | 0.063 | 0.798 | 0.618 | 0.288 | 87 | 0.759 | 0.031 |
| Ateles geoffroyi | 23 | 10 (43.5) | 11 (47.8) | 2 (8.7) | 0.061 | 0.829 | 0.748 | 0.536 | |||
| Ateles hybridus | 18 | 13 (72.2) | 5 (27.8) | 0 | –0.377 | 0.917 | 0.086 | 0.018 | |||
| Cercocebus torquatus | 31 | 13 (41.9) | 11 (35.5) | 7 (22.6) | –0.029 | 0.665 | 0.832 | 0.836 | 31 | 0.832 | 0.836 |
| Cercopithecus diana | 20 | 7 (35) | 10 (50) | 3 (15) | 0.178 | 0.755 | 0.339 | 0.836 | 45 | 0.572 | 0.222 |
| Cercopithecus neglectus | 25 | 14 (56) | 7 (28) | 4 (16) | –0.258 | 0.621 | 0.061 | 0.140 | |||
| Gorilla gorilla | 76 | 17 (22.4) | 41 (53.9) | 18 (23.7) | 0.248 | 0.541 | <0.001* | 0.007 | 76 | <0.001* | 0.007 |
| Homo sapiens | 127 | 12 (9.5) | 111 (87.4) | 4 (3.1) | 0.761 | 0.943 | <0.001* | <0.001* | 127 | <0.001* | <0.001* |
| Hylobates lar | 36 | 17 (47.2) | 16 (44.5) | 3 (8.3) | –0.011 | 0.614 | 0.924 | 0.182 | 58 | 0.612 | 0.125 |
| Hylobates moloch | 22 | 11 (50) | 8 (36.4) | 3 (13.6) | –0.115 | 0.799 | 0.540 | 0.552 | |||
| Leontopithecus chrysomelas | 30 | 7 (23.3) | 12 (40) | 11 (36.7) | 0.151 | 0.514 | 0.171 | 0.012 | 73 | 0.241 | <0.001* |
| Leontopithecus chrysopygus | 15 | 3 (20) | 4 (26.7) | 8 (53.3) | 0.039 | 0.350 | 0.744 | 0.001* | |||
| Leontopithecus rosalia | 28 | 10 (35.7) | 8 (28.6) | 10 (35.7) | 0.022 | 0.502 | 0.850 | 0.033 | |||
| Macaca fascicularis | 20 | 8 (45) | 10 (45) | 2 (10) | –0.036 | 0.684 | 0.835 | 0.233 | 102 | 0.692 | 0.863 |
| Macaca nemestrina | 29 | 9 (31) | 11 (37.9) | 9 (31) | 0.035 | 0.527 | 0.768 | 0.750 | |||
| Macaca silenus | 35 | 14 (40) | 9 (25.7) | 12 (34.3) | –0.051 | 0.467 | 0.596 | 0.328 | |||
| Macaca sylvanus | 24 | 12 (50) | 10 (41.7) | 2 (8.3) | –0.025 | 0.670 | 0.873 | 0.129 | |||
| Macaca tonkeana | 14 | 5 (35.7) | 3 (21.4) | 6 (42.9) | –0.057 | 0.543 | 0.753 | 0.291 | |||
| Mandrillus sphinx | 32 | 6 (18.8) | 10 (31.2) | 16 (50) | 0.034 | 0.389 | 0.701 | 0.006 | 32 | 0.701 | 0.006 |
| Nomascus gabriellae | 10 | 5 (50) | 2 (20) | 3 (30) | –0.173 | 0.618 | 0.465 | 0.436 | 36 | 0.539 | 0.805 |
| Nomascus leucogenys | 26 | 9 (34.6) | 11 (42.3) | 6 (23.1) | –0.031 | 0.555 | 0.818 | 0.869 | |||
| Pan paniscus | 118 | 50 (42.4) | 51 (43.2) | 17 (14.4) | 0.044 | 0.529 | 0.431 | 0.237 | 654 | <0.001* | <0.001* |
| Pan troglodytes | 536 | 155 (28.9) | 266 (49.6) | 115 (21.5) | 0.133 | 0.507 | <0.001* | <0.001* | |||
| Papio anubis | 84 | 27 (32.1) | 41 (48.8) | 16 (19.1) | 0.108 | 0.527 | 0.102 | 0.073 | 108 | 0.079 | 0.239 |
| Papio hamadryas | 24 | 6 (25) | 7 (29.2) | 11 (45.8) | 0.066 | 0.408 | 0.533 | 0.082 | |||
| Pithecia pithecia | 7 | 5 (71.4) | 2 (28.6) | 0 | –0.385 | 0.934 | 0.312 | 0.221 | 7 | NA | 0.221 |
| Pongo sp. | 47 | 27 (57.5) | 9 (19.1) | 11 (23.4) | –0.225 | 0.487 | 0.006 | 0.012 | 47 | 0.006 | 0.012 |
| Pygathrix cinerea | 18 | 6 (33.3) | 10 (55.6) | 2 (11.1) | 0.165 | 0.499 | 0.268 | 0.196 | 18 | 0.268 | 0.196 |
| Rhinopithecus roxellana | 24 | 17 (70.8) | 7 (29.2) | 0 | –0.319 | 0.729 | 0.040 | <0.001* | 24 | 0.040 | <0.001* |
| Saimiri sciureus | 36 | 21 (58.4) | 14 (38.9) | 1 (2.7) | –0.119 | 0.757 | 0.382 | 0.031 | 36 | 0.382 | 0.031 |
| Sapajus apella | 25 | 11 (44) | 10 (40) | 4 (16) | –0.028 | 0.687 | 0.854 | 0.961 | 80 | 0.922 | 0.905 |
| Sapajus flavius | 21 | 10 (47.6) | 7 (33.3) | 4 (19) | –0.130 | 0.769 | 0.495 | 0.755 | |||
| Sapajus xanthosternos | 34 | 14 (41.2) | 15 (44.1) | 5 (14.7) | 0.089 | 0.677 | 0.492 | 0.906 | |||
| Semnopithecus entellus | 30 | 15 (50) | 7 (23.4) | 8 (26.6) | –0.184 | 0.560 | 0.110 | 0.315 | 30 | 0.110 | 0.315 |
| Symphalangus syndactylus | 31 | 11 (35.5) | 9 (29) | 11 (35.5) | –0.048 | 0.482 | 0.663 | 0.118 | 31 | 0.663 | 0.118 |
| Theropithecus gelada | 38 | 6 (15.8) | 6 (15.8) | 26 (68.4) | 0.053 | 0.257 | 0.326 | <0.001* | 38 | 0.326 | <0.001* |
| Trachypithecus auratus | 8 | 5 (62.5) | 3 (37.5) | 0 | –0.256 | 0.984 | 0.499 | 0.176 | 26 | 0.153 | 0.004 |
| Trachypithecus hatinhensis | 18 | 11 (61.1) | 7 (38.9) | 0 | –0.248 | 0.817 | 0.219 | 0.023 |
Table 2
Conditional average of phylogenetic generalized least squares (PGLS) model coefficients for lateralization strength and direction in anthropoid primate species.
Bold numbers indicate significant results. VIF = variable inflation factor.
| A: Conditional PGLS model average for lateralization direction, including humans | ||||
|---|---|---|---|---|
| Predictor | Estimate | Std. error | VIF | p value |
| Ecology (terrestrial lifestyle) | 0.153 | 0.072 | 1.499 | 0.040 |
| Tool use (present) | 0.104 | 0.082 | 1.164 | 0.220 |
| Log10 brain size | 0.050 | 0.043 | 1.612 | 0.254 |
| B: Conditional PGLS model average for lateralization direction, excluding humans | ||||
| Predictor | Estimate | Std. error | VIF | p value |
| Ecology (terrestrial lifestyle) Log10 brain size Tool use (present) | 0.108 –0.020 0.003 | 0.056 0.037 0.068 | 1.419 1.405 1.098 | 0.067 0.601 0.962 |
| C: Conditional PGLS model average for lateralization strength | ||||
| Predictor | Estimate | Std. error | VIF | p value |
| Ecology (terrestrial lifestyle) | –0.143 | 0.067 | 1.813 | 0.040 |
| Tool use (present) | 0.060 | 0.070 | 1.235 | 0.402 |
| Log10 brain size | 0.035 | 0.047 | 1.997 | 0.468 |
Table 3
Results of phylogenetic generalized least squares (PGLS) model averaging for lateralization direction (considering the inclusion and exclusion of humans) and strength.
Null models are shown in italics. Df. = degrees of freedom. AICc = second-order Akaike information criterion.
| A: PGLS model for lateralization direction, including humans | ||||
|---|---|---|---|---|
| Components | Df. | AICc | ΔAICc | Weight |
| Ecology | 3 | –13.60 | 0 | 0.28 |
| Ecology, tool use | 4 | –13.37 | 0.23 | 0.25 |
| Brain size | 3 | –12.22 | 1.38 | 0.14 |
| Ecology, brain size | 4 | –12.07 | 1.54 | 0.13 |
| Ecology, tool use, brain size | 5 | –10.87 | 2.73 | 0.07 |
| (NULL) | 2 | –10.37 | 3.23 | 0.05 |
| Tool use, brain size | 4 | –10.20 | 3.41 | 0.05 |
| Tool use | 3 | –9.48 | 4.12 | 0.04 |
| B: PGLS model for lateralization direction, excluding humans | ||||
| Components | Df. | AICc | Δ | Weight |
| Ecology | 3 | –30.60 | 0 | 0.37 |
| (NULL) | 2 | –29.37 | 1.23 | 0.20 |
| Ecology, brain size | 4 | –28.82 | 1.78 | 0.15 |
| Ecology, tool use | 4 | –28.01 | 2.59 | 0.10 |
| Tool use | 3 | –26.98 | 3.62 | 0.06 |
| Brain size | 3 | –26.97 | 3.63 | 0.06 |
| Ecology, tool use, brain size | 5 | –26.16 | 4.44 | 0.04 |
| Tool use, brain size | 4 | –24.42 | 6.18 | 0.02 |
| C: PGLS model for lateralization strength | ||||
| Components | Df. | AICc | ΔAICc | Weight |
| Ecology | 3 | –8.84 | 0 | 0.35 |
| Ecology, brain size | 4 | –7.85 | 0.99 | 0.21 |
| Ecology, tool use | 4 | –7.33 | 1.51 | 0.16 |
| (NULL) | 2 | –6.31 | 2.53 | 0.10 |
| Ecology, brain size, tool use | 5 | –5.46 | 3.38 | 0.06 |
| Tool use | 3 | –5.05 | 3.80 | 0.05 |
| Brain size | 3 | –4.14 | 4.71 | 0.03 |
| Tool use, brain size | 4 | –3.19 | 5.66 | 0.02 |
Table 4
Composition of the study sample, listing taxonomic identity, sex, age, and origin of subjects.
See cited studies for locations of individuals drawn from the literature.
| Family | Species | # Subjects tested | # Subjects drawn from literature* | Total sample | # Adult females | # Adult males | # Subadult females | # Subadult males | # Unsexed subadults | Locations for subjects in this study |
|---|---|---|---|---|---|---|---|---|---|---|
| Atelidae | Ateles fusciceps | 37 | 9§ | 46 | 30 | 11 | 3 | 2 | 0 | Berlin (Zoo), Doué-la-Fontaine, Landau, Mulhouse, Munich, Osnabrück, Wuppertal |
| Atelidae | Ateles geoffroyi | 9 | 14¶ | 23 | 12 | 9 | 0 | 2 | 0 | Basel, Karlsruhe |
| Atelidae | Ateles hybridus | 18 | 18 | 10 | 7 | 0 | 1 | 0 | Doué-la-Fontaine, Erfurt, Frankfurt, Neuwied, Stuttgart | |
| Callitrichidae | Leontopithecus chrysomelas | 30 | 30 | 11 | 16 | 2 | 1 | 0 | Apeldoorn, Karlsruhe, Magdeburg, Mulhouse, São Paulo, Stuttgart, Wuppertal | |
| Callitrichidae | Leontopithecus chrysopygus | 15 | 15 | 6 | 9 | 0 | 0 | 0 | São Paulo | |
| Callitrichidae | Leontopithecus rosalia | 28 | 28 | 7 | 16 | 0 | 5 | 0 | Apeldoorn, Basel, Doué-la-Fontaine, Duisburg, Frankfurt, Heidelberg, Landau, Magdeburg, Münster, São Paulo | |
| Cebidae | Saimiri sciureus | 36** | 36 | 14 | 16 | 5 | 1 | 0 | ||
| Cebidae | Sapajus apella | 25††,‡ ‡ | 25 | 10 | 11 | 0 | 4 | 0 | ||
| Cebidae | Sapajus flavius | 3 | 18‡ ‡ | 21 | 7 | 9 | 2 | 3 | 0 | São Paulo |
| Cebidae | Sapajus xanthosternos | 16 | 18‡ ‡ | 34 | 11 | 19 | 1 | 2 | 1 | Apeldoorn, Magdeburg, Münster, Overloon |
| Cercopithecidae | Cercocebus torquatus | 18 | 13§ § | 31 | 15 | 13 | 1 | 2 | 0 | Apeldoorn, Berlin (Tierpark), Karlsruhe, Münster |
| Cercopithecidae | Cercopithecus diana/roloway | 20 | 20 | 9 | 7 | 3 | 1 | 0 | Amsterdam, Berlin (Tierpark), Doué-la-Fontaine, Duisburg, Heidelberg, Liberec, Mulhouse, Osnabrück | |
| Cercopithecidae | Cercopithecus neglectus | 12 | 13§ §,¶ ¶ | 25 | 8 | 12 | 1 | 4 | 0 | Bekesbourne, Duisburg, Hannover, Overloon |
| Cercopithecidae | Macaca fascicularis | 12 | 8*** | 20 | 13 | 7 | 0 | 0 | 0 | Basel, Hamm, Mönchengladbach |
| Cercopithecidae | Macaca nemestrina | 29 | 29 | 12 | 15 | 0 | 1 | 1 | Arnhem, Bali, Berlin (Tierpark), Gelsenkirchen, Osnabrück | |
| Cercopithecidae | Macaca silenus | 35 | 35 | 16 | 17 | 1 | 1 | 0 | Apeldoorn, Bekesbourne, Berlin (Zoo), Cologne, Dresden, Duisburg, Hodenhagen, Rheine | |
| Cercopithecidae | Macaca sylvanus | 15 | 9†††,‡ ‡ ‡ | 24 | 11 | 12 | 0 | 1 | 0 | Aachen, Rheine |
| Cercopithecidae | Macaca tonkeana† | 14§ § § | 14 | NA | NA | NA | NA | NA | ||
| Cercopithecidae | Mandrillus sphinx | 32 | 32 | 14 | 7 | 4 | 7 | 0 | Amsterdam, Berlin (Zoo), Dresden, Hamm, Hodenhagen | |
| Cercopithecidae | Papio anubis | 84¶ ¶ ¶ | 84 | 48 | 22 | 5 | 9 | 0 | ||
| Cercopithecidae | Papio hamadryas | 24 | 24 | 14 | 10 | 0 | 0 | 0 | Cologne, Frankfurt, Krefeld | |
| Cercopithecidae | Pygathrix cinerea | 18**** | 18 | 7 | 11 | 0 | 0 | 0 | ||
| Cercopithecidae | Rhinopithecus roxellana | 24†††† | 24 | 8 | 5 | 8 | 3 | 0 | ||
| Cercopithecidae | Semnopithecus entellus | 30 | 30 | 17 | 7 | 4 | 2 | 0 | Apeldoorn, Berlin (Zoo), Gelsenkirchen, Hannover, Heidelberg | |
| Cercopithecidae | Theropithecus gelada | 38 | 38 | 20 | 11 | 4 | 3 | 0 | Bekesbourne, Berlin (Tierpark), Magdeburg, Rheine, Stuttgart | |
| Cercopithecidae | Trachypithecus auratus | 8 | 8 | 3 | 0 | 3 | 2 | 0 | Bali, Stuttgart | |
| Cercopithecidae | Trachypithecus hatinhensis | 18**** | 18 | 8 | 10 | 0 | 0 | 0 | ||
| Hominidae | Gorilla gorilla | 76‡ ‡ ‡ ‡ | 76 | 22 | 18 | 19 | 17 | 0 | ||
| Hominidae | Homo sapiens | 127§ § § § | 127 | 71 | 56 | 0 | 0 | 0 | ||
| Hominidae | Pan paniscus | 118‡ ‡ ‡ ‡ | 118 | 29 | 23 | 35 | 31 | 0 | ||
| Hominidae | Pan troglodytes | 536‡ ‡ ‡ ‡ | 536 | 186 | 138 | 110 | 102 | 0 | ||
| Hominidae | Pongo sp. | 47‡ ‡ ‡ ‡ | 47 | 17 | 12 | 9 | 9 | 0 | ||
| Hylobatidae | Hylobates lar | 16 | 20¶ ¶ ¶ ¶,*****, ††††† | 36 | 14 | 18 | 2 | 2 | 0 | Berlin (Tierpark), Cologne, Doué-la-Fontaine, Landau, Stuttgart, Ulm, Wuppertal |
| Hylobatidae | Hylobates moloch | 22 | 22 | 8 | 5 | 4 | 5 | 0 | Bekesbourne, Lympne, Munich | |
| Hylobatidae | Nomascus gabriellae | 6 | 4***** | 10 | 5 | 3 | 0 | 2 | 0 | Arnhem, Doué-la-Fontaine |
| Hylobatidae | Nomascus leucogenys /siki | 7 | 19¶ ¶ ¶ ¶,*****, ‡ ‡ ‡ ‡ ‡ | 26 | 15 | 7 | 1 | 3 | 0 | Apeldoorn, Frankfurt, Osnabrück |
| Hylobatidae | Symphalangus syndactylus | 14 | 17¶ ¶ ¶ ¶, ***** | 31 | 12 | 11 | 4 | 4 | 0 | Arnhem, Bekesbourne, Berlin (Zoo), Dortmund, Doué-la-Fontaine, Munich, Arnhem, Hodenhagen, Osnabrück |
| Pitheciidae | Pithecia pithecia | 7 | 7 | 4 | 3 | 0 | 0 | 0 | Basel, Dresden, Krefeld | |
| Total ‡ | 501 | 1285 | 1786 | 724 | 583 | 231 | 232 | 2 |
-
*
Fulfilling our criteria.
-
†
Ages unknown, sex derived from given names.
-
‡
Not including M. tonkeana in sex and age specific categories.
-
§
-
¶
-
**
-
††
-
‡ ‡
-
§ §
-
¶ ¶
-
***
-
†††
-
‡ ‡ ‡
-
§ § §
-
¶ ¶ ¶
-
****
-
††††
-
‡ ‡ ‡ ‡
-
§ § § §
-
¶ ¶ ¶ ¶
-
*****
-
†††††
-
‡ ‡ ‡ ‡ ‡
Additional files
-
Supplementary file 1
Estimates of ancestral manual lateralization patterns in anthropoid taxa.
- https://cdn.elifesciences.org/articles/77875/elife-77875-supp1-v1.xlsx
-
Supplementary file 2
Results and visualization of Bayesian models to infer effects of sex and age cohort on individual-level hand preference patterns.
- https://cdn.elifesciences.org/articles/77875/elife-77875-supp2-v1.pdf
-
Supplementary file 3
Species-level predictors used for phylogenetic generalized least squares (PGLS) modelling.
- https://cdn.elifesciences.org/articles/77875/elife-77875-supp3-v1.xlsx
-
Transparent reporting form
- https://cdn.elifesciences.org/articles/77875/elife-77875-transrepform1-v1.docx
Download links
A two-part list of links to download the article, or parts of the article, in various formats.
Downloads (link to download the article as PDF)
Open citations (links to open the citations from this article in various online reference manager services)
Cite this article (links to download the citations from this article in formats compatible with various reference manager tools)
The evolution and biological correlates of hand preferences in anthropoid primates
eLife 11:e77875.
https://doi.org/10.7554/eLife.77875


