Structural motifs for subtype-specific pH-sensitive gating of vertebrate otopetrin proton channels
- Section of Neurobiology, Department of Biological Sciences, University of Southern California, United States
- Program in Neuroscience, University of Southern California, United States
- Diabetes, Endocrinology, and Obesity Branch, National Institute of Diabetes and Digestive and Kidney Diseases, National Institutes of Health, United States
- Department of Integrative Structural and Computational Biology, The Scripps Research Institute, United States
Figures
Figure 1
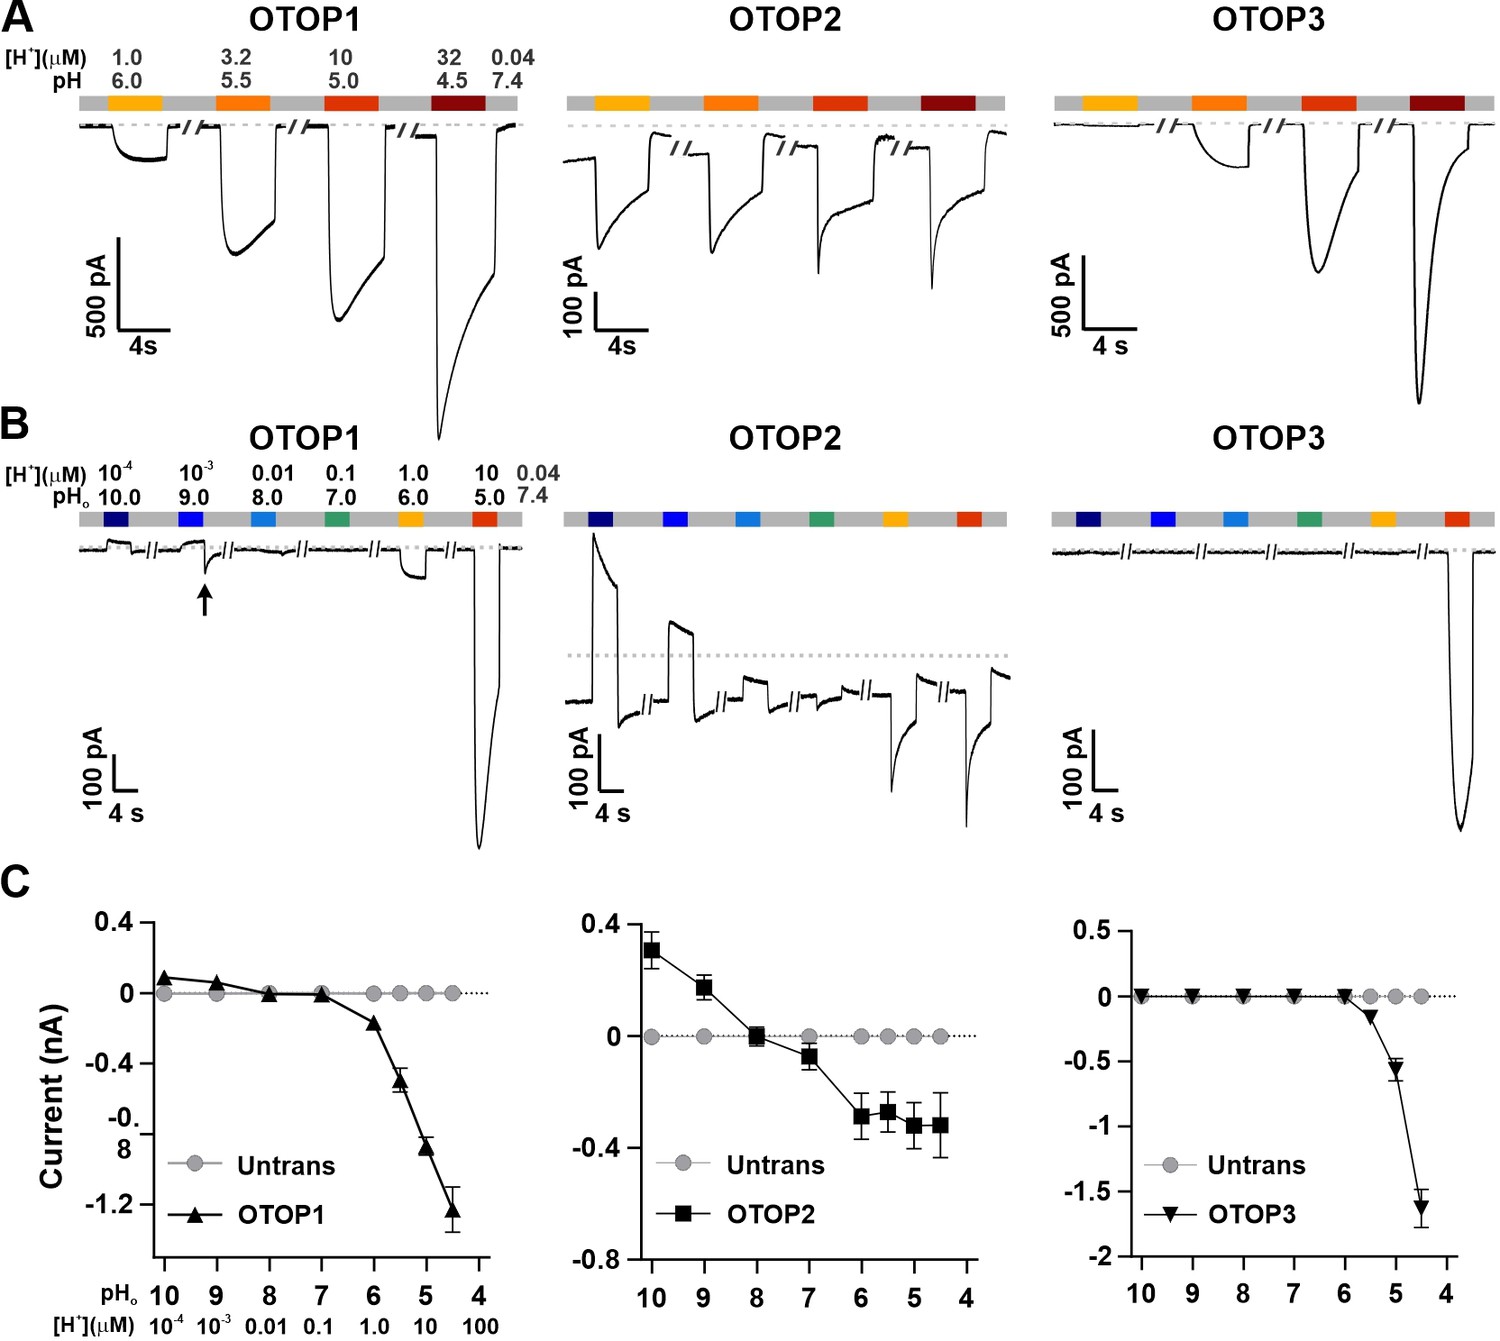
Three vertebrate OTOP channels vary in their I-pH response profile across a broad pH range.
(A) Proton currents elicited in response to acidic stimuli (pH 6–4.5) in the absence of extracellular Na+ measured from HEK-293 cells expressing each of the three OTOP channels as labeled (Vm = -80 mV). (B) Proton currents in response to solutions that varied in pH (pH 10–5) were measured from HEK-293 cells expressing each of the three OTOP channels as labeled (Vm = -80 mV). (C) Average data showing the peak current magnitude in response to stimuli of varying pHo, measured from experiments as in (A) and (B). OTOP3 currents are only observed in response to solutions of pH <5.5, while OTOP1 currents are evoked by solutions of <pH 6 and alkaline stimuli, and OTOP2 currents are evoked in response to all stimuli. Data represent mean ± s.e.m. of biological replicates where for each data point n=5–10 for OTOP1, n=6–10 for OTOP2, and n=4–10 for OTOP3.
-
Figure 1—source data 1
Source data for Figure 1C.
- https://cdn.elifesciences.org/articles/77946/elife-77946-fig1-data1-v1.xlsx
Figure 2
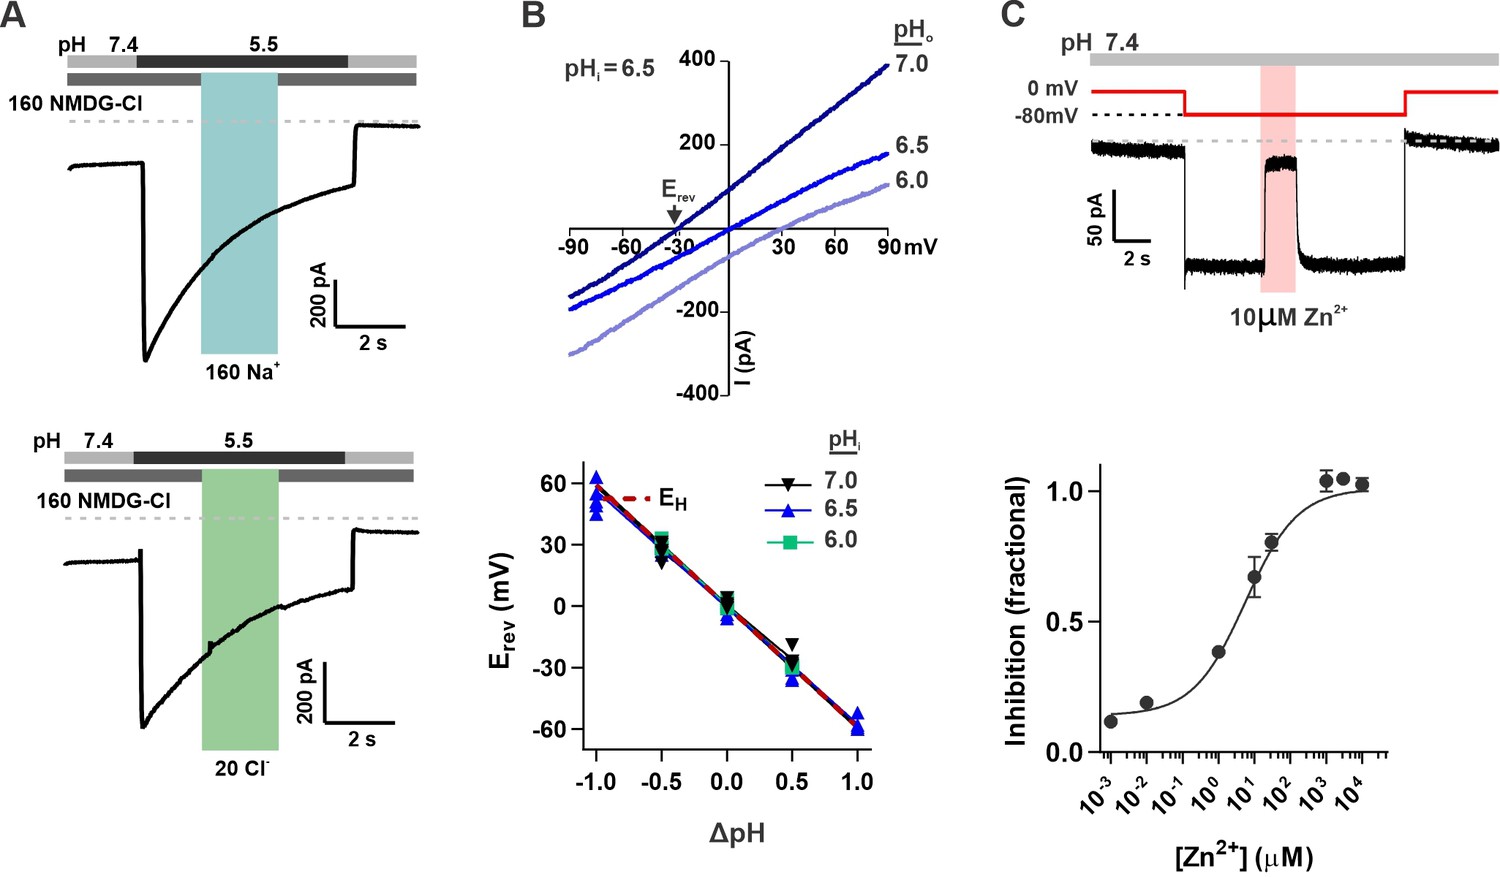
OTOP2 is a proton selective ion channel that is open at neutral pHo.
(A) Representative OTOP2 current elicited in response to a pH 5.5 solution with 160 mM Na+ replacing NMDG+ (top) or 140 mM Methane sulfonate-/ 20 mM Cl- replacing 160 mM Cl- (bottom) in the extracellular solutions at times indicated. Vm was held at –80 mV. (B) The I-V relationship (top) of the Zn2+ sensitive component of OTOP2 current in response to different pHo stimuli was obtained from ramp depolarizations in the presence and absence of Zn2+. pHi was adjusted to 6.5. Bottom: Erev measured as a function of ΔpH (pHo – pHi). pHi was adjusted to 6.0, 6.5, or 7.0 as indicated. The red dotted line is the predicted equilibrium potential for H+, EH. (C) Extracellular Zn2+ inhibits resting OTOP2 currents in a dose-dependent manner. Trace (top) shows inhibition of resting current in OTOP2-expressing HEK-293 cells by 10 μM Zn2+. Vm as indicated. Fractional inhibition was fit with a Hill slope = 0.6 and IC50=5.6 µM. Data represent mean ± s.e.m of biological replicates where n=3–4 for each data point.
-
Figure 2—source data 1
Source data for Figure 2B and C.
- https://cdn.elifesciences.org/articles/77946/elife-77946-fig2-data1-v1.xlsx
Figure 3

OTOP channels mediate the influx and efflux of protons as measured with intracellular pH imaging.
(A–D) Changes in intracellular fluorescence emission upon exposure to changing extracellular pH, as indicated, were measured from HEK-293 cells co-expressing OTOP channels and the pH-sensitive indicator pHluorin (A–C) or pHluorin alone (D). Data are shown as the mean ± SEM for n=7, 7, 11, and 3 cells for (A), (B), (C), and (D), respectively. Acetic acid, which is permeable through cell membranes and acidifies cell cytosol directly, served as a positive control. Only OTOP1 and OTOP2 conducted protons out of the cell cytosol in response to alkalinization, while all three channels conducted protons into the cell cytosol in response to acidification, albeit at different rates. The lower panel shows images of a single cell in the field of view used for these experiments taken at the pH indicated (pseudo color is arbitrary units).
-
Figure 3—source data 1
Source data for Figure 3A–D.
- https://cdn.elifesciences.org/articles/77946/elife-77946-fig3-data1-v1.xlsx
Figure 4 with 1 supplement
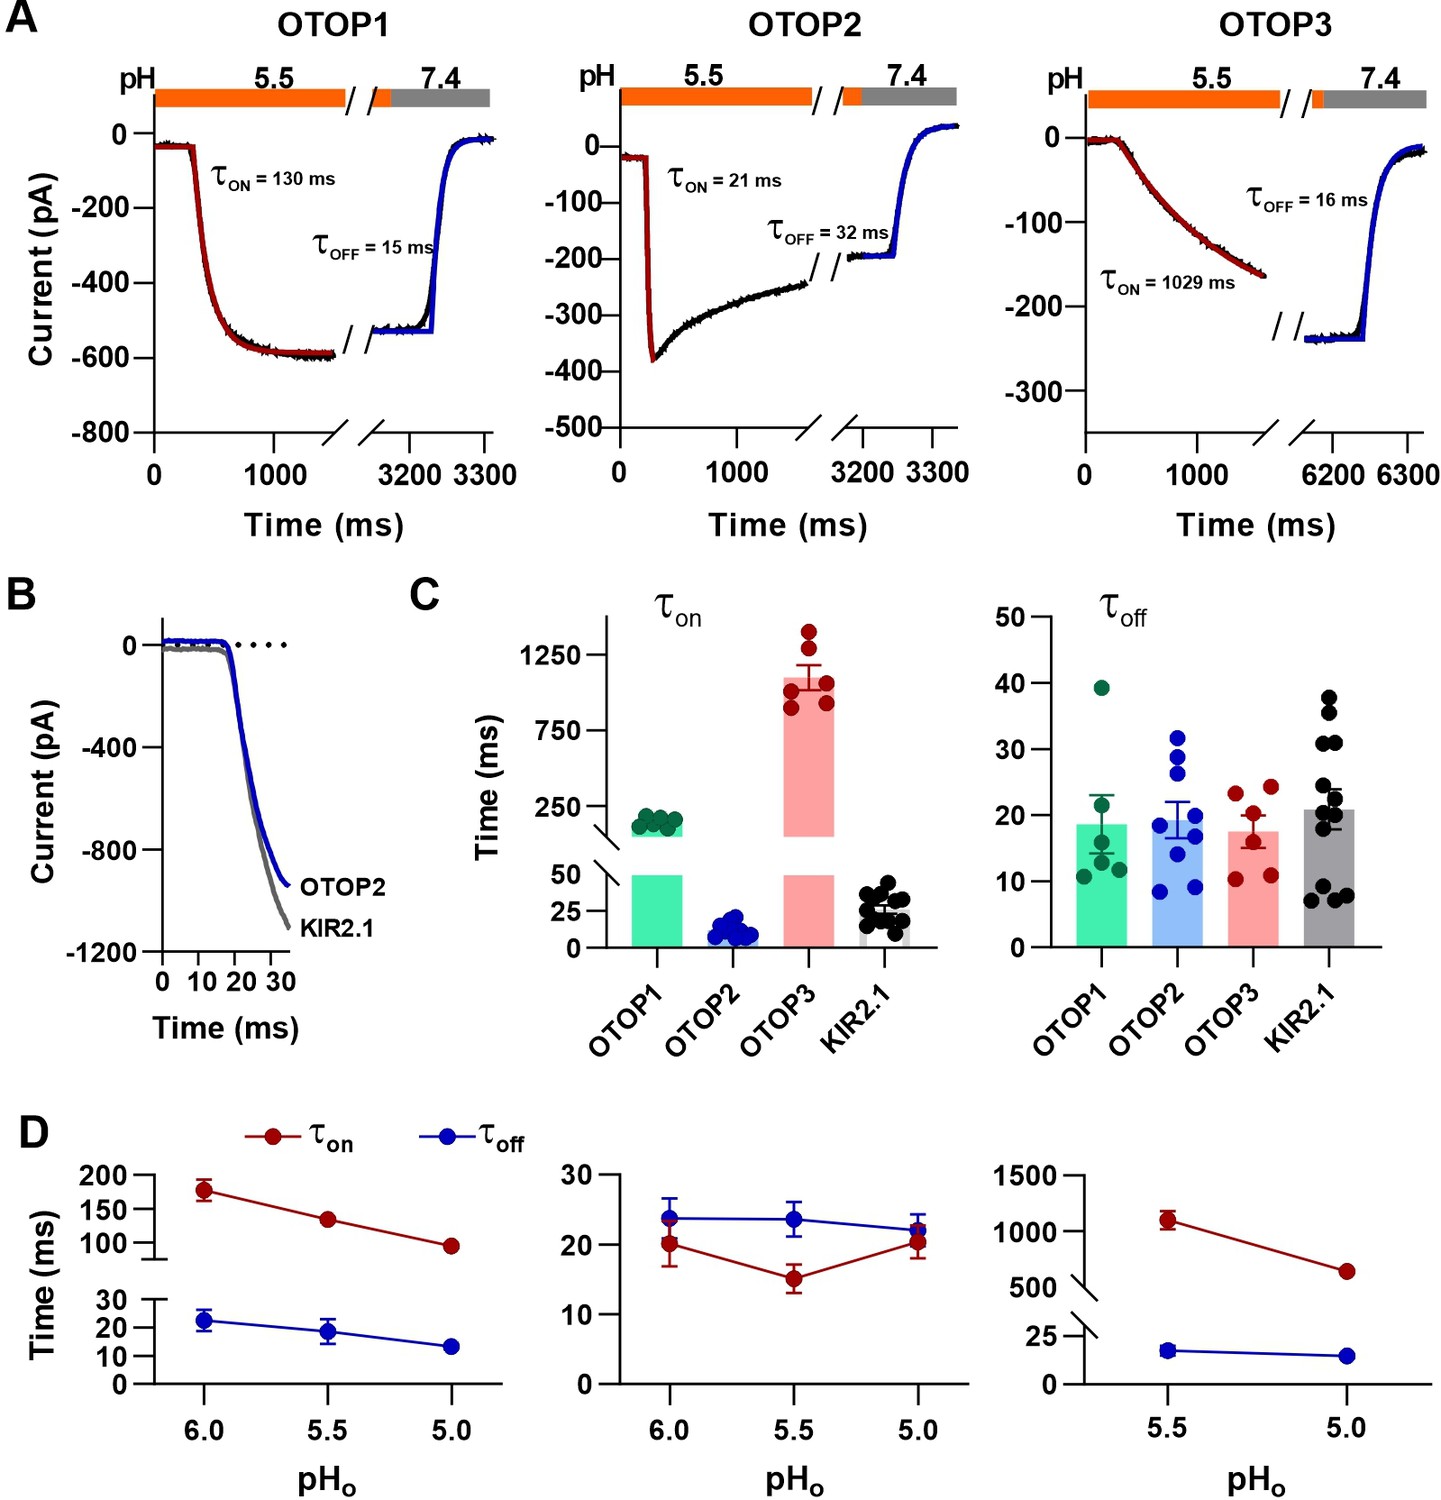
Activation kinetics vary dramatically between OTOP channels.
(A) Representative current traces (black) from cells expressing each of the three OTOP channels in response to the application and the removal of pH 5.5 solutions. The activation and the decay kinetics of the currents were fitted with a single exponential (red and blue curves, respectively). (B) Solution exchange kinetics measured with an open K+ channel KIR2.1 are similar to the kinetics of OTOP2 currents. (C) Summary data for τon (left panel) and toff (right panel) of the three OTOP channels (OTOP1: green, OTOP2: blue, OTOP3: red) and KIR2.1 (black) in response to the application and removal of pH 5.5 extracellular solution. n=6, 5–6, 6 for OTOP1, OTOP2 and OTOP3 respectively. (D) Time constants for activation (τon, red) and deactivation (τoff, blue) of OTOP1, OTOP2, and OTOP3 currents in response to acidic stimuli (pH 6.0, 5.5, and 5.0) measured from experiments as in A. Note that the data at pH 5.5. is also shown in Panel C. n=6,5–6, and 6 for OTOP1, OTOP2, and OTOP3, respectively.
-
Figure 4—source data 1
Source data for Figure 4C and D.
- https://cdn.elifesciences.org/articles/77946/elife-77946-fig4-data1-v1.xlsx
Figure 4—figure supplement 1
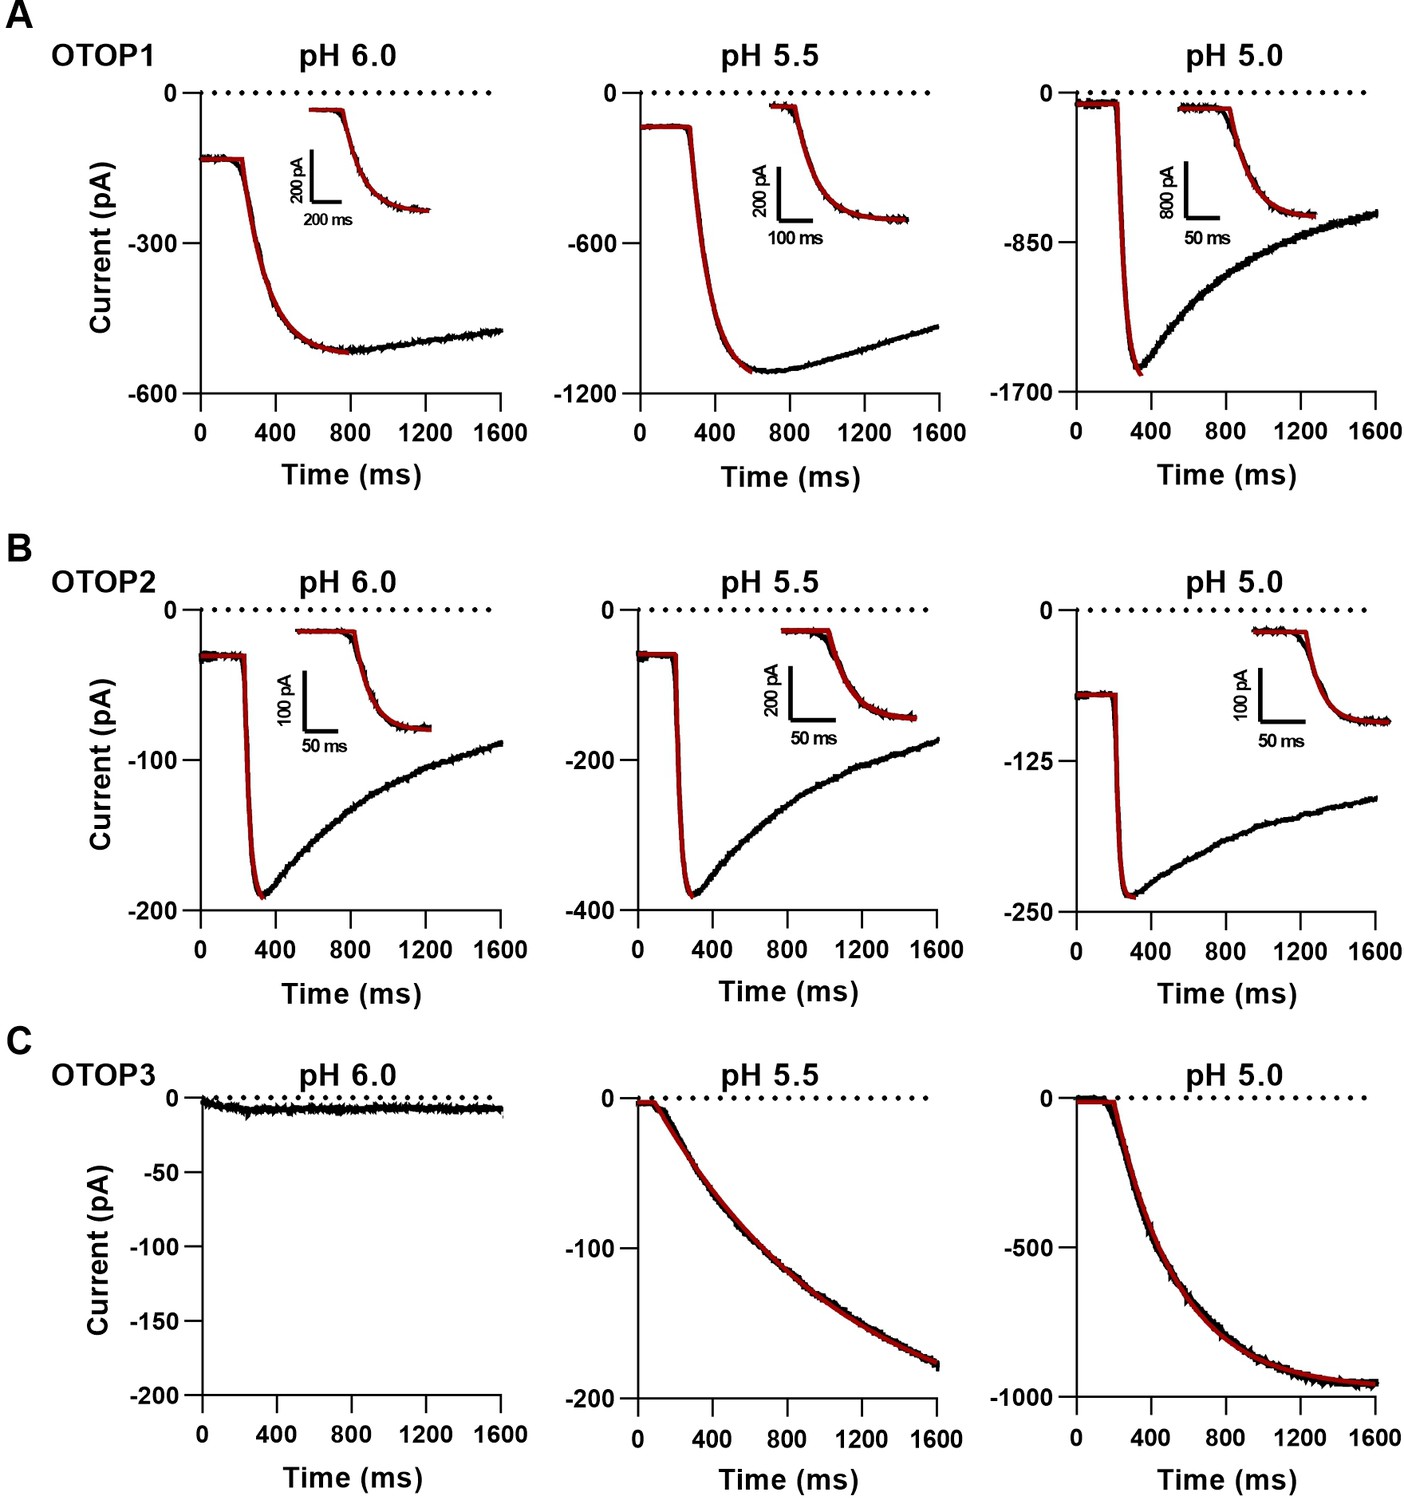
Fit to activation kinetics of OTOP currents.
(A-C) Representative traces showing the activation of OTOP1 (A), OTOP2 (B), and OTOP3 (C) currents in response to solutions with extracellular pH titrated to 6.0 (left panel), 5.5 (middle panel), and 5.0 (right panel). The activation of the currents was fit by a single exponential curve (red part of the trace). Inserted shows a zoom-in view of the current activation. The initial few milliseconds where data deviated from an exponential were not included in the curve fitting as they reflect the non-instantaneous solution exchange. No measurable current was evoked in OTOP3 in response to pH 6.0.
Figure 5 with 1 supplement

Changes in the slope conductance of OTOP channels as a function of extracellular pH.
(A) Voltage and solution exchange protocol used to measure the slope conductance in response to changing extracellular pH. Vm was held at –80 mV and ramped to +80 mV (1 V/s at 1 Hz). The first ramp after the currents peaked was used for later measurements. (B) Representative I-V relationship from HEK-293 cells expressing each of the three OTOP channels in response to alkaline or acidic stimuli (pH 10–5) from experiments described in (A). The conductance was measured from the slope of the I-V curve between –80 mV and 0 mV to avoid contamination from outwardly rectifying Cl- currents. (C) Average slope conductance measured from cells expressing each of the three OTOP channels in response to different pHo stimuli from data as in (B). Data represent mean ± s.e.m. of biological replicates where for each data point n=5 for OTOP1, n=6–7 for OTOP2, and n=5–7 for OTOP3.
-
Figure 5—source data 1
Source data for Figure 5C.
- https://cdn.elifesciences.org/articles/77946/elife-77946-fig5-data1-v1.xlsx
Figure 5—figure supplement 1
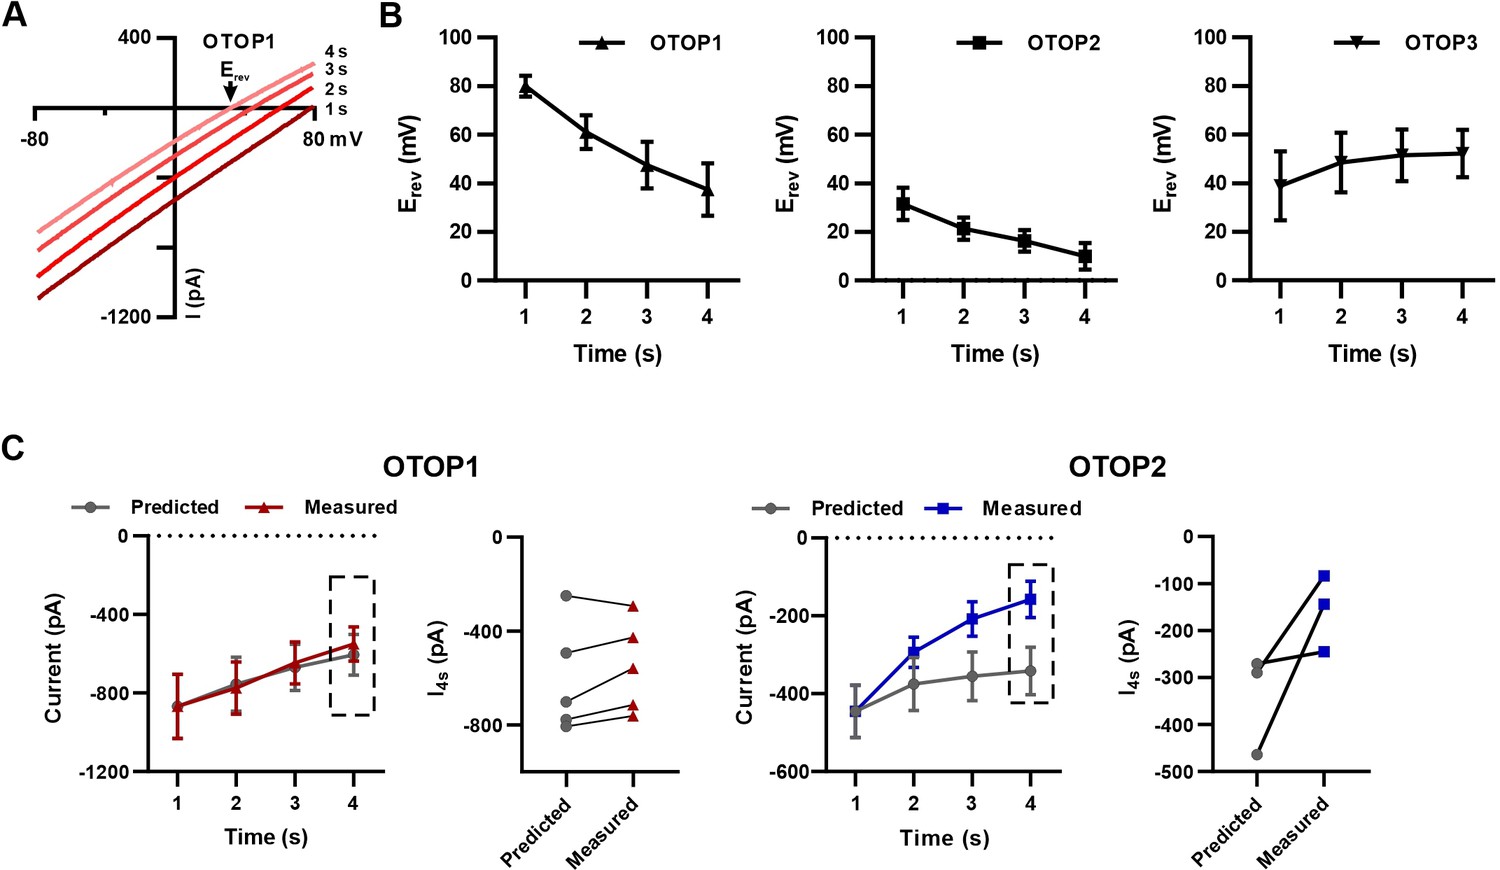
Changes in reversal potentials of OTOP currents during prolonged exposure to acid stimuli.
(A) I-V curves from experiments in which OTOP1 currents were evoked in response to a pH 5.0 stimulus with Vm = –80 mV and ramp depolarizations (–80 mV to +80 mV; 1 V/s) applied every second as in Figure 5A show a shift in Erev as a function of time. (B) Average data showing the change in reversal potential as a function of time for OTOP1, OTOP2, and OTOP3. n=5, n=3–5, n=7, respectively. Comparison between t=0 s and t=4 s by two-tailed, paired Student’s T-test was significant at p=0.02, p=0.02, and p=0.03 for OTOP1, OTOP2, and OTOP3, respectively. (C) Comparison of the measured magnitude of currents at Vm = –80 mV and that predicted if the initial current decays due to a change in driving force for H+ entry. The predicted currents were calculated as I(x) = I1s * (Vm -Erev(x)/(Vm -Erev(1 s))), where x is a time point between 2 and 4 s after the onset of the stimulus. For OTOP1, the predicted and measured currents were similar, while for OTOP2, there was a large difference between the observed and predicted currents. n=5 and n=3 for OTOP1 and OTOP2.
-
Figure 5—figure supplement 1—source data 1
Source data for Figure 5—figure supplement 1B, C.
- https://cdn.elifesciences.org/articles/77946/elife-77946-fig5-figsupp1-data1-v1.xlsx
Figure 6 with 1 supplement
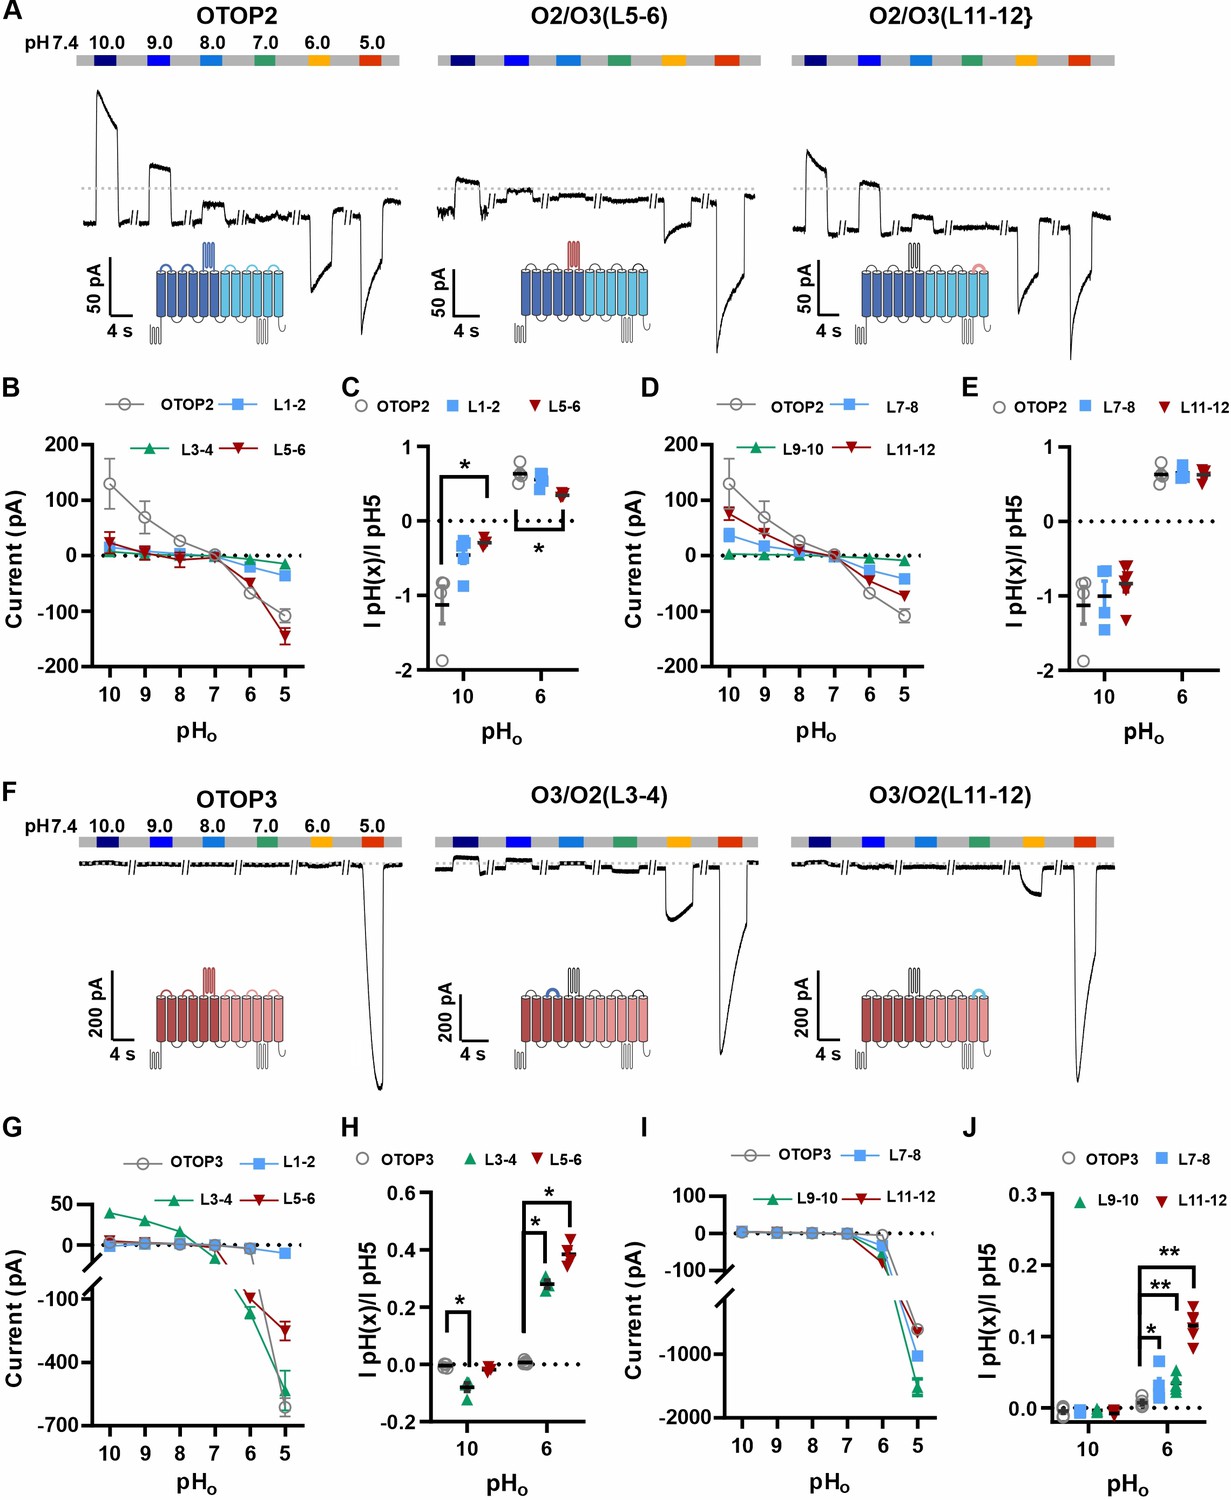
Chimeric channels with external linkers swapped reveal potential gating modules.
(A-F) Representative current traces in response to varying pH from 10 to 5 measured from HEK-293 cells expressing OTOP2 channels and chimeras with an OTOP2 backbone (A) or OTOP3 channels and chimeras with an OTOP3 backbone (F) where numbers refer to linkers between corresponding transmembrane domains. Membrane potential was held at –80 mV. (B, D, G, I) Current magnitude (mean +/-s.e.m.) for OTOP2 N-domain chimeras (n=4–5) (B), OTOP2 C-domain chimeras (n=4–10) (D), OTOP3 N-domain chimeras (n=3–5) (G), and OTOP3 C-domain chimeras (n=4–6) (I) from experiments such as in (A) and (F). (C, E, H, J) Same data for pH 10 and pH 6, normalized to the response to pH 5.0 to control for differences in expression. Significance was tested using the Mann-Whitney test. The p-values and n are given in Figure 6—source data 2.
-
Figure 6—source data 1
Source data for Figure 6B–E and G–J.
- https://cdn.elifesciences.org/articles/77946/elife-77946-fig6-data1-v1.xlsx
-
Figure 6—source data 2
Statistical tests comparing chimeric channels with wildtype channels with Mann-Whitney U test.
P values and sample size are indicated.
- https://cdn.elifesciences.org/articles/77946/elife-77946-fig6-data2-v1.docx
Figure 6—figure supplement 1
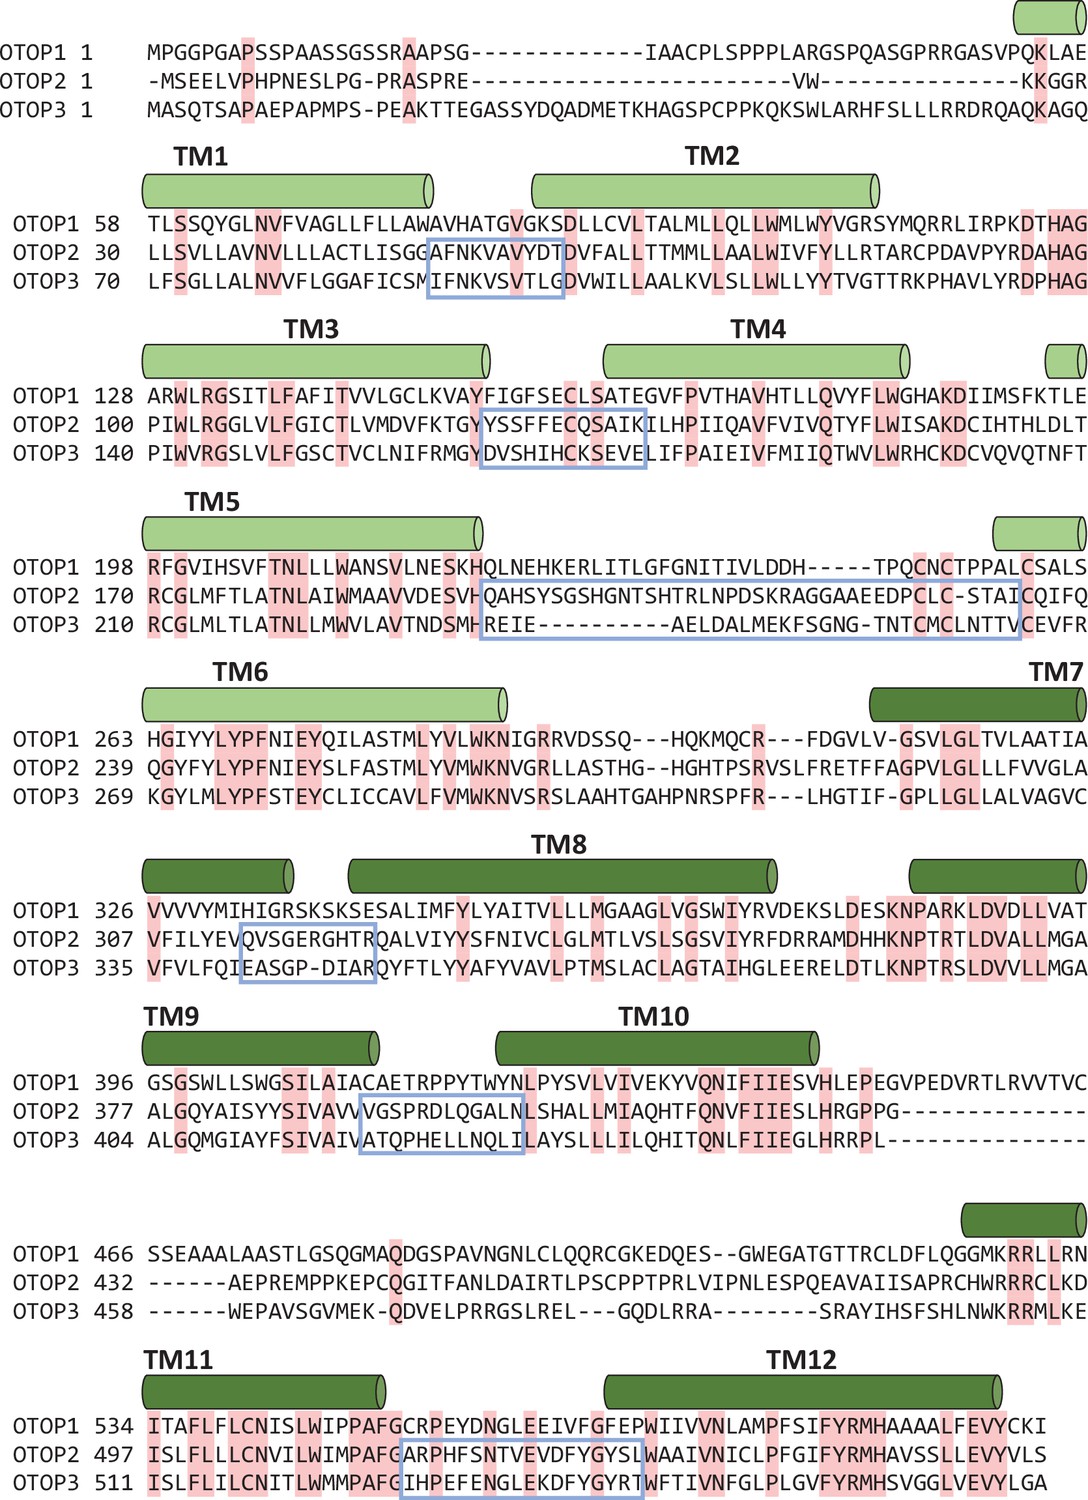
Topology and sequence alignment of OTOP channels.
Mouse OTOP1, 2, and 3 channels are aligned. The transmembrane helices are depicted in cylinders above the sequence. Residuals conserved in all three channels are shaded pink. External loops that were swapped between OTOP2 and OTOP3 are labeled in blue boxes.
Figure 7

Increase in activation kinetics of mOTOP3 chimeric channels.
(A–D) Time constants for activation of chimeric as compared with wildtype channels, measured from traces as in Figure 6A and F, using methods as in Figure 4. The τon of OTOP2 and its chimeras (A, B) was not pH dependent and followed the rate of the solution exchange. Data are mean ± s.e.m, (n=3–4). The τon of OTOP3 chimeras bearing OTOP2 linkers (C, D) was generally faster than that of the wildtype channels (n=3–4). Same nomenclature as in Figure 6. (E, F) Same data as in A-D, plotted to allow comparison across all chimeras at the same pH (as indicated; note that because wildtype OTOP3 is not activated by pH 6, data using a pH 6 stimulus is not included in the analysis). Statistical results report the comparison between chimeric channels and the wildtype channel using ANOVA and Dunnett’s multiple comparisons tests.
-
Figure 7—source data 1
Source data for Figure 7A–D.
- https://cdn.elifesciences.org/articles/77946/elife-77946-fig7-data1-v1.xlsx
Figure 8 with 1 supplement
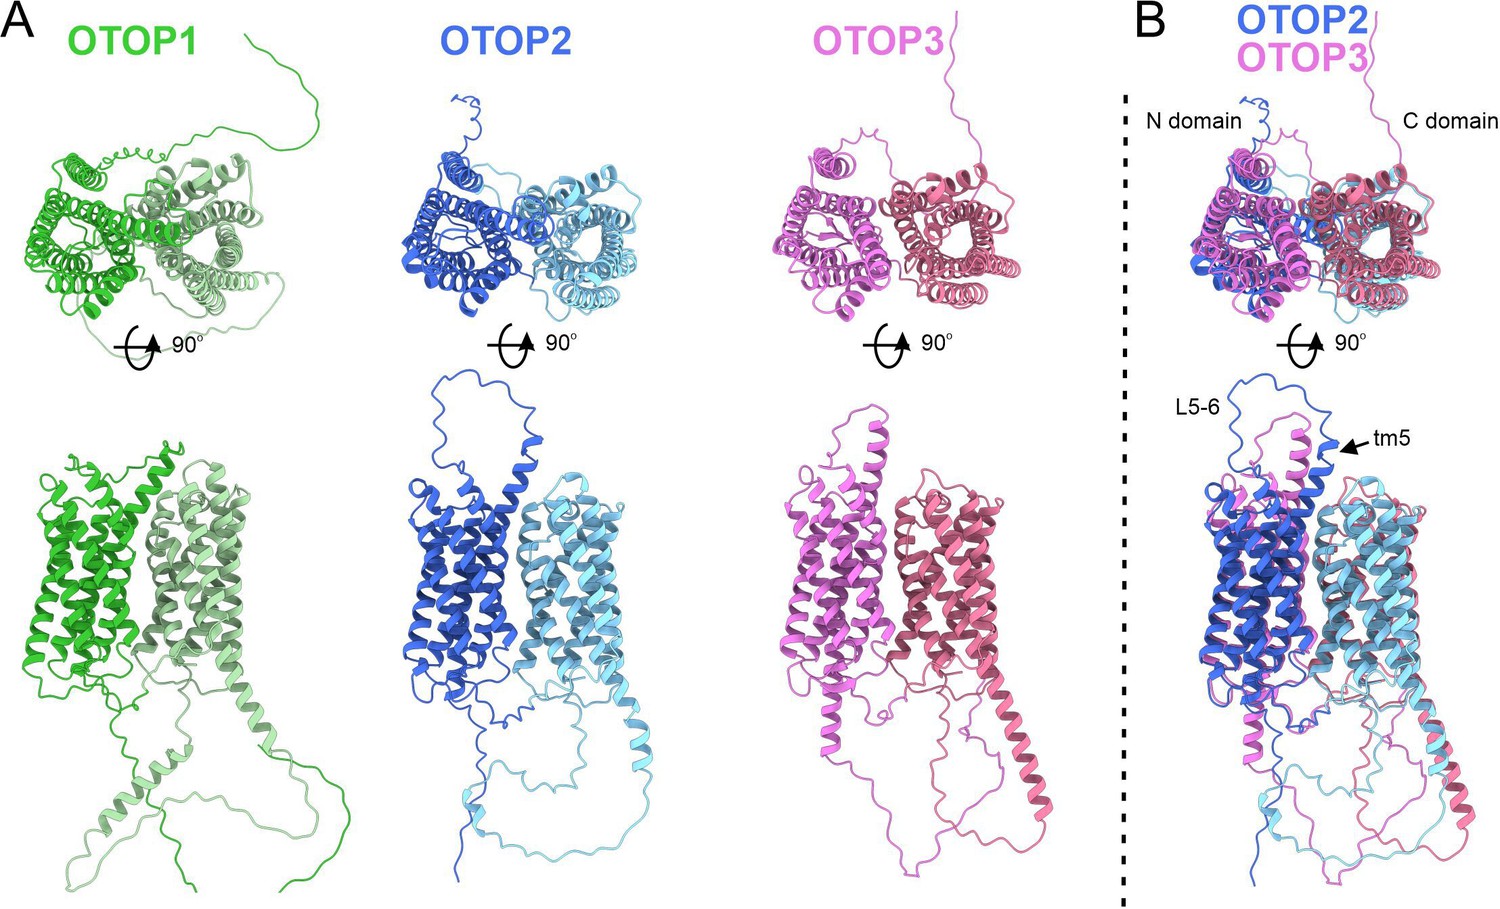
Predicted structures of mOTOP1.
mOTOP2 and mOTOP3. (A) Top views (top) and side views (bottom) of AlphaFold predicted structural models of mOTOP1, mOTOP2, and mOTOP3. The N- and C- domain halves of mOTOP1, mOTOP2, and mOTOP3 are colored green and light green, blue and light blue, and magenta and hot pink, respectively. (B) A superimposed overlay of mOTOP2 and mOTOP3 highlights the different orientations of the transmembrane 5 helices and S5-6 linkers.
Figure 8—figure supplement 1
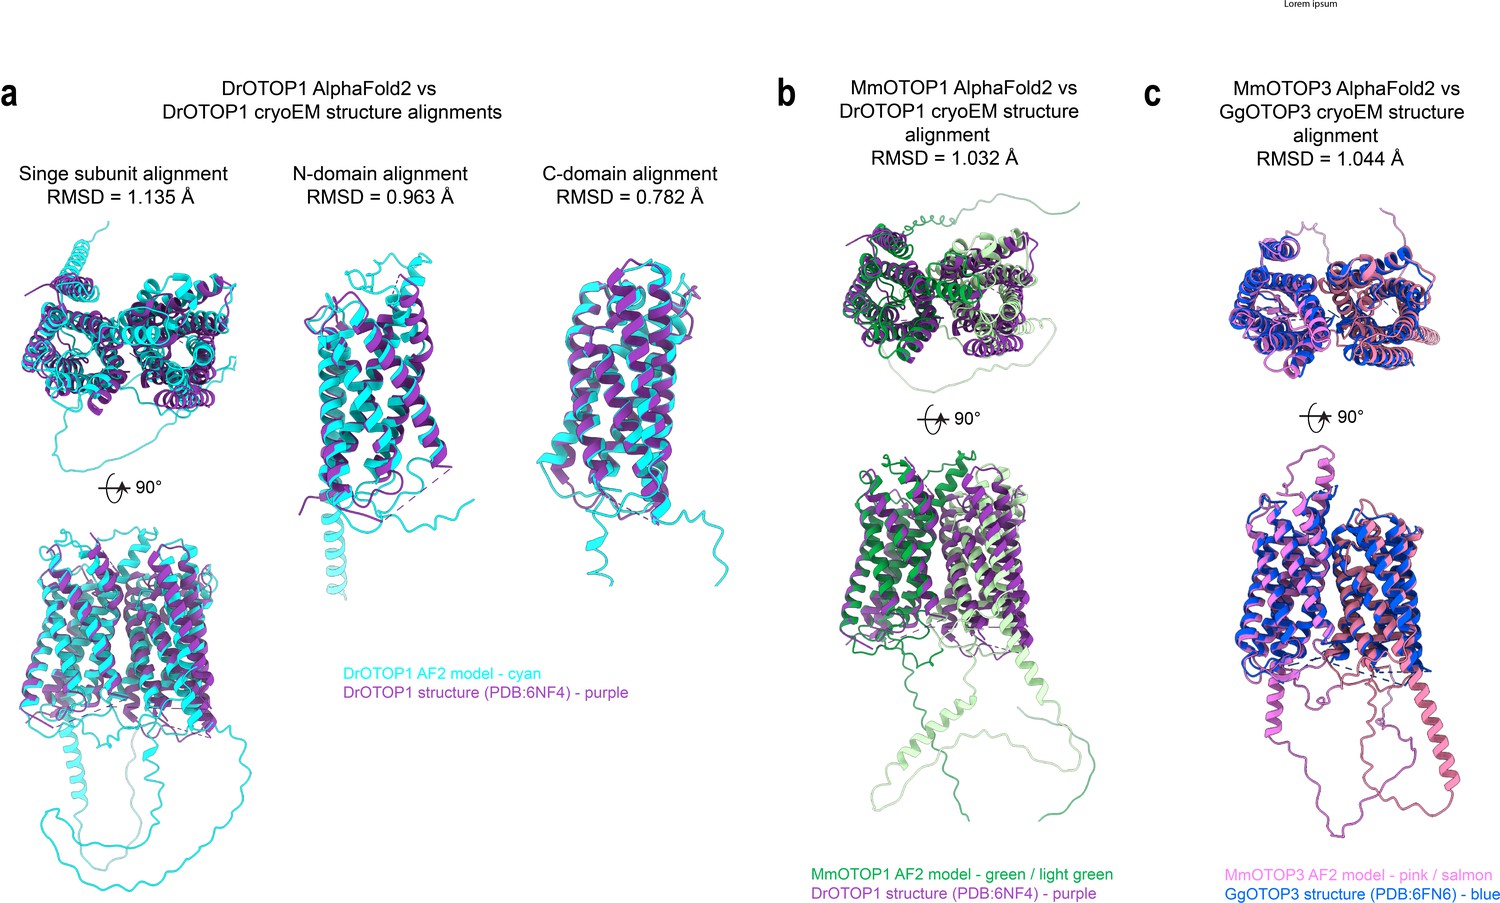
Comparison between AlphaFold predictions and cryoEM structures.
(A) Superimposed structural alignments of the AlphaFold2 predicted model for zebrafish OTOP1 (DrOTOP11; cyan) and DrOTOP1 cryoEM structure PDB:6NF4 (purple) using single subunits, N domain, or C domain. (B) Superimposed structural alignments of the AlphaFold2 predicted model for mouse Otop1 (MmOTOP1) (N domain in green, C domain in light green) and DrOTOP1 cryoEM structure PDB:6NF4 (purple) based on a single subunit. (C) Superimposed structural alignments of the AlphaFold2 predicted model for mouse OTOP3 (MmOTOP3) (N domain in pink, C domain in salmon) and chicken OTOP3 (GgOTOP3) cryoEM structure PDB:6NF6 (blue) based on a single subunit. Alignments and root-mean-square deviation (RMSD) values were calculated using the command ‘matchmaker’ in ChimeraX v1.2.5 software. AlphaFold2 predicted models were downloaded from the AlphaFold Protein Structure Database (https://alphafold.ebi.ac.uk), with the following entry codes: DrOTOP1 - E7F5C1, MmOTOP1 - Q80VM9, and MmOTOP3 - Q80UF9.
Figure 9
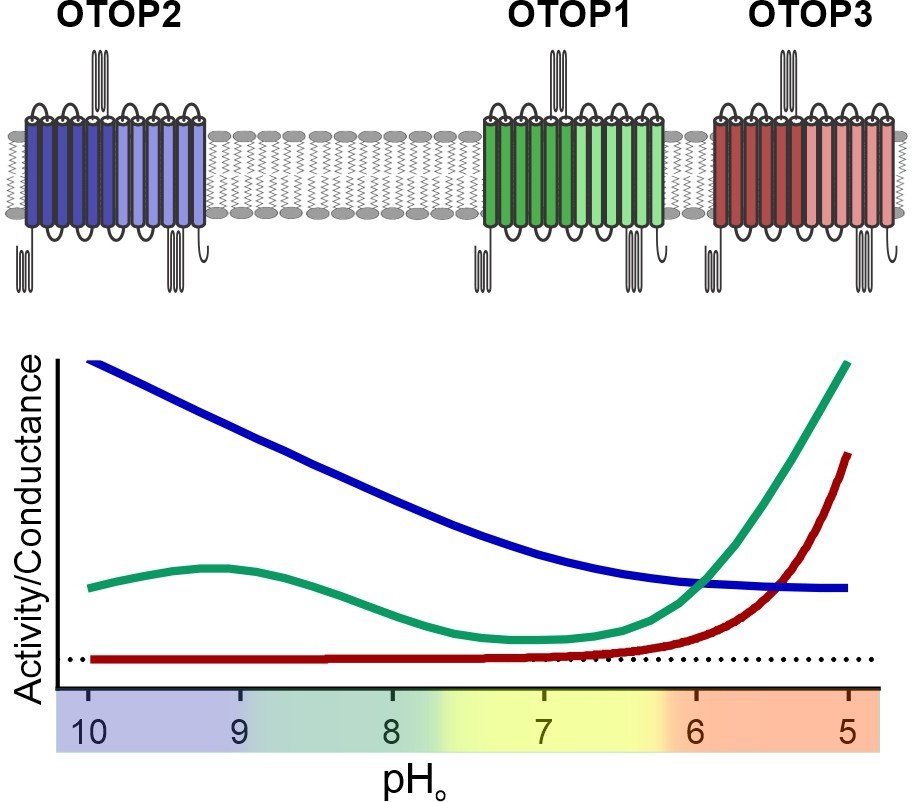
pH tuning of OTOP channels.
Lowering extracellular pH increases the slope conductance of OTOP1 and OTOP3 channels while it lowers the slope conductance of OTOP2 channels. OTOP1 also has a peak of activity at mildly alkaline pH.
Tables
Key resources table
| Reagent type (species) or resource | Designation | Source or reference | Identifiers | Additional information |
|---|---|---|---|---|
| Gene (M. musculus) | Otop1, Otop2 and Otop3 | Tu et al., 2018. PMID:29371428 | ||
| Cell line (Homo-sapiens) | HEK293 | ATCC | CRL-1573 | |
| Cell line (Homo-sapiens) | PAC-KO HEK293 cells | Yang et al., 2019a. PMID:31023925 | ||
| Recombinant DNA reagent | Otop1, Otop2, and Otop3 in pcDNA3.1 | Tu et al., 2018. PMID:29371428 | ||
| Recombinant DNA reagent | Otop1, Otop2, and Otop3 – GFP | Saotome et al., 2019. PMID:31160780 | ||
| Recombinant DNA reagent | mO2_O3 loop swap mutations | This paper | cDNAs encode chimeric channels (see methods and Figure 6—figure supplement 1). Available upon request | |
| Recombinant DNA reagent | mO3_O2 loop swap mutations | This paper | cDNAs encode chimeric channels (see methods and Figure 6—figure supplement 1). Available upon request | |
| Recombinant DNA reagent | pHluorin in pcDNA3 | Miesenböck et al., 1998. PMID:9671304 | ||
| Chemical compound, drug | CHES | Sigma | C2885 | |
| Chemical compound, drug | PIPES | Sigma | P6757 | |
| Chemical compound, drug | Homopiperazine-1,4-bis(2-ethanesulfonic acid) | Sigma | 53,588 | |
| Software, algorithm | GraphPad Prism 8 and 9 | GraphPad | RRID:SCR_002798 | |
| Software, algorithm | pClamp and clampfit | Molecular Devices | RRID:SCR_011323 | |
| Software, algorithm | Origin | OriginLab corporation | RRID:SCR_002815 | |
| Software, algorithm | CorelDraw | Corel | RRID:SCR_014235 | |
| Software, algorithm | SimplePCI | HCImage | https://hcimage.com/simple-pci-legacy/ |
Additional files
Download links
A two-part list of links to download the article, or parts of the article, in various formats.
Downloads (link to download the article as PDF)
Open citations (links to open the citations from this article in various online reference manager services)
Cite this article (links to download the citations from this article in formats compatible with various reference manager tools)
Structural motifs for subtype-specific pH-sensitive gating of vertebrate otopetrin proton channels
eLife 11:e77946.
https://doi.org/10.7554/eLife.77946


