Attention-deficit hyperactivity disorder symptoms and brain morphology: Examining confounding bias
- Department of Child and Adolescent Psychiatry, Erasmus MC University Medical Center Rotterdam-Sophia Children’s Hospital, Netherlands
- The Generation R Study Group, Erasmus MC University Medical Center Rotterdam, Netherlands
- Department of Social and Behavioral Sciences, Harvard TH Chan School of Public Health, United States
- Department of Clinical Genetics, Erasmus MC, Netherlands
- Department of Epidemiology, Erasmus MC, Netherlands
Figures
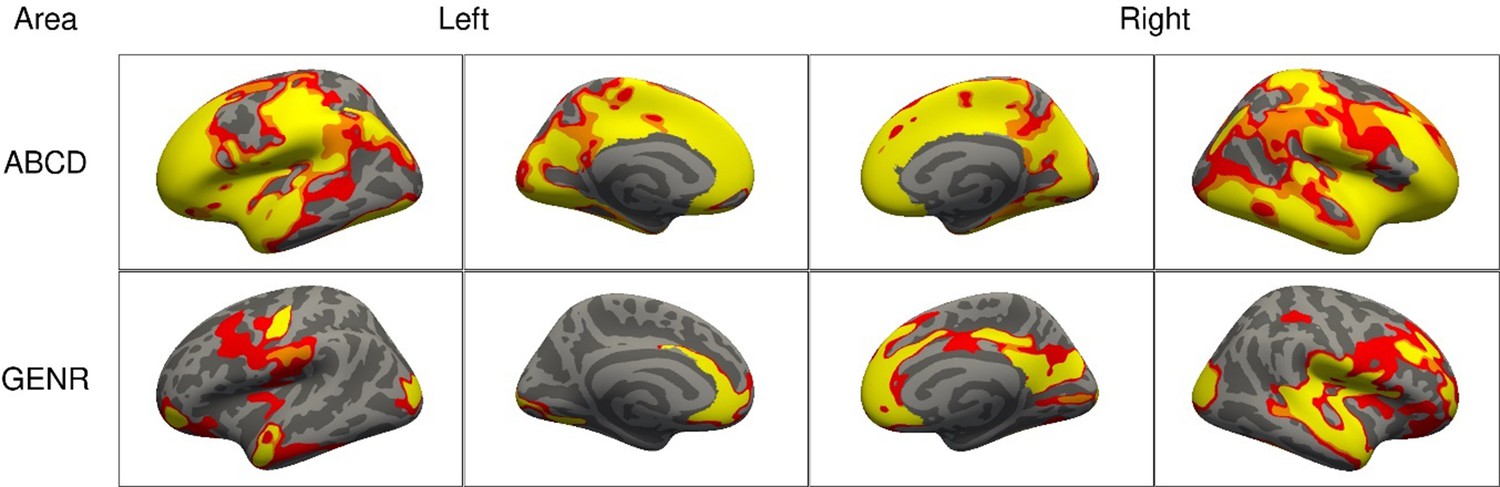
Figure 1 with 2 supplements
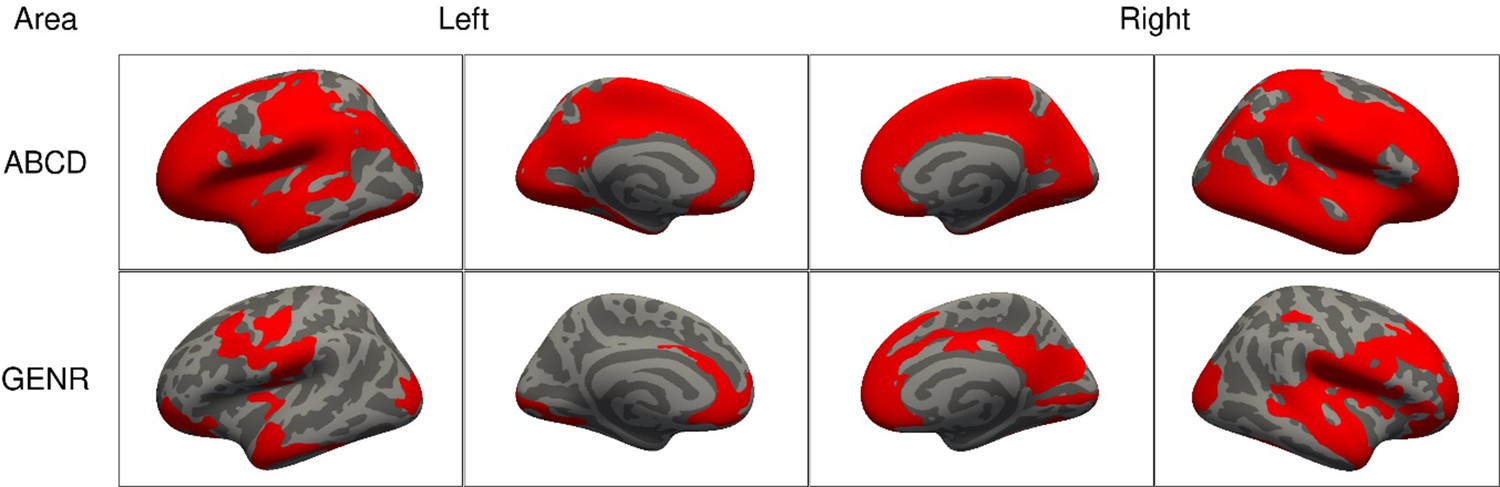
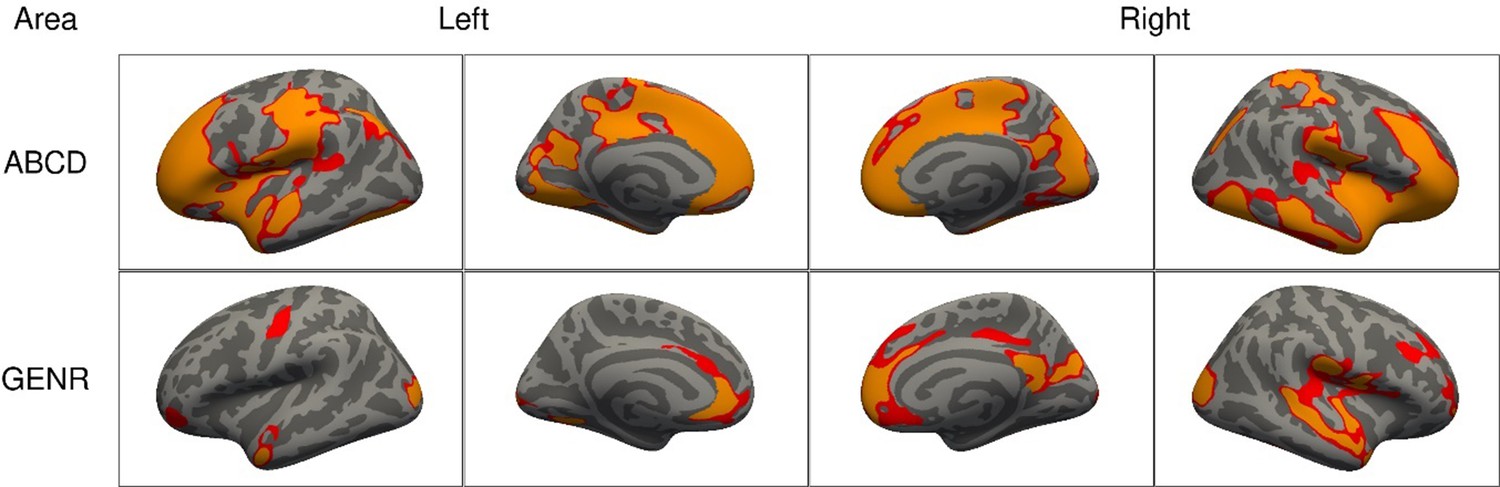
Significant clusters in the association of attention-deficit/hyperactivity disorder (ADHD) symptoms with cortical surface area based on the Adolescent Brain Cognitive Development (ABCD) and Generation R Studies, for model 1.
Note. Rows represent the results for the ABCD or Generation R Studies, and the columns represent the left and right hemispheres. Regions in red represent significant clusters from model 1 (adjusted for sex, age, race/ethnicity, and site [ABCD only]).
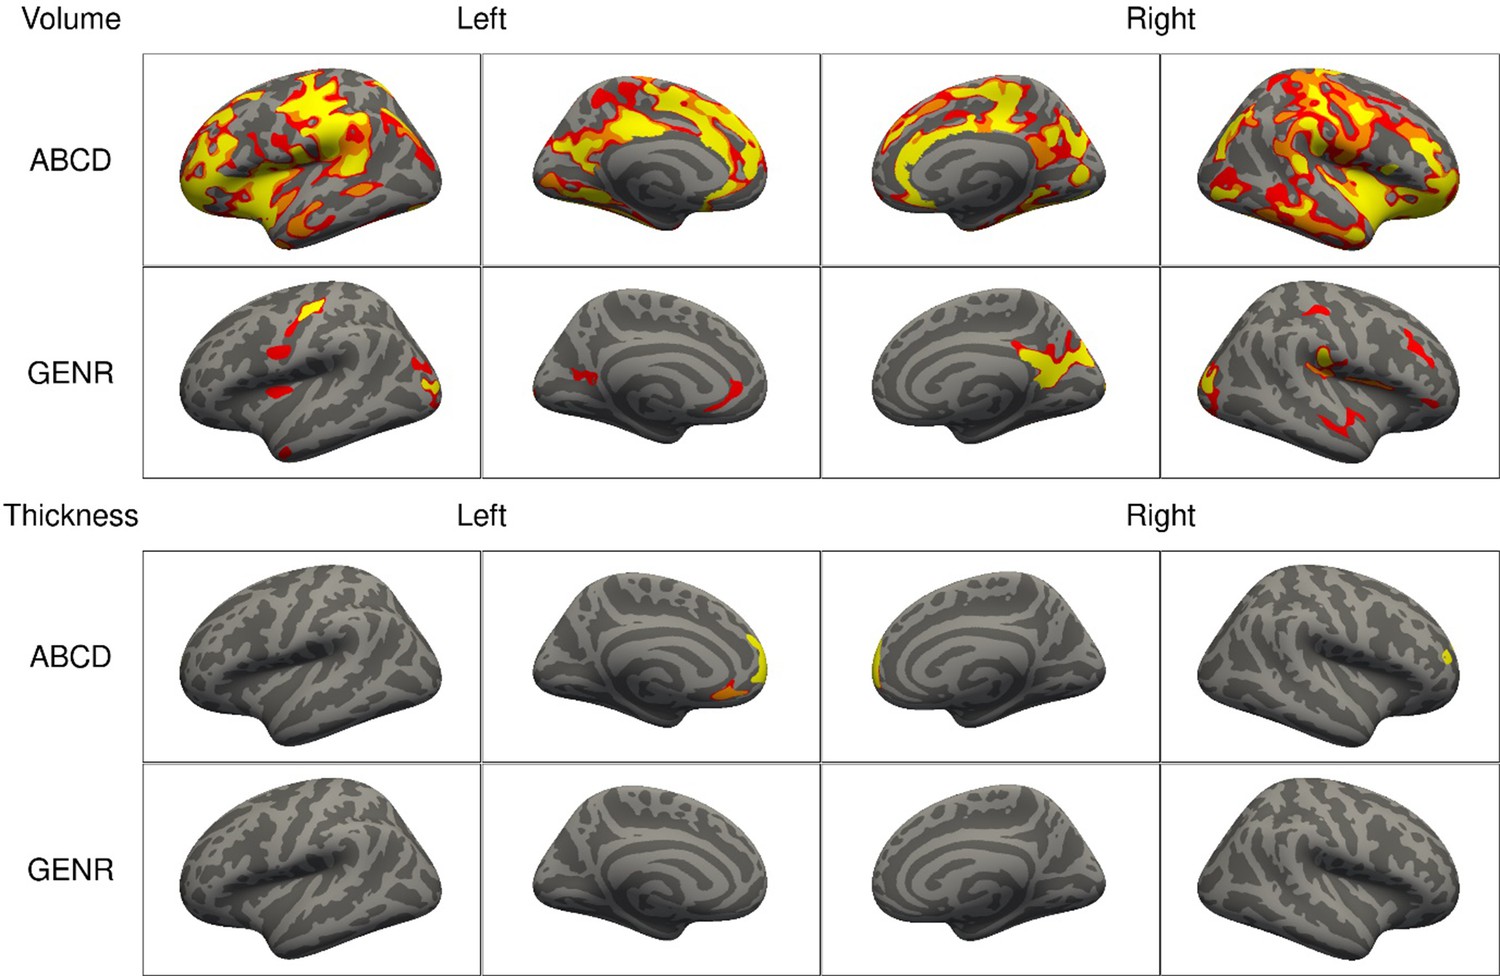
Figure 1—figure supplement 1
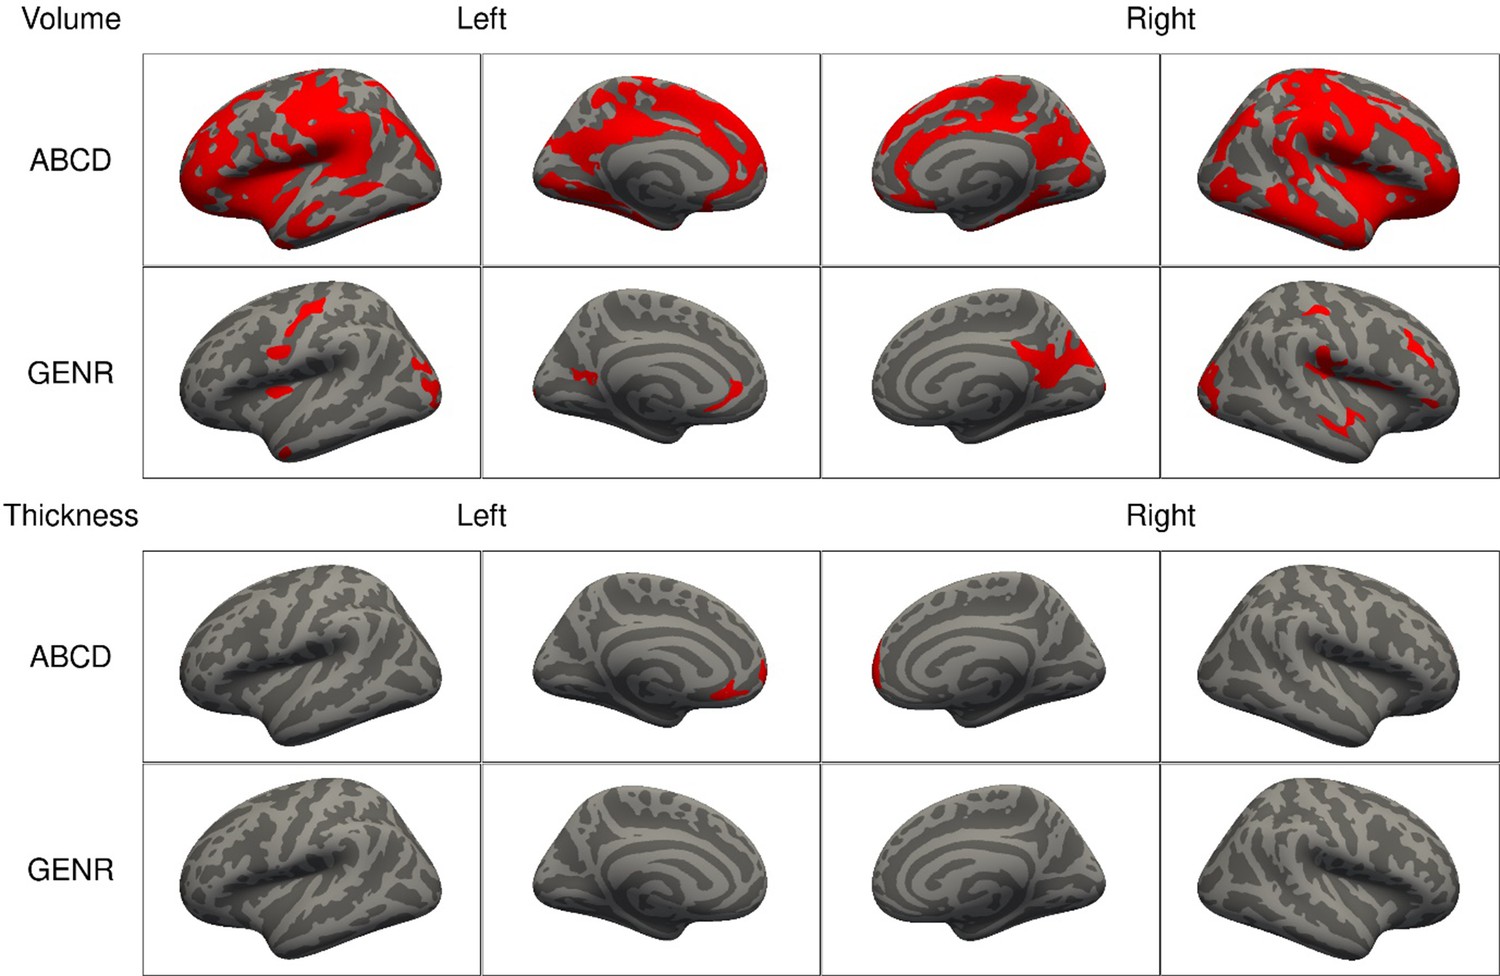
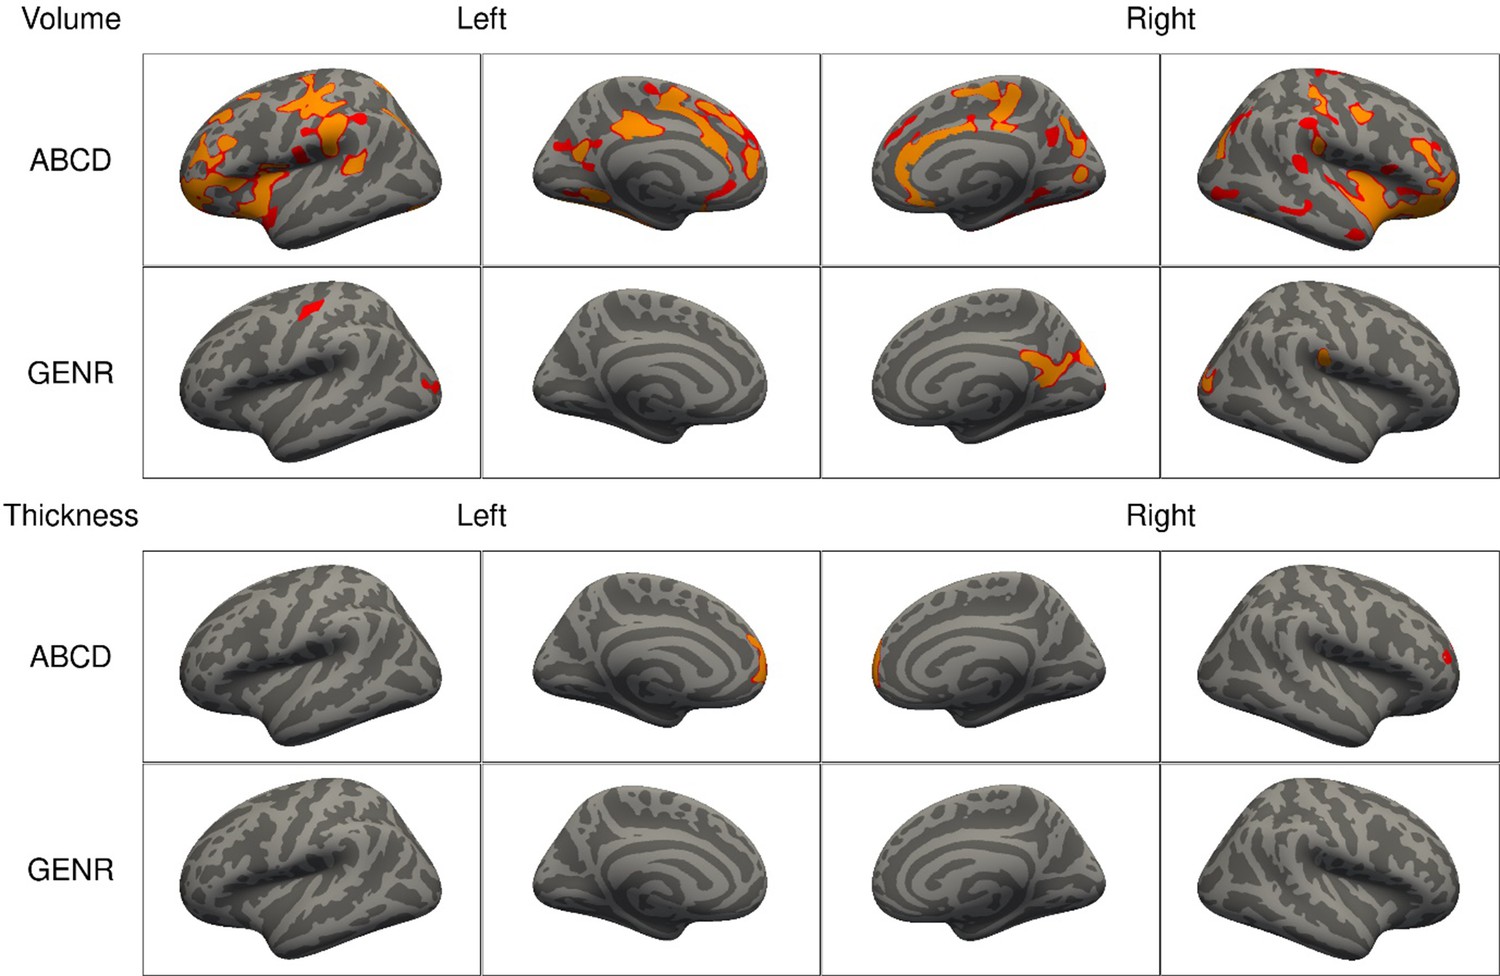
Significant clusters in the association of attention-deficit/hyperactivity disorder (ADHD) symptoms with cortical volume (top) and thickness (bottom) based on the Adolescent Brain Cognitive Development (ABCD) and Generation R Studies, for model 1.
Note. Columns represent the left and right hemispheres. Regions in red represent significant clusters from model 1 (sex, age, race/ethnicity, and site [ABCD only]).
Figure 1—figure supplement 2
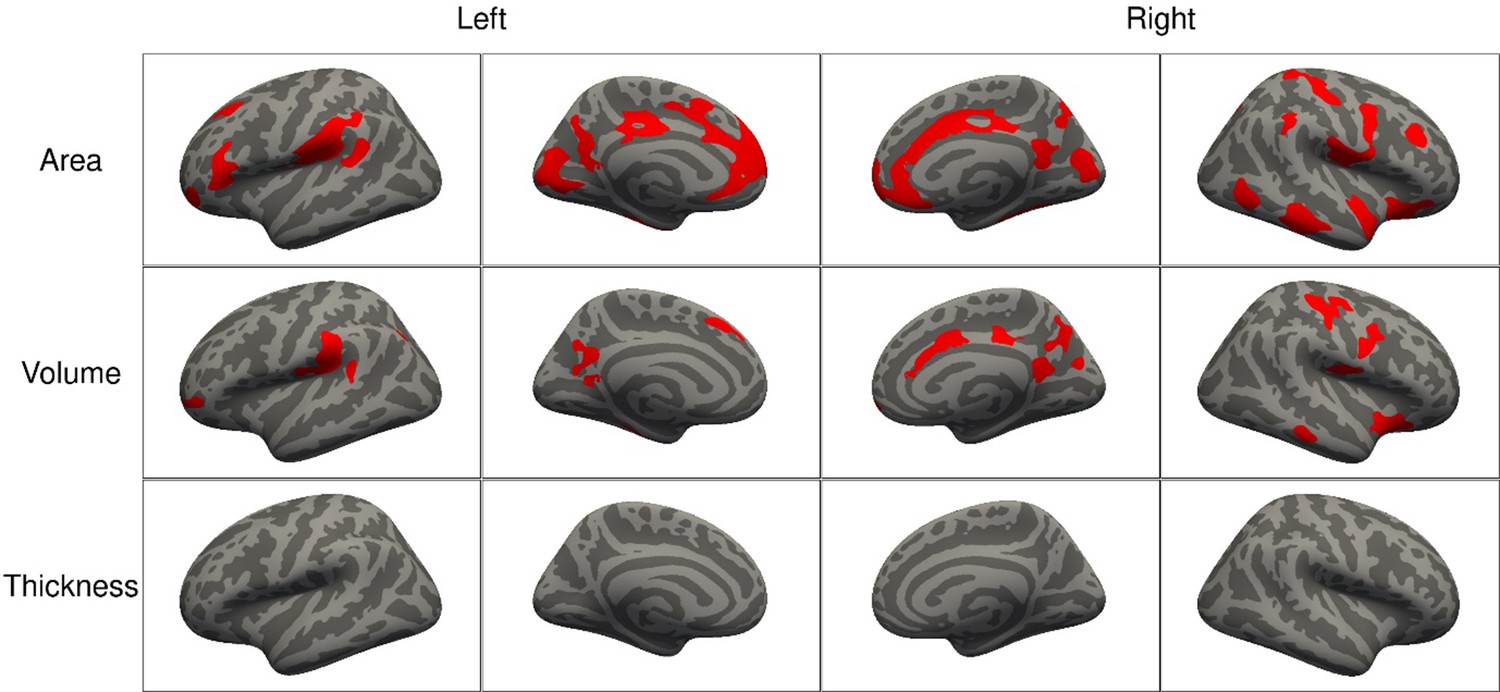
Significant clusters in the association of attention-deficit/hyperactivity disorder (ADHD) diagnosis with cortical surface area (top), volume (middle), and thickness (bottom) for the Adolescent Brain Cognitive Development (ABCD) Study, for model 1.
Note. Columns represent the left and right hemispheres. Regions in red represent significant clusters from model 1 (sex, age, race/ethnicity, and site [ABCD only]).
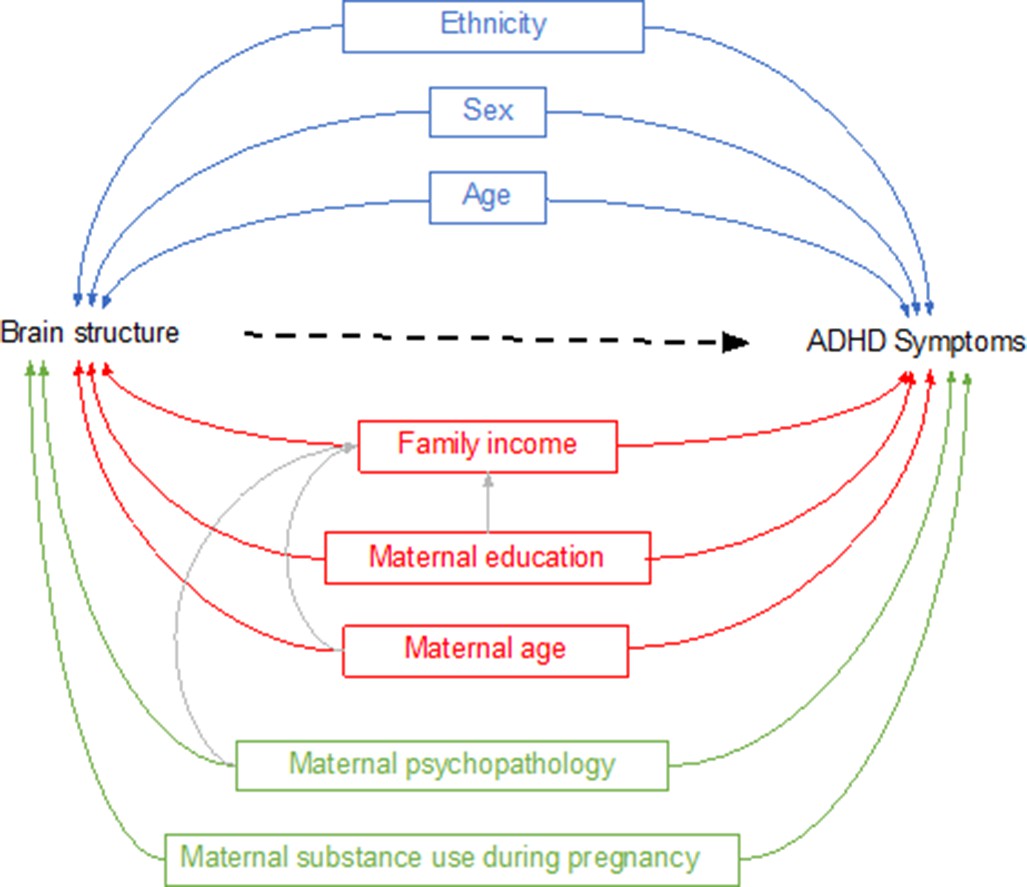
Figure 2 with 2 supplements
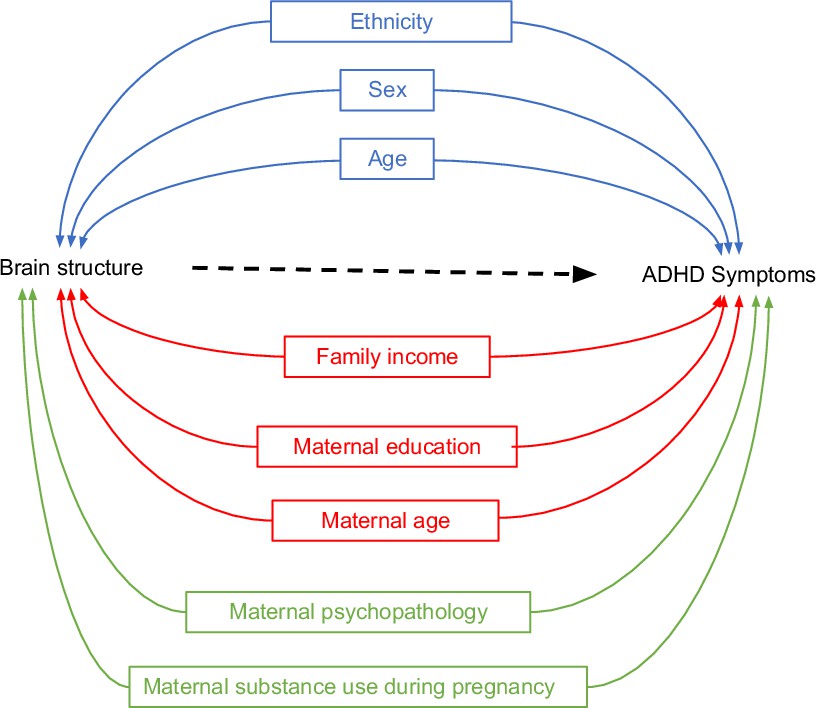
Directed Acyclic Graphs (DAGs) for brain structure and attention-deficit/hyperactivity disorder (ADHD) symptoms (simplified).
Note. DAGs illustrating potential confounders in the association between brain structure and ADHD symptoms for three sequential models. Model 1 included demographic and study characteristics: sex, age, ethnicity, and study site (Adolescent Brain Cognitive Development [ABCD] only) (in blue). Model 2 additionally included socioeconomic status factors: family income, maternal education, and maternal age at childbirth (in red). Model 3 additionally incorporated postnatal maternal psychopathology and maternal substance use during pregnancy (in green).
Figure 2—figure supplement 1
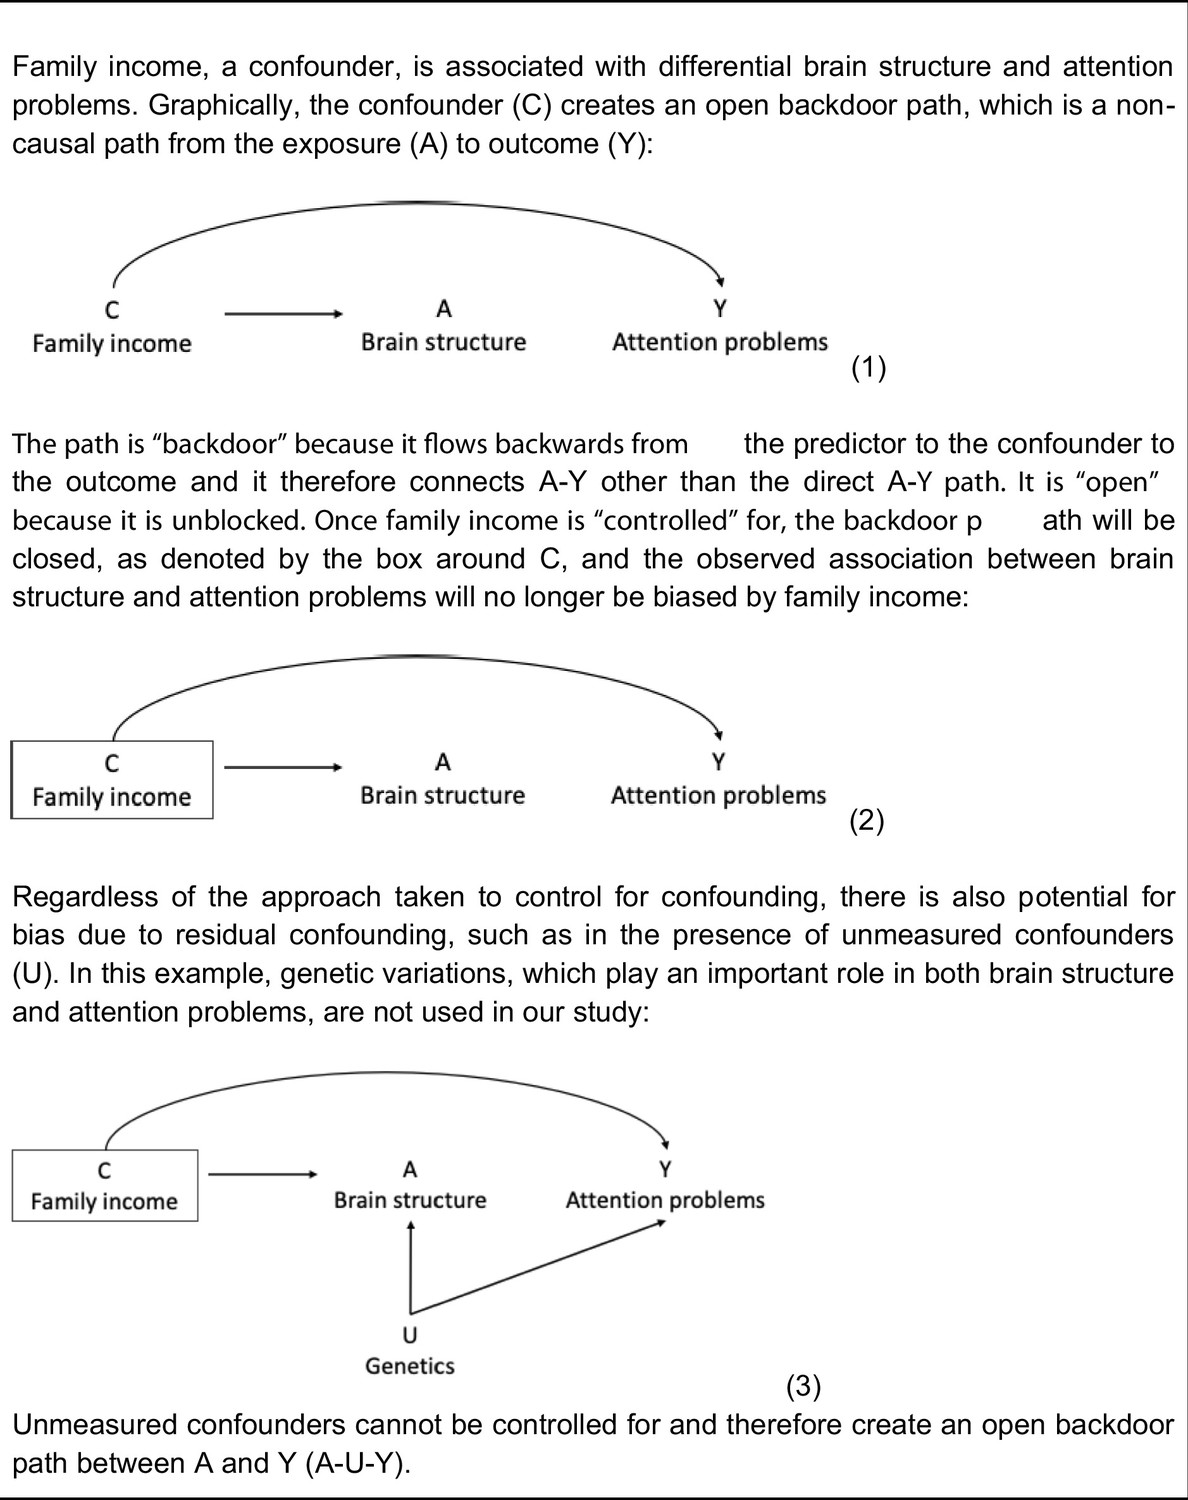
Illustration of Directed Acyclic Graphs (DAGs) using family income as an example.
Note. A = exposure; C = confounder; Y = outcome; U = unmeasured confounder. (1) confounding scenario (unadjusted). (2) Confounding scenario (adjusted). (3) Residual confounding scenario.
Figure 2—figure supplement 2
Directed Acyclic Graphs (DAGs) for brain structure and attention-deficit/hyperactivity disorder (ADHD) symptoms (complete).
Note. DAG illustrating potential confounders in the association between brain structure and ADHD symptoms for three sequential models. Model 1 included demographic and study characteristics: sex, age, ethnicity, and study site (Adolescent Brain Cognitive Development [ABCD] only) (in blue). Model 2 additionally included socioeconomic status factors: family income, maternal education, and maternal age at childbirth (in red). Model 3 additionally incorporated postnatal maternal psychopathology and maternal substance use during pregnancy (in green). Compared to the simplified model shown in-text, we additionally present potential relations between the confounders (in gray) to display all our assumptions.
Figure 3 with 2 supplements
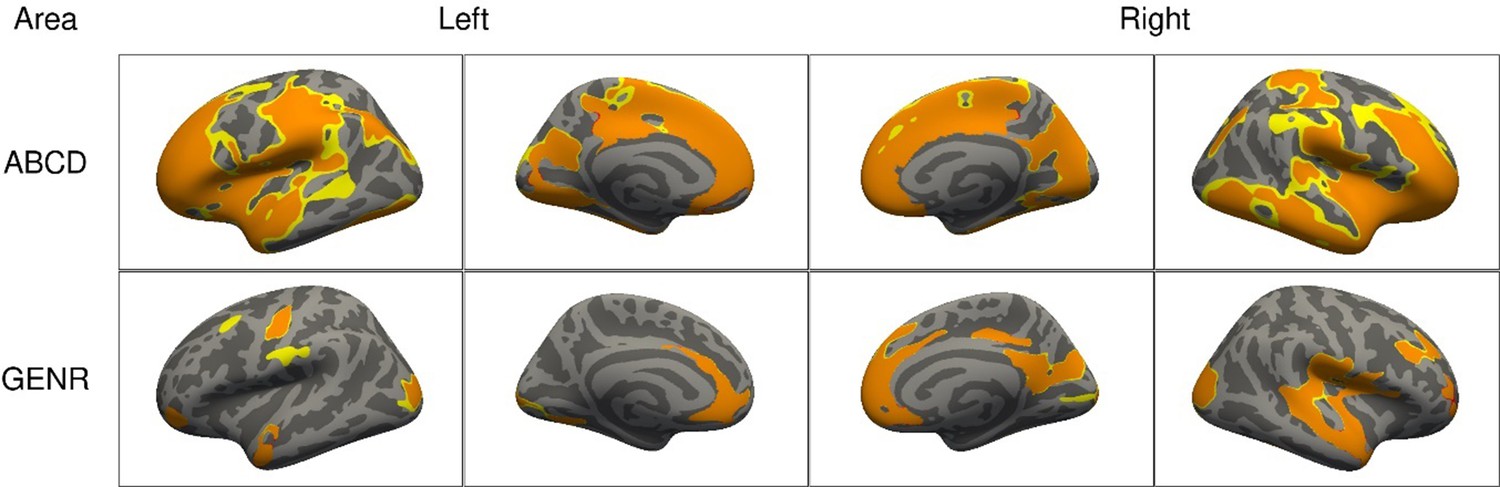
Significant clusters in the association of attention-deficit/hyperactivity disorder (ADHD) symptoms with cortical surface area based on the Adolescent Brain Cognitive Development (ABCD) and Generation R Studies, for models 1–3.
Note. Rows represent the results for the ABCD or Generation R Studies, and the columns represent the left and right hemispheres. The colors denote the different models. Regions in red represent significant clusters from model 1 (sex, age, race/ethnicity, and site [ABCD only]), orange from model 2 (model 1 + family income, maternal education, and maternal age at childbirth), and yellow from model 3 (model 2 + maternal smoking, substance use during pregnancy, psychopathology).
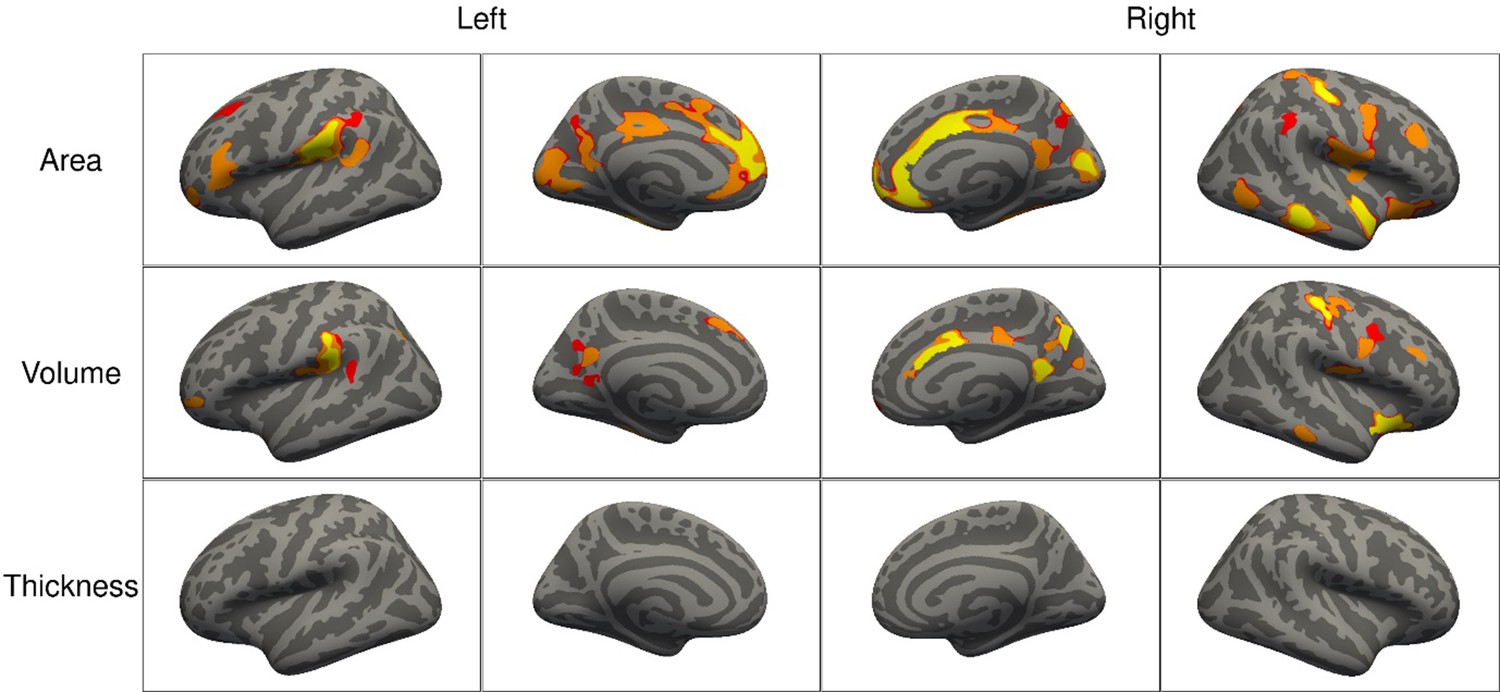
Figure 3—figure supplement 1
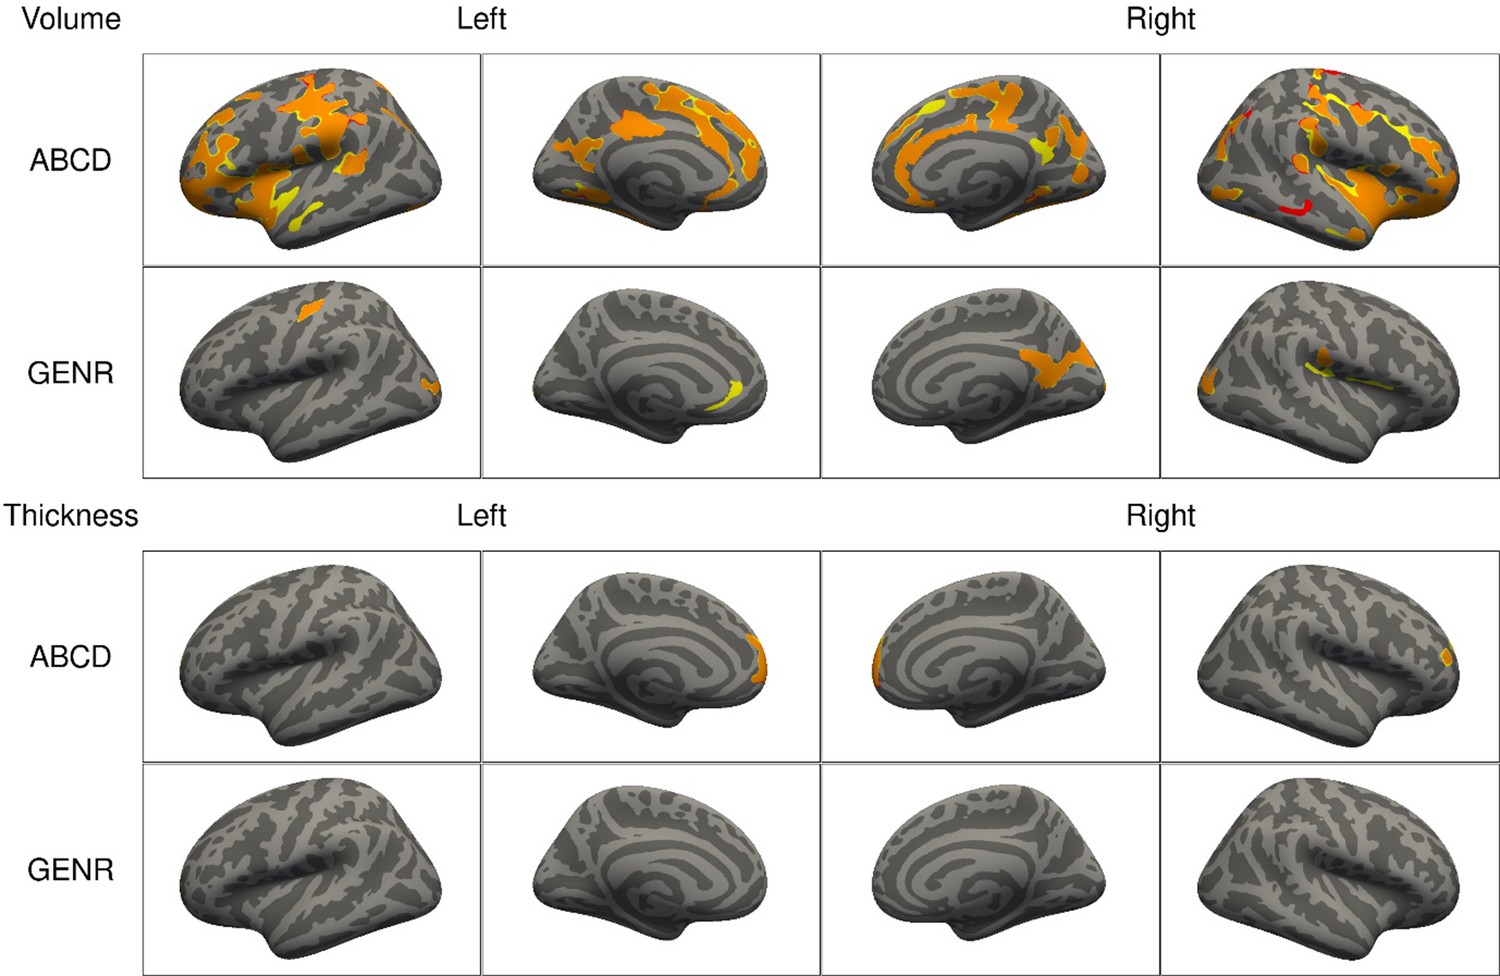
Significant clusters in the association of attention-deficit/hyperactivity disorder (ADHD) symptoms with cortical volume (top) and thickness (bottom) based on the Adolescent Brain Cognitive Development (ABCD) and Generation R Studies, for models 1–3.
Note. Columns represent the left and right hemispheres. The colors denote the different models. Regions in red represent significant clusters from model 1 (sex, age, race/ethnicity, and site [ABCD only]), orange from model 2 (model 1 + family income, maternal education, and maternal age at childbirth), and yellow from model 3 (model 2 + maternal smoking, substance use during pregnancy, psychopathology).
Figure 3—figure supplement 2
Significant clusters in the association of attention-deficit/hyperactivity disorder (ADHD) diagnosis with cortical surface area (top), volume (middle), and thickness (bottom) for the Adolescent Brain Cognitive Development (ABCD) Study, for models 1–3.
Note. Columns represent the left and right hemispheres. The colors denote the different models. Regions in red represent significant clusters from model 1 (sex, age, race/ethnicity, and site [ABCD only]), orange from model 2 (model 1 + family income, parental education, and maternal age at childbirth), and yellow from model 3 (model 2 + maternal smoking, substance use during pregnancy, psychopathology).
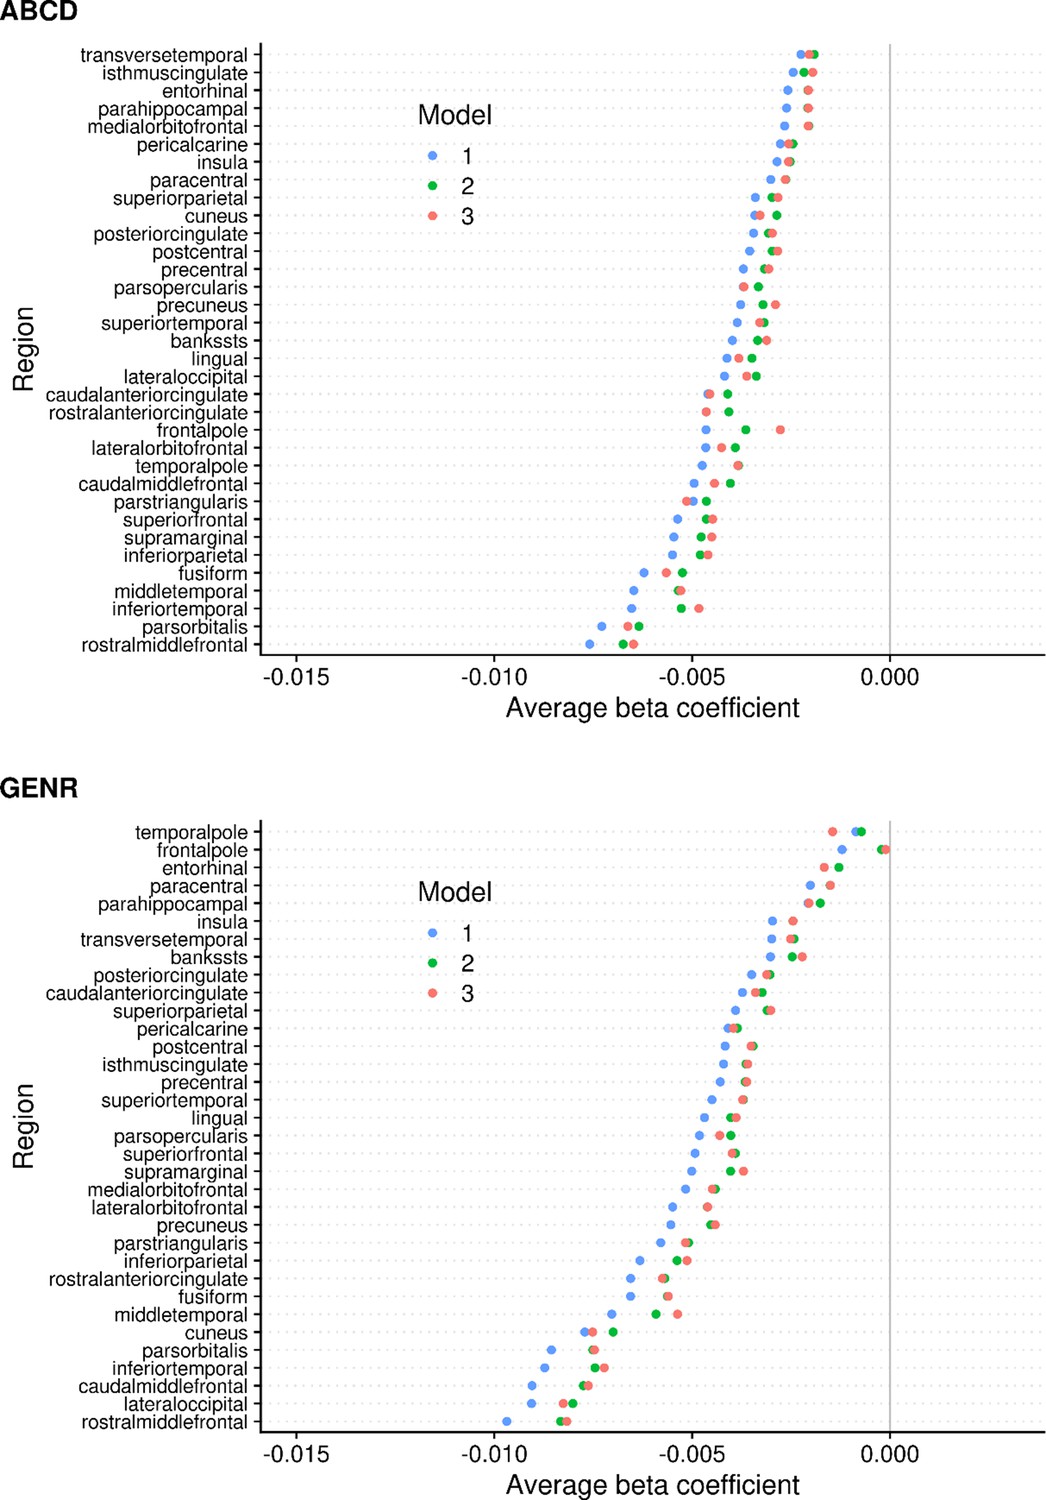
Figure 4 with 5 supplements

Region-based average regression coefficients for surface area in the Adolescent Brain Cognitive Development (ABCD) and Generation R Studies.
Note. The colors denote the different models, and the circles denote the average of all the betas within that region. The regions are based on the Desikan–Killiany atlas. Results for the ABCD and Generation R Studies are, respectively, shown on the top and bottom.
Figure 4—figure supplement 1
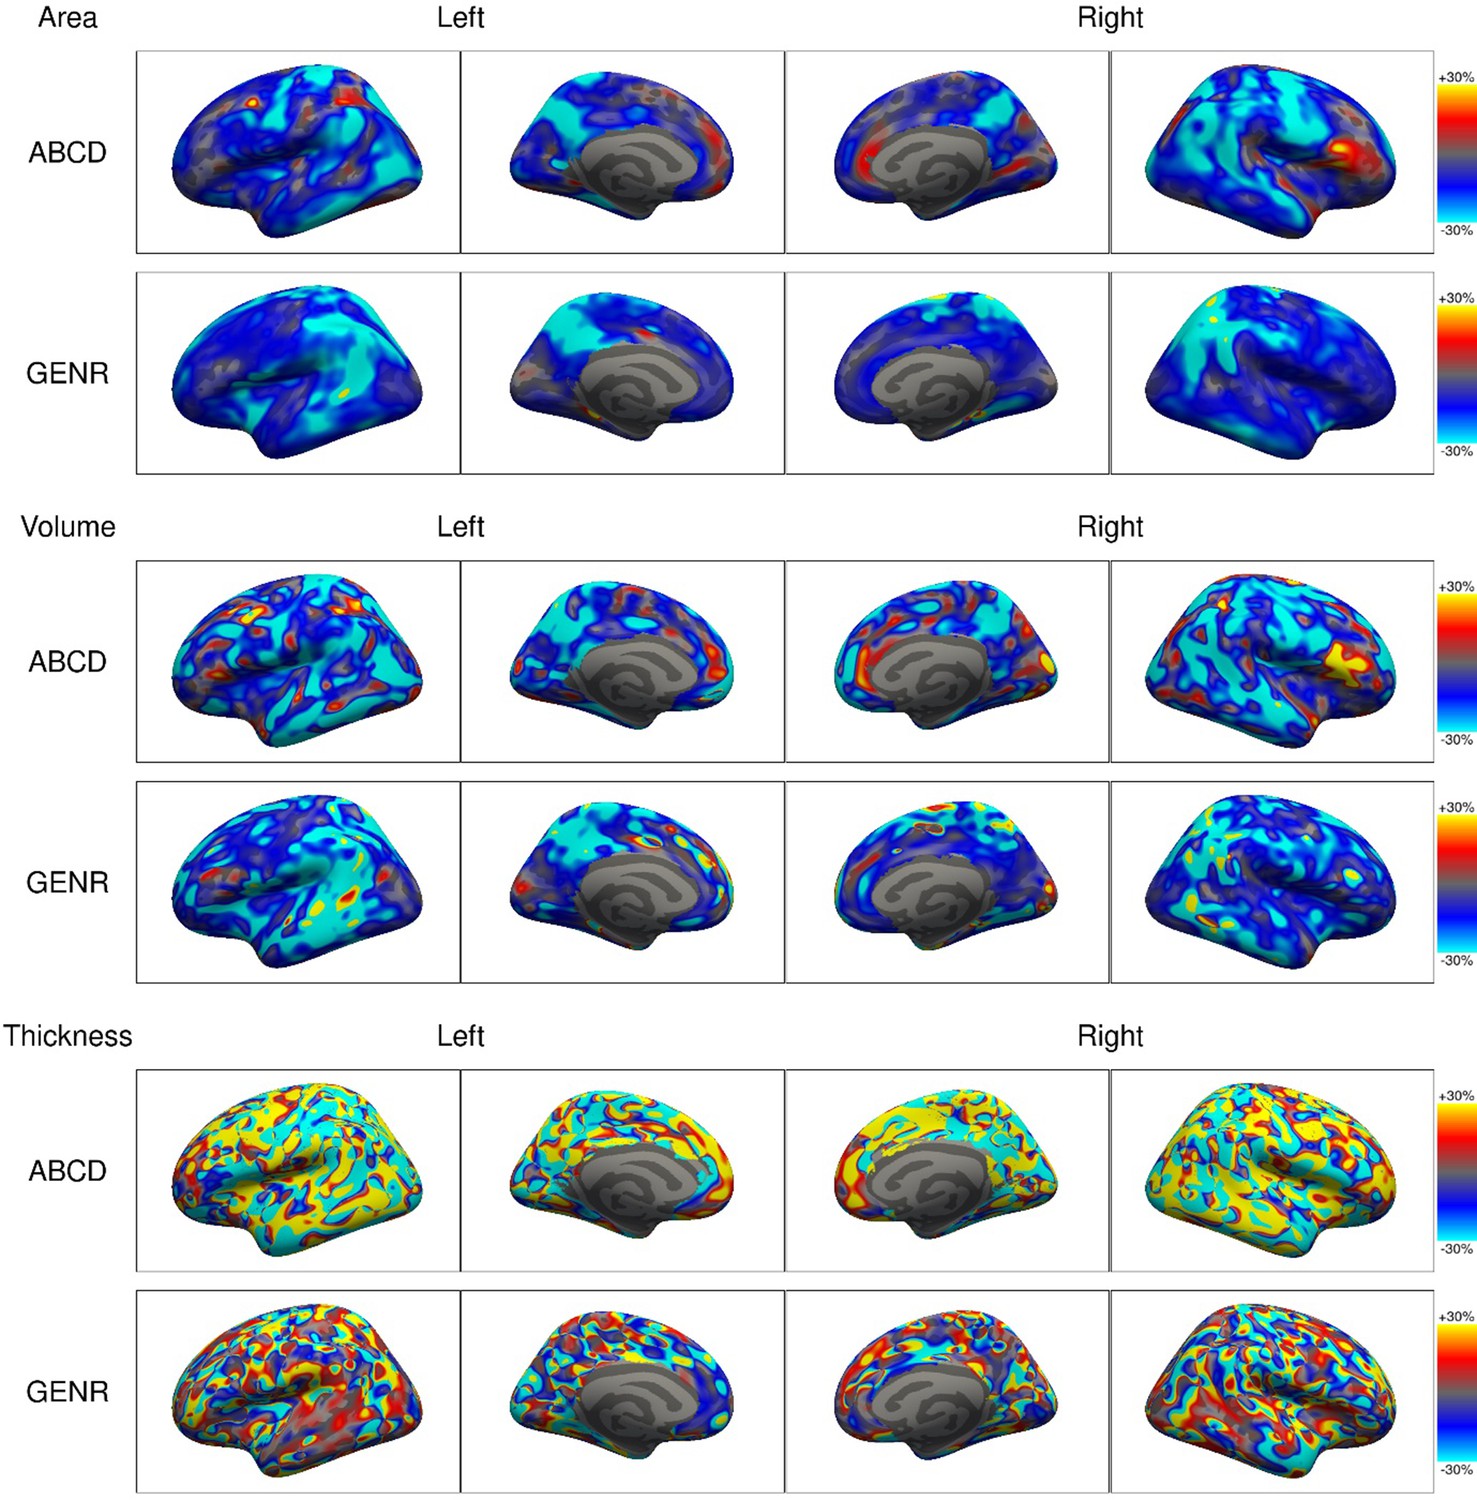
The vertex-wise change in effect sizes between models 1 and 3 for cortical surface area (top), volume (middle), and thickness (bottom).
Note. The rows represent the results for the Adolescent Brain Cognitive Development (ABCD) and Generation R Studies, and the columns represent the left and right hemispheres. The colors represent the change in the regression coefficients for attention-deficit/hyperactivity disorder (ADHD) symptoms. Warm colors denote an increase in effect whereas cold colors denote a decrease.
Figure 4—figure supplement 2
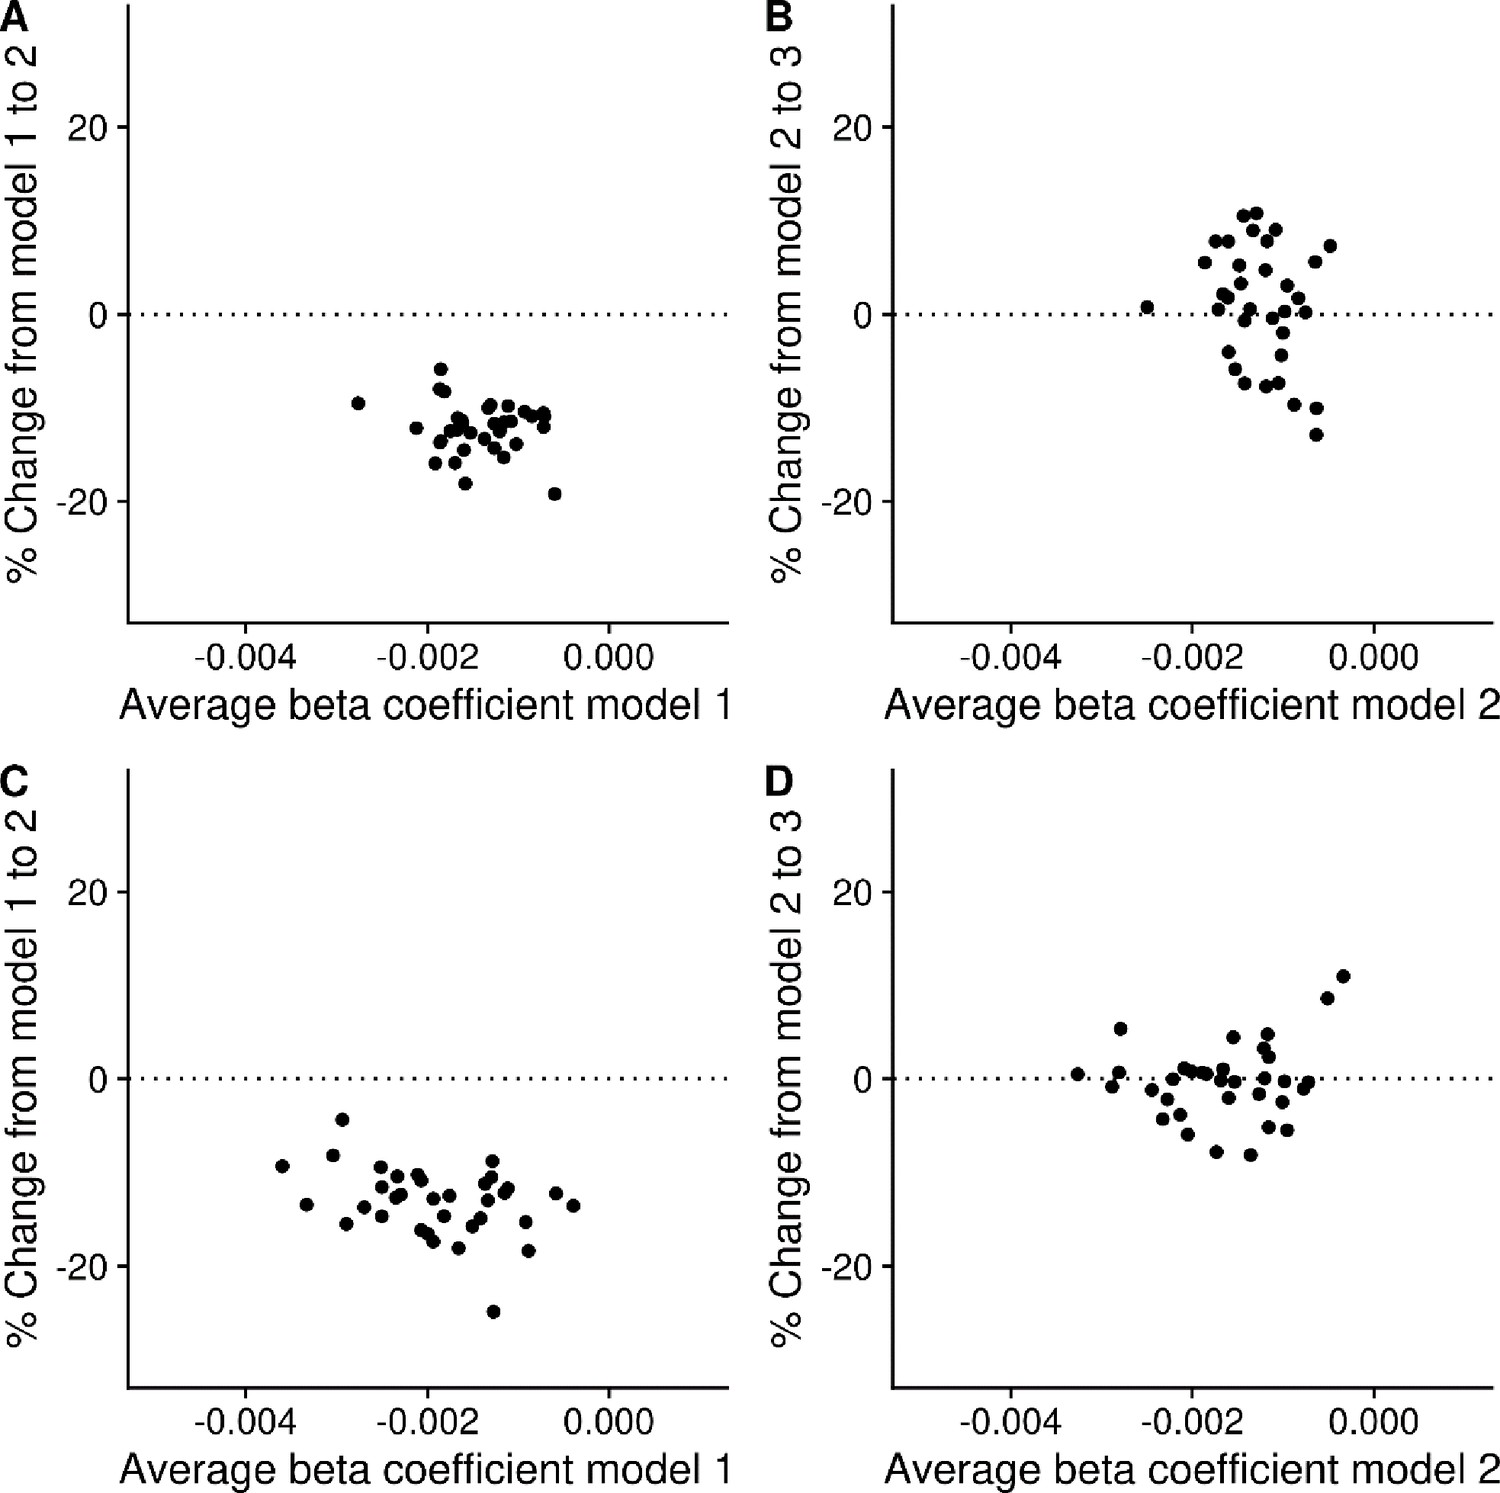
Change in the regional average betas for surface area in the Adolescent Brain Cognitive Development (ABCD) Study (A, B) and Generation R Study (C, D).
Note. Panels A and C represent the change of the regional average beta for surface area from model 1 to 2. Panels B and D represent the change of the regional average beta for surface area from model 2 to 3. Each circle represents a brain region according to the Desikan–Killiany atlas.
Figure 4—figure supplement 3
Region-based average regression coefficients for cortical volume in the Adolescent Brain Cognitive Development (ABCD) Study (top) and Generation R (bottom).
Note. The colors denote the different models, and the circles denote the average of all the betas within that region. The regions are based on the Desikan–Killiany atlas.
Figure 4—figure supplement 4
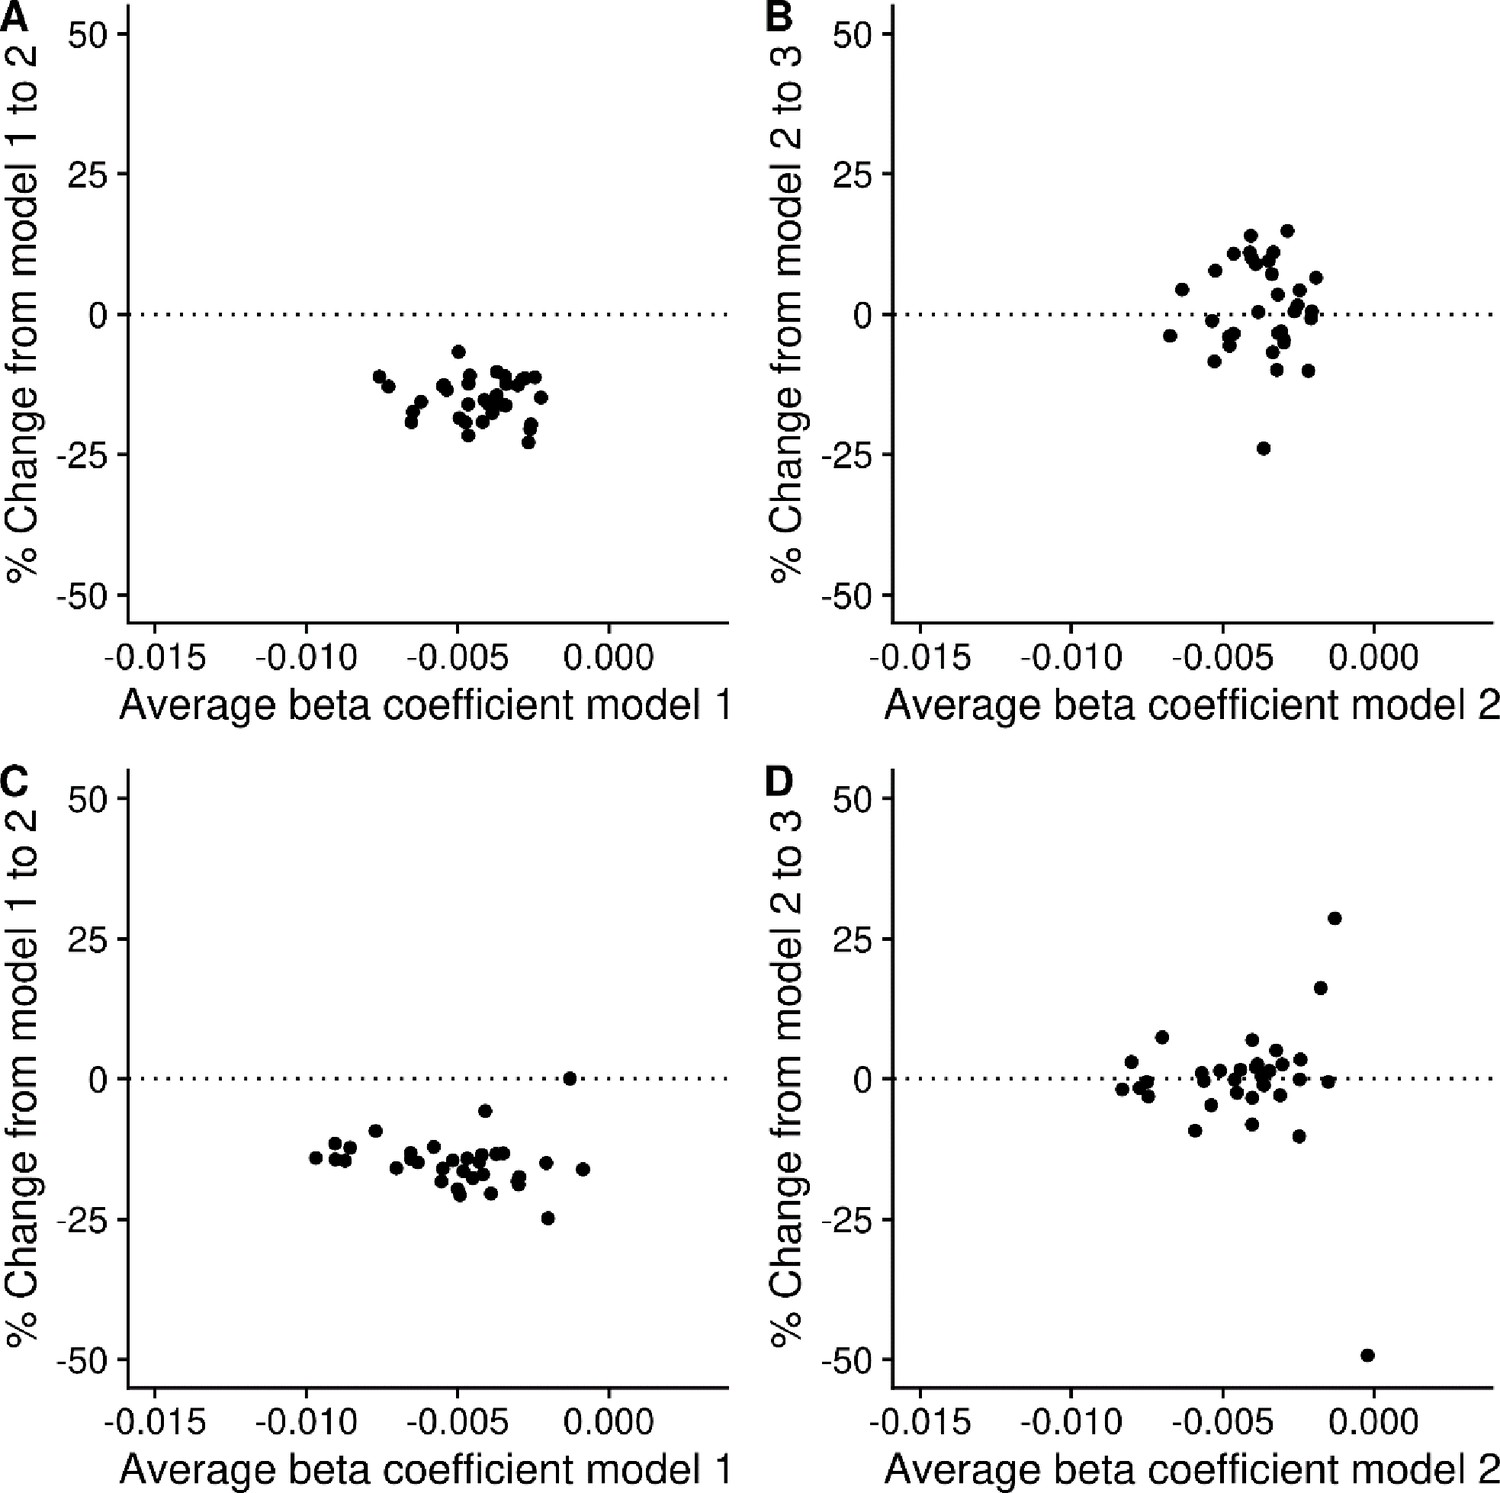
Change in the regional average betas for volume in the Adolescent Brain Cognitive Development (ABCD) Study (A, B) and Generation R Study (C, D).
Note. Panels A and C represent the change of the regional average beta for volume from model 1 to 2. Panels B and D represent the change of the regional average beta for volume from model 2 to 3. Each circle represents a brain region according to the Desikan–Killiany atlas.
Figure 4—figure supplement 5
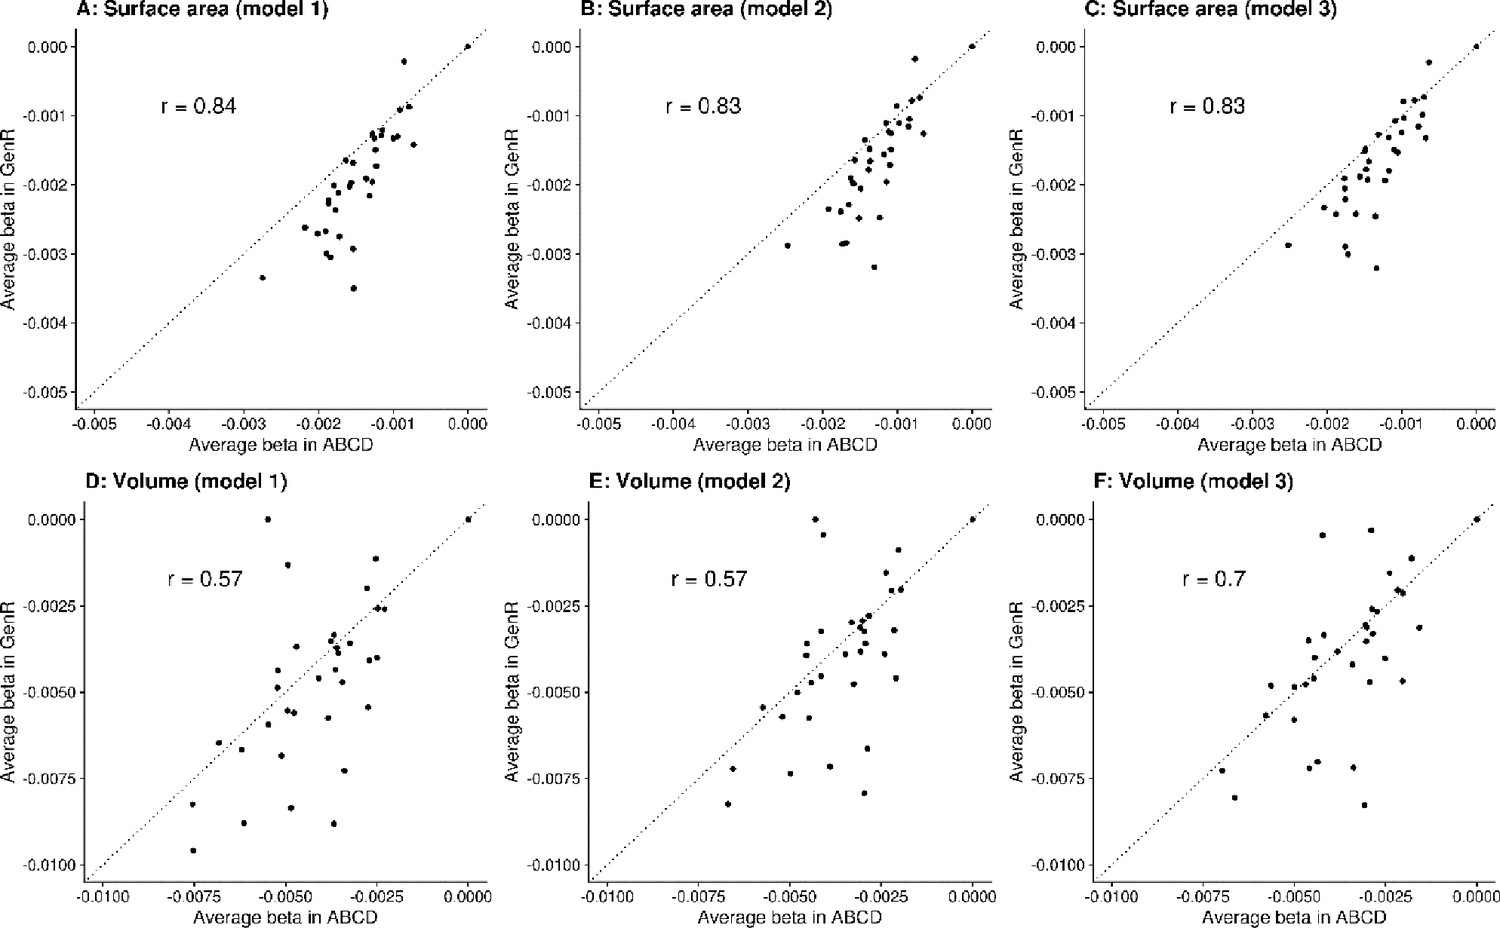
Scatterplot of Spearman correlations between region-based average regression coefficients from the Adolescent Brain Cognitive Development (ABCD) Study (x-axis) and the Generation R Study (y-axis).
Note. The top and bottom rows display the results for surface area (A-C) and volume (D-F), respectively. Each column represents one of the adjustment models, that is, model 1 (A,D), model 2 (B,E) andmodel 3 (C,F).
Figure 5 with 1 supplement
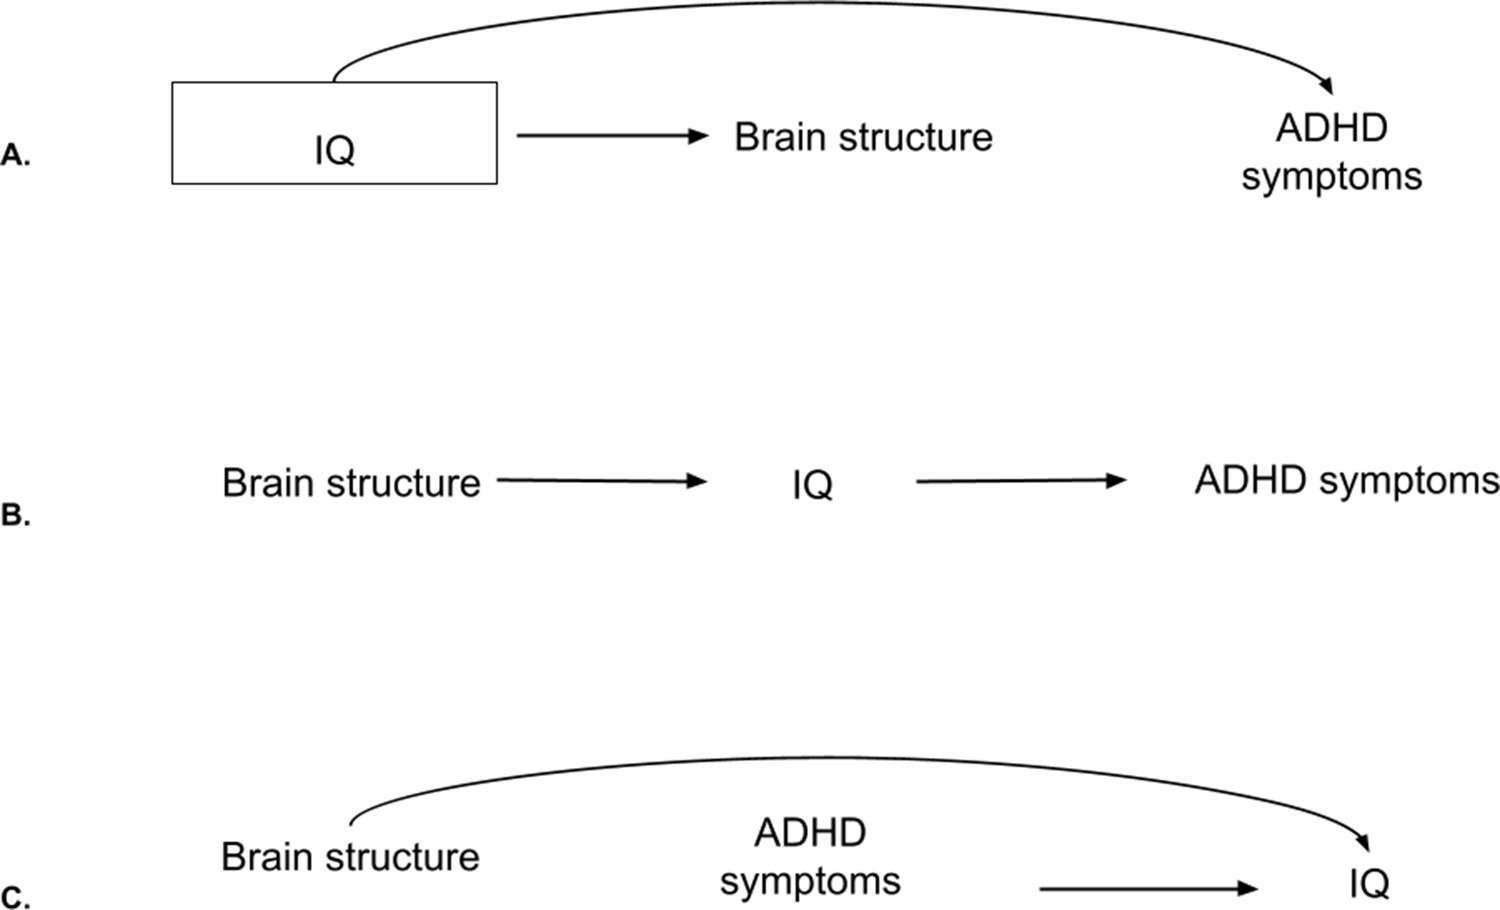
Directed Acyclic Graphs (DAGs) for intelligence quotient (IQ), brain structure, and attention-deficit/hyperactivity disorder (ADHD) symptoms.
Note. (A) DAG for IQ as a confounder. In this case, adjustments are needed as the backdoor path from brain structure to ADHD symptoms through IQ is open. By adjusting (box around IQ), the path gets closed. (B) DAG for IQ as a mediator. Adjustments are not needed to estimate the total effect of brain structure on ADHD symptoms. (C) DAG for IQ as a collider. The backdoor path through IQ is already closed. Adjustments would open the path and lead to collider bias.
Figure 5—figure supplement 1
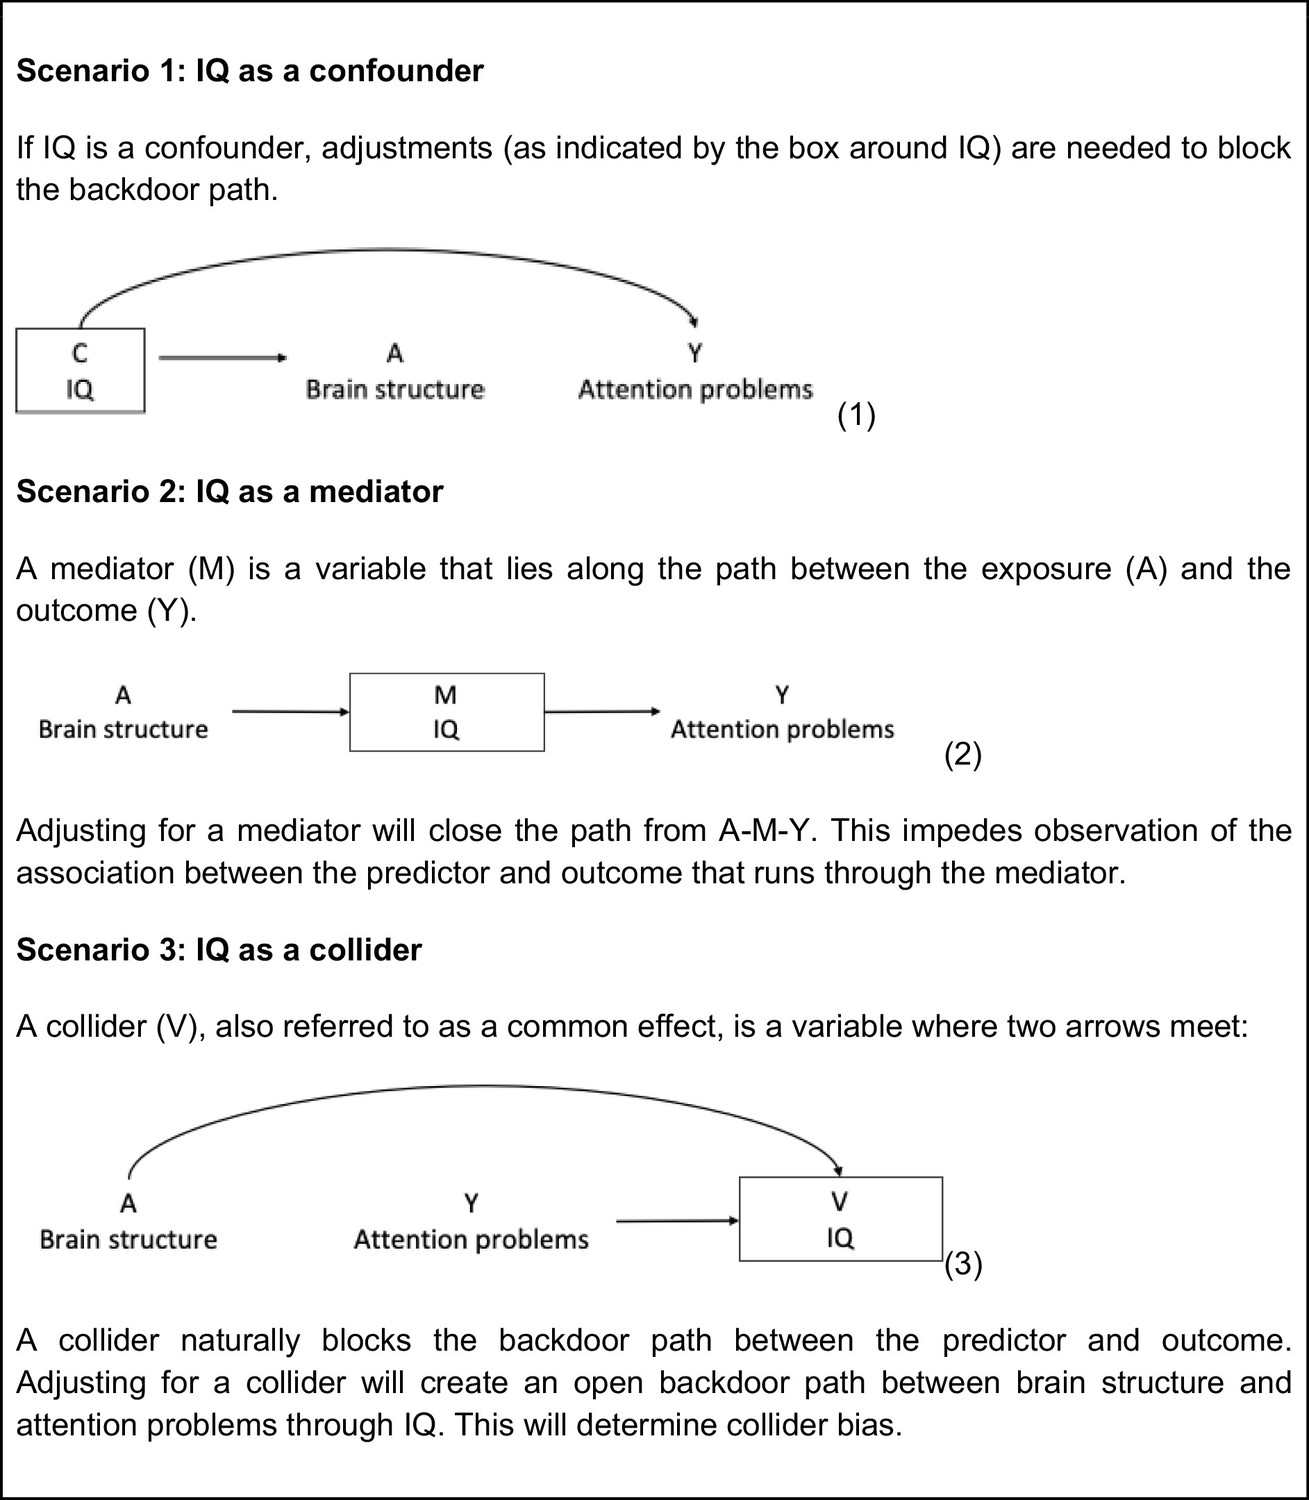
Directed Acyclic Graphs (DAGs) representing intelligence quotient (IQ) as a confounder, mediator, or a collider in the relation between brain structure and attention problems.
Note. A = exposure; C = confounder; M = mediator; V = collider; Y = outcome. (1) IQ as a confounder in brain structure–attention problems associations. (2) IQ as a mediator. (3) IQ as a collider.
Figure 6 with 1 supplement
Significant clusters in the association of attention-deficit/hyperactivity disorder (ADHD) symptoms with cortical surface area based on the Adolescent Brain Cognitive Development (ABCD) and Generation R Studies, after additional adjustment for intelligence quotient (IQ).
Note. Rows represent the results for the ABCD or Generation R Studies, and the columns represent the left and right hemispheres. The colors denote the different models, with red vertices being significant only in model 3, orange ones in both model 3 and after adjustment for IQ, and yellow ones only after adjusting for IQ.
Figure 6—figure supplement 1
Significant clusters in the association of attention-deficit/hyperactivity disorder (ADHD) symptoms with cortical volume (top) and thickness (bottom) based on the Adolescent Brain Cognitive Development (ABCD) and Generation R Studies, after additional adjustment for intelligence quotient (IQ).
Note. Rows represent the results for the ABCD or Generation R Studies, and the columns represent the left and right hemispheres. The colors denote the different models, with red vertices being significant only in model 3, orange ones in both model 3 and after adjustment for IQ, and yellow ones only after adjusting for IQ.
Figure 7

Information bias for brain structure, attention-deficit/hyperactivity disorder (ADHD) symptoms, and head motion.
Note. From the bottom up: We aim to measure the ‘true’ values of brain structure and ADHD symptoms. However, we actually measure both brain structure and ADHD symptoms imperfectly, at the MRI and through self-reports, respectively. What we assess is therefore affected by measurement errors. Error in the MRI measurement is determined, in part, by excessive motion during scanning. Higher ADHD symptoms likely cause higher motion (dotted red path). This leads to differential information bias and creates a non-causal path from ADHD symptoms to brain structure through motion.
Figure 8 with 1 supplement
Significant clusters in the association of attention-deficit/hyperactivity disorder (ADHD) symptoms with cortical surface area based on the Adolescent Brain Cognitive Development (ABCD) and Generation R Studies, after additional adjustment for motion.
Note. Rows represent the results for the ABCD or Generation R Studies, and the columns represent the left and right hemispheres. The colors denote the different models, with red vertices being significant only in model 3, orange ones in both model 3 and after adjustment for motion, and yellow ones only after adjusting for motion.
Figure 8—figure supplement 1
Significant clusters in the association of attention-deficit/hyperactivity disorder (ADHD) symptoms with cortical volume (top) and thickness (bottom) based on the Adolescent Brain Cognitive Development (ABCD) and Generation R Studies, after additional adjustment for motion.
Note. Rows represent the results for the ABCD or Generation R Studies, and the columns represent the left and right hemispheres. The colors denote the different models, with red vertices being significant only in model 3, orange ones in both model 3 and after adjustment for motion, and yellow ones only after adjusting for motion.
Figure 9
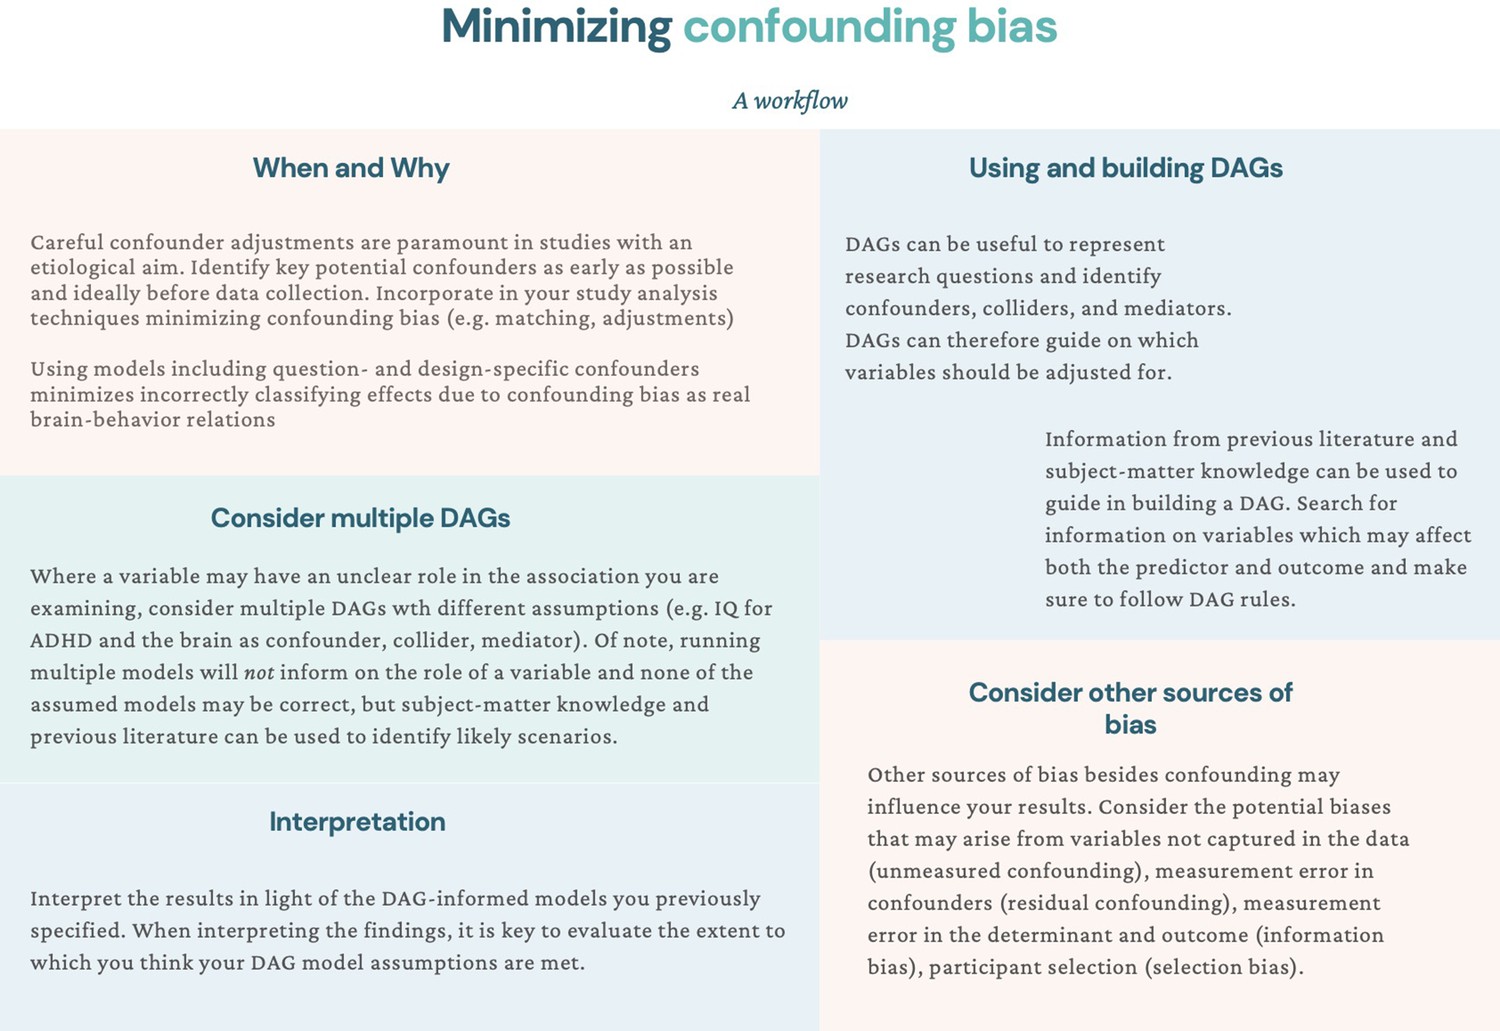
Suggestions for minimizing confounding bias: a workflow.
Note. In this workflow, we suggest different actions that can be taken throughout the research process to minimize confounding bias in psychiatric neuroimaging studies.
Figure 10
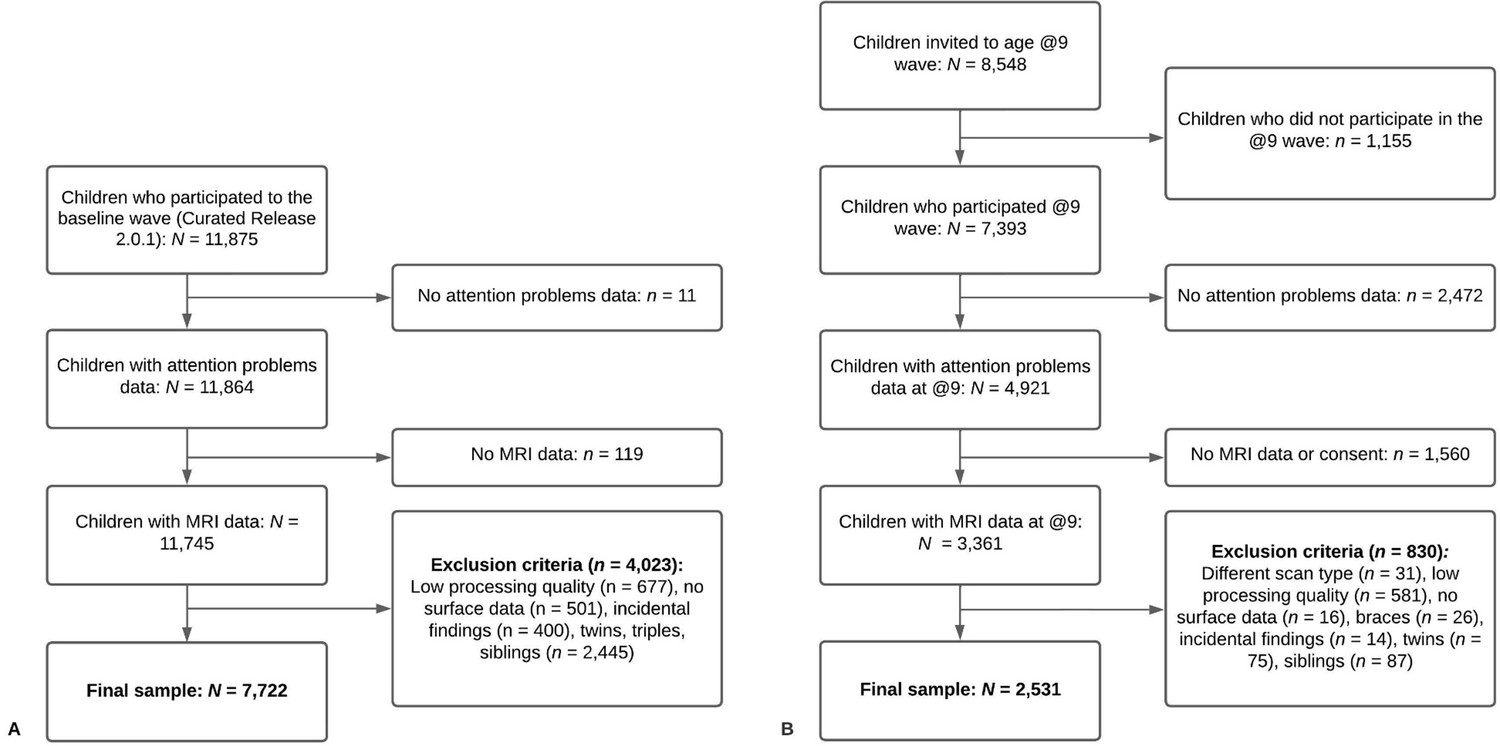
Flowcharts of participant inclusion and exclusion for Adolescent Brain Cognitive Development (ABCD) (panel A) and Generation R (panel B).
Note. (A) In the ABCD Study, of the 11,875 participants enrolled in the study, 7722 met our inclusion and exclusion criteria. (B) In the Generation R Study, of the 8548 participants invited to the age 9–10 assessment, 2531 met our inclusion and exclusion criteria.
Additional files
-
Supplementary file 1
Adjustments in prior literature on ADHD and brain structure and descriptive statistics of the present study.
(a) Overview of adjusted confounders for neuroimaging studies on attention-deficit/hyperactivity disorder (ADHD). Note. S = sensitivity; M = matched. (b) Descriptive statistics of the study population in the ABCD and Generation R Studies. aFor the ABCD Study, missing values were present for race/ethnicity (<0.1%), highest parental education (<0.1%), household income (8.9%), maternal age at birth (2.4%), smoking during pregnancy (<0.1%), cannabis use during pregnancy (<0.1%), and IQ (2.3%). bFor Generation R, missing values were present for ethnicity (<0.1%), maternal education (8.0%), household income (12.0%), smoking during pregnancy (11.1%), cannabis use during pregnancy (19.5%), IQ (12.4%), and aggression problems (<0.1%).
- https://cdn.elifesciences.org/articles/78002/elife-78002-supp1-v2.docx
-
Transparent reporting form
- https://cdn.elifesciences.org/articles/78002/elife-78002-transrepform1-v2.pdf
-
Reporting standard 1
STROBE checklist.
- https://cdn.elifesciences.org/articles/78002/elife-78002-repstand1-v2.docx
-
Reporting standard 2
STROBE flowchart.
- https://cdn.elifesciences.org/articles/78002/elife-78002-repstand2-v2.docx
Download links
A two-part list of links to download the article, or parts of the article, in various formats.
Downloads (link to download the article as PDF)
Open citations (links to open the citations from this article in various online reference manager services)
Cite this article (links to download the citations from this article in formats compatible with various reference manager tools)
Attention-deficit hyperactivity disorder symptoms and brain morphology: Examining confounding bias
eLife 11:e78002.
https://doi.org/10.7554/eLife.78002


