Photoreceptors generate neuronal diversity in their target field through a Hedgehog morphogen gradient in Drosophila
- Department of Cell and Developmental Biology, University College London, United Kingdom
Figures
Figure 1 with 1 supplement
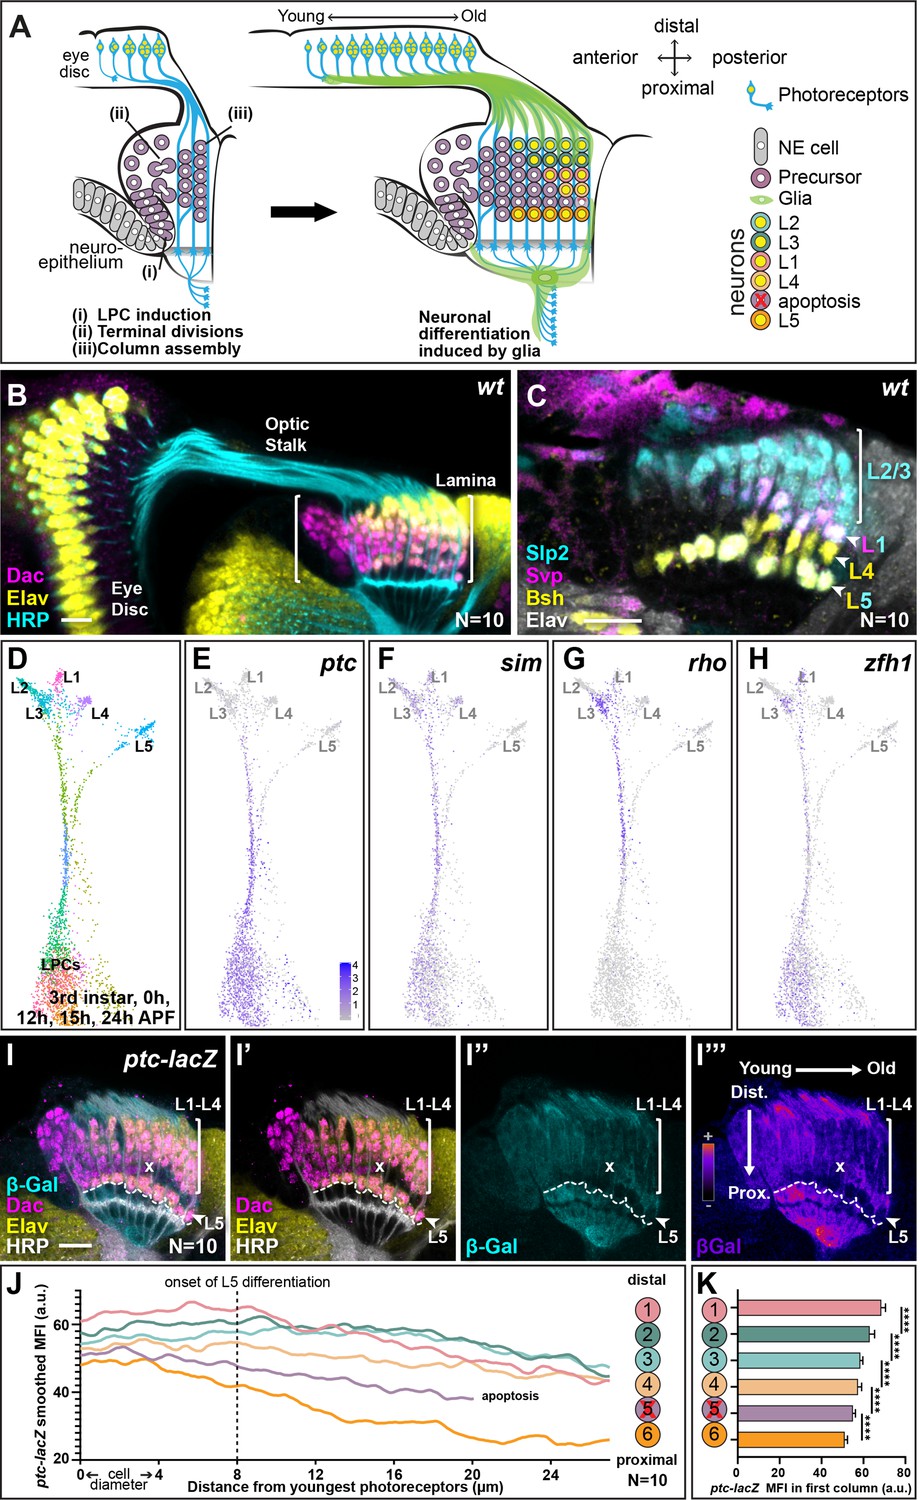
Hedgehog (Hh) pathway activity is graded along lamina columns.
(A) Schematic of the developing lamina. Photoreceptor axons release Hh into the optic lobe, which guides lamina development by driving neuroepithelial cells to develop into lamina precursor cells (LPCs), their terminal divisions, and column assembly. Once assembled into columns of six LPCs each, LPCs differentiate into five distinct neuron types L1-L5 in response to MAPK activity that is induced by signals from glia (Fernandes et al., 2017; Prasad et al., 2022). Lamina neuron types are positioned stereotypically along the distal to proximal axis of columns: L2, L3, L1, L4, and L5; the LPCs between L4s and L5s undergo apoptosis. (B) A wild-type optic lobe and eye disc, with the developing lamina labelled by Dachshund (Dac; magenta), differentiating neurons by Embryonic lethal abnormal vision (Elav; yellow) and photoreceptor axons by Horseradish peroxidase (HRP, cyan). (C) A wild-type lamina labelled with lamina neuron-type-specific markers, Sloppy paired 2 (Slp2; cyan), Brain-specific homeobox (Bsh; yellow), and Seven-up (Svp; magenta); all neurons are marked by Elav (white). The Slp2 alone labels L2s and L3s, Bsh alone labels L4s, Svp together with Slp2 label L1s, and Slp2 together with Bsh label L5s. (D) Uniform manifold approximation and projection (UMAP) visualisation of LPCs, differentiated L1-L5 neurons, and intermediate stages of differentiation using 150 principal components calculated on the log-normalised integrated gene expression from single-cell RNA sequencing datasets of the third larval instar, 0 hr-, 12 hr-, 15 hr-, and 24 hr-after puparium formation (APF). See Figure 1—figure supplement 1A for the full integrated dataset. (E–H) UMAP visualisation from (D; grey) showing log-normalised expression of Hh signalling targets (blue): (E) patched (ptc), (F), single-minded (sim), (G) rhomboid (rho), and (H) zinc finger homeodomain 1 (zfh1), which all show higher levels of expression in the convergent stream connecting the LPC cluster with mature L1-L4 neuron clusters rather than the stream connecting the LPC cluster with the L5 neuron cluster. (I) An optic lobe expressing ptc-LacZ stained for β-galactosidase (β-Gal; cyan), Dac (magenta), Elav (yellow), and HRP (white). The two axes – young to old and proximal to distal are indicated in I’’. (I”’) shows I” in pseudo-colour. The dashed line marks the most proximal surface of the lamina. The ‘x’ marks the point from which the excess LPCs have been cleared. (J) Smoothed (second order with six neighbours; see Materials and methods section) mean fluorescence intensities (MFIs; arbitrary units; a.u.) of ptc-LacZ (β-Gal) by distal to proximal cell position as indicated. The L5s and the excess LPCs began with and maintained the lowest levels of β-Gal expression over time. Summary statistics for the raw data in Supplementary file 1. (K) Same data as J plotted for the youngest lamina column only. Asterisks indicate significance: p-values <0.0001 from a one-way ANOVA with Dunn’s multiple comparisons test. Error bars represent Standard Deviation (SD). Scale bar = 20 µm. See also Figure 1—figure supplement 1.
Figure 1—figure supplement 1
Identifying and validating additional lamina neuron-type markers.
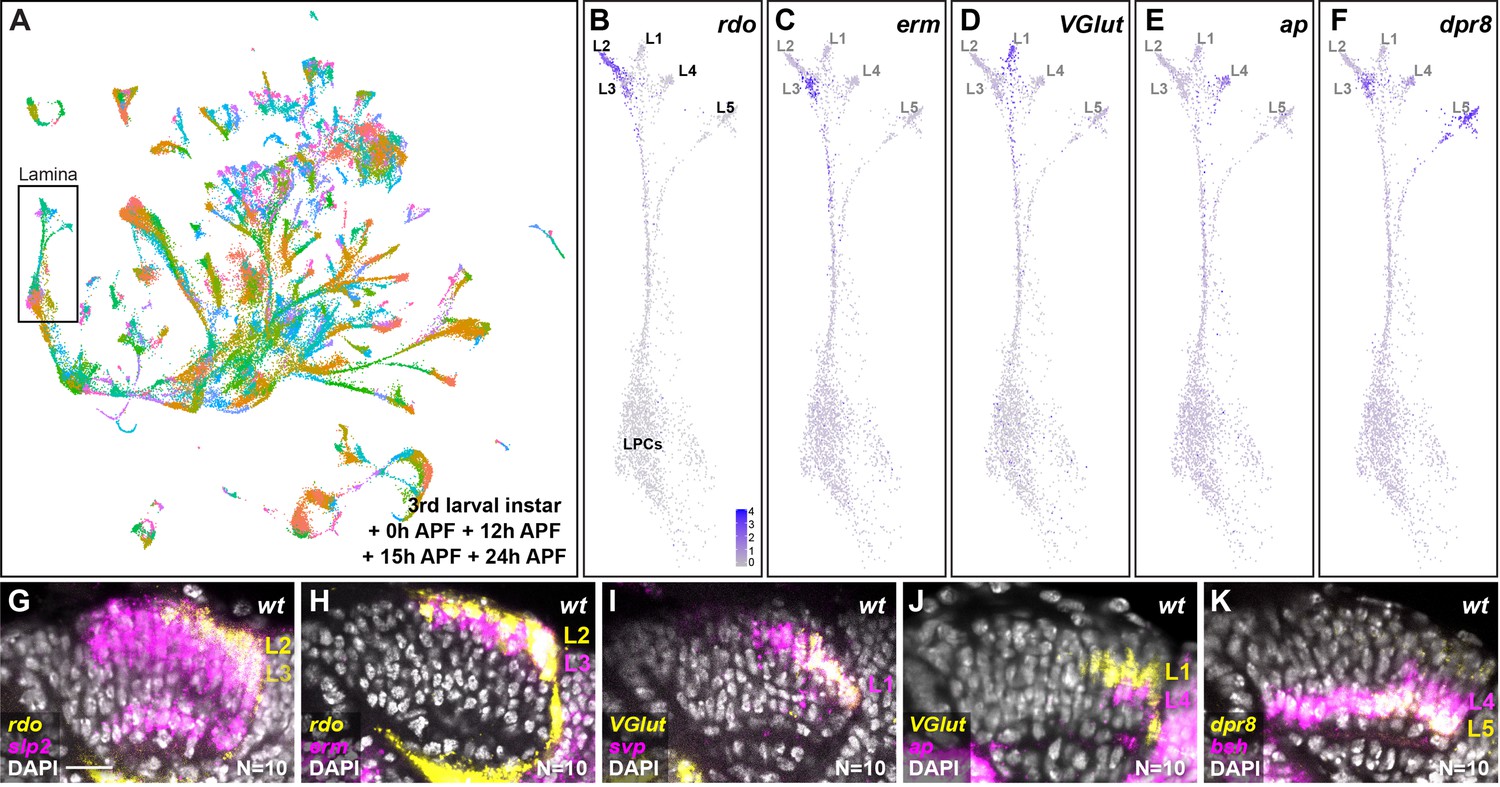
(A) UMAP visualisation of integrated third larval instar, 0 hr-, 12 hr-, 15 hr-, and 24 hr-after puparium formation (APF) single-cell RNA sequencing datasets (Konstantinides et al., 2021; Kurmangaliyev et al., 2020; Özel et al., 2021) using 150 principal components calculated on the log-normalised integrated gene expression. Rectangle marks lamina precursor cells and lamina neurons of varying maturity, which were identified based on known markers and existing annotations from the 15-hr APF dataset as described in Materials and methods section. (B–F) UMAP of lamina cells from Figure 1D showing log-normalised expression of the lamina neuron subtype markers (blue): (B) reduced ocelli (rdo), (C) earmuff (erm), (D) Vesicular glutamate transporte (VGlut), (E) apterous (ap), and (F) defective proboscis extension response 8 (dpr8). (G–K) In situ hybridisation chain reaction for (G) rdo and sloppy paired 2 (slp2), (H) rdo and erm, (I) VGlut and Seeven up (svp), (J) VGlut and ap and (K) dpr8 and brain-specific homeobox (bsh) in the lamina at 0-hr APF using DAPI to mark all nuclei (white). Scale bar = 20 µm.
Figure 2
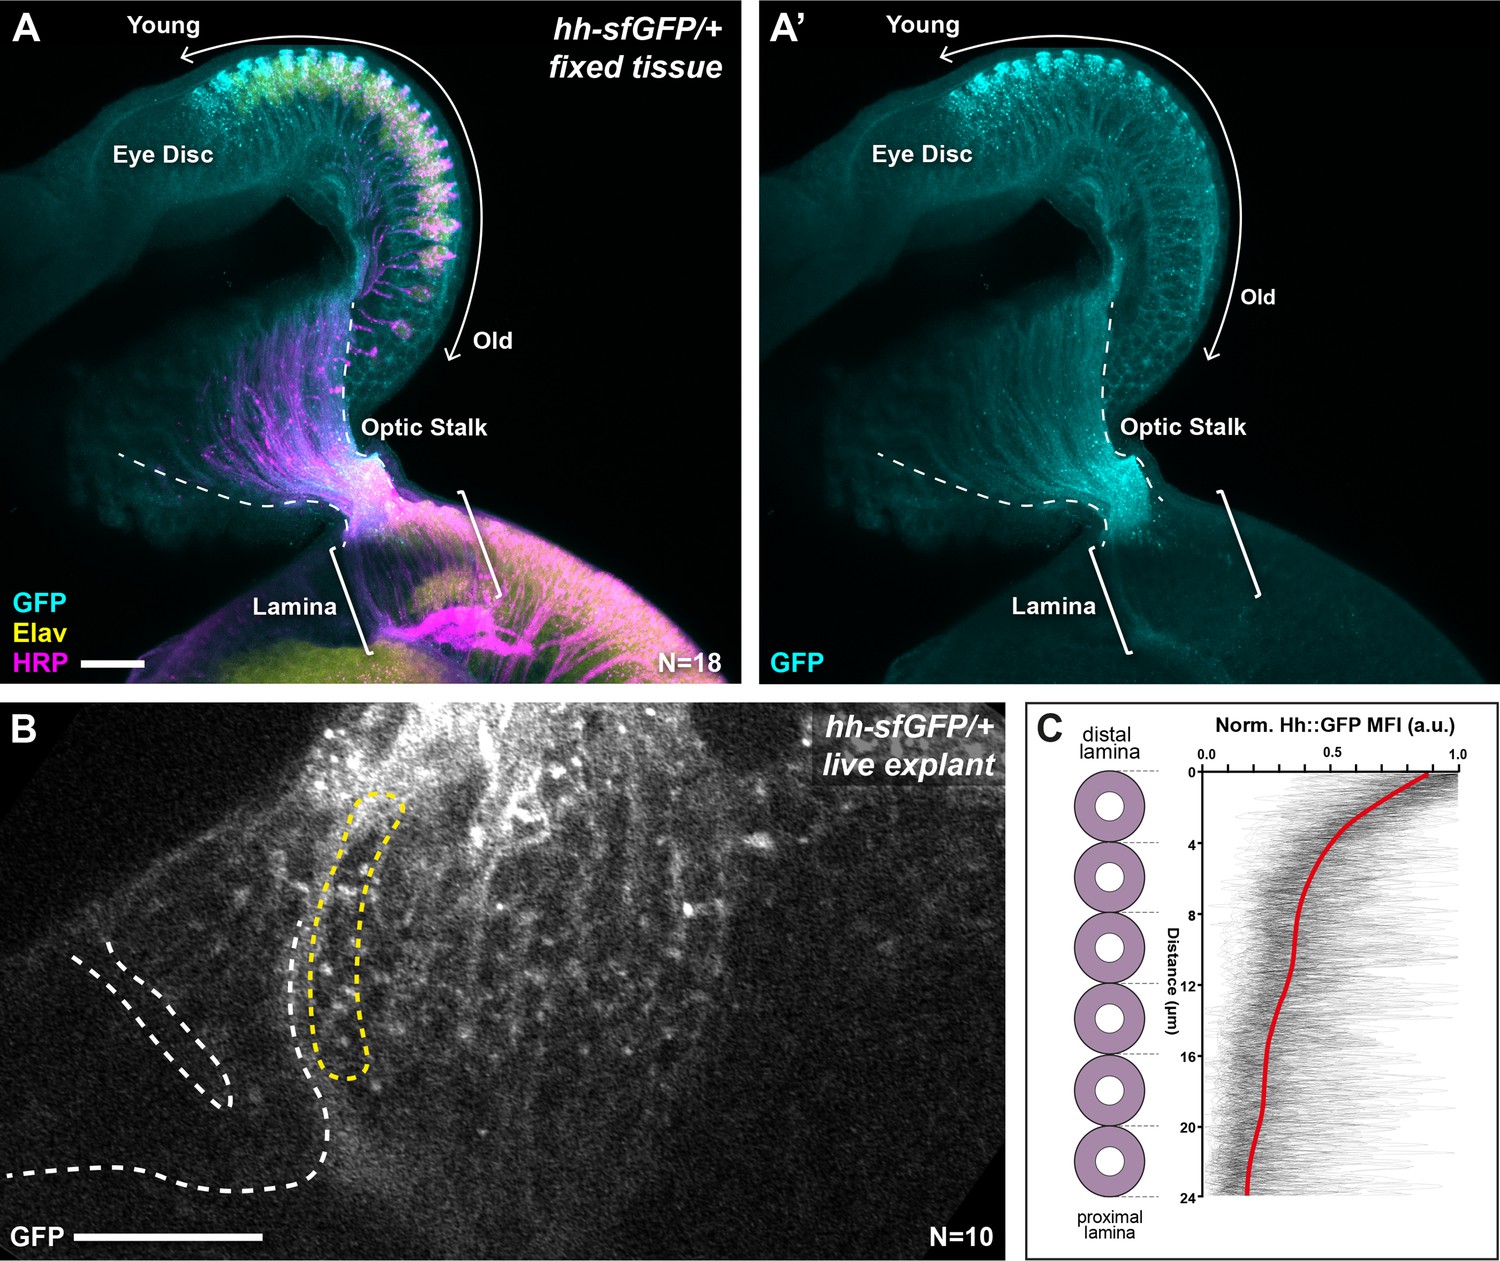
Hh::GFP is distributed in a protein gradient in the lamina.
(A) A maximum intensity projection of a hh-sfGFP/+ optic lobe and eye disc complex (fixed tissue). Hh::GFP (cyan) detected by immunohistochemistry was present in photoreceptor cell bodies in the eye disc (Embryonic lethal abnormal vision [Elav]; yellow), with higher levels in younger photoreceptors as reported previously (Huang and Kunes, 1996) and photoreceptor axons in the optic stalk (Horseradish peroxidase [HRP]; magenta). The Hh::GFP expression decreased rapidly once photoreceptors entered the lamina (brackets). (B) A cross-sectional view of the lamina from a live explant of hh-sfGFP/+. Hh::GFP puncta were visible more prominently in the distal lamina, with fewer and smaller puncta appearing in proximal regions. White dashed lines mark the lamina furrow. The yellow dashed line marks the youngest column. (C) Hh::GFP mean fluorescence intensity (MFI) plots from live explants normalised to the maximum MFI value for each plot (arbitrary units; a.u.) as a function of distance from distal to proximal cell position as indicated for the youngest lamina column (yellow dashed outline in B). The red line shows regression averaging of each of the MFI profiles (see Materials and methods section). Scale bar = 20 µm.
Figure 3 with 1 supplement
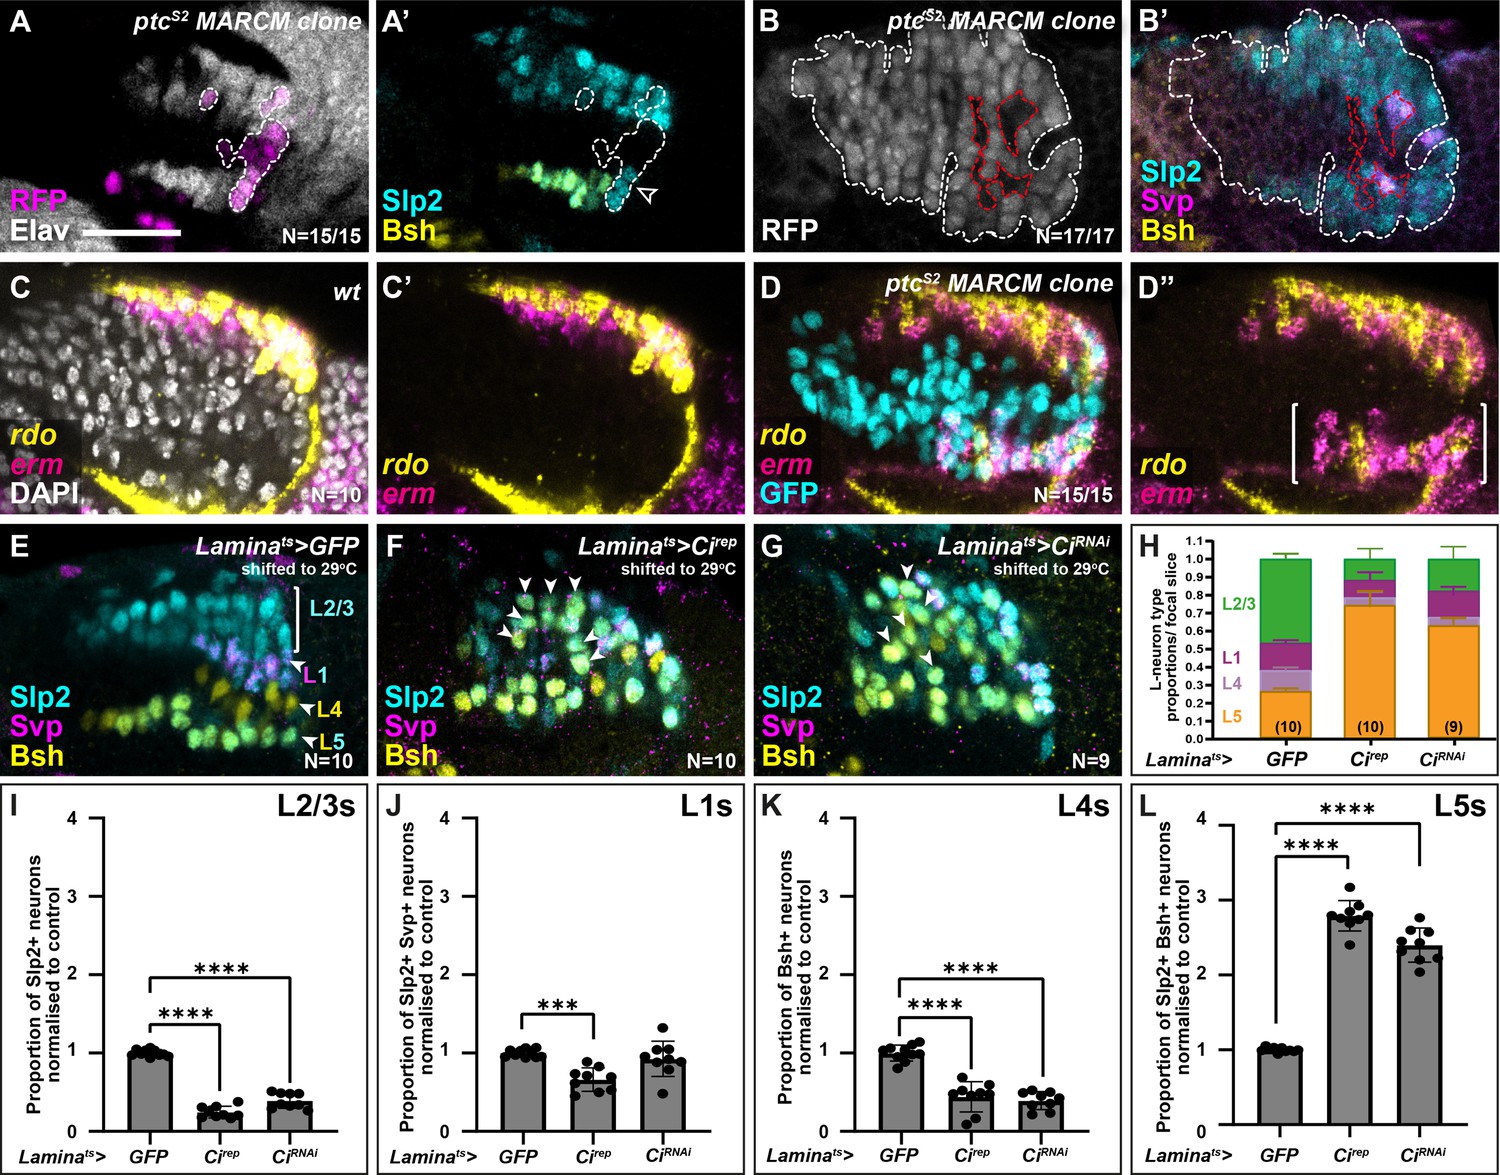
High and low extremes of Hedgehog (Hh) pathway activity specify distal and proximal lamina neuron identities, respectively.
(A) An optic lobe with a small, RFP-positive ptcS2 MARCM (mosaic analysis with a repressible cell marker) clone labelled with embryonic lethal abnormal vision (Elav; white), RFP (magenta), sloppy paired 2 (Slp2; cyan), and brain-specific homeobox (Bsh; yellow). Clones in the lamina are outlined by dashed lines. Cells within the clone that were Elav-positive were Slp2-positive but lacked Bsh. (B) An optic lobe with a large, RFP-positive ptcS2 MARCM clone labelled with RFP (white), Slp2 (cyan), Bsh (yellow), and seven-up (Svp; magenta). Clones in the lamina are outlined by dashed white lines. Cells contained within the lamina that are not part of the clone are outlined by dashed red lines. Cells within the clone that were Elav-positive, were Slp2-positive but not Svp- or Bsh-positive. Note that the Svp-positive cells are not contained within the clone. (C) Expression pattern of reduced ocelli (rdo; yellow) and earmuff (erm; magenta) in wild-type optic lobes using in situ hybridisation chain reaction. DAPI marks all nuclei (white). (D) Expression pattern of rdo (yellow) and erm (magenta) in optic lobes containing ptcS2 mutant clones. Ectopic rdo and erm were observed in the proximal lamina within the clone. (E–G) Lamina-specific misexpression of (E) CD8::GFP (control), (F) Cubitus interruptus (Cirep), and (G) CiRNAi, labelled with lamina neuron-type-specific markers Slp2 (cyan), Bsh (yellow), and Svp (magenta). Ectopic Slp2 and Bsh co-expressing cells (L5s) were recovered in the distal lamina (arrowheads) in (F and G). (H) Quantifications of the proportion of each lamina neuron type per focal slice aggregated for (E–F). (I–L) The same as (H), normalised to the control and split by lamina neuron type: (I) L2-L3s or Slp2-only expressing cells, (J) L1s or Slp2 and Svp co-expressing cells, (K) L4s or Bsh-only expressing cells, (L) L5s or Slp2 and Bsh co-expressing cells (see Materials and methods section). Error bars represent SD. Ns indicated in parentheses in (H). One-way ANOVA with Dunn’s multiple comparisons test. p***<0.001 and p****<0.0001. Scale bar = 20 µm. See also Figure 3—figure supplement 1.
Figure 3—figure supplement 1
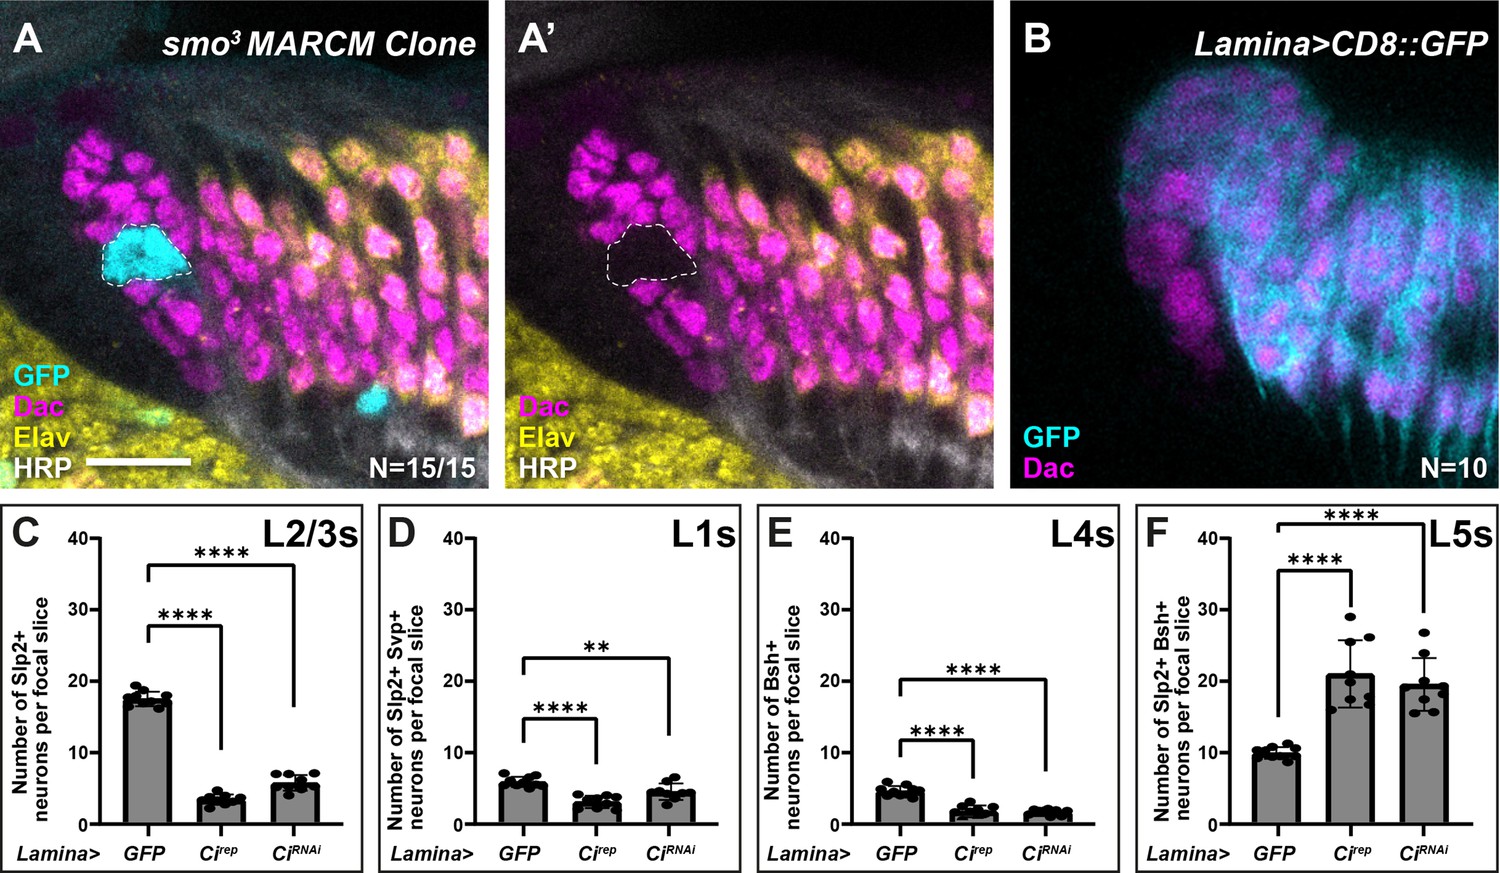
Lamina-specific misexpression of the repressive form of Cubitus interruptus (Cirep) and CiRNAi perturbs specification.
(A) An optic lobe with a GFP-positive (cyan) smo3 MARCM clone (dashed outline) labelled with Dachsund Dac; (magenta), Embryonic lethal abnormal vision Elav; (yellow) and Horseradish peroxidase (HRP ; white). Cells within the clone did not express Dac and did not incorporate into the lamina. (B) R27G05-Gal4, a lamina-specific Gal4 driving expression of CD8::GFP (GFP in cyan and Dac in magenta). GFP expression initiated in lamina precursor cells exiting the lamina furrow. (C–F) Quantifications of the number of each lamina neuron type per focal slice, L2-L3, L1, L4, or L5, for each condition. One-way ANOVA with Dunn’s multiple comparisons test. p**<0.01 and p****<0.0001. Scale bar = 20 µm.
Figure 4 with 1 supplement
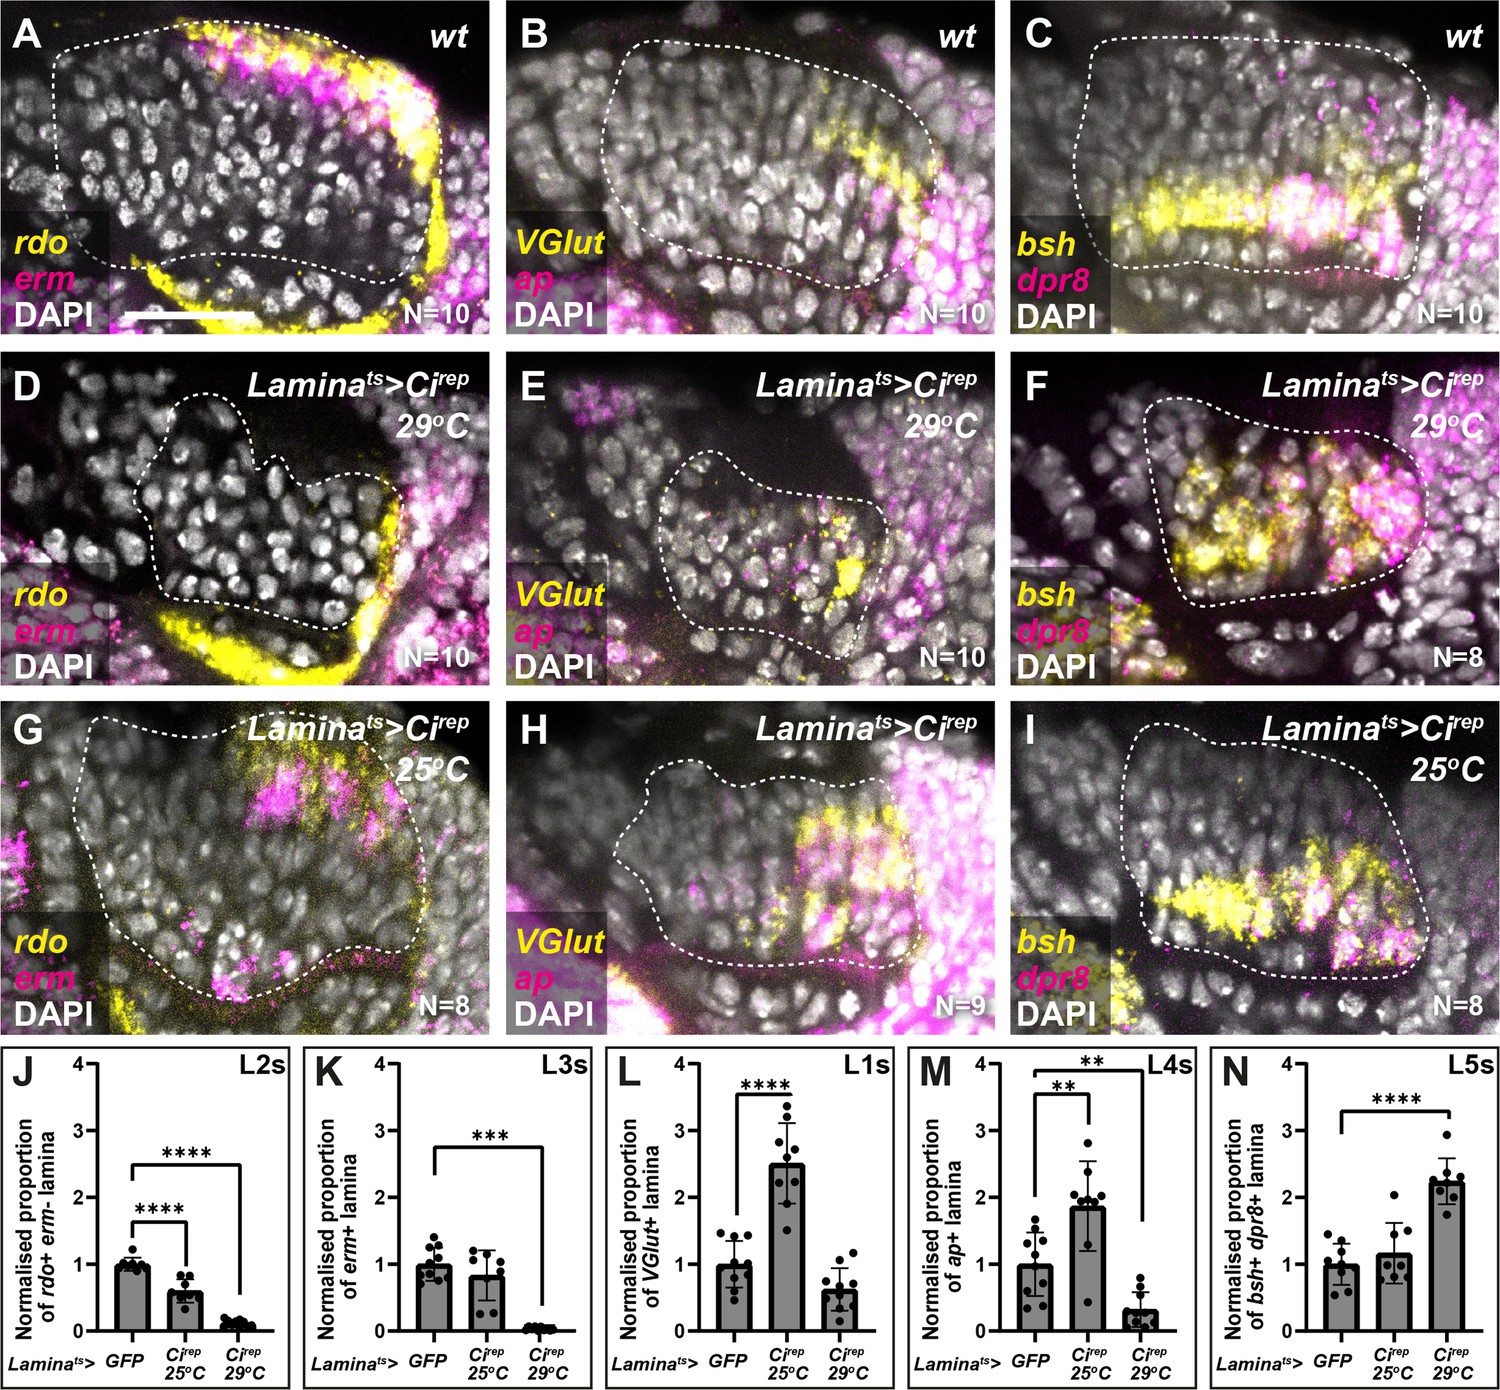
Intermediate levels of Hedgehog (Hh) signalling activity specify intermediate lamina neuron identities.
(A–C) Wild-type optic lobes showing the expression of (A) reduced ocelli (rdo; yellow; L2 and L3s) and earmuff (erm; magenta; L3s), (B) Vesicular glutamate transporter (VGlut; yellow; L1s) and apterous (ap magenta; L4s), and (C) brain-specific homeobox (bsh; yellow) and defective proboscis extension response 8 (dpr8; magenta) (co-expressing cells are L5s) by hybridisation chain reaction. DAPI marks all nuclei in white. (D–F) Optic lobes from Laminats >Cirep at 29°C (i.e. strong Hh signalling inhibition) labelled for (D) rdo (yellow) and erm (magenta), (E) VGlut (yellow) and ap (magenta), and (F) bsh (yellow) and dpr8 (magenta). DAPI in white. (G–I) Optic lobes from laminats >Cirep at 25°C (i.e. milder Hh signalling inhibition) labelled for (G) rdo (yellow) and erm (magenta), (H) VGlut (yellow) and ap (magenta), and (I) bsh (yellow) and dpr8 (magenta). DAPI in white. (J–N) Quantifications of (A–I) represented as the relative area of the lamina expressing (J) rdo, (K) erm, (L) VGlut, (M) ap, and (N) bsh and dpr8 per focal slice, normalised to the control (see Materials and methods section). One-way ANOVA with Dunn’s multiple comparison test. p**<0.01; p***<0.001; and p****<0.0001. Error bars represent SD. Scale bar = 20 µm.
Figure 4—figure supplement 1
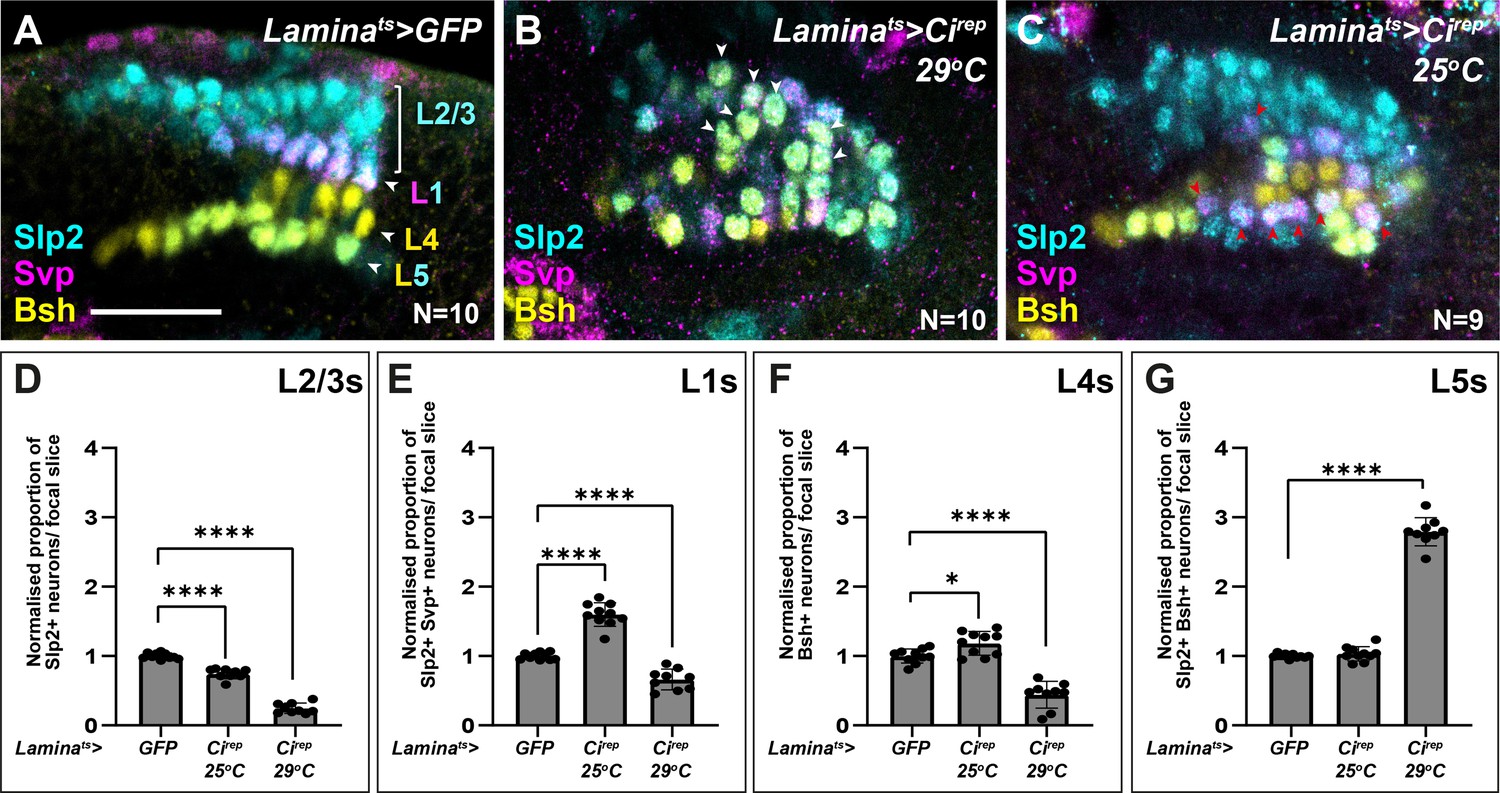
Intermediate levels of Hedgehog (Hh) signalling activity specify intermediate lamina neuron identities when evaluated by alternative neuron-type markers.
(A–C) Lamina-specific misexpression of (A) CD8::GFP (control), (B) Cubitus interruptus (Cirep) shifted to 29°C, and (C) Cirep shifted to 25°C, labelled with lamina neuron-type-specific markers sloppy paired 2 (Slp2; cyan), brain-specific homeobox (Bsh; yellow), and seven-up (Svp; magenta). (D–E) Quantifications of the proportion of each lamina neuron type per focal slice, normalised to the control. Error bars represent SD. One-way ANOVA with Dunn’s multiple comparison test. p*<0.05 and p****<0.0001. Note that (A) and associated quantifications in (D–E) are from the same dataset shown in Figure 3E and (B) associated quantifications in (D–E) are from the same dataset shown in Figure 3F. Scale bar = 20 µm.
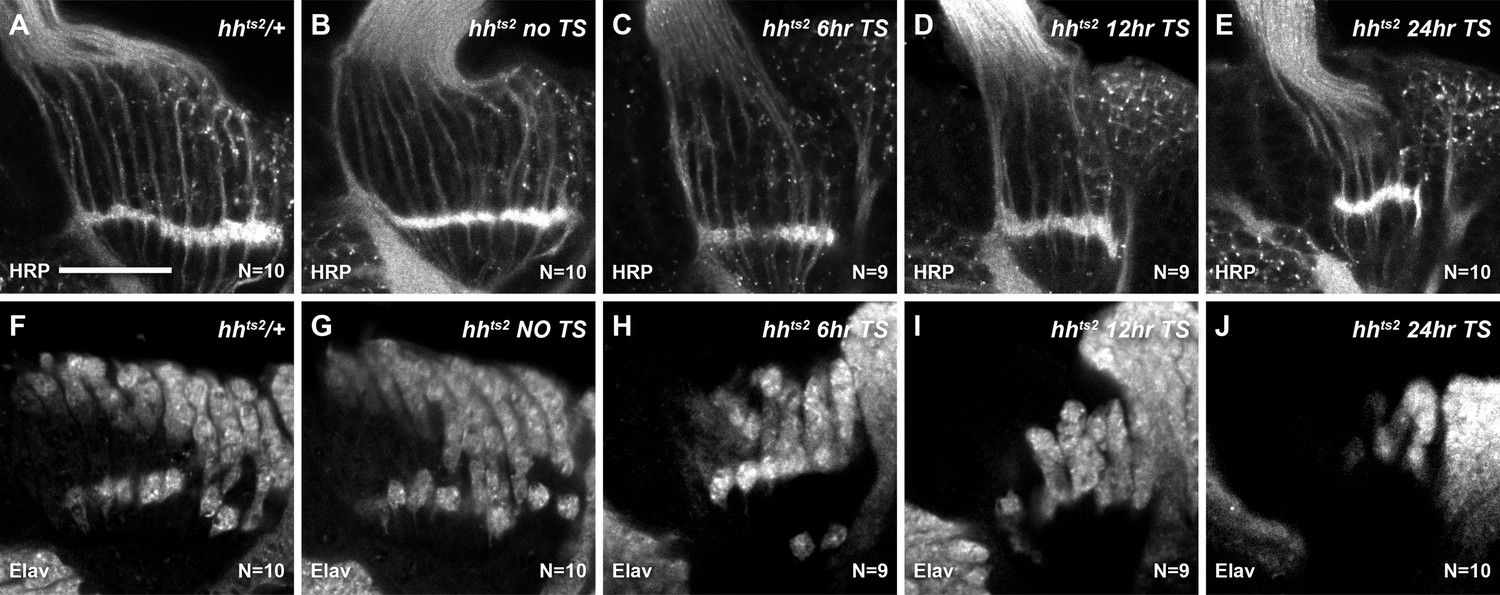
Figure 5 with 1 supplement
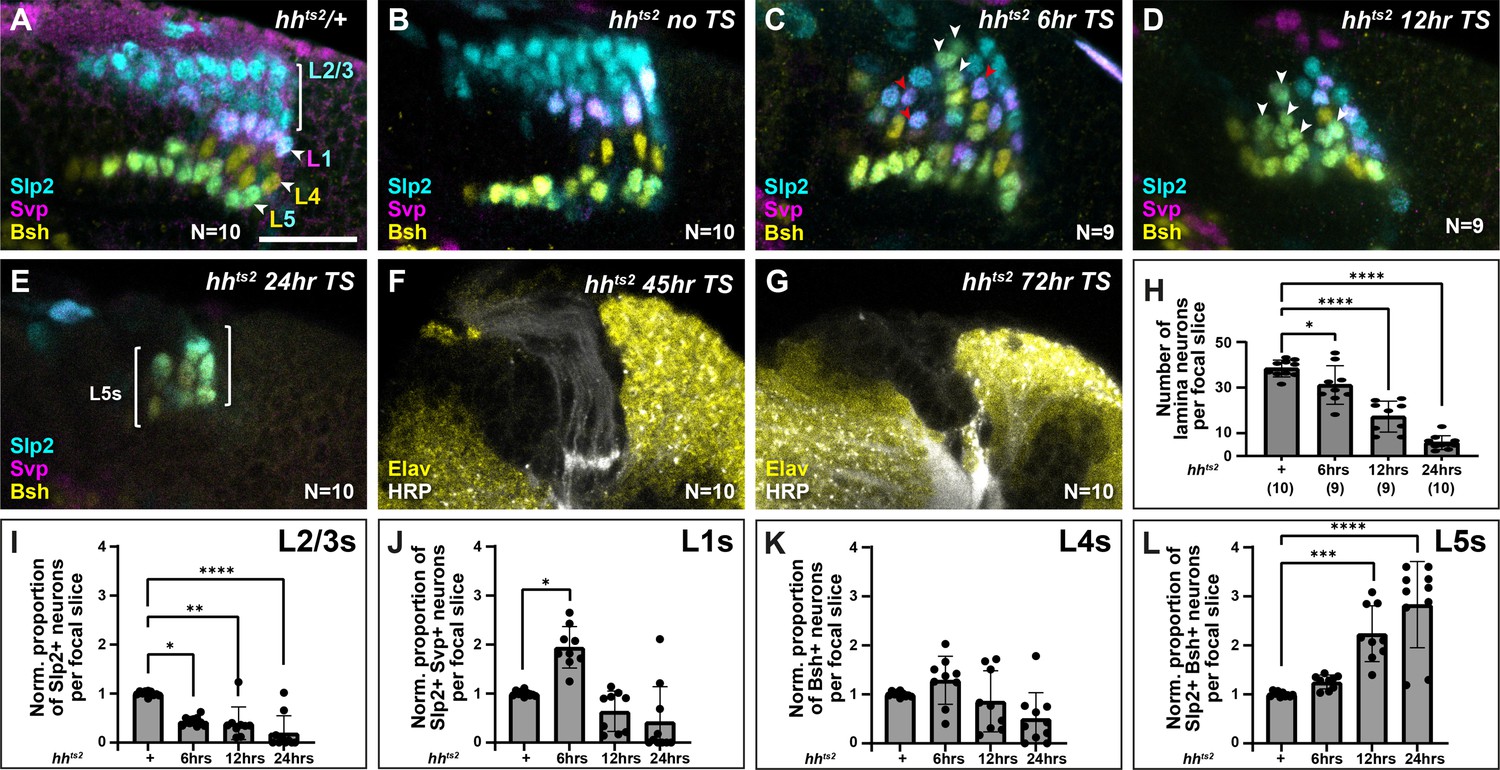
Titrating functional Hedgehog (Hh) availability favours distinct neuronal types at different thresholds.
Laminas labelled with neuron-type-specific markers Sloppy paired 2 (Slp2; cyan), Seven-up (Svp; magenta), and Brain-specific homeobox (Bsh; yellow) in (A) hhts2/+shifted from the permissive temperature (18°C) to the restrictive temperature (29°C) for 24 hr, (B) hhts2 raised at the permissive temperature (no temperature shift [no TS]), (C–G) hhts2 shifted from the permissive temperature to the restrictive temperature for (C) 6 hr, (D) 12 hr, and (E) 24 hr. The pattern of neuronal differentiation worsened progressively with longer TSs, with fewer neurons differentiating overall. Slp2- and Bsh-positive cells (L5s) were observed in the distal lamina (white arrowheads) for 6-hr, 12-hr, and 24-hr TSs, till most cells present differentiated into L5 neurons for the 24-hr TS. Whereas Slp2 and Svp co-expressing cells (L1) increased only for the 6-hr TS and were distributed throughout the distal-proximal axis (red arrowheads). (F and G) hhts2 shifted from the permissive temperature to the restrictive temperature for (F) 45-hr and (G) 72-hr stained for embryonic lethal abnormal vision (Elav; yellow) and horseradish peroxidase (HRP; white). A few photoreceptor bundles are present but no lamina precursor cells (LPCs) formed under the (F) 45-hr TS condition, whereas neither photoreceptors nor LPCs were present for the (G) 72-hr TS condition. (H) Quantification of the total number of lamina neurons (Elav-positive cells) per focal slice in hhts2/+ and hhts2 shifted from the permissive temperature to the restrictive temperature as indicated. Error bars represent SD. Ns indicated in parentheses. (I–L) Quantifications of the proportions of each lamina neuron type per focal slice and normalised to the control for each hhts2 TS condition. One-way ANOVA with Dunn’s multiple comparison test. p*<0.05; p**<0.01; p***<0.001; and p****<0.0001. Error bars represent SD. Scale bar = 20 µm. Figure 5—figure supplement 1.
Figure 5—figure supplement 1
Fewer photoreceptors and lamina neurons develop when functional Hedgehog (Hh) availability is titrated.
(A–E) Photoreceptor axons in the lamina were labelled with horseradish peroxidase (HRP) in the following genotypes and conditions: (A) hhts2/+ shifted from the permissive temperature (18°C) to the restrictive temperature (29°C) for 24 hr, (B) hhts2 raised at the permissive temperature, (C–E) hhts2 shifted from the permissive temperature to the restrictive temperature for (C) 6 hr, (D) 12 hr, and (E) 24 hr (F–J). All neurons were labelled with embryonic lethal abnormal vision (Elav) for the same genotypes as (A–E). The pattern of neuronal differentiation worsened progressively with longer temperature shifts, with fewer neurons differentiating overall. Scale bar = 20 µm.
Figure 6
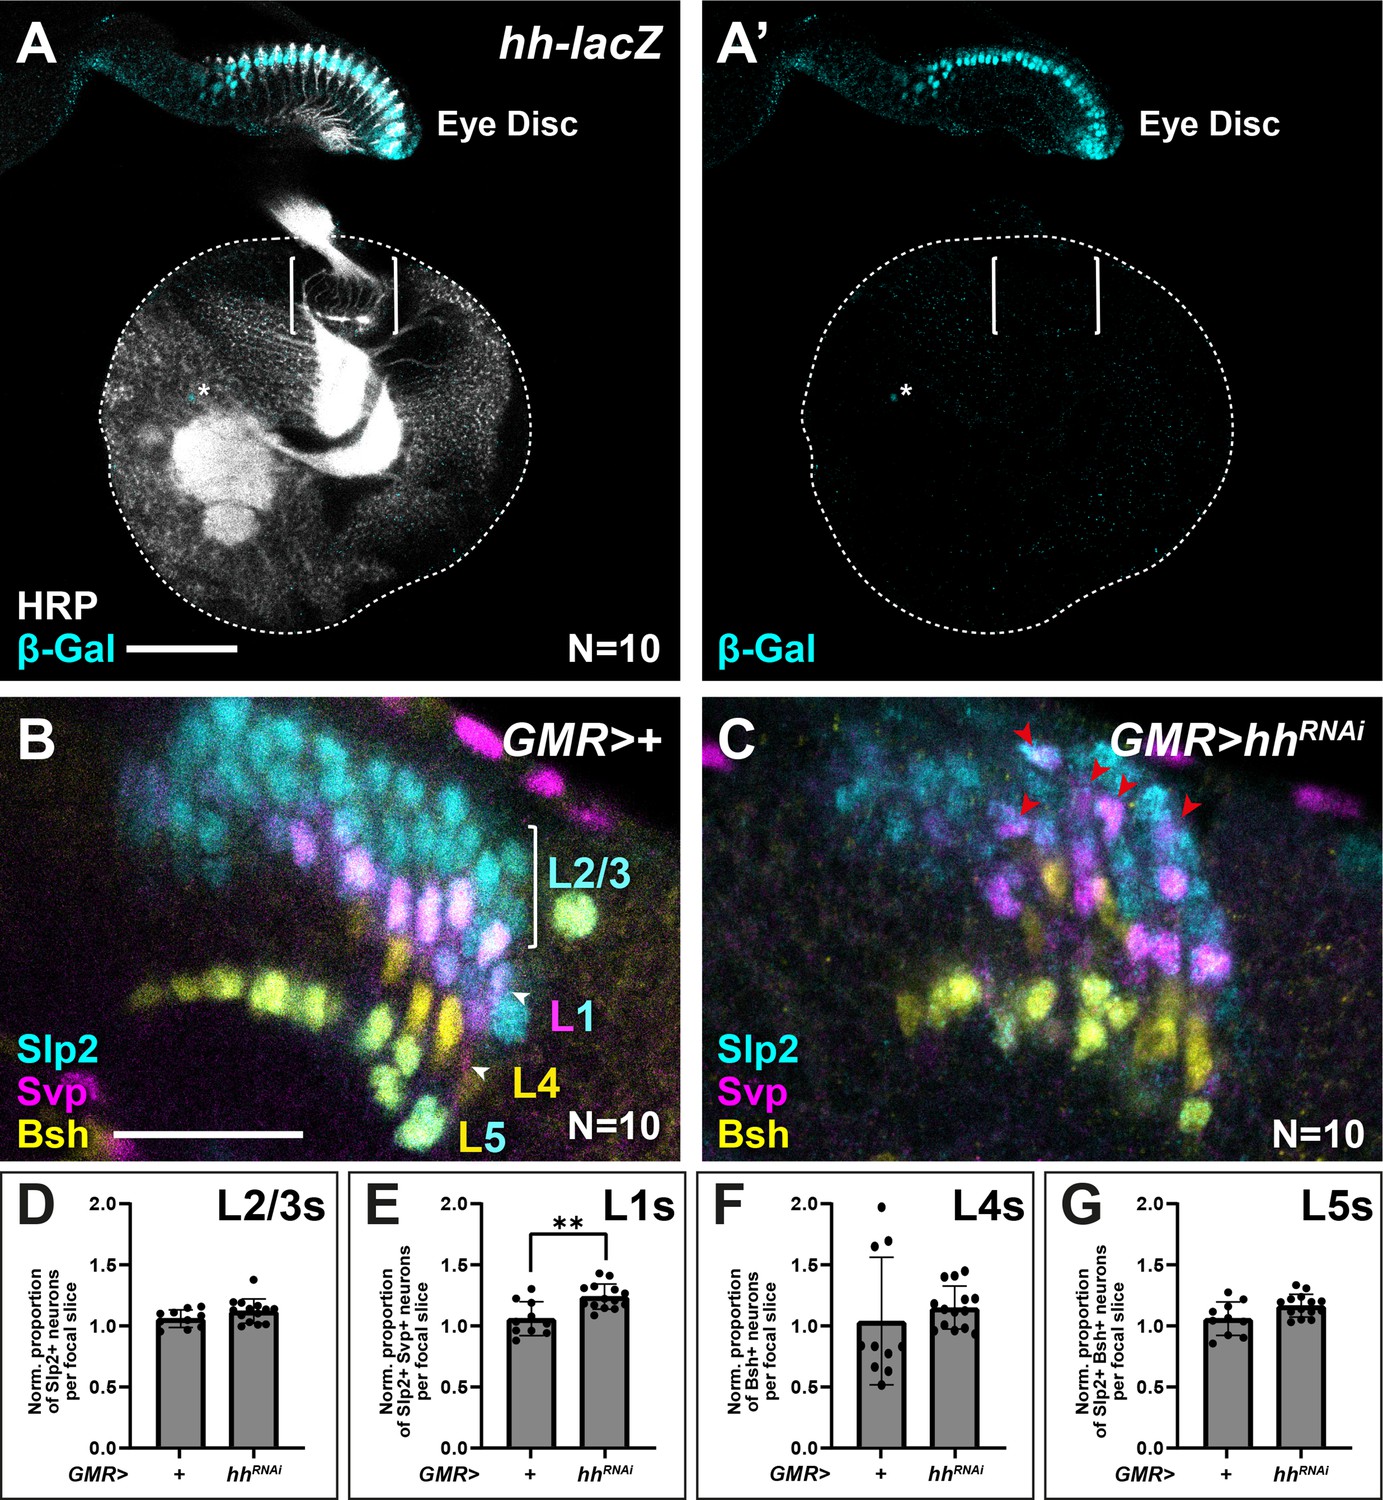
Appropriate lamina neuron patterning requires photoreceptor-derived Hedgehog (Hh).
(A) Expression pattern of hh-lacZ. Only photoreceptors in the eye-disc expressed nuclear β-galactosidase (β-Gal; cyan) along with a few sparse cells near the central brain (asterisk). Horseradish peroxidase (HRP) in white. Brackets mark the lamina. (B–C) Optic lobes from (B) GMR>+ (control) and (C) GMR>hhRNAi labelled with lamina neuron-type-specific markers sloppy paired 2 (Slp2; cyan), brain-specific homeobox (Bsh; yellow), and seven-up (Svp; magenta). (D–G) Quantifications of the proportion of each lamina neuron type relative to controls per focal slice for (D) Slp2-only expressing L2-L3s, (E) Slp2 and Svp co-expressing L1s, (F) Bsh-only expressing L4s, and (G) Bsh and Slp2 co-expressing L5s. One-way ANOVA with Dunn’s multiple comparison test. p*<0.05. Error bars represent SD. Scale bar = 20 μm.
Tables
Key resources table
| Reagent type (species) or resource | Designation | Source or reference | Identifiers | Additional information |
|---|---|---|---|---|
| Genetic reagent (Drosophila melanogaster) | Canton S | Bloomington Drosophila Stock Center | BSDC: 64349 | |
| Genetic reagent (D. melanogaster) | ptc-lacZ | PMID:10769240 | Gift from D Kalderon | |
| Genetic reagent (D. melanogaster) | hh-sfGFP | Bloomington Drosophila Stock Center | BDSC: 86271 | |
| Genetic reagent (D. melanogaster) | FRT42D, ptcS2 | Bloomington Drosophila Stock Center | BDSC: 6332 | |
| Genetic reagent (D. melanogaster) | ey-Gal80 | Bloomington Drosophila Stock Center | BDSC: 35822 | |
| Genetic reagent (D. melanogaster) | Gal80ts | Bloomington Drosophila Stock Center | BDSC: 7108 | |
| Genetic reagent (D. melanogaster) | R27G05-Gal4 | Bloomington Drosophila Stock Center | BDSC: 48073 | |
| Genetic reagent (D. melanogaster) | UAS-CD8::GFP | Bloomington Drosophila Stock Center | BDSC: 32187 | |
| Genetic reagent (D. melanogaster) | UAS-Ci76 | PMID:9215627 | UAS-Cirep | Gift from D J Treisman |
| Genetic reagent (D. melanogaster) | UAS-CiRNAi | Bloomington Drosophila Stock Center | BDSC: 64928 | |
| Genetic reagent (D. melanogaster) | smo3, FRT40A | PMID:9811578 | Gift from D C Boekel | |
| Genetic reagent (D. melanogaster) | hhts2 | Bloomington Drosophila Stock Center | BDSC: 1684 | |
| Genetic reagent (D. melanogaster) | hhP30 | Bloomington Drosophila Stock Center | BDSC: 5530 | |
| Genetic reagent (D. melanogaster) | GMR-Gal4 | Bloomington Drosophila Stock Center | BDSC: 1104 | |
| Genetic reagent (D. melanogaster) | UAS-hhRNAi | Bloomington Drosophila Stock Center | BDSC: 32489 | |
| Genetic reagent (D. melanogaster) | ywhsflp122, tub-gal4, UAS-GFP; FRT40A, Gal80/Cyo | PMID:10197526 | BDSC: 5192 | Gift from F Schweisguth |
| Genetic reagent (D. melanogaster) | ywhsflp122, tub-gal4, UAS-RFP; FRT42D, Gal80/Cyo | PMID:10197526 | BDSC: 9917 | Gift from G Struhl |
| Antibody | anti-Dac2-3 (mouse monoclonal) | Developmental Studies Hybridoma Bank | mAbdac2-3 | 1:20 |
| Antibody | anti-Elav (rat monoclonal) | Developmental Studies Hybridoma Bank | 7E8A10 | 1:100 |
| Antibody | anti-Svp (mouse monoclonal) | Developmental Studies Hybridoma Bank | 6F7 | 1:50 |
| Antibody | anti-Slp2 (guinea pig polyclonal) | PMID:23783517 | C Desplan | 1:100 |
| Antibody | anti-Bsh (rabbit polyclonal) | PMID:33149298 | C Desplan | 1:500 |
| Antibody | anti β-galactosidase (mouse monoclonal) | Promega | #Z3781 | 1:500 |
| Antibody | anti-GFP (chicken polyclonal) | EMD Millipore | GFP-1010 | 1:400 |
| Antibody | anti-Sim (mouse monoclonal) | PMID:16439478 | T Tabata | 1:20; Originally from DSHB, but no longer produced |
| Antibody | anti-RFP (chicken polyclonal) | Rockland | #600-901-379s | 1:500 |
| Antibody | anti-GFP (rabbit polyclonal) | Thermofisher | #A6455 | 1:500 |
| Antibody | AlexaFluor405-conjugated Anti-HRP (goat polyclonal) | Jackson Immunolabs | 123-475-021 | 1:200 |
| Antibody | AlexaFluorCy3- conjugated anti-HRP (goat polyclonal) | Jackson Immunolabs | 11 23-165-021 | 1:200 |
| Antibody | AlexaFluor647- conjugated anti-HRP (goat polyclonal) | Jackson Immunolabs | 123-605-021 | 1:200 |
| Antibody | Anti-rabbit Alexa 647 (goat polyclonal) | Molecular Probes | Cat# A-21244, RRID: AB_2535812 | 1:400 |
| Antibody | Anti-rabbit Alexa 488 (goat polyclonal) | Molecular Probes | Cat# A-11008, RRID: AB_143165 | 1:400 |
| Antibody | Anti-mouse Alexa 647 (goat polyclonal) | Molecular Probes | Cat# A-21235, RRID: AB_2535804 | 1:400 |
| Antibody | Anti-guinea pig Alexa 488 (goat polyclonal) | Molecular Probes | Cat# A-11073, RRID: AB_2534117 | 1:400 |
| Antibody | Anti-chicken Alexa 488 (goat polyclonal) | Molecular Probes | Cat# A-11039, RRID: AB_2534096 | 1:400 |
| Antibody | Anti-rat Alexa 647 (goat polyclonal) | Molecular Probes | Cat# A-21247, RRID: AB_141778 | 1:400 |
| Antibody | Anti-guinea pig Alexa 647 (goat polyclonal) | Molecular Probes | Cat# A-21450, RRID: AB_2535867 | 1:400 |
| Sequence-based reagent | Antisense probe pairs for in situ hybridisation chain reaction (HCR) | This study | DNA Oligos | See Supporting Zip Document 1 |
| Software, algorithm | RStudio, | RStudio | R version 4.0.3 | |
| Other | RDS | PMID:33125872 | NCBI GEO: GSE156455 | 0 hr after puparium formation (APF) and 15 hr APF |
| Other | RDS | PMID:33149298 | NCBI GEO GSE142789 | 12 hr APF and 24 hr APF |
| Other | RDS | PMID:35388222 | NCBI GEO: GSE167266 | |
| Software, algorithm | GraphPad Prism 9 | GraphPad Prism 9 | GraphPad Prism version 9.4.1 | |
| Software, algorithm | Adobe Photoshop | Adobe Photoshop | Adobe Photoshop 2021 | |
| Software, algorithm | Adobe Illustrator | Adobe Illustrator | Adobe Illustrator 2021 | |
| Software, algorithm | Fiji-ImageJ | PMID:22743772 | ||
| Chemical compound, drug | HCR amplification buffer | Molecular Instruments | BAM02224 | |
| Chemical compound, drug | HCR wash buffer | Molecular Instruments | BPW02124 | |
| Chemical compound, drug | HCR hybridisation buffer | Molecular Instruments | BPH02224 | |
| Chemical compound, drug | HCR amplifier B3-H1-546 | Molecular Instruments | S030724 | |
| Chemical compound, drug | HCR amplifier B3-H2-546 | Molecular Instruments | S031024 | |
| Chemical compound, drug | HCR amplifier B3-H1-647 | Molecular Instruments | S040124 | |
| Chemical compound, drug | HCR amplifier B3-H2-647 | Molecular Instruments | S040224 | |
| Chemical compound, drug | Paraformaldehyde | Fisher Scientific | 28908 | 4% solution |
| Chemical compound, drug | DAPI | Sigma | D9542-1MG | (1 µg/mL) |
Additional files
-
Supplementary file 1
Table showing summary statistics of a mixed effects linear model for ptc-lacZ (β-Gal) MFI as a function of distance and cell position (distal-proximal).
- https://cdn.elifesciences.org/articles/78093/elife-78093-supp1-v2.docx
-
Supplementary file 2
Table listing all genotypes and experimental conditions used by figure panel.
(Note that only female genotypes are listed though both sexes were included in our analyses).
- https://cdn.elifesciences.org/articles/78093/elife-78093-supp2-v2.docx
-
Supplementary file 3
Excel file containing all the probe sequences used for in-situ hybridisation chain reaction in this study.
- https://cdn.elifesciences.org/articles/78093/elife-78093-supp3-v2.zip
-
Transparent reporting form
- https://cdn.elifesciences.org/articles/78093/elife-78093-transrepform1-v2.docx
Download links
A two-part list of links to download the article, or parts of the article, in various formats.
Downloads (link to download the article as PDF)
Open citations (links to open the citations from this article in various online reference manager services)
Cite this article (links to download the citations from this article in formats compatible with various reference manager tools)
Photoreceptors generate neuronal diversity in their target field through a Hedgehog morphogen gradient in Drosophila
eLife 11:e78093.
https://doi.org/10.7554/eLife.78093


