Human WDR5 promotes breast cancer growth and metastasis via KMT2-independent translation regulation
- Hillman Cancer Center, University of Pittsburgh Medical Center, United States
- Department of Pathology, Yale University, United States
- Department of Biochemistry and Molecular Biology, Baylor College of Medicine, United States
- Yale Cancer Center, Yale School of Medicine, United States
- Yale Cancer Biology Institute, Department of Pharmacology, Yale University, United States
- Mount Sinai Center for Therapeutics Discovery, Icahn School of Medicine at Mount Sinai, United States
- Departments of Pharmacological Sciences and Oncological Sciences, Tisch Cancer Institute, Icahn School of Medicine at Mount Sinai, United States
- Department of Biosciences, Rice University,, United States
- Department of Pathology, University of Michigan, Ann Arbor, United States
- Department of Medicine, Department of Biochemistry and Molecular Medicine, University of Southern California, United States
- Yale Stem Cell Center, Yale School of Medicine, United States
- Department of Internal Medicine (Section of Medical Oncology), Yale School of Medicine,, United States
- Yale Center for Immuno-Oncology, Yale School of Medicine, United States
Figures
Figure 1 with 1 supplement
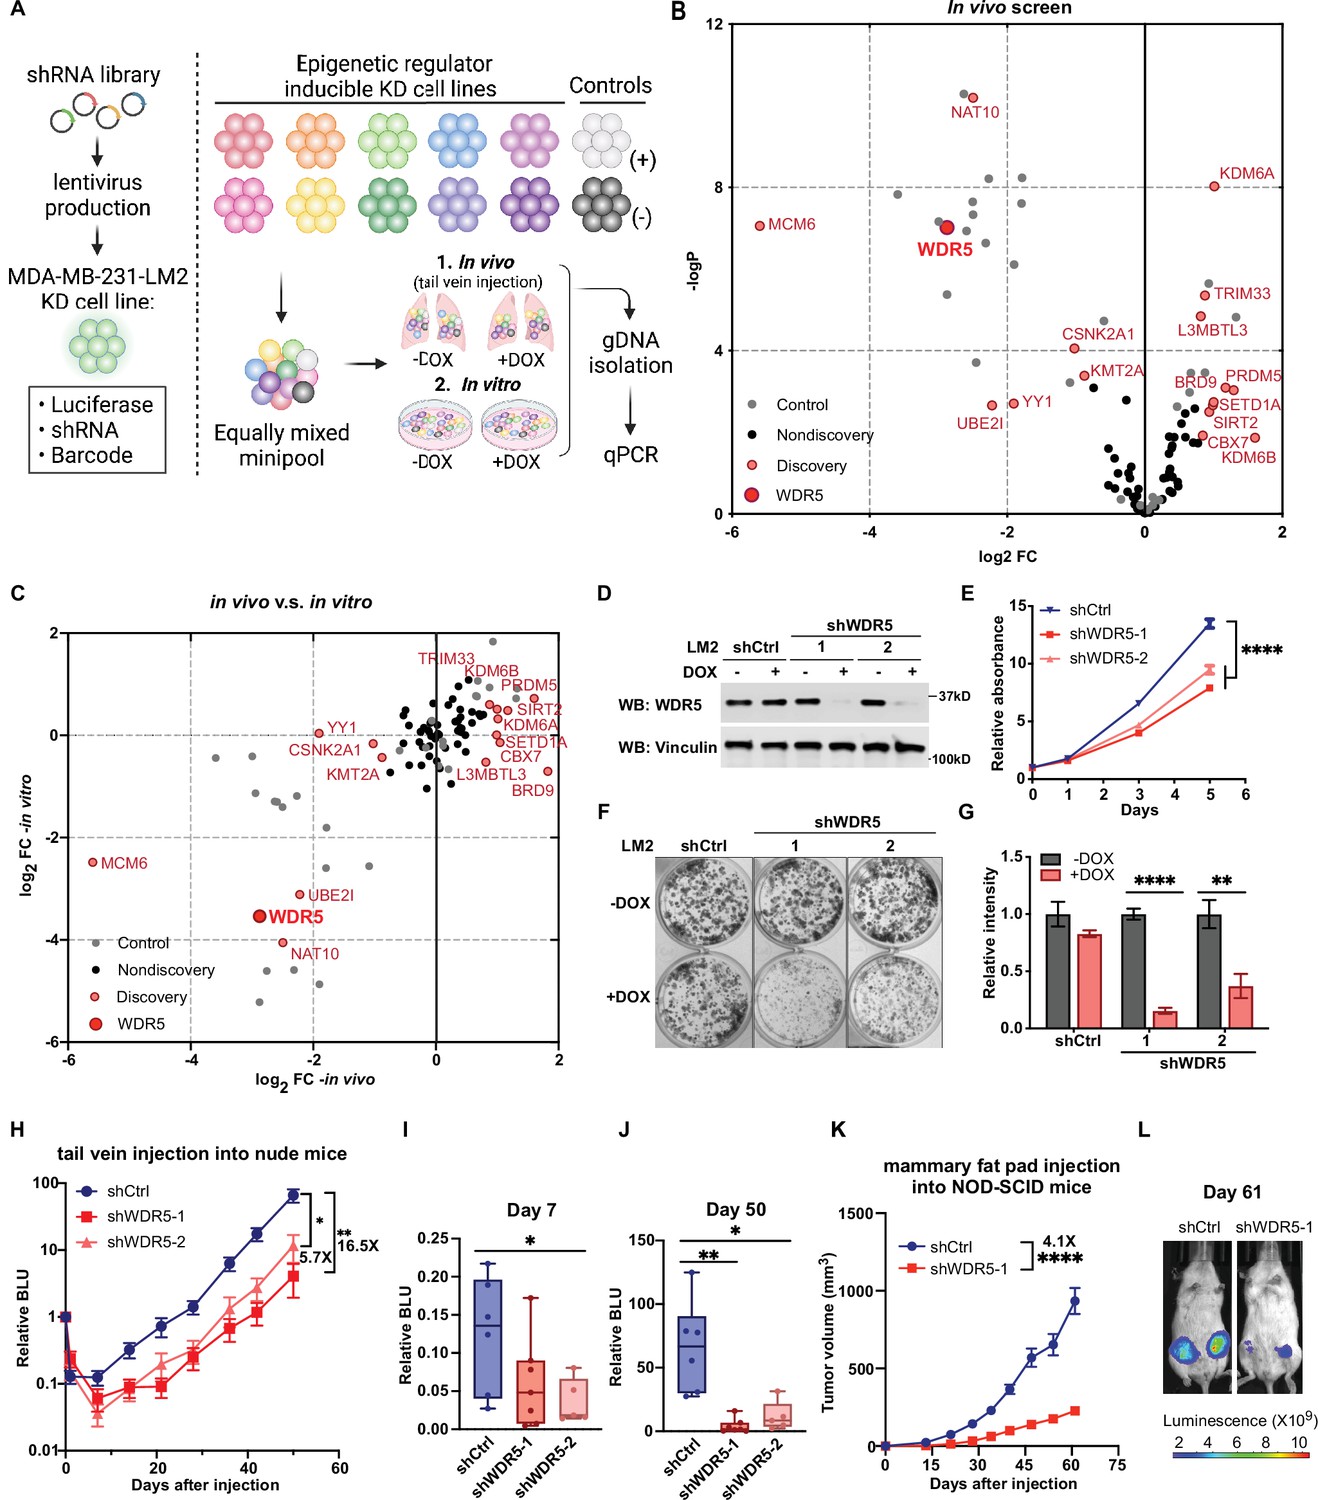
Decreasing WDR5 reduces breast cancer cell growth and lung metastasis.
(A) Schematic of in vivo and in vitro screening work flow. Epigenetic regulator inducible knockdown cell lines were mixed in equal numbers (pool of 8–10 lines) with control cell lines and injected into control or doxycycline (DOX) treated mice (625 mg/kg) intravenously or cultured under control or DOX (1 μg/mL) treated condition. Both lungs (in vivo) and cells (in vitro) were harvested for gDNA and subjected to barcode quantitative PCR as the screening output. (B) Volcano plot showing the results of the in vivo screen. Each data point is an average of 10–20 mice. Discovery hits are selected using p<0.05 and log2FC (fold change)>0.8 or log2FC <−0.8. (C) Log2FC of the in vivo screen results versus log2FC of the in vitro screen results for each of the epigenetic regulators. Discovery hits are selected as in (B). (D) Western blot analysis of the indicated proteins in LM2 cells harboring inducible control (shCtrl) or WDR5 targeting (shWDR5-1 and shWDR5-2) shRNA after 3 days of DOX induction. (E) WST-1 proliferation assays of LM2 cells from (D) after indicated days of DOX treatment. Each symbol indicates mean ± SD for representative experiment performed in quadruplicate (n=4, unpaired two-side Student’s t test). ****p<0.0001 (shCtrl versus shWDR5-1) and ****p<0.0001 (shCtrl versus shWDR5-2). (F–G) Colony formation assays of LM2 cells from (D) after 9 days of either control or DOX treatment. Representative images (F) and quantification (G) are shown (n=3, unpaired two-side Student’s t test). p=0.057 (shCtrl −DOX versus shCtrl +DOX), ****p<0.0001 (shWDR5-1 −DOX versus shWDR5−1 +DOX), and **p=0.0025 (shWDR5-2 −DOX versus shWDR5−2 +DOX). (H) Normalized bioluminescence unit (BLU) signals of lung metastasis of mice injected intravenously with LM2 cells from (D) and kept under DOX chow. The data represent mean ± SEM (shCtrl: n=6; shWDR5-1: n=7; shWDR5-2: n=5). **p=0.0012 (shCtrl versus shWDR5-1) and *p=0.017 (shCtrl versus shWDR5-2). (I–J) Box plots of relative BLU of indicated cell line at day 7 (I), p=0.1375 (shCtrl versus shWDR5-1), *p=0.0173 (shCtrl versus shWDR5-2), and day 50 (J), **p=0.0012 (shCtrl versus shWDR5-1), *p=0.017 (shCtrl versus shWDR5-2), post-injection normalized to its day 0 value. (K) Tumor volume measurements of mice injected into the fourth mammary fat pad with LM2 cells harboring inducible control or shWDR5-1. The data represent mean ± SEM. ****p<0.0001 (shCtrl versus shWDR5-1). (L) Representative BLU images of mice in (K) at day 61. Significance determined using unpaired two-tailed Mann–Whitney test (shCtrl: n=14; shWDR5-1: n=13). *p<0.05; **p<0.01; ***p<0.001; ****p<0.0001. For gel source data, see Figure 1—source data 1.
-
Figure 1—source data 1
Original western blots for Figure 1D.
- https://cdn.elifesciences.org/articles/78163/elife-78163-fig1-data1-v2.zip
Figure 1—figure supplement 1
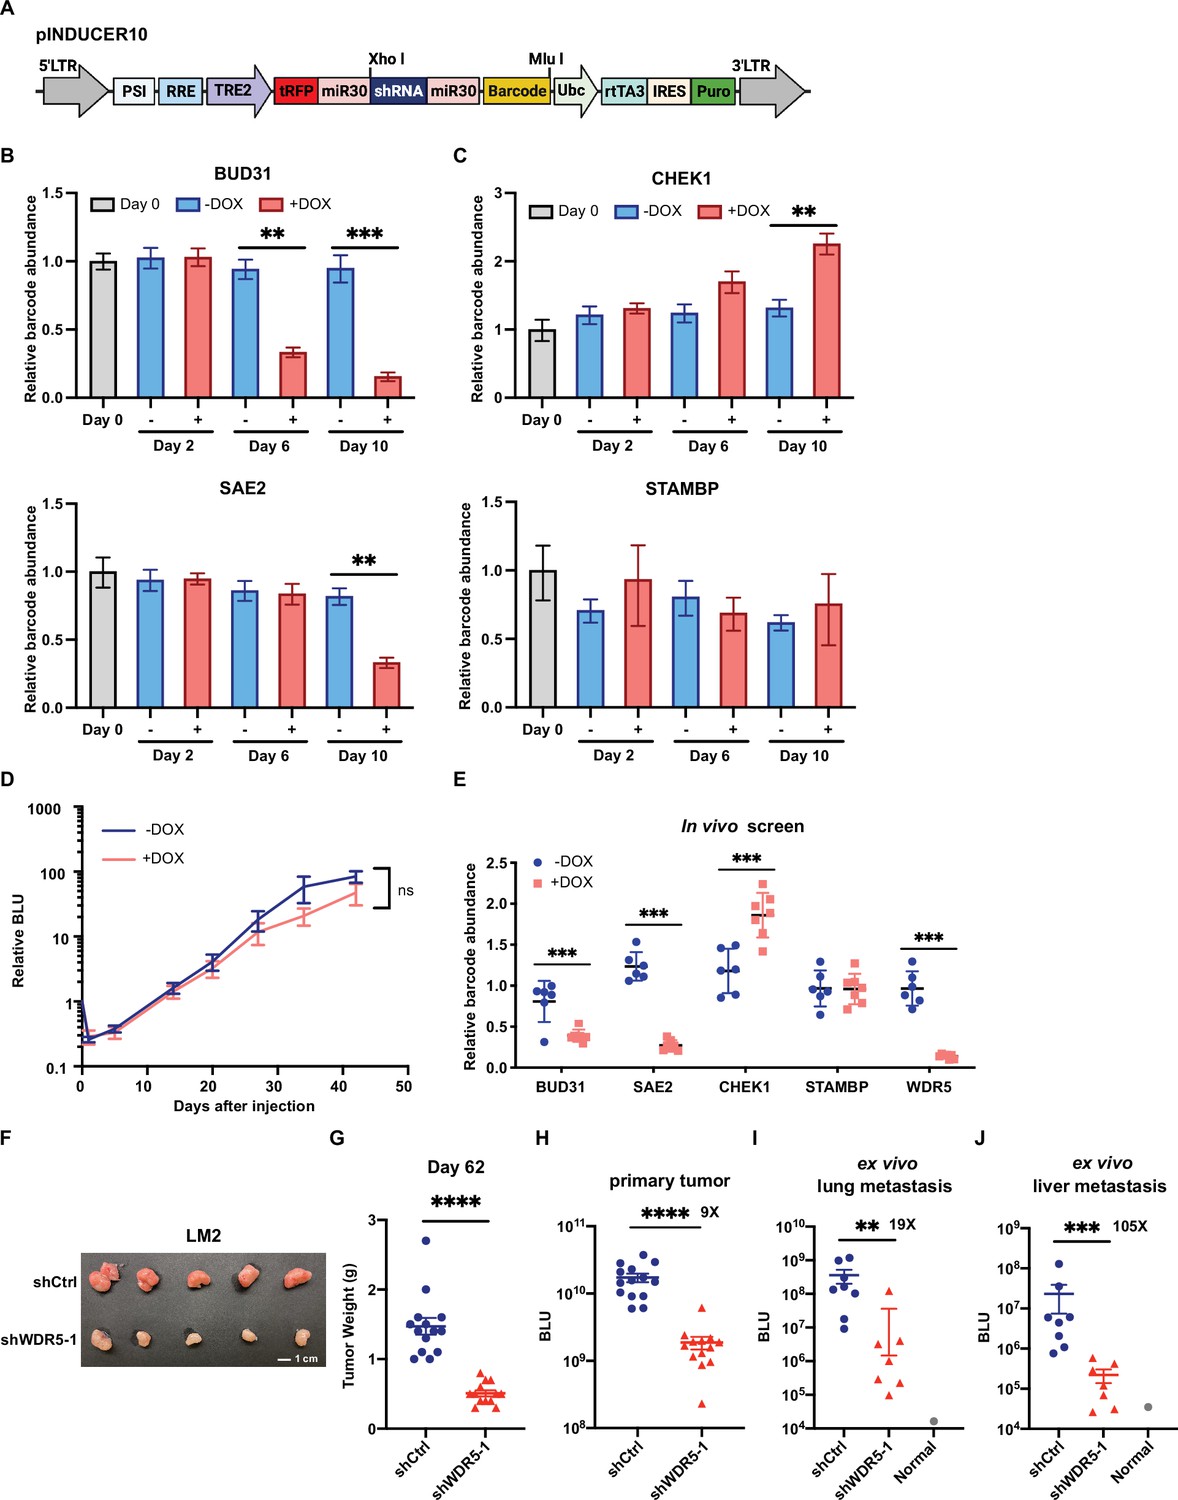
In vitro and in vivo distribution of positive control shRNAs and negative control shRNAs in pooled screens.
(A) Schematic representation of the pINDUCER10 plasmid. LTR, long terminal repeat; PSI, retroviral Ψ packaging element; RRE, Rev response element; TRE2, TRE2 promoter; Ubc, ubiquitin C promoter; rtTA3, reverse tetracycline-controlled transactivator 3; IRES, internal ribosome entry site; Puro, puromycin resistance. (B–C) Relative abundance of cells stably expressing positive control shRNAs against BUD31 and SAE2 (B) and negative control shRNAs against CHEK1 and STAMBP (C) after the indicated days of in vitro culture under control or doxycycline (DOX) (1 μg/mL) treatment. Data normalized to abundance at the time of minipool mixture (day 0). Representative data are shown from one minipool experiment (n=4, unpaired two-side Student’s t test). (D) Representative data of lung metastasis signal from mice injected with a minipool and fed with either DOX (625 mg/kg) or regular chow at the indicated time point. ns, not significant. (E) Relative abundance of barcode for shRNA against WDR5 and positive/negative controls in lung tissue from control and DOX-treated mice. (F) Representative image of primary tumor from mice injected into the fourth mammary fat pad with LM2 cells harboring inducible control or shWDR5-1 at day 62. (G) Quantification of primary tumor weight from mice in (F) at day 62. Each dot represents one tumor. (H) Relative bioluminescence units (BLU) of the primary tumors from mice in (F) at day 61 post-injection (shCtrl: n=14; shWDR5: n=13). (I–J) Quantification of ex vivo BLU signals of the lungs (I) and liver (J) from mice in (F) at day 62 post-injection. Each dot represents one animal (shCtrl: n=8; shWDR5: n=7). Significance determined using unpaired two-tailed Mann–Whitney test. *p<0.05; **p<0.001; ***p<0.001; ****p<0.0001.
Figure 2 with 1 supplement
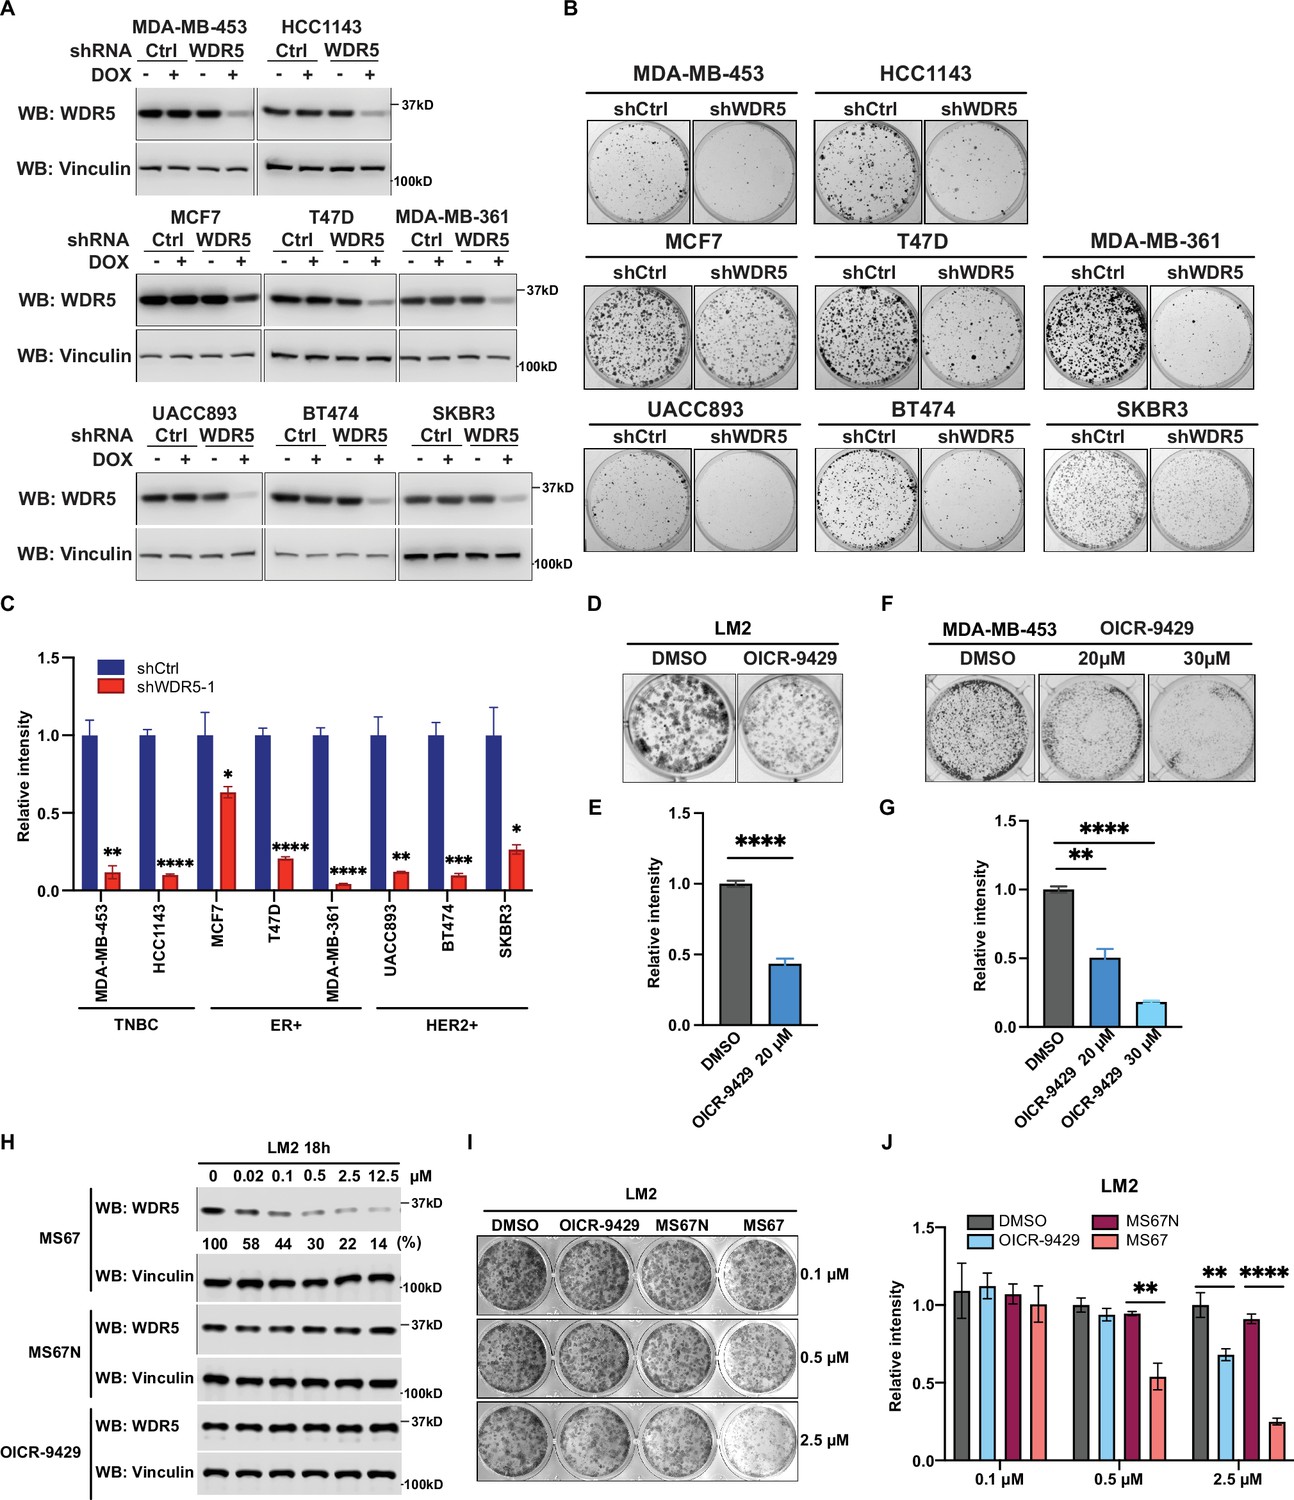
WDR5 targeting significantly reduces breast cancer cell growth across breast cancer subtypes.
(A) Western blot analyses of WDR5 in the indicated cell lines infected with either control or WDR5-targeting hairpins with or without 3 days of doxycycline (DOX) (1 μg/mL) induction. (B–C) Colony formation assays of indicated control or shWDR5-1 cell lines from (A) after 9 days of DOX (1 μg/mL) treatment. Representative images (B) and quantification (C) are shown (n=3, unpaired two-side Student’s t test). **pMDA-MB-453=0.0011, ****pHCC1143 <0.0001, *pMCF7=0.0263, ****pT47D<0.0001, ****pMDA-MB-361<0.0001, **pUACC893=0.0017, ***pBT474=0.0004, and *pSKBR3=0.0156. Cell lines are grouped by breast cancer molecular subtype. (D–G) Colony formation assays of LM2 (D) and MDA-MB-453 (F) after 9 days of either control or OICR-9429 treatment at the indicated concentration. Representative images (D and F) and quantification (E and G) are shown (n=3, unpaired two-side Student’s t test). ****pLM2 <0.0001 (dimethyl sulfoxide (DMSO) versus OICR-9429 20 μM), **pMDA-MB-453=0.0018 (DMSO versus OICR-9429 20 μM), and ****pMDA-MB-453<0.0001 (DMSO versus OICR-9429 30 μM). (H) Western blot analysis of WDR5 in LM2 cells treated with MS67, MS67N, or OICR-9429 at the indicated concentrations for 18 hr. Band intensities of WDR5 were quantified by image J and normalized by those of vinculin control. (I–J) Colony formation assays of LM2 after 9 days of treatment with control, OICR-9429, MS67N, or MS67 at the indicated concentrations. Representative images (I) and quantification (J) are shown (n=3, unpaired two-side Student’s t test). **p0.5μM=0.0012 (MS67N versus MS67), **p2.5μM = 0.0033 (DMSO versus OICR-9429), and ****p2.5μM <0.0001 (MS67N versus MS67). For gel source data, see Figure 2—source data 1 and Figure 2—source data 2.
-
Figure 2—source data 1
Original western blots for Figure 2A.
- https://cdn.elifesciences.org/articles/78163/elife-78163-fig2-data1-v2.zip
-
Figure 2—source data 2
Original western blots for Figure 2H.
- https://cdn.elifesciences.org/articles/78163/elife-78163-fig2-data2-v2.zip
Figure 2—figure supplement 1
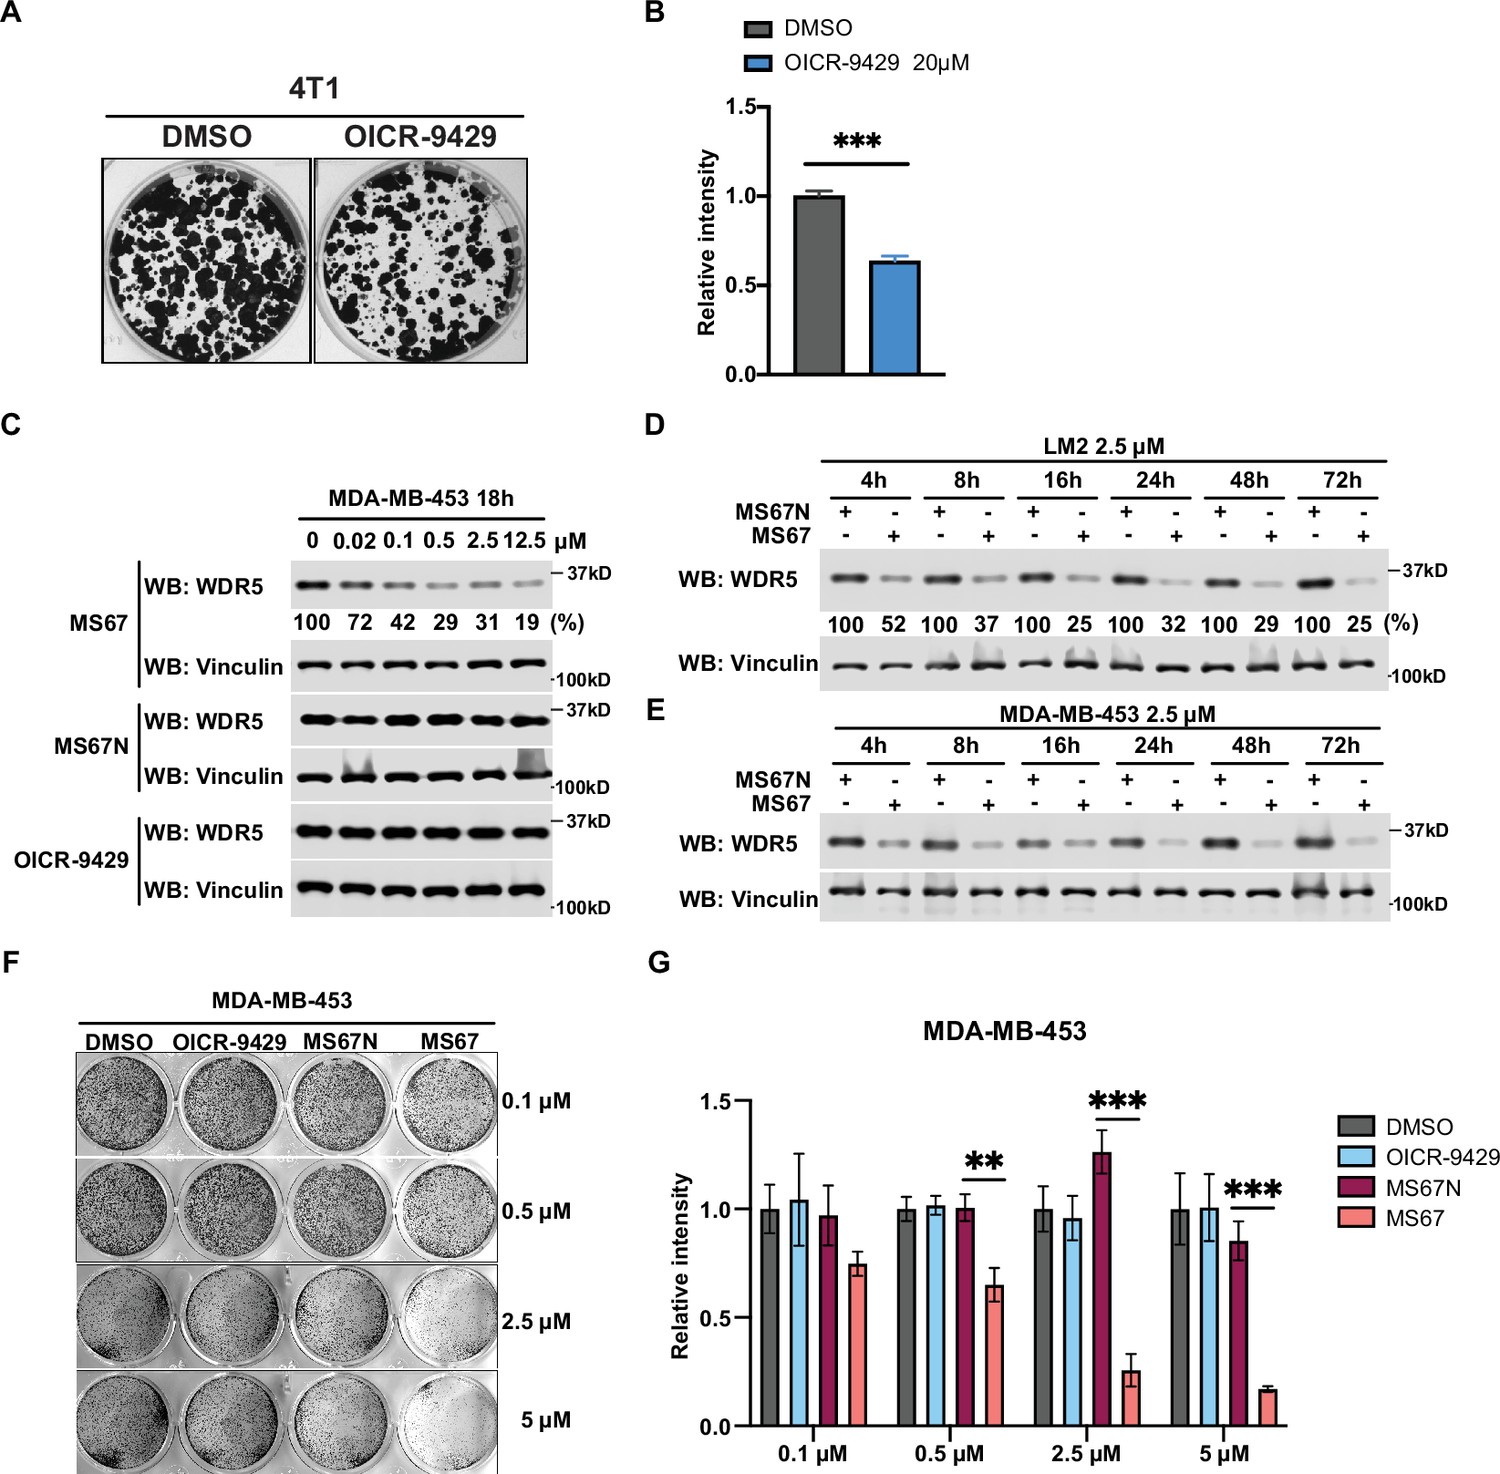
WDR5 inhibition and MS67-mediated WDR5 degradation significantly reduces breast cancer cell growth.
(A–B) Colony formation assays of 4T1 after 9 days of either control or 20 μM OICR-9429 treatment for 9 days. Representative images (A) and quantification (B) are shown (n=3, unpaired two-side Student’s t test). (C) Western blot analysis of WDR5 in MDA-MB-453 treated with MS67, MS67N, or OICR-9429 at the indicated concentrations for 18 hr. Band intensities were quantified by image J. (D–E) Western blot analysis of WDR5 in LM2 (D) or MDA-MB-453 (E) treated with 2.5 μM MS67 or MS67N for the indicated durations. Band intensities were quantified by image J and normalized by the those of vinculin control. (F–G) Colony formation assays of MDA-MB-453 after 9 days of treatment with control, OICR-9429, MS67N, or MS67 at the indicated concentrations. Representative images (F) and quantification (G) are shown (n=3, unpaired two-side Student’s t test). *p<0.05; **p<0.001; ***p<0.001; ****p<0.0001. For gel source data, see Figure 2—figure supplement 1—source data 1, Figure 2—figure supplement 1—source data 2 and Figure 2—figure supplement 1—source data 3.
-
Figure 2—figure supplement 1—source data 1
Original western blots for Figure 2—figure supplement 1C.
- https://cdn.elifesciences.org/articles/78163/elife-78163-fig2-figsupp1-data1-v2.zip
-
Figure 2—figure supplement 1—source data 2
Original western blots for Figure 2—figure supplement 1D.
- https://cdn.elifesciences.org/articles/78163/elife-78163-fig2-figsupp1-data2-v2.zip
-
Figure 2—figure supplement 1—source data 3
Original western blots for Figure 2—figure supplement 1E.
- https://cdn.elifesciences.org/articles/78163/elife-78163-fig2-figsupp1-data3-v2.zip
Figure 3 with 1 supplement
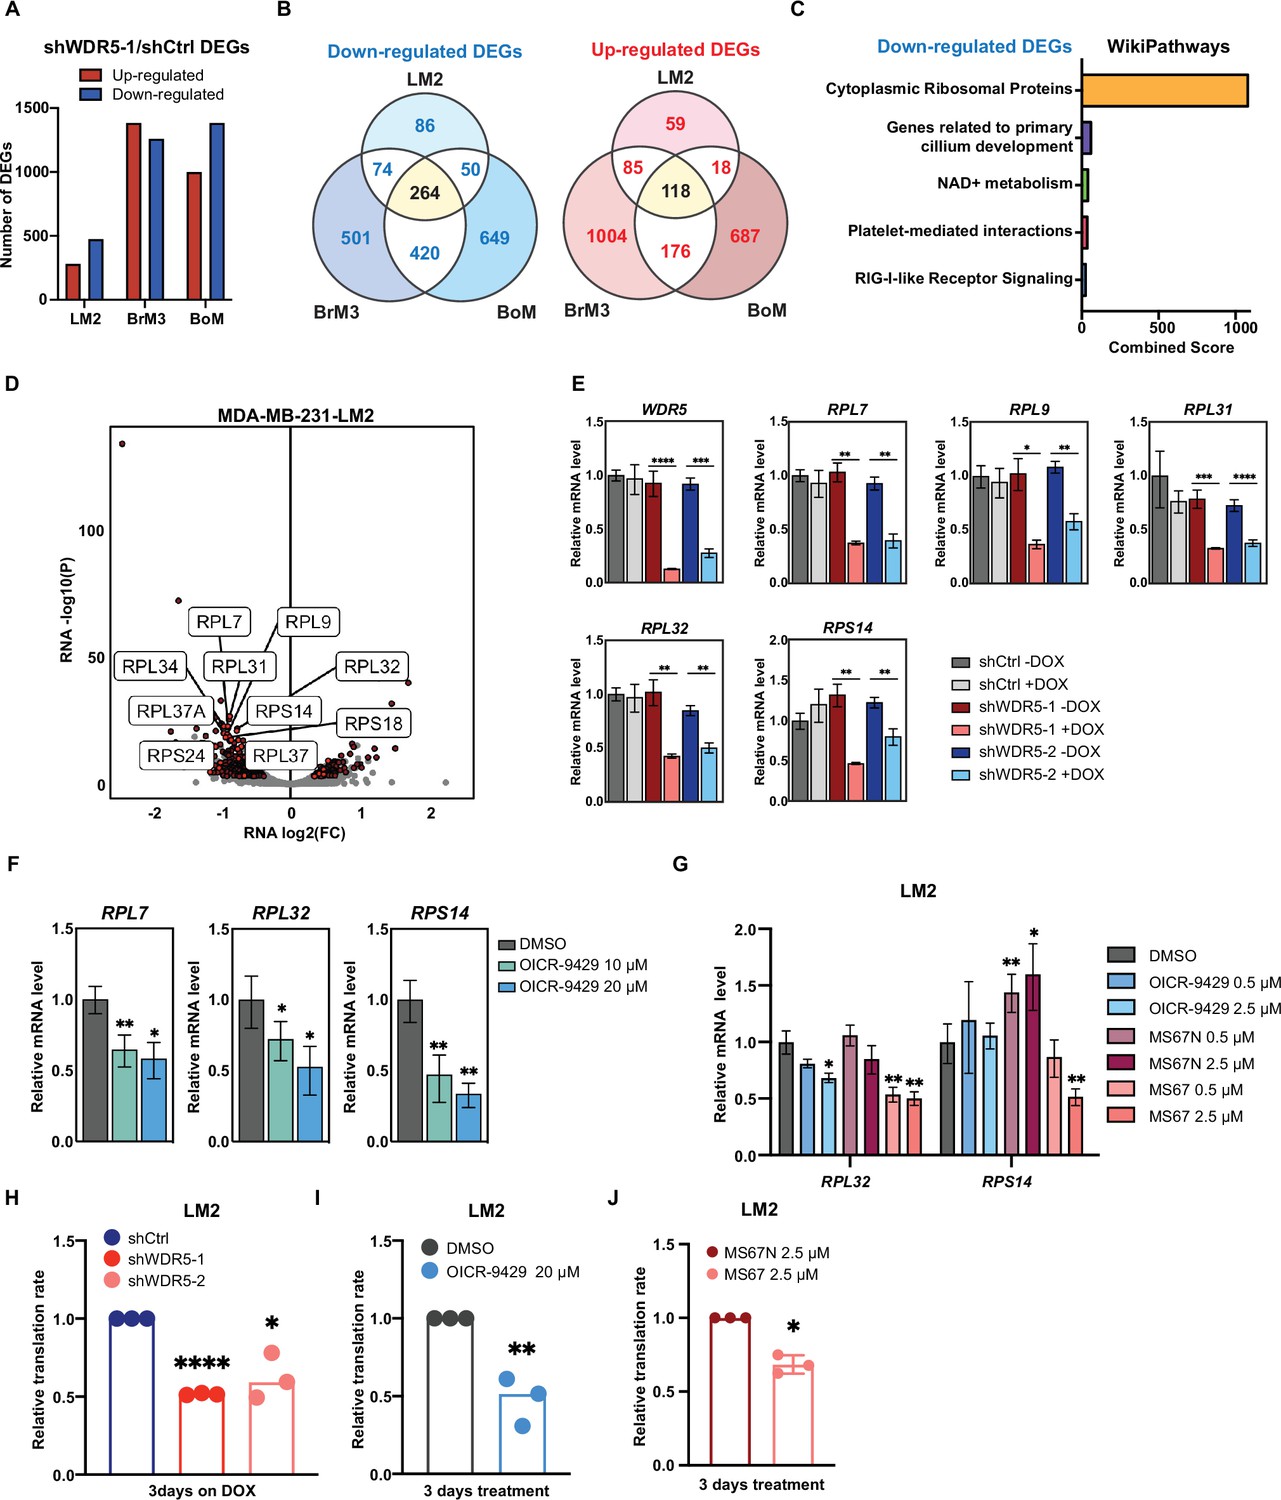
WDR5 targeting decreases ribosomal protein (RP) gene expression and global translation rates.
(A) Bar graph summarizing the number of differentially expressed genes (DEGs) after WDR5 silencing across three MDA-MB-231 organotropic sublines (LM2-lung; BrM3-brain; BoM-bone). (B) Venn diagram showing the number of overlap or distinct down-regulated genes (left) and up-regulated genes (right) after WDR5 knockdown in the MDA-MB-231 organotropic sublines. (C) Gene ontology results using the down-regulated gene set shared by all three MDA-MB-231 organotropic sublines analyzed with Enrichr. (D) Volcano plot of DEGs after WDR5 knockdown in LM2. Shared DEGs across all lines highlighted in dark red and RP genes highlighted in light red. The top 10 differentially expressed RPs are labeled. (E) RT-quantitative PCR (qPCR) validation of selected DEGs in LM2 cells harboring shCtrl, shWDR5-1, or shWDR5-2 after doxycycline (DOX) (1 μg/mL) induction for 3 days. For WDR5, ****p<0.0001 (shWDR5-1 −DOX versus +DOX) and ***p=0.0002 (shWDR5-2 −DOX versus +DOX); for RPL7, **p=0.0014 (shWDR5-1 −DOX versus +DOX), and **p=0.0012 (shWDR5-2 −DOX versus +DOX); for RPL9, *p=0.0106 (shWDR5-1 −DOX versus +DOX) and **p=0.0024 (shWDR5-2 -DOX versus +DOX); for RPL31, ***p=0.0007 (shWDR5-1 −DOX versus +DOX) and ****p<0.0001 (shWDR5-2 −DOX versus +DOX); for RPL32, **p=0.0016 (shWDR5-1 −DOX versus +DOX) and **p=0.0018 (shWDR5-2 −DOX versus +DOX); for RPS14, **p=0.0015 (shWDR5-1 −DOX versus +DOX) and **p=0.0084 (shWDR5-2 −DOX versus +DOX). (F) RT-qPCR validation of selected DEGs in LM2 cells after DMSO or OICR-9429 treatments at the indicated concentration for 3 days. For RPL7, **p=0.0068 (DMSO versus OICR-9429 10 μM) and *p=0.0138 (DMSO versus OICR-9429 20 μM); for RPL32, *p0.0268 (DMSO versus OICR-9429 10 μM) and *p=0.0106 (DMSO versus OICR-9429 20 μM); for RPS14, **p=0.0032 (DMSO versus OICR-9429 10 μM) and **p=0.0024 (DMSO versus OICR-9429 20 μM). (G) RT-qPCR validation of selected DEGs in LM2 cells after DMSO, OICR-9429, MS67N, or MS67 treatments at the indicated concentration for 48 hr. Significance determined by comparing each treatment to DMSO control (n=4, unpaired two-side Student’s t test). For RPL32, *p=0.0171 (DMSO versus OICR-9429 2.5 μM), **p=0.0056 (DMSO versus MS67 0.5 μM), and **p=0.0031 (DMSO versus MS67 2.5 μM); for RPS14, **p=0.0068 (DMSO versus MS67N 0.5 μM), *p=0.0303 (DMSO versus MS67N 2.5 μM), and **p=0.0033 (DMSO versus MS67 2.5 μM). (H–J) Normalized translation rates as measured by incorporation of methionine analog homopropargylglycine (HPG) over time and evaluated by flow cytometry. Each data point represents the slope of HPG incorporation for at least three time points using median fluorescence intensity from an independent experiment. LM2 cells from (E) following 3 days of DOX (1 μg/mL) induction (H), ****pshWDR5-1<0.0001, *pshWDR5-2=0.0230, LM2 cells following 3 days of control or OICR-9429 treatment at 20 μM (I), **p=0.0043, and LM2 cells following 3 days of MS67N or MS67 treatment at 2.5 μM (J), *p=0.0128, were tested. (n=3, one sample t test). *p<0.05; **p<0.01; ***p<0.001; ****p<0.0001.
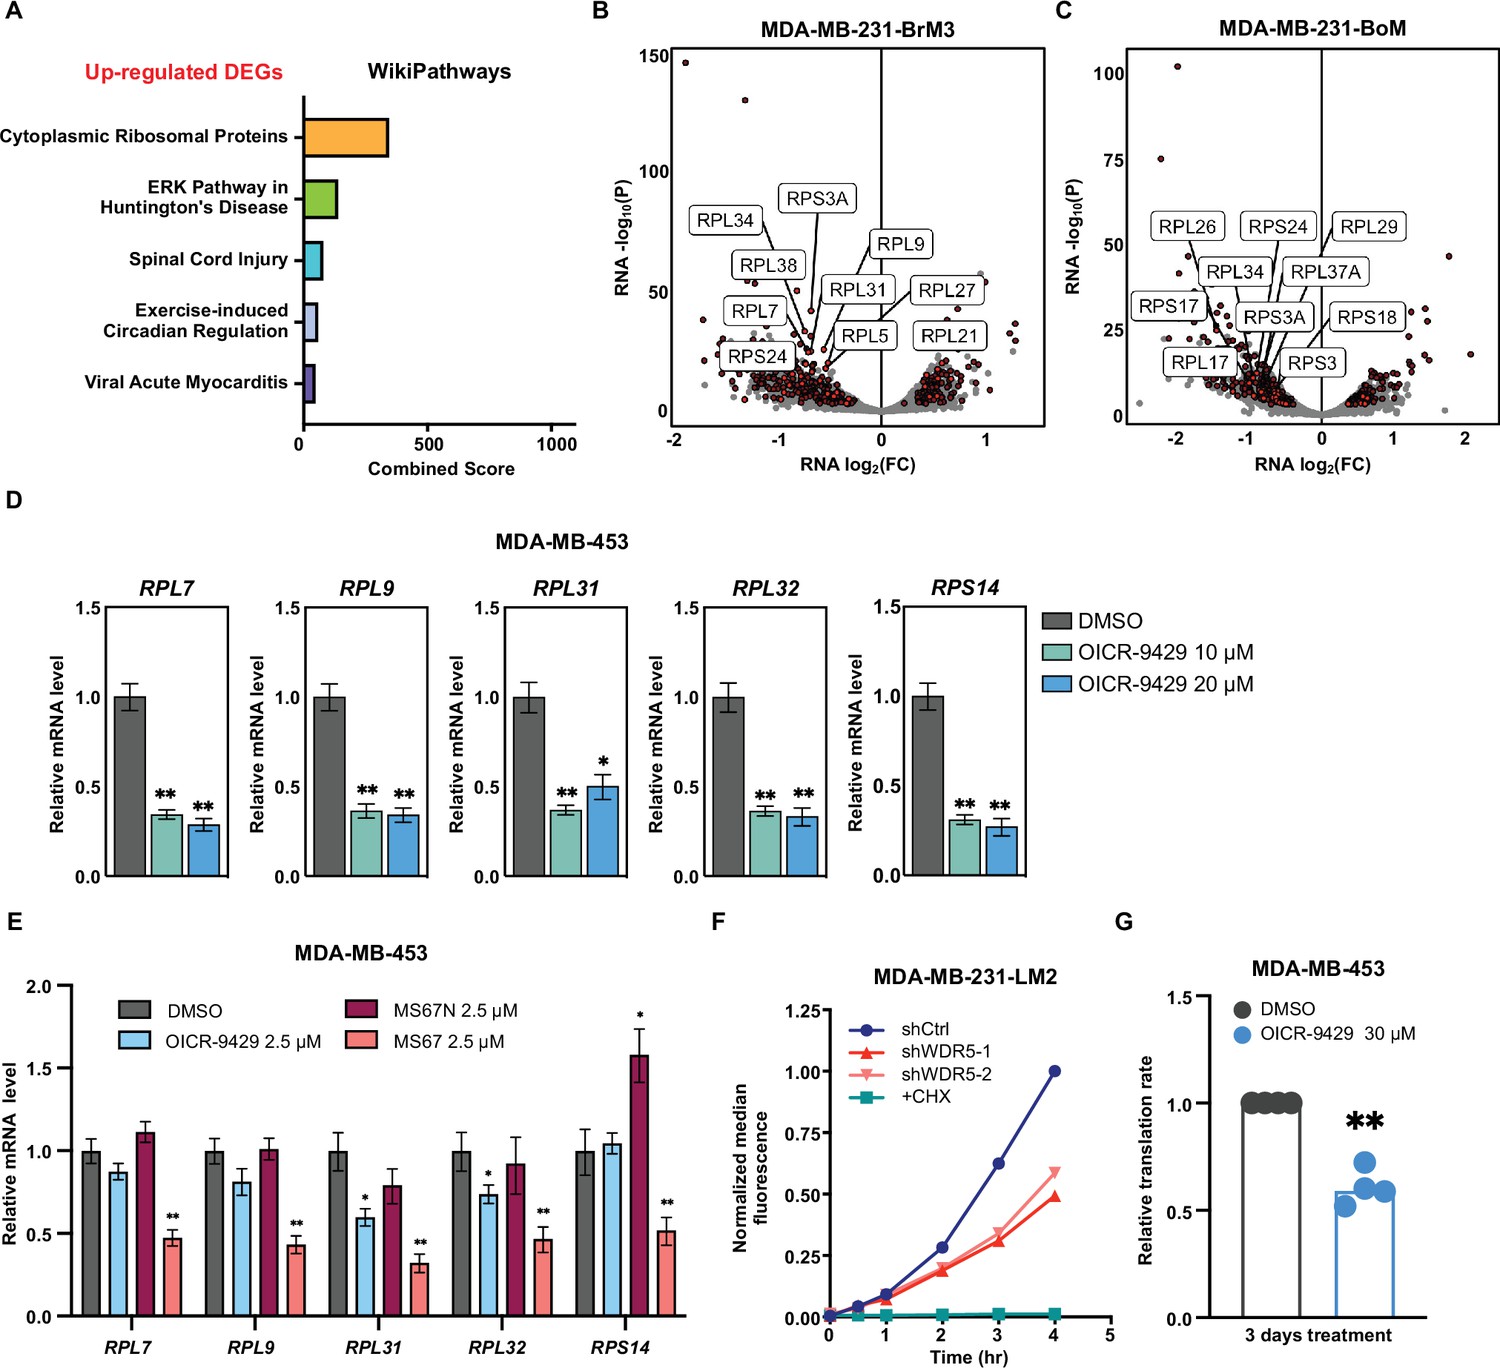
Figure 3—figure supplement 1
WDR5 targeting decreases ribosomal protein (RP) gene expression and global translation rates.
(A) Gene ontology results using the up-regulated gene set shared by three MDA-MB-231 organotropic sublines analyzed with Enrichr. (B–C) Volcano plot of genes differentially expressed after WDR5 knockdown in BrM3 (B) and BoM (C). Shared differentially expressed genes (DEGs) across all lines highlighted in dark red and RPs (RPL and RPS) highlighted in light red. The top 10 differentially expressed RPs are labeled. (D) RT-quantitative PCR (qPCR) validation of selected DEGs in MDA-MB-453 cells after control or OICR-9429 treatments at the indicated concentrations for 3 days. (E) RT-qPCR validation of selected DEGs in MDA-MB-453 cells after DMSO, 2.5 μM OICR-9429, MS67N, or MS67 treatment for 3 days. Significance determined by comparing each treatment to DMSO control (n=4, unpaired two-side Student’s t test). (F) Representative translation efficiency overtime using the indicated LM2 cell lines with continuous treatment of DOX (1 μg/mL). 100 μg/mL cycloheximide (CHX) was used as a control to completely block de novo protein translation. (G) Normalized translation rates of MDA-MB-453 cells following 3 days of control or 30 μM OICR-9429 treatment (n=4, one sample t test). Significance determined using one sample t test. *p<0.05; **p<0.001; ***p<0.001; ****p<0.0001.
Figure 4 with 1 supplement
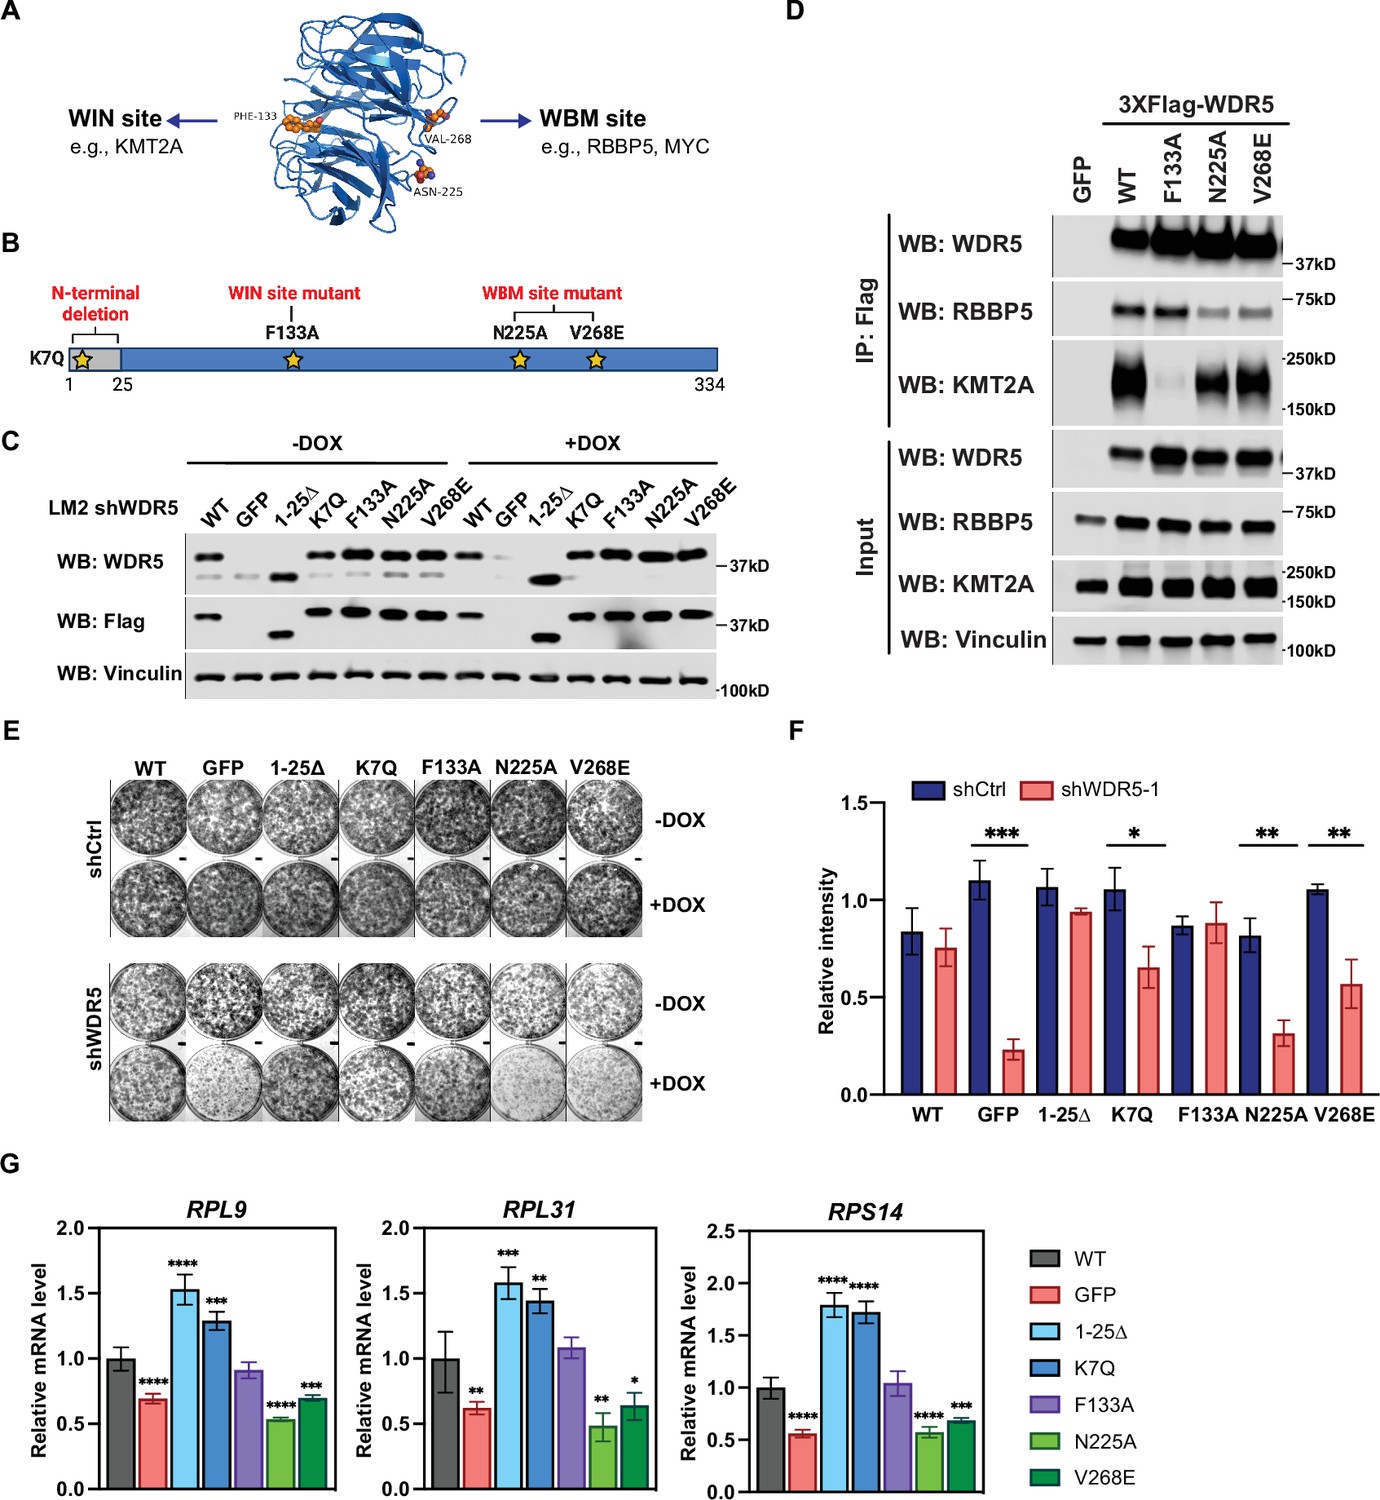
The WBM-binding sites are required for WDR5-dependent cell growth and ribosomal protein gene expression.
(A) WDR5 protein structure and key residues in the WIN and WBM sites that interact with binding partners. (B) Schematic of WDR5 with the indicated mutation sites. (C) Western blot analysis of the indicated proteins in LM2 inducible shWDR5 cells over-expressing wild-type (WT) WDR5 or WDR5 mutants. Cells were collected after 3 days of control or doxycycline (DOX) (1 μg/mL) induction. (D) Western blot analysis of the indicated proteins after immunoprecipitation using anti-Flag antibody in the LM2 shWDR5 cells over-expressing green fluorescent protein (GFP), WT WDR5, or WDR5 mutants. (E–F) Colony formation assays of cells expressing GFP, WT WDR5, or WDR5 mutants in inducible shControl (shCtrl) or shWDR5 cell lines after 9 days of control or DOX treatment. Representative images (E) and quantification (F) are shown. DOX-treated wells were compared to their respective controls for each cell line (n=3, unpaired two-side Student’s t test). pWT = 0.4047, ***pGFP = 0.0002, p1-25Δ=0.0854, *pK7Q=0.0104, pF133A=0.8448, **pN225A=0.0014, and **pV268E=0.0027. (G) RT-quantitative PCR analysis of the indicated mRNAs in LM2 from (E) induced with DOX (1 μg/mL) for 3 days. Significance determined by comparing each treatment to WT control (n=4, unpaired two-side Student’s t test). For RPL9, ****pGFP <0.0001, ****p1-25Δ<0.0001, ***pK7Q=0.0002, ****pN225A<0.0001, and ***pV268E=0.0006; for RPL31, **pGFP = 0.0045, ***p1-25Δ=0.0007, **pK7Q=0.0027, **pN225A=0.0027, and *pV268E=0.0307; for RPS14, ****pGFP <0.0001, ****p1-25Δ<0.0001, ****pK7Q<0.0001, ****pN225A<0.0001, and ***pV268E=0.0005. For gel source data, see Figure 4—source data 1 and Figure 4—source data 2.
-
Figure 4—source data 1
Original western blots for Figure 4C.
- https://cdn.elifesciences.org/articles/78163/elife-78163-fig4-data1-v2.zip
-
Figure 4—source data 2
Original western blots for Figure 4D.
- https://cdn.elifesciences.org/articles/78163/elife-78163-fig4-data2-v2.zip
Figure 4—figure supplement 1
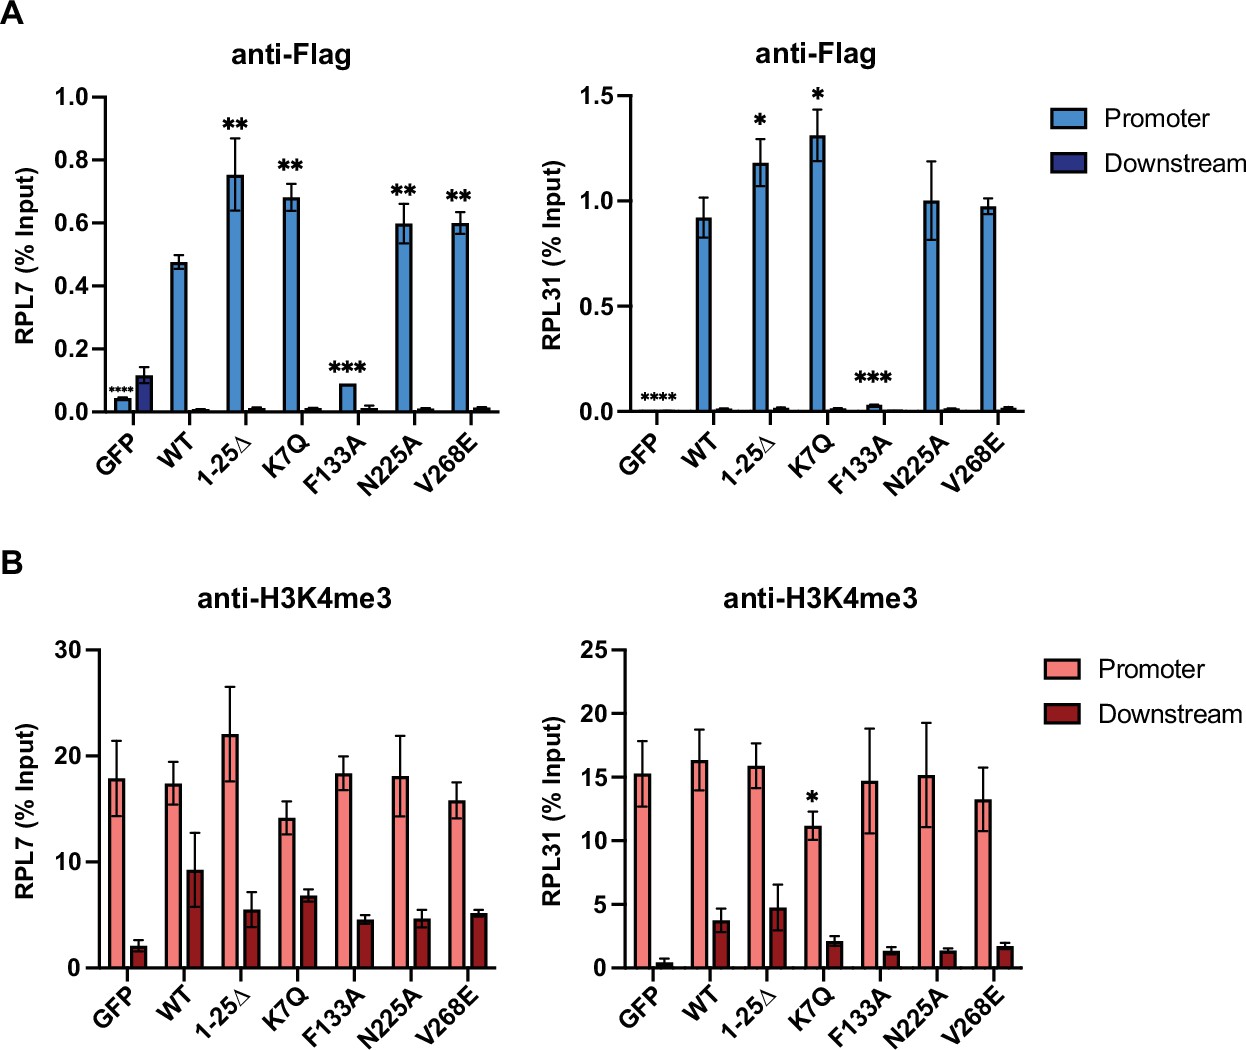
WDR5 recruitment to ribosomal protein gene promoters is not sufficient for gene activation.
(A–B) Chromatin immunoprecipitation (ChIP)-quantitative PCR data of the indicated over-expression condition using primers for either the promoter or 800 bp downstream control at the RPL7 (left) or RPL31 (right) gene locus. ChIP was performed using the anti-Flag to pull down WDR5 (A) and H3K4me3 (B). Significance determined by comparing promoter enrichment of WT to other over-expressing conditions using unpaired two-tailed Student’s t test.
Figure 5
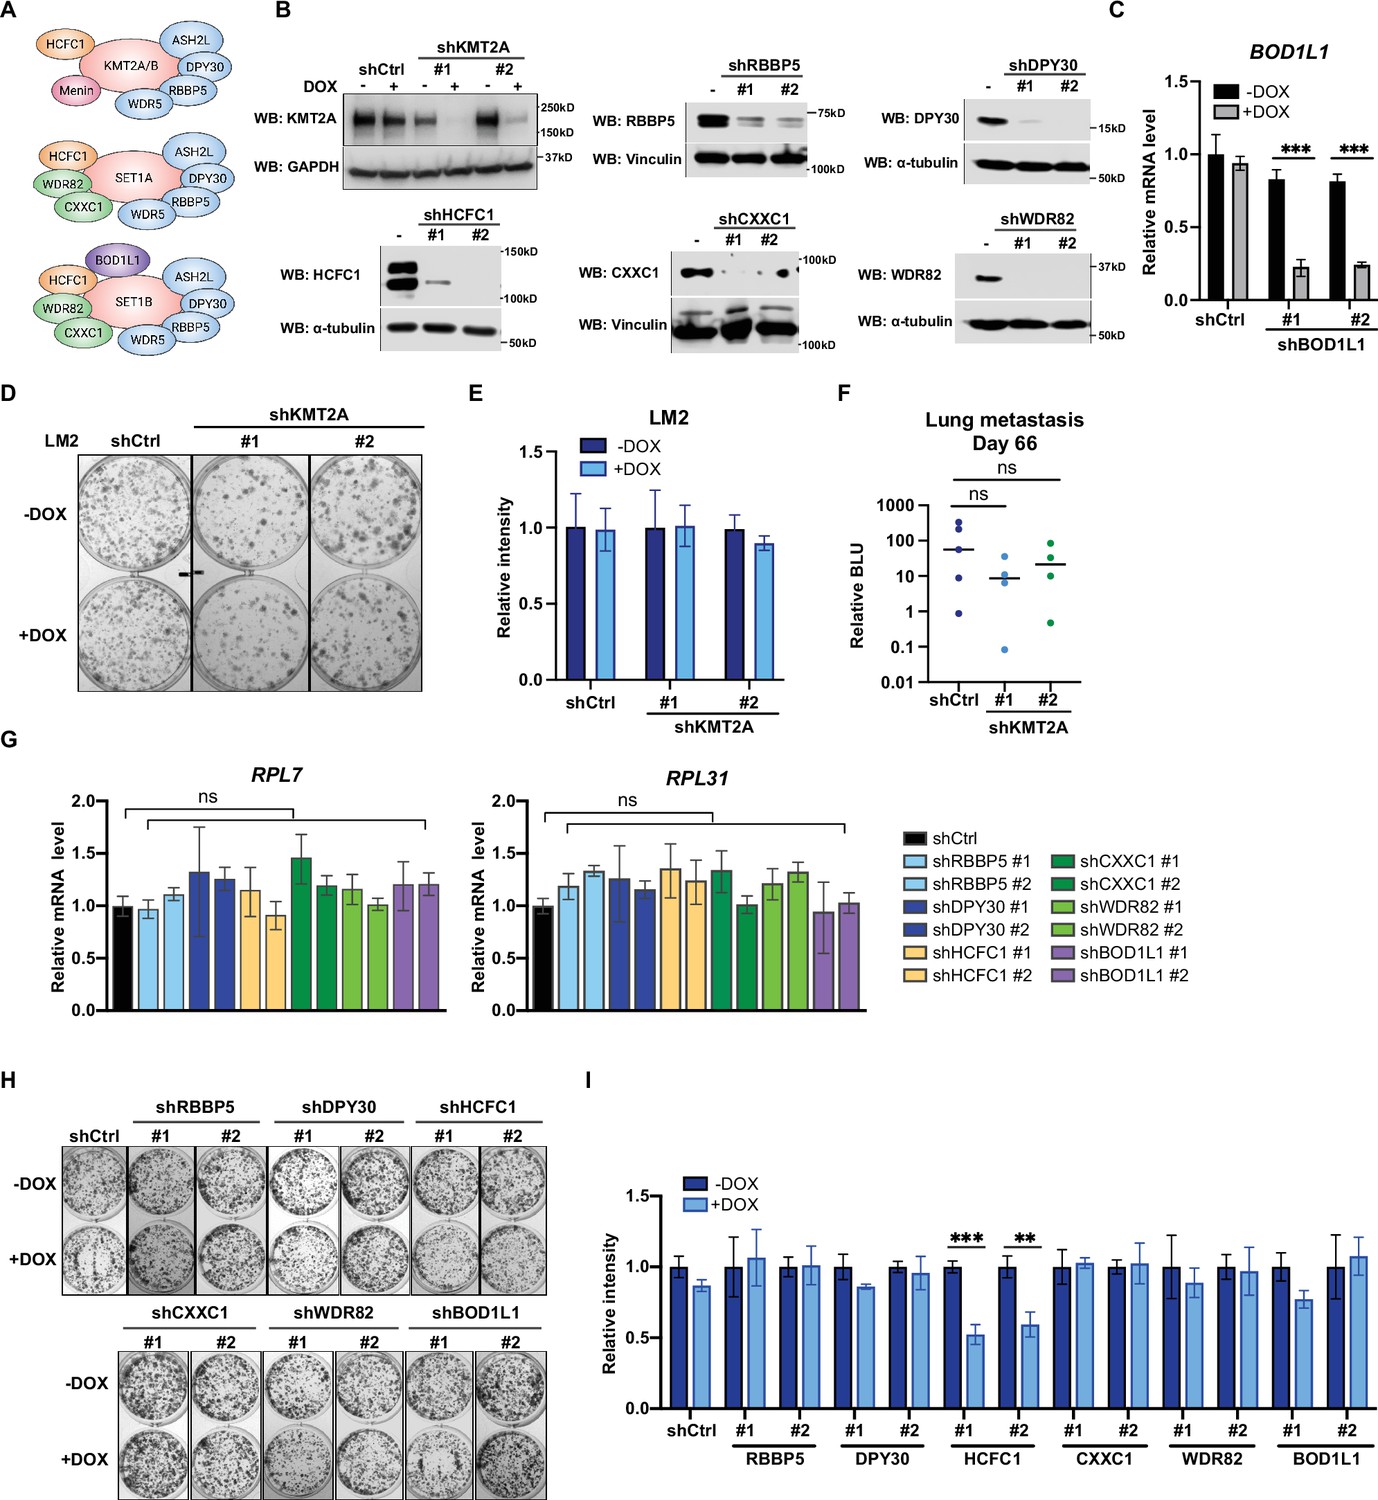
Metastatic cell growth and lung colonization do not require KMT2 complex components.
(A) Schematic of subunit composition of several KMT2 complexes. (B) Western blot analyses of the indicated proteins in LM2 cells transduced with inducible shRNA targeting KMT2A, RBBP5, DPY30, HCFC1, CXXC1, and WDR82. Cells were collected after 3 days of doxycycline (DOX) (1 μg/mL) treatment. (C) RT-quantitative PCR (qPCR) analysis of BOD1L1 in LM2 cells transduced with two independent hairpins targeting BOD1L1. Cells were collected after 3 days of DOX treatment (n=4, unpaired two-side Student’s t test). (D–E) Colony formation assay of LM2 shCtrl or shKMT2A cells (shKMT2A-1 and shKMT2A-2) after 9 days of treatment with control or DOX. Representative images (D) and quantification (E) are shown (n=3, unpaired two-side Student’s t test). (F) Normalized bioluminescence unit (BLU) signals of lung metastasis at day 66 of mice injected intravenously with LM2 cells from (B) and fed with DOX chow. The data represent mean ± SEM. Significance determined using unpaired two-tailed Mann–Whitney test. ns, not significant; p=0.2857 (shCtrl versus shKMT2A-1) and p=0.5556 (shCtrl versus shKMT2A-2). (G) RT-qPCR analysis of the noted RP genes in LM2 cells transduced with the indicated inducible shRNAs. Cells were collected after 3 days of DOX treatment. Significance determined by comparing each treatment to shCtrl. (H–I) Colony formation assay of LM2 cells from (G) after 9 days of either control or DOX treatment. Representative images (H) and quantification (I) are shown (n=3, unpaired two-side Student’s t test). ***p=0.0005 (shHCFC1 #1 −DOX versus shHCFC1 #1 +DOX) and **p=0.0039 (shHCFC1 #2 −DOX versus shHCFC1 #2 +DOX). For gel source data, see Figure 5—source data 1.
-
Figure 5—source data 1
Original western blots for Figure 5B.
- https://cdn.elifesciences.org/articles/78163/elife-78163-fig5-data1-v2.zip
Figure 6 with 1 supplement
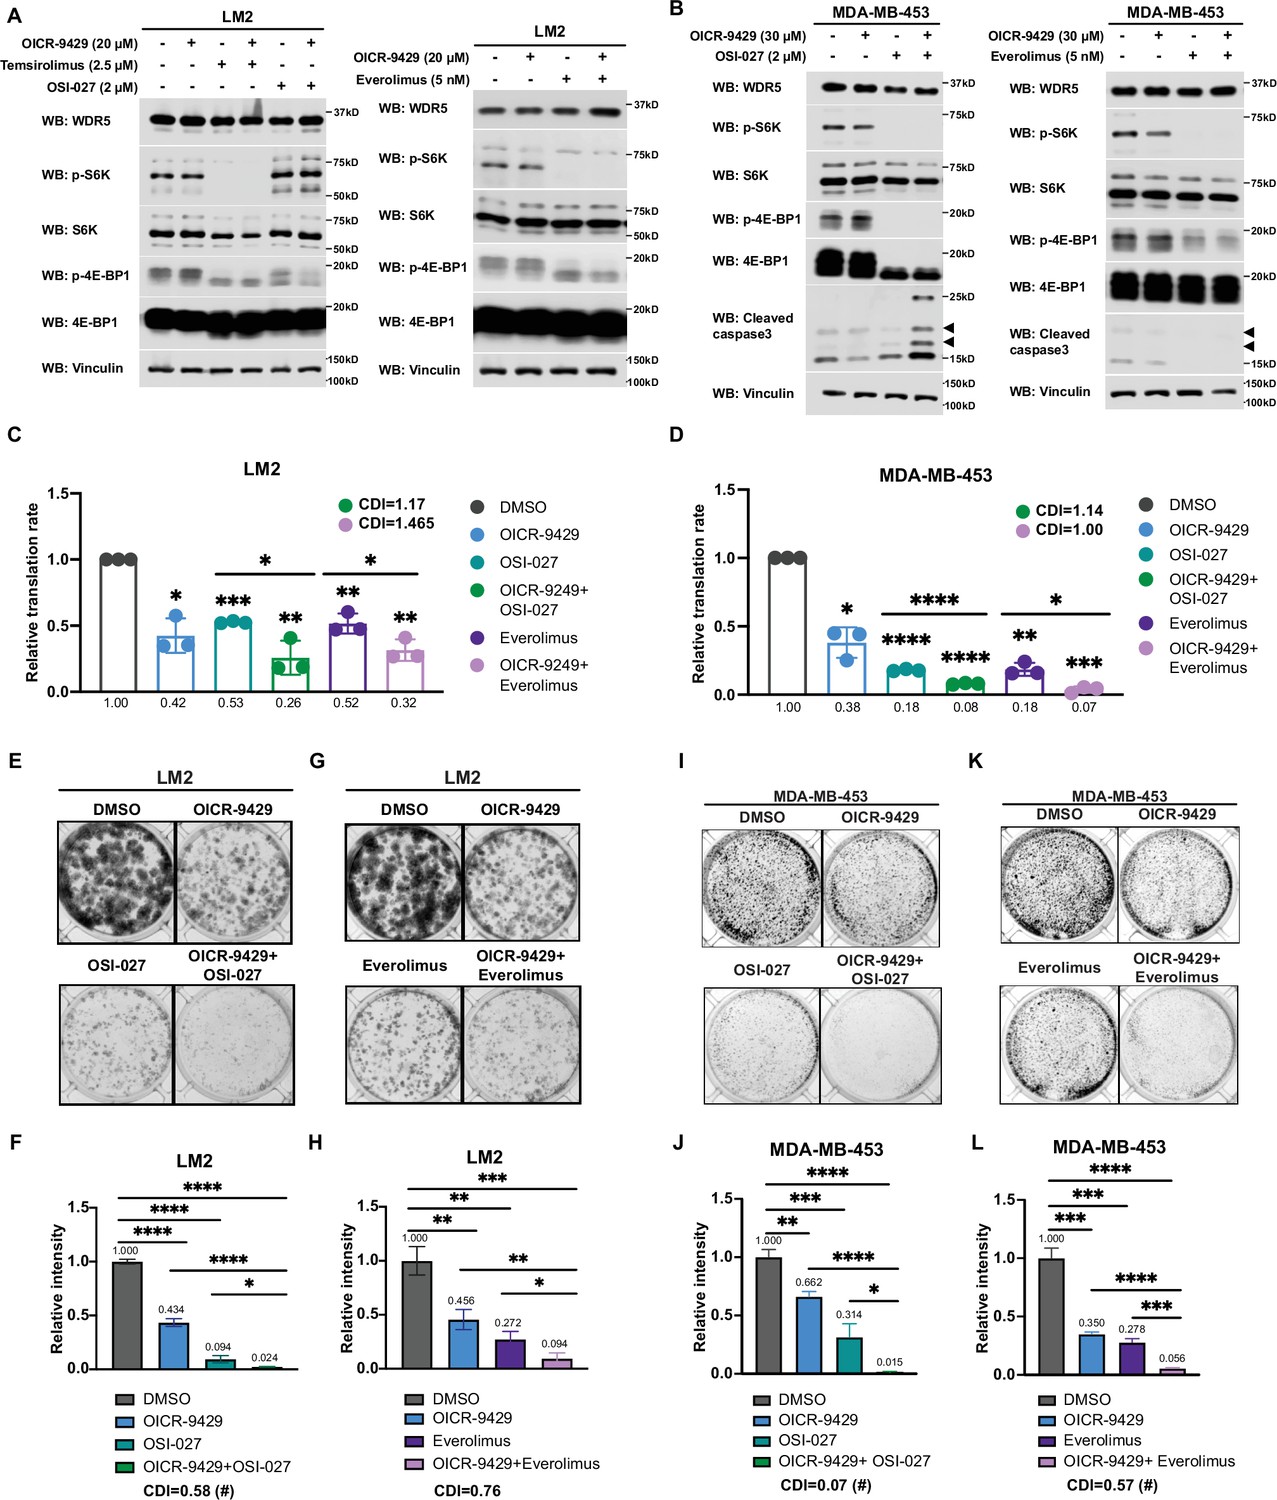
Inhibition of WDR5 and mTOR cooperatively reduces translation and triple-negative breast cancer (TNBC) cell growth.
(A) Western blot analysis of the indicated proteins in LM2 cells treated for 3 days with or without 20 μM OICR-9429 in combination with control, 2 μM OSI-027, 2.5 μM temsirolimus, or 5 nM everolimus. (B) Western blot analysis of the indicated proteins in MDA-MB-453 treated for 3 days with or without 30 μM OICR-9429 in combination with control, 0.5 μM OSI-027, or 1 nM everolimus. (C) Normalized translational rates in LM2 cells from (A) (n=3, one sample t test). *p=0.0166 (DMSO versus OICR-9429), ***p=0.0001 (DMSO versus OSI-027), ** p=0.0099 (DMSO versus OICR-9429 +OSI-027), **p=0.0080 (DMSO versus everolimus), **p=0.0047 (DMSO versus OICR-9429+), *p=0.0232 (OSI-027 versus OICR-9429 +OSI-027), and *p=0.00352 (everolimus versus OICR-9429 +everolimus). (D) Normalized translational rates in MDA-MB-453 cells from (B) (n=3, one sample t test). *p=0.0107 (DMSO versus OICR-9429), ****p<0.0001 (DMSO versus OSI-027), ****p<0.0001 (DMSO versus OICR-9429 +OSI-027), **p=0.0012 (DMSO versus everolimus), ***p=0.0005 (DMSO versus OICR-9429 +everolimus), ****p<0.0001 (OSI-027 versus OICR-9429 +OSI-027), and *p=0.0370 (everolimus versus OICR-9429 +everolimus). (E–F) Colony formation assay of LM2 treated for 8 days with or without 20 μM OICR-9429 in combination with control or 2 μM OSI-027. Representative images (E) and quantification (F) are shown. ****p<0.0001 (DMSO versus OICR-9429), ****p<0.0001 (DMSO versus OSI-027), ****p<0.0001 (DMSO versus OICR-9429 +OSI-027), ****p<0.0001 (OICR-9429 versus OICR-9429 +OSI-027), and *p=0.0233 (OSI-027 versus OICR-9429 +OSI-027). (G–H) Colony formation assay of LM2 cells treated for 8 days with or without 20 μM OICR-9429 in combination with control or 5 nM everolimus. Representative images (G) and quantification (H) are shown. **p=0.0043 (DMSO versus OICR-9429), **p=0.0011 (DMSO versus everolimus), ***p=0.0004 (DMSO versus OICR-9429 +everolimus), **p=0.0042 (OICR-9429 versus OICR-9429 +everolimus), and *p=0.0272 (everolimus versus OICR-9429 +everolimus). (I–J) Colony formation assay of MDA-MB-453 treated for 10 days with or without 30 μM OICR-9429 in combination with control or 0.5 μM OSI-027. Representative images (I) and quantification (J) are shown. **p=0.0018 (DMSO versus OICR-9429), ***p=0.0009 (DMSO versus OSI-027), ****p<0.0001 (DMSO versus OICR-9429 +OSI-027), ****p<0.0001 (OICR-9429 versus OICR-9429 +OSI-027), and *p=0.011 (OSI-027 versus OICR-9429 +OSI-027). (K–L) Colony formation assay of MDA-MB-453 cells treated for 10 days with or without 30 μM OICR-9429 in combination with control or 1 nM everolimus. Representative images (K) and quantification (L) are shown (n=3, unpaired two-side Student’s t test). ***p=0.0002 (DMSO versus OICR-9429), ***p=0.0002 (DMSO versus everolimus), ****p<0.0001 (DMSO versus OICR-9429 +everolimus), ****p<0.0001 (OICR-9429 versus OICR-9429 +everolimus), and ***p=0.0003 (everolimus versus OICR-9429 +everolimus). Calculation of coefficients of drug interaction (CDIs) is described in Materials and methods section. Significant synergy is labeled with (#). For gel source data, see Figure 6—source data 1 and Figure 6—source data 2.
-
Figure 6—source data 1
Original western blots for Figure 6A.
- https://cdn.elifesciences.org/articles/78163/elife-78163-fig6-data1-v2.zip
-
Figure 6—source data 2
Original western blots for Figure 6B.
- https://cdn.elifesciences.org/articles/78163/elife-78163-fig6-data2-v2.zip
Figure 6—figure supplement 1
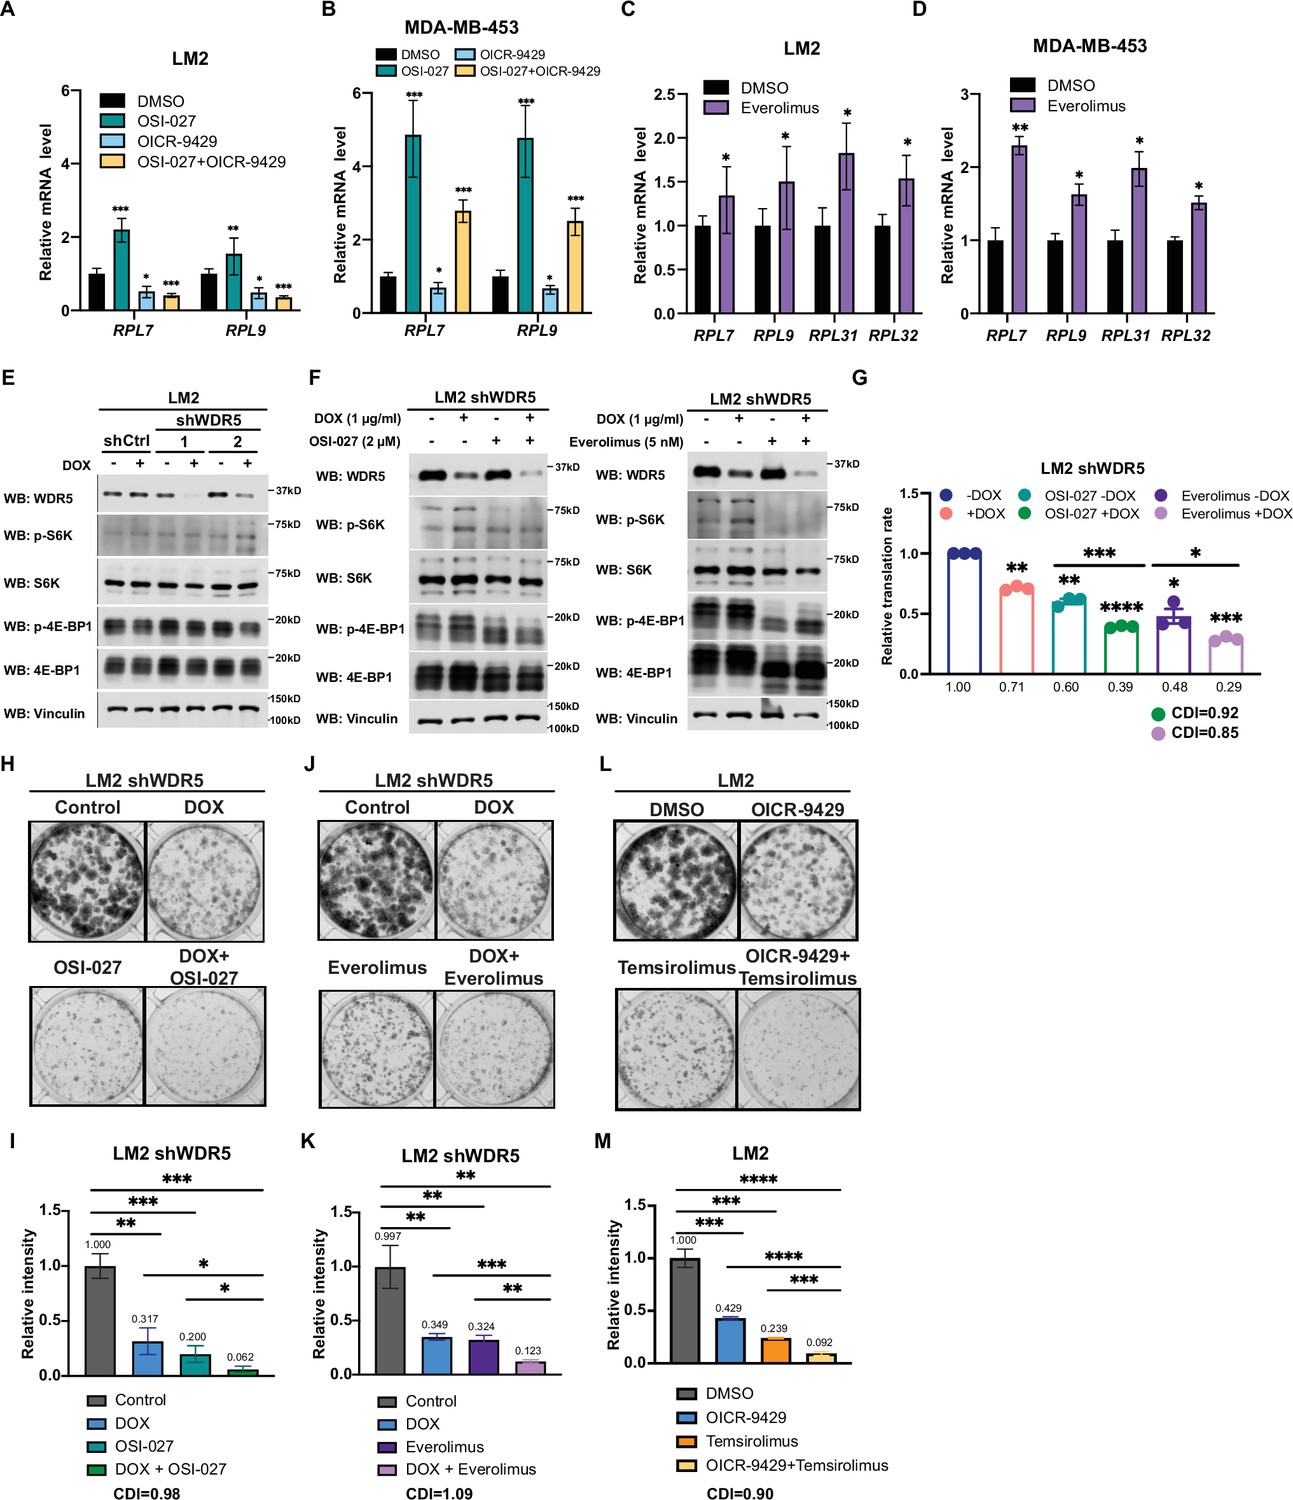
Inhibition of WDR5 and mTOR cooperatively reduces translation and triple-negative breast cancer (TNBC) growth.
(A) RT-quantitative PCR (qPCR) of selected differentially expressed genes (DEGs) in LM2 after DMSO, 2 μM OSI-027, 20 μM OICR-9429, or combined treatment for 3 days. (B) RT-qPCR of selected DEGs in MDA-MB-453 after DMSO, 0.5 μM OSI-027, 30 μM OICR-9429, or combined treatment for 3 days. (C) RT-qPCR of selected DEGs in LM2 after DMSO or 5 nM everolimus treatment for 3 days. (D) RT-qPCR of selected DEGs in MDA-MB-453 after DMSO or 1 nM everolimus treatment for 3 days. Significance determined by comparing each treatment to DMSO control (n=4, unpaired two-side Student’s t test). (E) Western blot analysis of the indicated proteins in LM2 shCtrl, shWDR5-1, and shWDR5-2 with or without hairpin induction by doxycycline (DOX) (1 μg/mL) for 3 days. (F) Western blot analysis of indicated proteins in LM2 shWDR5-1 with or without DOX (1 μg/mL) induction in combination with 3 days of control, 2 μM OSI-027, or 5 nM everolimus treatment. (G) Normalized translational rates of LM2 shWDR5 cells from (A) following 3 days of control, 2 μM OSI-027, or 5 nM everolimus treatment (n=3, one sample t test). (H–I) Colony formation assay of LM2 shWDR5 with or without hairpin induction by DOX in combination with control or 2 μM OSI-027 treatment for 8 days. Representative images (H) and quantification (I) are shown. (J–K) Colony formation assay of LM2 shWDR5 cells with or without hairpin induction by DOX in combination with control or 5 nM everolimus treatment for 8 days. Representative images (J) and quantification (K) are shown. (L–M) Colony formation assay of LM2 with or without 20 μM OICR-9429 in combination with control or 2.5 μM temsirolimus treatment for 8 days. Representative images (M) and quantification (L) are shown (n=3, unpaired two-side Student’s t test). *p<0.05; **p<0.001; ***p<0.001; ****p<0.0001. Calculation of coefficients of drug interaction (CDIs) is described in Materials and methods section. Significant synergy is labeled with (#). For gel source data, see Figure 6—figure supplement 1—source data 1 and Figure 6—figure supplement 1—source data 2.
-
Figure 6—figure supplement 1—source data 1
Original western blots for Figure 2—figure supplement 1E.
- https://cdn.elifesciences.org/articles/78163/elife-78163-fig6-figsupp1-data1-v2.zip
-
Figure 6—figure supplement 1—source data 2
Original western blots for Figure 2—figure supplement 1F.
- https://cdn.elifesciences.org/articles/78163/elife-78163-fig6-figsupp1-data2-v2.zip
Figure 7
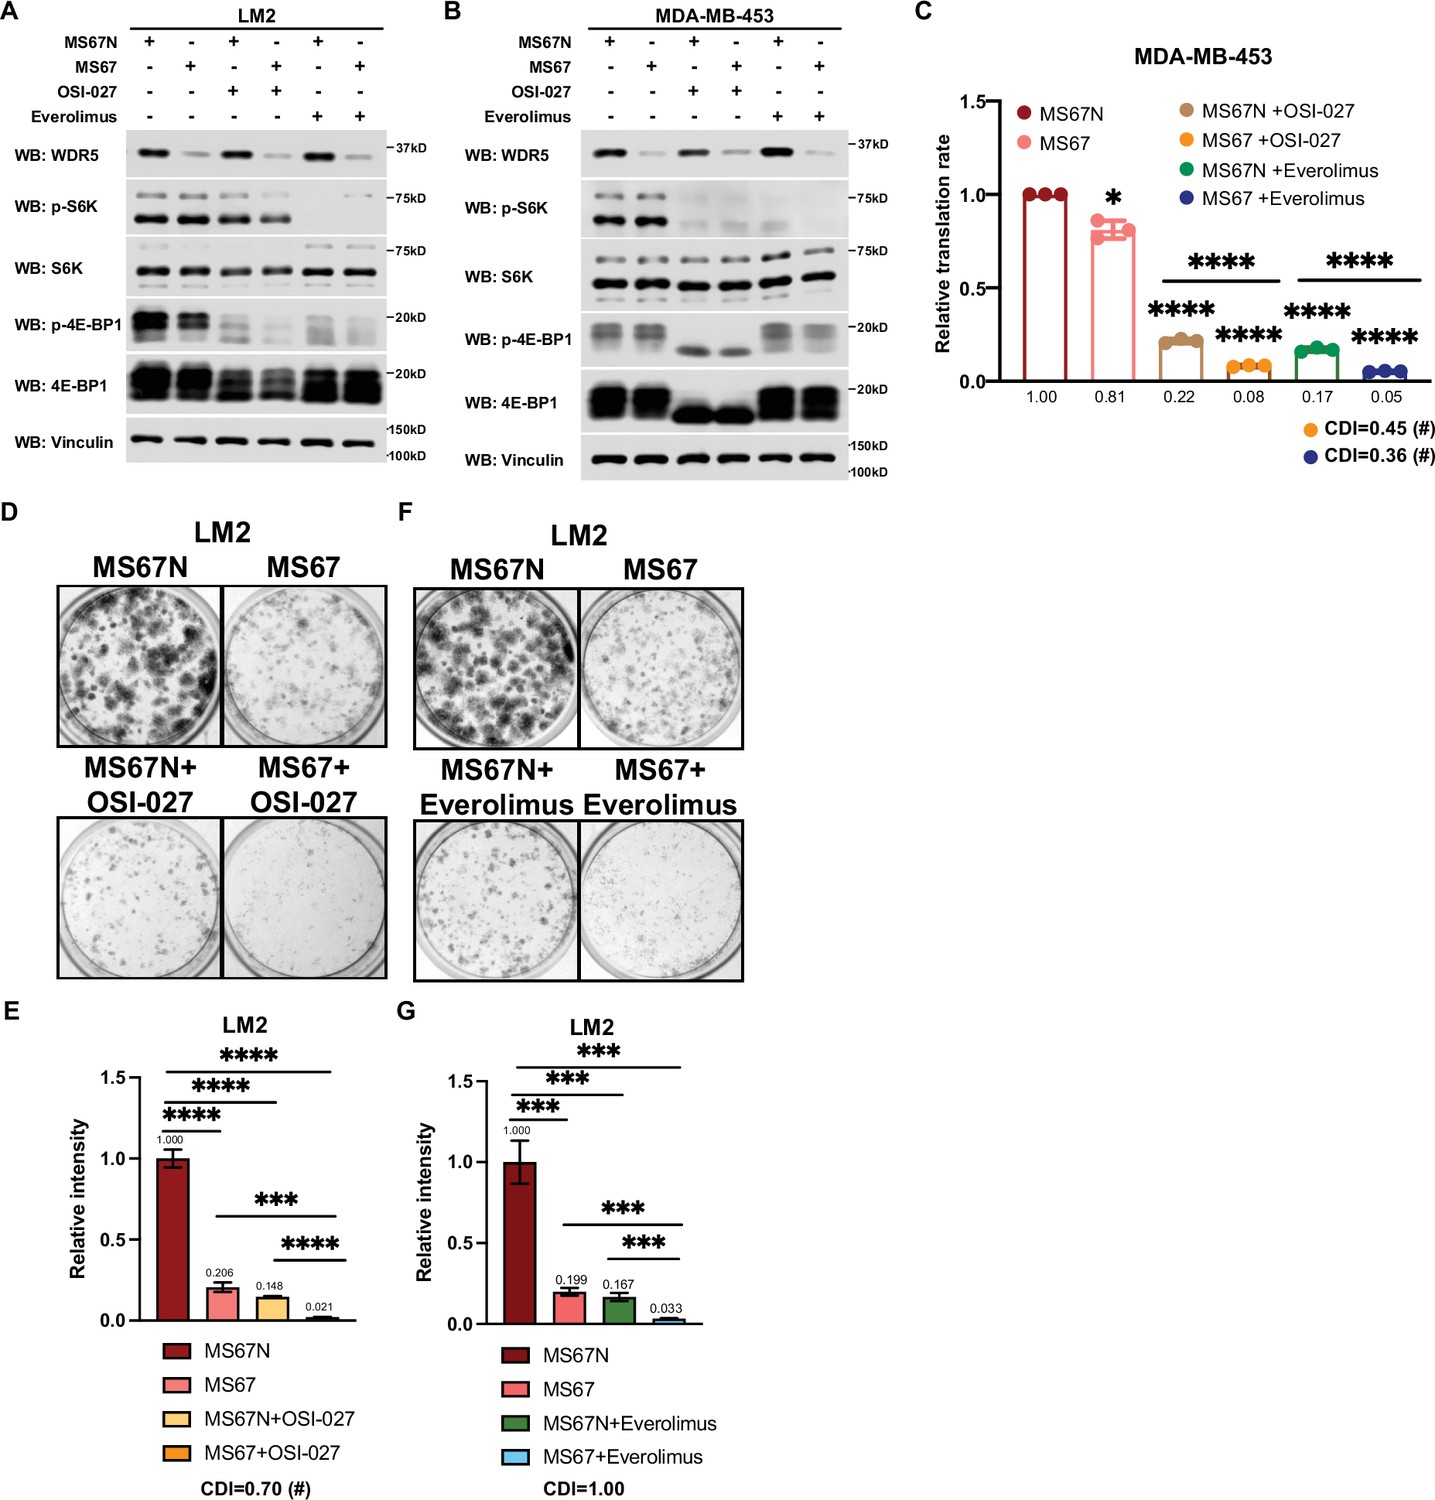
MS67-mediated WDR5 degradation and mTOR inhibition cooperatively reduces translation and triple-negative breast cancer (TNBC) cell growth.
(A) Western blot analysis of the indicated proteins in LM2 cells treated for 3 days with 2.5 μM MS67N or MS67 in combination control, 2 μM OSI-027, or 5 nM everolimus. (B) Western blot analysis of the indicated proteins in MDA-MB-453 cells treated for 3 days with 2.5 μM MS67N or MS67 in combination with control, 0.5 μM OSI-027, or 1 nM everolimus. (C) Normalized translational rates in MDA-MB-453 cells from (B) (n=3, one sample t test). *p=0.0209 (MS67N versus MS67), ****p<0.0001 (MS67N versus MS67N +OSI-027), ****p<0.0001 (MS67N versus MS67 +OSI-027), ****p<0.0001 (MS67N versus MS67N +everolimus), ****p<0.0001 (MS67N versus MS67 +everolimus), ****p<0.0001(MS67N +OSI-027 versus MS67 +OSI-027), and ****p<0.0001(MS67N +everolimus versus MS67 +everolimus). (D–E) Colony formation assay of LM2 cells treated for 9 days with 5 μM MS67N or MS67 in combination with control or 2 μM OSI-027. Representative images (D) and quantification (E) are shown. ****p<0.0001 (MS67N versus MS67), ****p<0.0001 (MS67N versus MS67N+OSI-027), ****p<0.0001 (MS67N versus MS67 +OSI-027), ***p=0.0004 (MS67 versus MS67 +OSI-027), and ****p<0.0001 (MS67N+OSI-027 versus MS67 +OSI027). (F–G) Colony formation assay of LM2 cells with 5 μM MS67N or MS67 in combination with control or 5 nM everolimus for 9 days. Representative images (F) and quantification (G) are shown. ***p=0.0005 (MS67N versus MS67), ***p=0.0004 (MS67N versus MS67N +everolimus), ***p=0.0002 (MS67N versus MS67 +everolimus), ***p=0.0003 (MS67 versus MS67 +everolimus), and ***p=0.0008 (MS67N +everolimus versus MS67 +everolimus). (n=3, unpaired two-side Student’s t test). *p<0.05; **p<0.01; ***p<0.001; ****p<0.0001. Calculation of coefficients of drug interaction (CDIs) is described in Materials and methods section. Significant synergy is labeled with (#). For gel source data, see Figure 7—source data 1 and Figure 7—source data 2.
-
Figure 7—source data 1
Original western blots for Figure 7A.
- https://cdn.elifesciences.org/articles/78163/elife-78163-fig7-data1-v2.zip
-
Figure 7—source data 2
Original western blots for Figure 7B.
- https://cdn.elifesciences.org/articles/78163/elife-78163-fig7-data2-v2.zip
Author response image 1
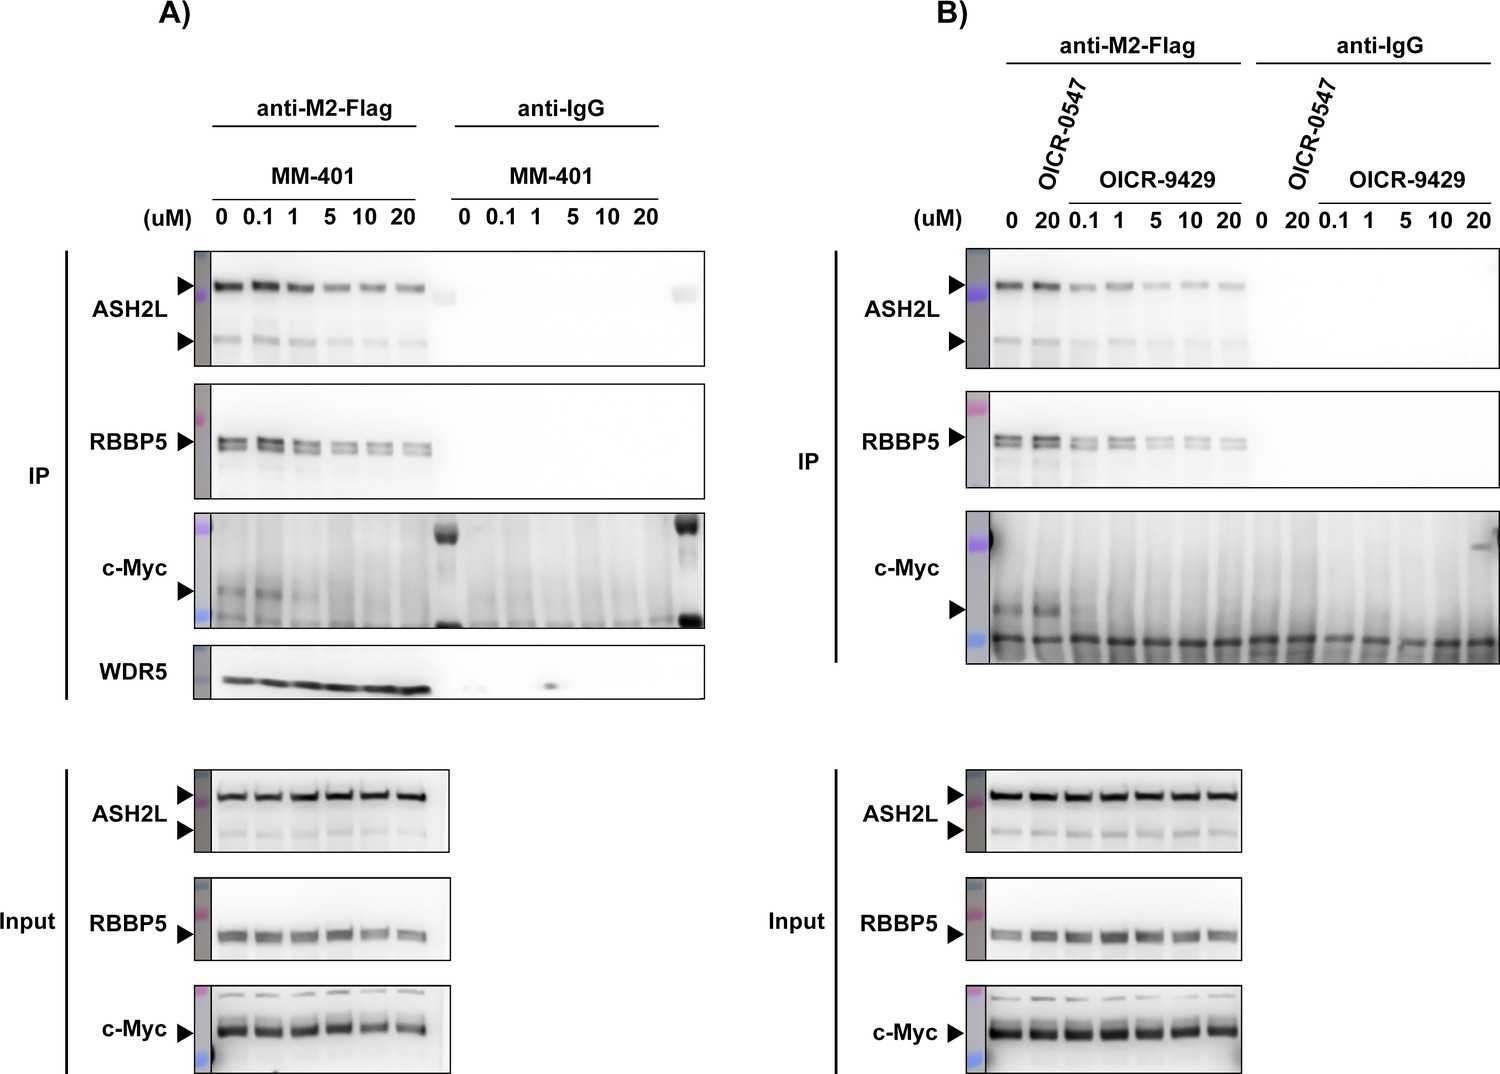
c-Myc and WDR5 interaction is disrupted by WDR5 inhibitors MM-401 or OICR9429.
(A) Western blot of M2-Flag or IgG control IP in Flag-WDR5-expressing LM2 cells after treatment with the indicated concentrations of MM-401. DMSO was used as treatment control. (B) Western blot of M2-Flag or IgG control IP in Flag-WDR5-expressing LM2 cells after treatment with inactive control compound OICR-0547 or the indicated concentrations of OICR-9429. DMSO was used as treatment control.
Tables
Key resources table
| Reagent type (species) or resource | Designation | Source or reference | Identifiers | Additional information |
|---|---|---|---|---|
| Antibody | Anti-Flag (mouse monoclonal) | Sigma | F1804 | IP (1:50), WB (1:1000) |
| Antibody | Anti-vinculin (mouse monoclonal) | Sigma | V9131 | WB (1:10,000) |
| Antibody | Anti-tubulin (mouse monoclonal) | Sigma | T5168 | WB (1:10,000) |
| Antibody | Anti-WDR5 (rabbit monoclonal) | Cell Signaling Technology | #13105 | WB (1:1000) |
| Antibody | Anti-RBBP5 (rabbit monoclonal) | Cell Signaling Technology | #13171 | WB (1:1000) |
| Antibody | Anti-KMT2A/MLL1-C (rabbit monoclonal) | Cell Signaling Technology | #14197 | WB (1:1000) |
| Antibody | Anti-CXXC1 (rabbit polyclonal) | Cell Signaling Technology | #12585 | WB (1:1000) |
| Antibody | Anti-HCFC1 (rabbit polyclonal) | Cell Signaling Technology | #69690 | WB (1:1000) |
| Antibody | Anti-WDR82 (rabbit monoclonal) | Cell Signaling Technology | #99715 | WB (1:1000) |
| Antibody | Anti-phospho p70S6K (Thr389) (rabbit polyclonal) | Cell Signaling Technology | #9202 | WB (1:1000) |
| Antibody | Anti-phospho 4E-BP1 (Thr37/46) (rabbit monoclonal) | Cell Signaling Technology | #2855 | WB (1:1000) |
| Antibody | Anti-4E-BP1 (rabbit monoclonal) | Cell Signaling Technology | #9644 | WB (1:1000) |
| Antibody | Anti-cleaved caspase 3 (rabbit polyclonal) | Cell Signaling Technology | #9661 | WB (1:1000) |
| Antibody | Anti-DPY30 (rabbit polyclonal) | Bethyl Laboratories | A304-296A | WB (1:1000) |
| Antibody | Anti-phospho S6 (Ser240/244) (rabbit monoclonal) | Cell Signaling Technology | #5364 | WB (1:1000) |
| Antibody | Anti-S6 (rabbit monoclonal) | Cell Signaling Technology | #2217 | WB (1:10,000) |
| Antibody | Anti-M2 Flag (rabbit monoclonal) | Cell Signaling Technology | #14793 | Chromatin immunoprecipitation (ChIP) (10 µL) |
| Antibody | Anti-H3K4me3 (rabbit polyclonal) | Abcam | Ab8580 | ChIP (10 µg) |
| Recombinant DNA reagent | pINDUCER-10 (plasmid) | Meerbrey et al., 2011 | Inducible shRNA knockdown with red fluorescent protein reporter | |
| Recombinant DNA reagent | pINDUCER-10-Blasticidin (plasmid) | This paper | Version of pINDUCER-10 with blasticidin selection marker | |
| Recombinant DNA reagent | p3XFlag-CMV-14-WDR5 | Addgene | #59974 | WDR5 plasmid used for subcloning |
| Recombinant DNA reagent | pDONR-211 | ThermoFisher Scientific | #12536017 | Used for cloning WDR5 into expression plasmid |
| Recombinant DNA reagent | pLenti-PSK-hygro-DEST | Addgene | #19066 | Used for cloning WDR5 into expression plasmid |
| Cell line (H. sapiens) | MDA-MB-231 | ATCC | HTB-26 | MDA-MB-231 expressing Luciferase |
| Cell line (H. sapiens) | MDA-MB-231-LM2 | Joan Massagué lab, Memorial Sloan Kettering Cancer Center | Lung metastatic derivative of MDA-MB-231 | |
| Cell line (H. sapiens) | MDA-MB-231-BoM | Joan Massagué lab, Memorial Sloan Kettering Cancer Center | Bone metastatic derivative of MDA-MB-231 | |
| Cell line (H. sapiens) | MDA-MB-231-BrM3 | This paper | Brain metastatic derivative of MDA-MB-231 | |
| Cell line (H. sapiens) | HCC1143 | ATCC | CRL-2321 | |
| Cell line (H. sapiens) | MDA-MB-453 | ATCC | HTB-131 | |
| Cell line (H. sapiens) | MCF7 | ATCC | HTB-22 | |
| Cell line (H. sapiens) | T47D | ATCC | HTB-133 | |
| Cell line (H. sapiens) | MDA-MB-361 | ATCC | HTB-27 | |
| Cell line (H. sapiens) | UACC893 | ATCC | CRL-1902 | |
| Cell line (H. sapiens) | BT474 | ATCC | HTB-20 | |
| Cell line (H. sapiens) | SKBR3 | ATCC | HTB-30 | |
| Cell line (M. musculus) | 4T1 | ATCC | CRL-2539 | |
| Chemical compound and drug | Puromycin | ThermoFischer Scientific | A1113802 | |
| Chemical compound and drug | Blasticidin | ThermoFischer Scientific | A1113902 | |
| Chemical compound and drug | Doxycycline | ThermoFischer Scientific | #446060050 | |
| Chemical compound and drug | MS67 | Yu et al., 2021 | WDR5 degrader | |
| Chemical compound and drug | MS67N | Yu et al., 2021 | WDR5 degrader control | |
| Chemical compound and drug | OICR-9429 | Sigma | SML1209 | |
| Chemical compound and drug | OSI-027 | Cayman Chemical | #17379 | |
| Chemical compound and drug | Everolimus | Cayman Chemical | #11597 | |
| Chemical compound and drug | Temsirolimus | Cayman Chemical | #11590 | |
| Software and algorithm | R studio | R studio | RRID:SCR_000432 | |
| Software and algorithm | STAR | STAR | RRID:SCR_004463 | |
| Software and algorithm | GENCODEv96 | GENCODEv96 | RRID:SCR_014966 | |
| Software and algorithm | PyMol | PyMol | RRID:SCR_000305 | |
| Commercial assay and kit | Cell proliferation reagent WST-1 | Roche | #11644807001 | |
| Commercial assay and kit | TruSeq Stranded mRNA Library Prep | Illumina | #20020594 | |
| Commercial assay and kit | High-capacity cDNA Reverse Transcription Kit | ThermoFisher | #4368813 | |
| Commercial assay and kit | Click-iT Cell Reaction Buffer Kit | ThermoFisher | C10269 |
Additional files
-
Supplementary file 1
Information related to shRNA characterization, in vivo and in vitro screening, RNA-seq analysis, cloning oligos and primers.
(a) List of hairpin sequences and knockdown efficiency.
(b) Results of in vivo and in vitro screen. l2fc, Log2 fold change
(c) Shared differentially expressed genes (DEGs) after WDR5 knockdown in LM2, BrM3, and BoM. l2fc, Log2 fold change; padj, adjusted p value.
(d) Enriched pathways of differentially expressed genes (DEGs) after WDR5 knockdown in LM2, BrM3, BoM, or all three cell lines (common). Enriched pathways, significance, combined score, and overlapping genes are shown.
(e) List of cloning oligos.
(f) List of primers used for RT-qPCR.
(g) List of barcode qPCR primers.
- https://cdn.elifesciences.org/articles/78163/elife-78163-supp1-v2.xlsx
-
Transparent reporting form
- https://cdn.elifesciences.org/articles/78163/elife-78163-transrepform1-v2.docx
Download links
A two-part list of links to download the article, or parts of the article, in various formats.
Downloads (link to download the article as PDF)
Open citations (links to open the citations from this article in various online reference manager services)
Cite this article (links to download the citations from this article in formats compatible with various reference manager tools)
Human WDR5 promotes breast cancer growth and metastasis via KMT2-independent translation regulation
eLife 11:e78163.
https://doi.org/10.7554/eLife.78163


