The KASH5 protein involved in meiotic chromosomal movements is a novel dynein activating adaptor
- Department of Molecular, Cellular and Developmental Biology, University of Michigan-Ann Arbor, United States
- Department of Chemistry and Molecular Biology, University of Gothenburg, Sweden
- Biological Chemistry, University of Michigan, United States
Figures
Figure 1 with 1 supplement
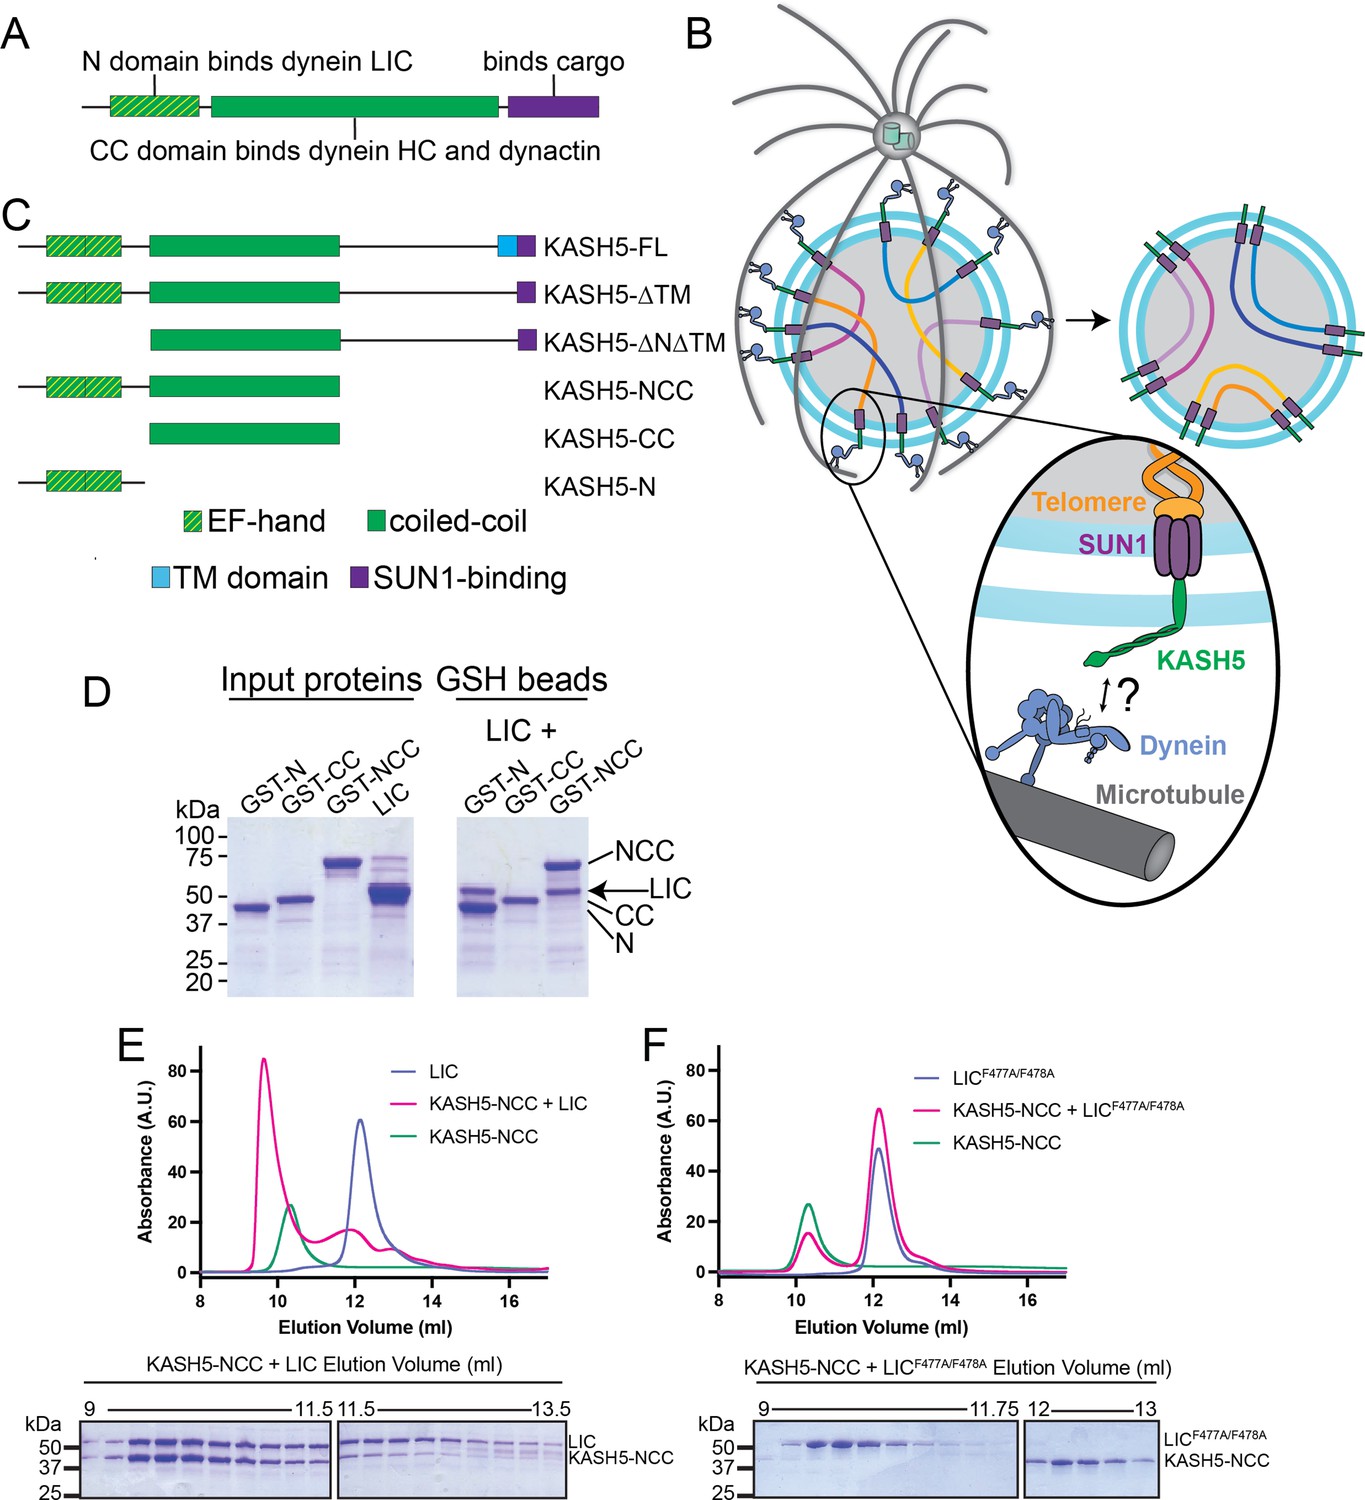
KASH5 binds dynein via a direct NCC-light-intermediate chain (LIC) interaction.
(A) Domain arrangement of a typical dynein activating adaptor showing an N-terminal LIC-interacting domain, a central coiled-coil (CC), and a C-terminal cargo-binding domain. Note that this description is simplified for BicD2 as it is primarily CC and thus uses a CC region toward the N-terminus to bind LIC. (B) Schematic for how the telomere and dynein tether to each other at the nuclear envelope with the help of the SUN1-KASH5 complex to move chromosomes and facilitate homolog pairing during meiosis. (C) Domain diagram of human KASH5 FL and domain deletion constructs used in this study. (D) Pull down of purified proteins on glutathione (GSH) beads. Indicated glutathione S-trasferase (GST)-tagged KASH5 constructs were incubated with dynein LIC and pulled down on GSH-beads followed by visualization on an SDS-PAGE using Coomassie-blue staining. Number of replicates, n=2. (E and F) UV280 absorbance profile (top) and Coomassie-blue staining analysis (bottom) of size-exclusion chromatography (SEC) of KASH5-NCC alone, LIC alone, and a mixture of KASH5-NCC and LIC using either wild type LIC (E) or the LIC F447A/F448A double mutant (F). n represents number of replicates for each SEC run. n=3, 3, 2, 2, and 2 for KASH5-NCC alone, LIC alone, LIC F447A/F448A alone, KASH5-NCC with LIC, and KASH5-NCC with LIC F447A/F448A, respectively.
-
Figure 1—source data 1
Unedited SDS-PAGE gels relating to Figure 1D–F.
- https://cdn.elifesciences.org/articles/78201/elife-78201-fig1-data1-v2.pdf
Figure 1—figure supplement 1
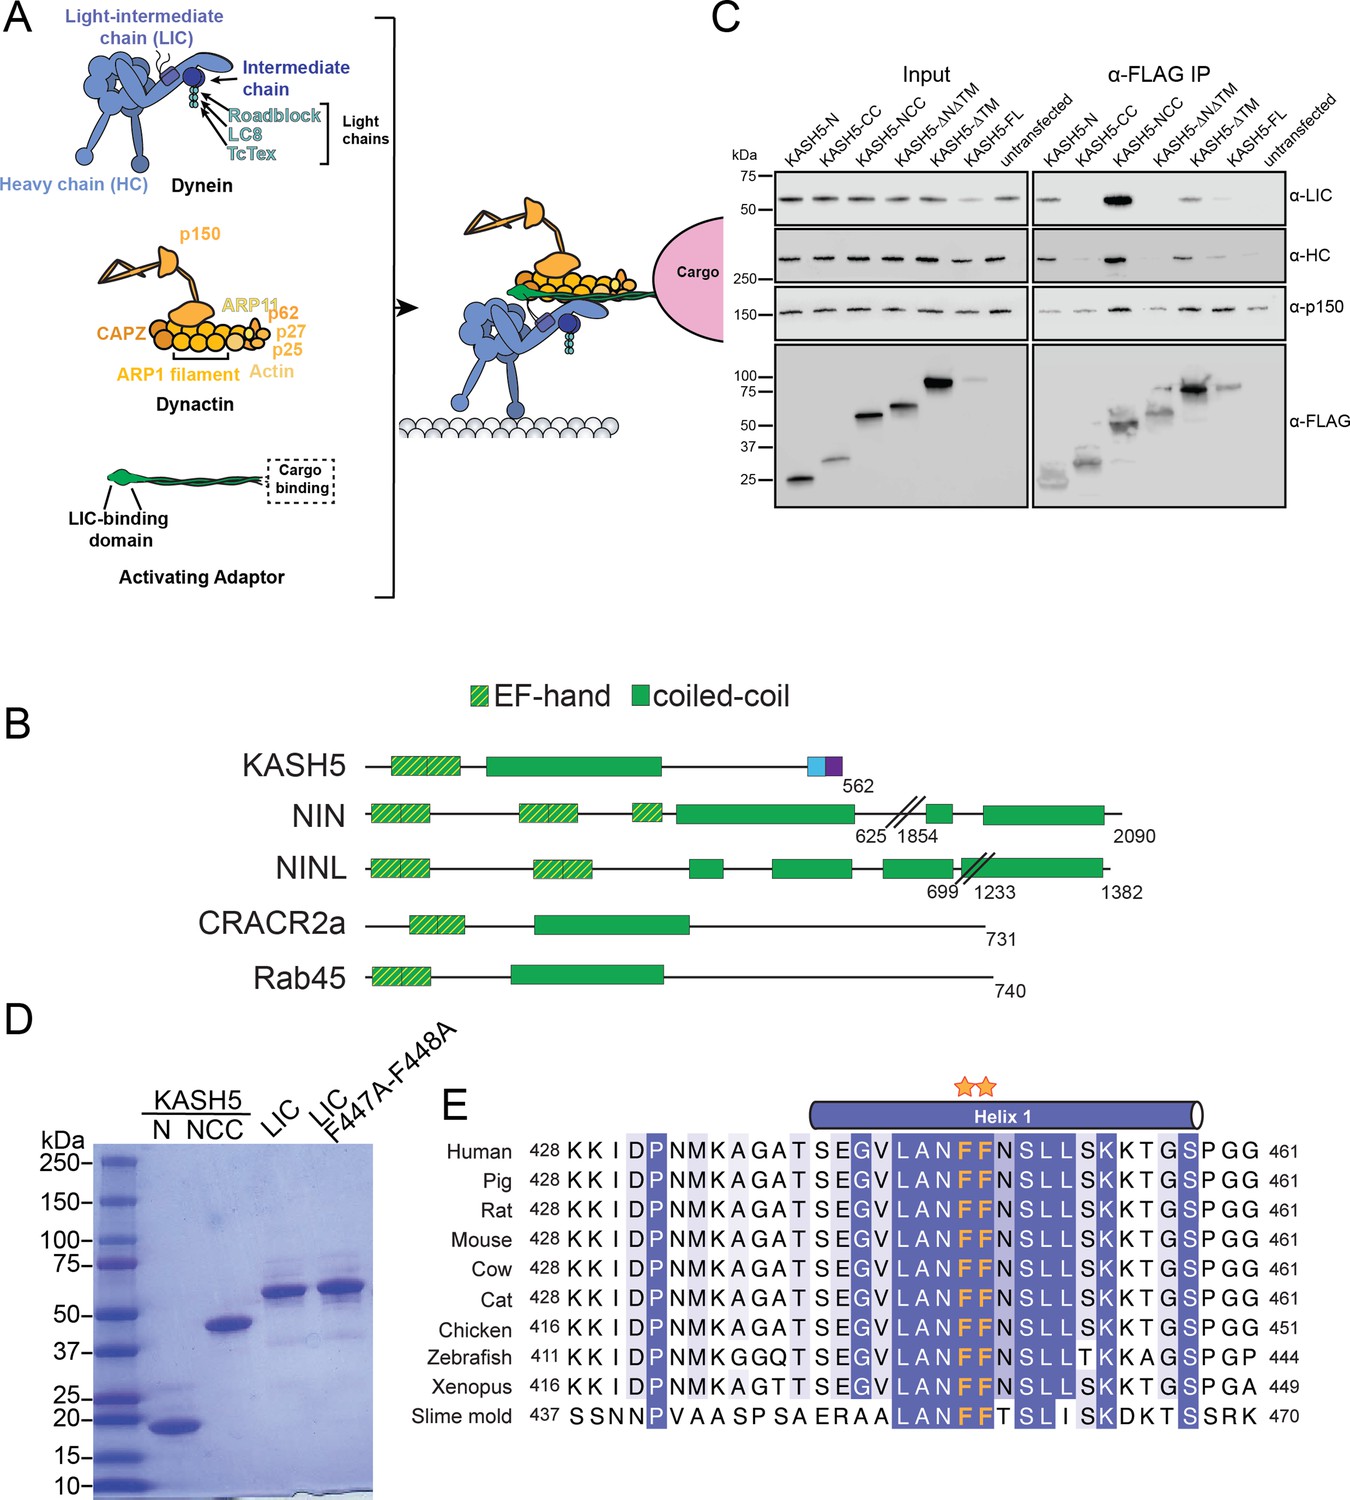
KASH5 uses its N-terminal domain and coiled-coil (CC) domain to bind light-intermediate chain (LIC).
(A) Schematic to describe the composition and association of dynein, dynactin, and an activating adaptor. (B) Domain diagrams of known EF-hand pair dynein activating adaptors and KASH5. (C) Anti-FLAG co-immunoprecipitation (co-IP) analysis of HEK 293T cell lysates containing the indicated transiently transfected FLAG-tagged KASH5 constructs. Endogenous dynein and dynactin subunits were visualized by immunostaining in the input and immunoprecipitated fractions. (D) Purified dynein LIC and KASH5 constructs used in direct binding experiments. (E) Alignment of LIC proteins showing strict conservation of the di-phenylalanine motif (orange asterisks) in the helix that binds activating adaptors.
-
Figure 1—figure supplement 1—source data 1
Unedited blots related to Figure 1—figure supplement 1C.
- https://cdn.elifesciences.org/articles/78201/elife-78201-fig1-figsupp1-data1-v2.pdf
-
Figure 1—figure supplement 1—source data 2
Unedited SDS-PAGE gels related to Figure 1—figure supplement 1D.
- https://cdn.elifesciences.org/articles/78201/elife-78201-fig1-figsupp1-data2-v2.pdf
Figure 2 with 1 supplement
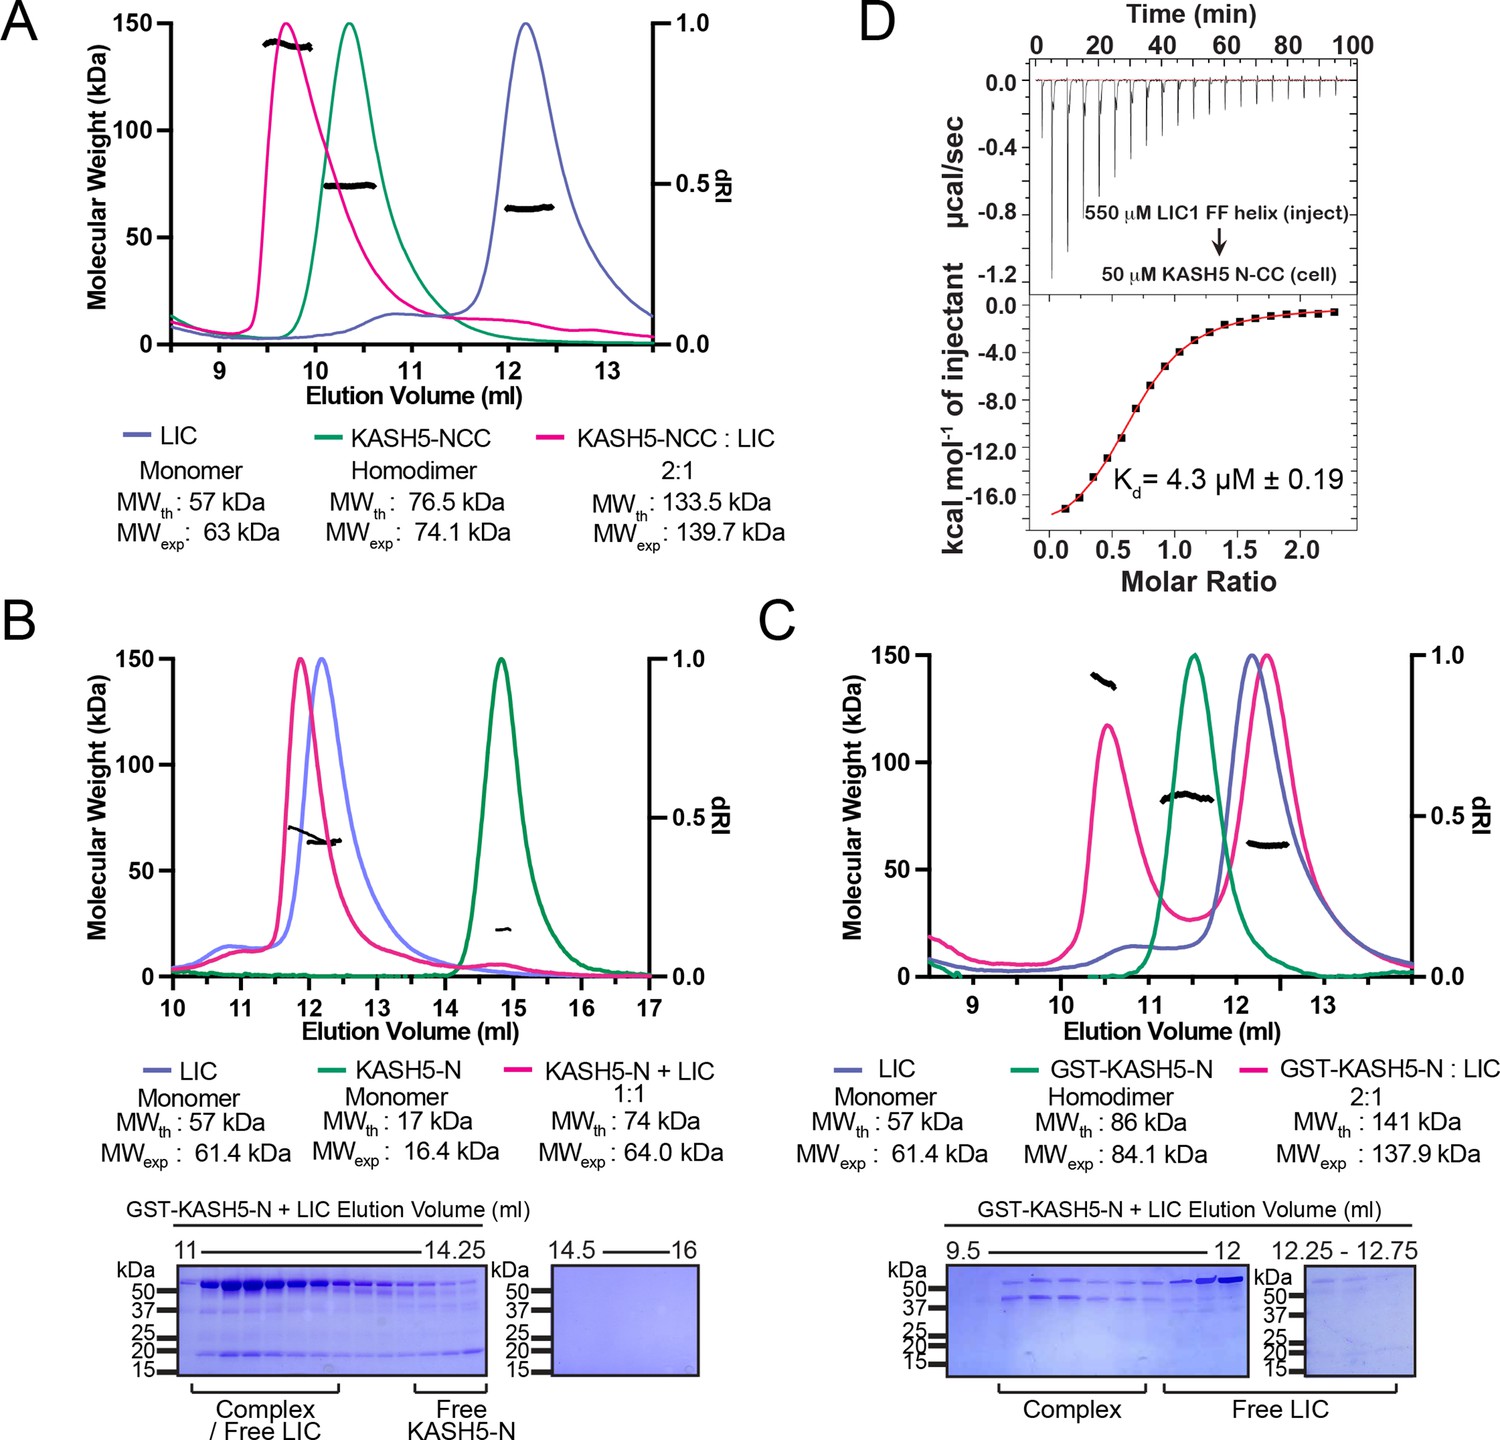
KASH5 directly binds dynein light-intermediate chain (LIC) with a 2:1 stoichiometry.
(A) Size-exclusion chromatography (SEC)-multi-angle light scattering (MALS) analysis of KASH5-NCC alone, LIC alone, and the KASH5-NCC-dynein-LIC complex (SEC profile data same as in Figure 1E) showing that KASH5-NCC is homodimeric while the NCC-LIC complex adopts a 2:1 stoichiometry. n represents number of replicates for each SEC-MALS run. n=2 each for KASH5-NCC alone, LIC alone, and KASH5-NCC with LIC. (B and C) SEC-MALS analysis of KASH5-N alone, LIC alone, and a mixture of KASH5-N and LIC using either untagged KASH5-N (B) or GST-tagged KASH5-N (C). Coomassie-blue stained SDS-PAGE analysis for the indicated KASH5-LIC mixtures is shown below the SEC-MALS profile. n represents number of replicates for each SEC-MALS run. n=1, 1, 3, and 1 for KASH5-N, GST-KASH5-N, KASH5-N with LIC, and GST-KASH5 with LIC, respectively. (D) Isothermal titration calorimetry (ITC) analysis of KASH5-NCC with the dynein LIC433–458 peptide containing F447 and F448. Mean and SE of the mean of the dissociation constant (Kd) are indicated for a biological duplicate.
-
Figure 2—source data 1
Unedited SDS-PAGE gels relating to Figure 2B and C.
- https://cdn.elifesciences.org/articles/78201/elife-78201-fig2-data1-v2.pdf
Figure 2—figure supplement 1
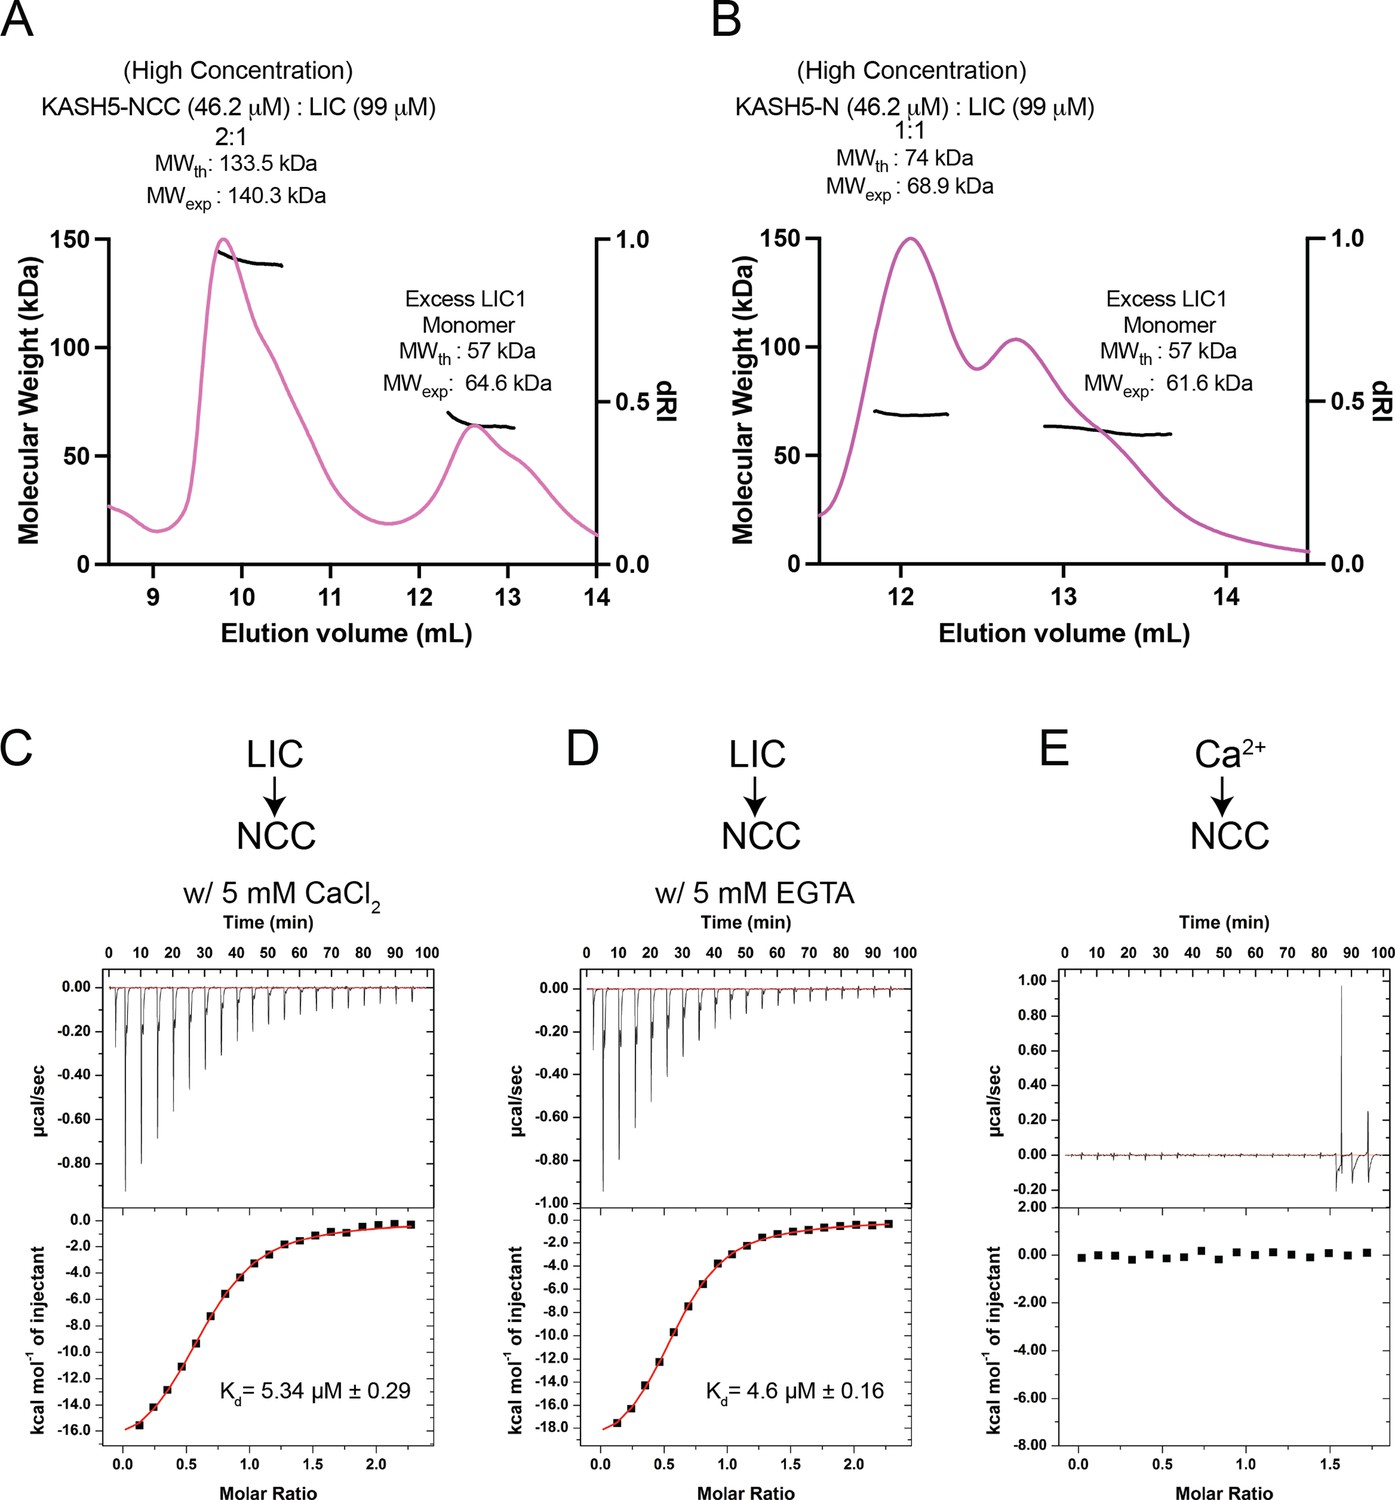
KASH5-NCC binds dynein in a 2:1 stoichiometry and in a Ca2+-independent manner.
(A) Size-exclusion chromatography (SEC)-multi-angle light scattering (MALS) analysis of the KASH5-NCC-dynein-light-intermediate chain (LIC) complex performed at the indicated (high) concentrations showing that the KASH5 NCC-LIC complex adopts a 2:1 stoichiometry. The shoulder associated with each peak is consistent with the amount of protein loaded, which is close to the maximum loading capacity of the SEC column. However, the MW measurement is uniform across the peaks as it depends on the homogeneity of the sample, not the peak profile, of the SEC column. n=1. (B) SEC-MALS analysis as in previous panel but performed with a mixture of KASH5-N and LIC. n=1. (C and D) Isothermal titration calorimetry (ITC) of KASH5-NCC in the presence of Ca2+ (C) or EGTA (D). (E) ITC of KASH5-NCC with Ca2+ shows no evidence for Ca2+ binding to the EF-hand pair of KASH5. n=1; ± indicated the error in curve fitting.
Figure 3 with 2 supplements

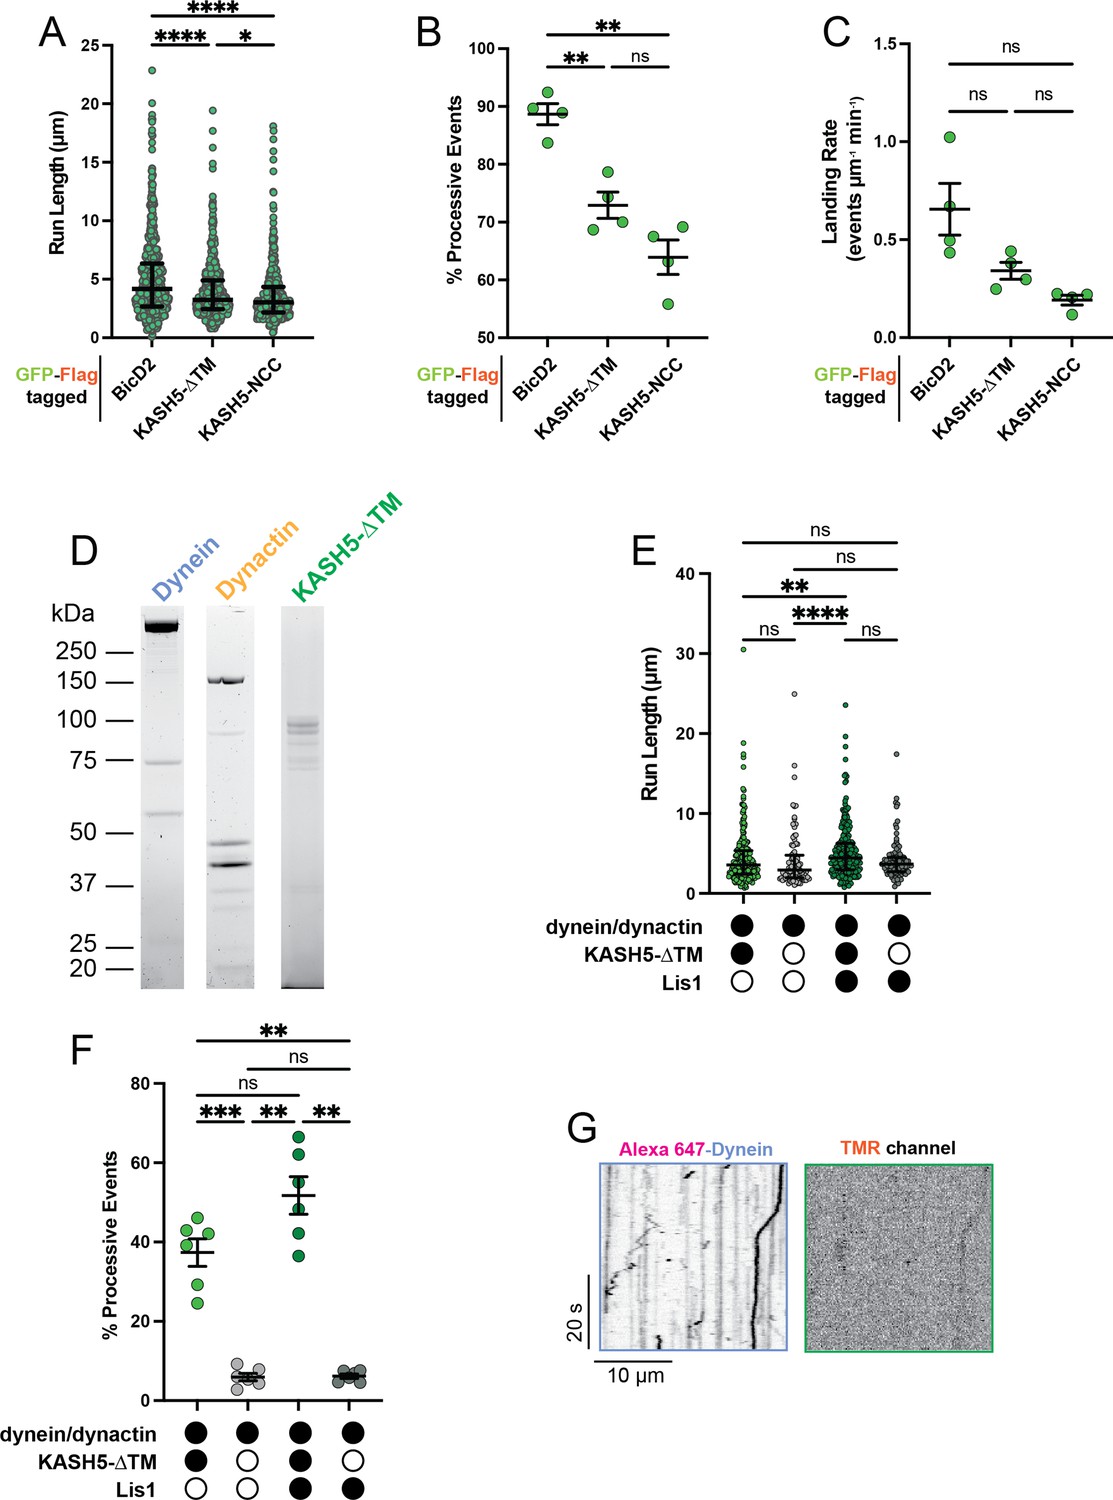
KASH5 activates dynein.
(A) Schematic for the IP-total internal reflection fluorescence (TIRF) assay to measure dynein motility of anti-FLAG immunoprecipitates of GFP-FLAG-tagged KASH5-ΔTM and BicD2. (B) Kymographs showing motility of immunoprecipitated complexes containing indicated GFP-FLAG-tagged constructs monitored by GFP fluorescence using TIRF microscopy. (C) Velocity of processive events from a total of two movies from two biological replicates (four movies analyzed in total). Each data point represents an individual processive event; n=694, 615, and 484 for BicD2, KASH5-ΔTM, and KASH5-NCC, respectively. Median and interquartile range shown. Significance determined from a Kruskal-Wallis test with Dunn’s multiple comparisons test. ns, not significant; **p≤0.01. (D) Schematic for the TIRF assay with purified proteins. (E and F) Kymographs of KASH5-dynein-dynactin complexes monitored by differentially fluorophore-labeled dynein and KASH5 in the absence (E) or presence (F) of Lis1. (G) Velocity of processive events from a total of two biological replicates (six movies analyzed in total). Each data point represents an individual processive event; n=398, 414, 174, and 146 for dynein and dynactin with KASH5, KASH5 +Lis1, Buffer, and Lis1, respectively. Median and interquartile range shown. Significance determined from a Kruskal-Wallis test with Dunn’s multiple comparisons test. ns, not significant; **p≤0.01; ****p≤0.0001. (H) Landing rate for the observed motile events with purified proteins and complexes from a total of two biological replicates (six movies analyzed in total). n values are derived from the average processive events/micron from all microtubules analyzed in a movie; n=6. Mean and SE of the mean shown. Significance determined from a Brown-Forsythe and Welch ANOVA test with Dunnett’s T3 multiple comparison test. *p≤0.05; **p≤0.01; ***p≤0.001.
-
Figure 3—source data 1
Numerical source data relating to Figure 3C, G and H.
- https://cdn.elifesciences.org/articles/78201/elife-78201-fig3-data1-v2.xlsx
Figure 3—figure supplement 1
Extended analysis for total internal reflection fluorescence (TIRF) experiments.
(A) Run length of processive events from IP-motility experiment from a total of two movies from two biological replicates. Each data point represents an individual event; n=694, 615, and 484 for BicD2, KASH5-ΔTM, and KASH5-NCC, respectively. Median and interquartile shown. Kruskal-Wallis test with Dunn’s multiple comparisons test performed to determine significance. *p≤0.05; ****p≤0.0001. (B) Percent of events that are processive and (C) landing rate for IP-motility experiment. Mean and SE of the mean shown. n values are derived from the average of all microtubules analyzed from a total of two movies from two biological replicates; n=4. Brown-Forsythe and Welch ANOVA with Dunnett’s T3 multiple comparison test was used to determine significance. ns, not significant; **p≤0.01. (D) Purified dynein, dynactin, and KASH5-ΔTM used in TIRF analysis. (E) Run length of reconstituted motility experiments with and without KASH5-ΔTM and/or Lis1 from a total of two biological replicates (six movies analyzed in total). Each point represents a single event; n=398, 414, 174, and 146 for dynein and dynactin with KASH5, KASH5 +Lis1, Buffer, and Lis1, respectively. Median and interquartile range shown. Significance determined via a Kruskal-Wallis test with Dunn’s multiple comparisons test. ns, not significant; **p≤0.01; ****p<0.0001. (F) Percent of total events that are processive for reconstituted motility experiments with and without KASH5-ΔTM and/or Lis1 from a total of two biological replicates (six movies analyzed in total). Mean and SE of the mean shown. n values are derived from the average percent processive events from all microtubules analyzed in a movie; n=6. Significance was determined with a Brown-Forsythe and Welch ANOVA test with Dunnett’s T3 multiple comparison test. ns, not significant; **p≤0.01; ***p<0.001. (G) Kymograph showing little dynein motility in the absence of KASH5.
-
Figure 3—figure supplement 1—source data 1
Numerical source data relating to Figure 3—figure supplement 1.
- https://cdn.elifesciences.org/articles/78201/elife-78201-fig3-figsupp1-data1-v2.xlsx
-
Figure 3—figure supplement 1—source data 2
Unedited SDS-PAGE gels relating Figure 3—figure supplement 1D.
- https://cdn.elifesciences.org/articles/78201/elife-78201-fig3-figsupp1-data2-v2.pdf
Figure 3—figure supplement 2
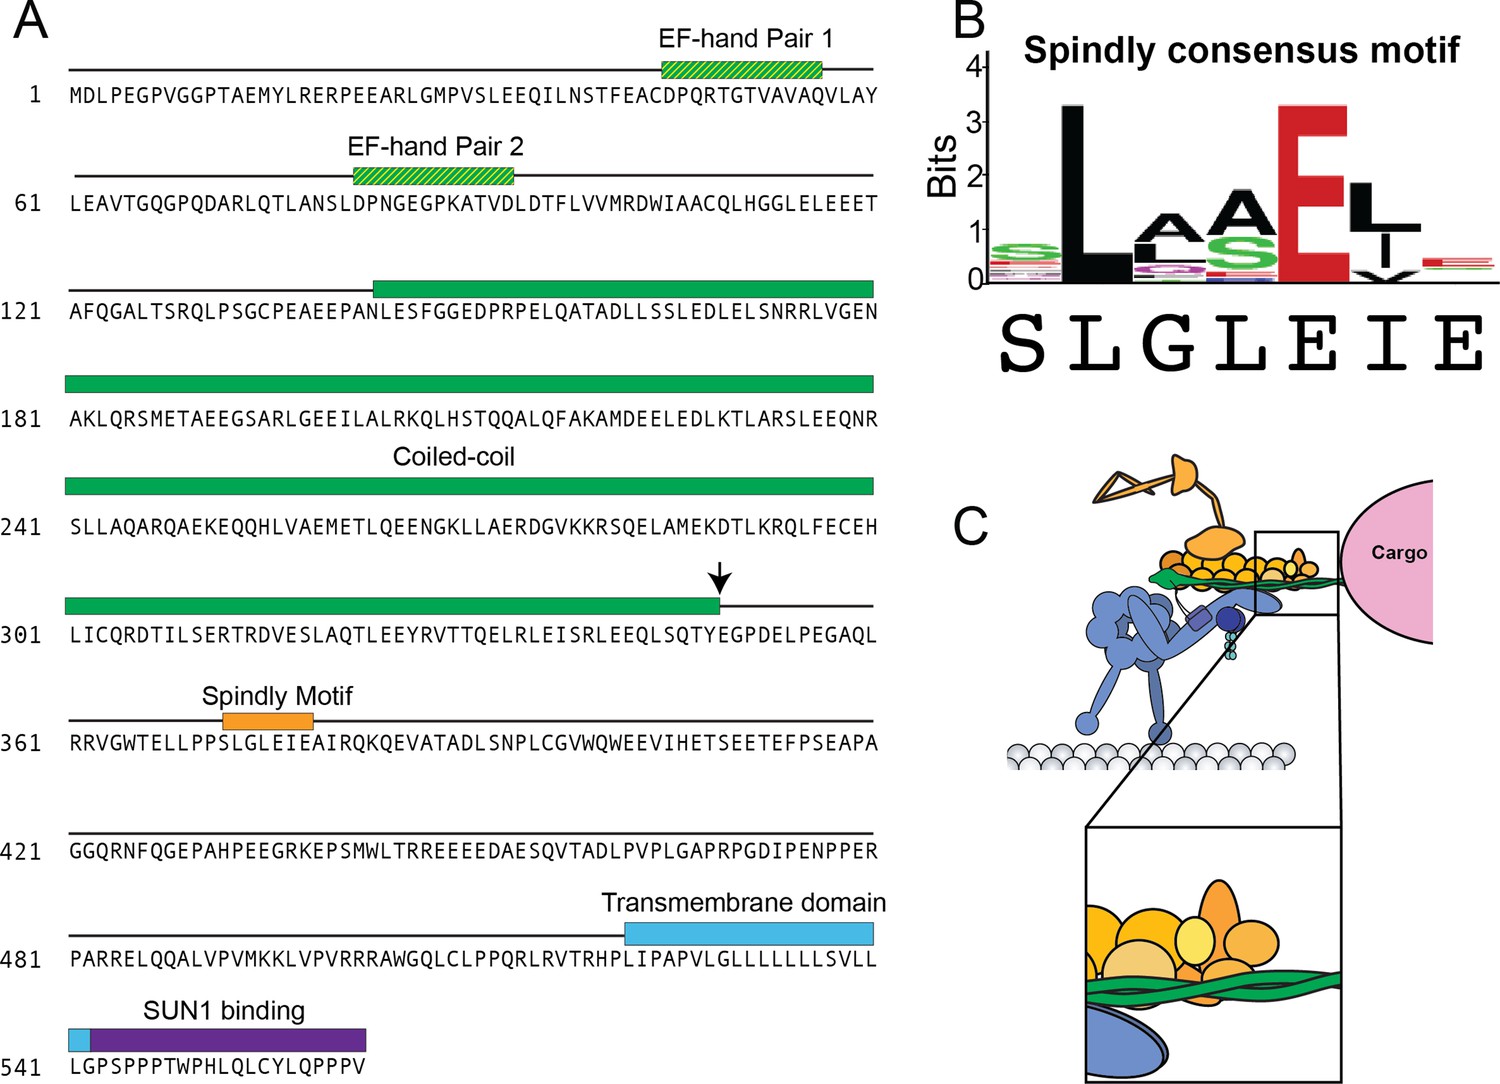
KASH5 contains a Spindly motif.
(A) Sequence of full-length KASH5 with domains colored as in Figure 1. Spindly motif shown in orange. Black error represents where the NCC construct is truncated. (B) Spindly consensus motif with KASH5’s Spindly sequence underneath. (C) The Spindly motif promotes binding between the pointed end of dynactin and the activating adaptor.
Figure 4 with 1 supplement
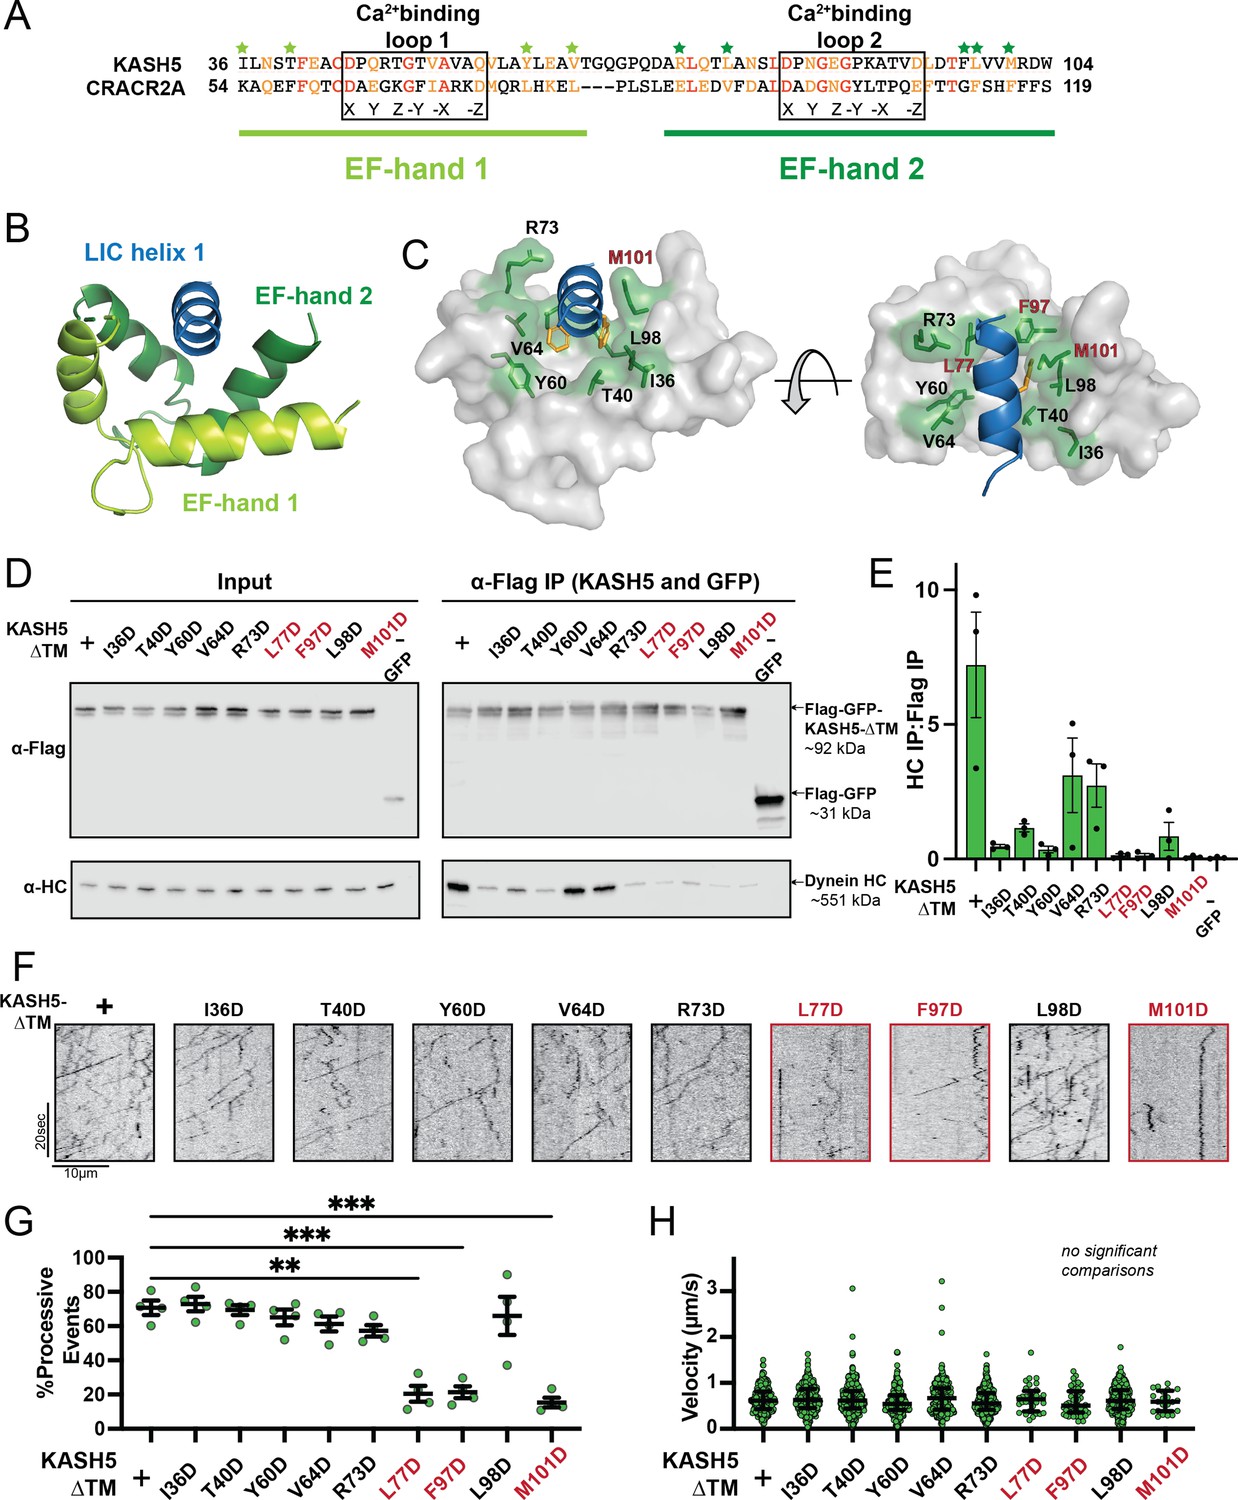
Mutations in the EF-hand of KASH5 abrogate association with active dynein complexes in the cell.
(A) Alignment of the EF-hand pairs of KASH5 and previously characterized dynein activator CRACR2A showing the putative Ca2+-binding loop. Conserved and similar residues are shown in red and orange, respectively. Residues that were mutated are indicated with green asterisks. (B and C) Homology model of the KASH5 EF-hand pair bound to the dynein light-intermediate chain (LIC) helix 1 with LIC F447/448 shown in orange and the putative KASH5 EF-hand residues mutated in this study that form a binding pocket around the helix shown in green. (D) Anti-FLAG co-immunoprecipitation (co-IP) analysis of HEK 293T cell lysates containing transiently transfected FLAG-tagged KASH5-ΔTM and indicated mutants; the three mutants with the most drastic binding defect highlighted in red. (E) The immunoprecipitation signal for dynein heavy chain (HC) was quantified for each of the samples represented in panel D by dividing the western blot band intensity of HC by that of the FLAG-KASH5-ΔTM band in that lane of the IP fraction. Mean and SE of the mean from a triplicate set of experiments are shown. (F) Representative kymographs from motility experiment for each mutant. (G) Percent processive events for each mutant. Mean and SE of the mean shown. Percent of processive events from a total of two movies from two biological replicates. n values are derived from the average percent processive events from all microtubules analyzed in a movie; n=4. Significance determined from a Brown-Forsythe and Welch ANOVA test with Dunnett’s T3 multiple comparison test. **p≤0.01; ***p≤0.001. Only pairwise comparisons with a p-value p≤0.05 are shown. (H) Velocities of processive events for each mutant. Median and interquartile shown. The distribution of velocities for each mutant was compared to KASH5-ΔTM with a Kruskal-Wallis test with Dunn’s multiple comparisons test. No pairwise comparison was significantly different. For most mutants, data was obtained from two movies from two biological replicates (four movies analyzed each). For L77D, F97D, and M101D, an additional biological replicate (i.e. an additional two movies) was collected to capture more events. Each data point represents an individual processive event; n=288, 488, 453, 284, 363, 417, 34, 43, 410, and 21 for wild type (WT), I36D, T40D, Y60D, V64D, R73D, L77D, F97D, L98D, and M101D, respectively.
-
Figure 4—source data 1
Numerical source data relating to Figure 4E, G and H.
- https://cdn.elifesciences.org/articles/78201/elife-78201-fig4-data1-v2.xlsx
-
Figure 4—source data 2
Unedited blots relating to Figure D.
- https://cdn.elifesciences.org/articles/78201/elife-78201-fig4-data2-v2.pdf
Figure 4—figure supplement 1
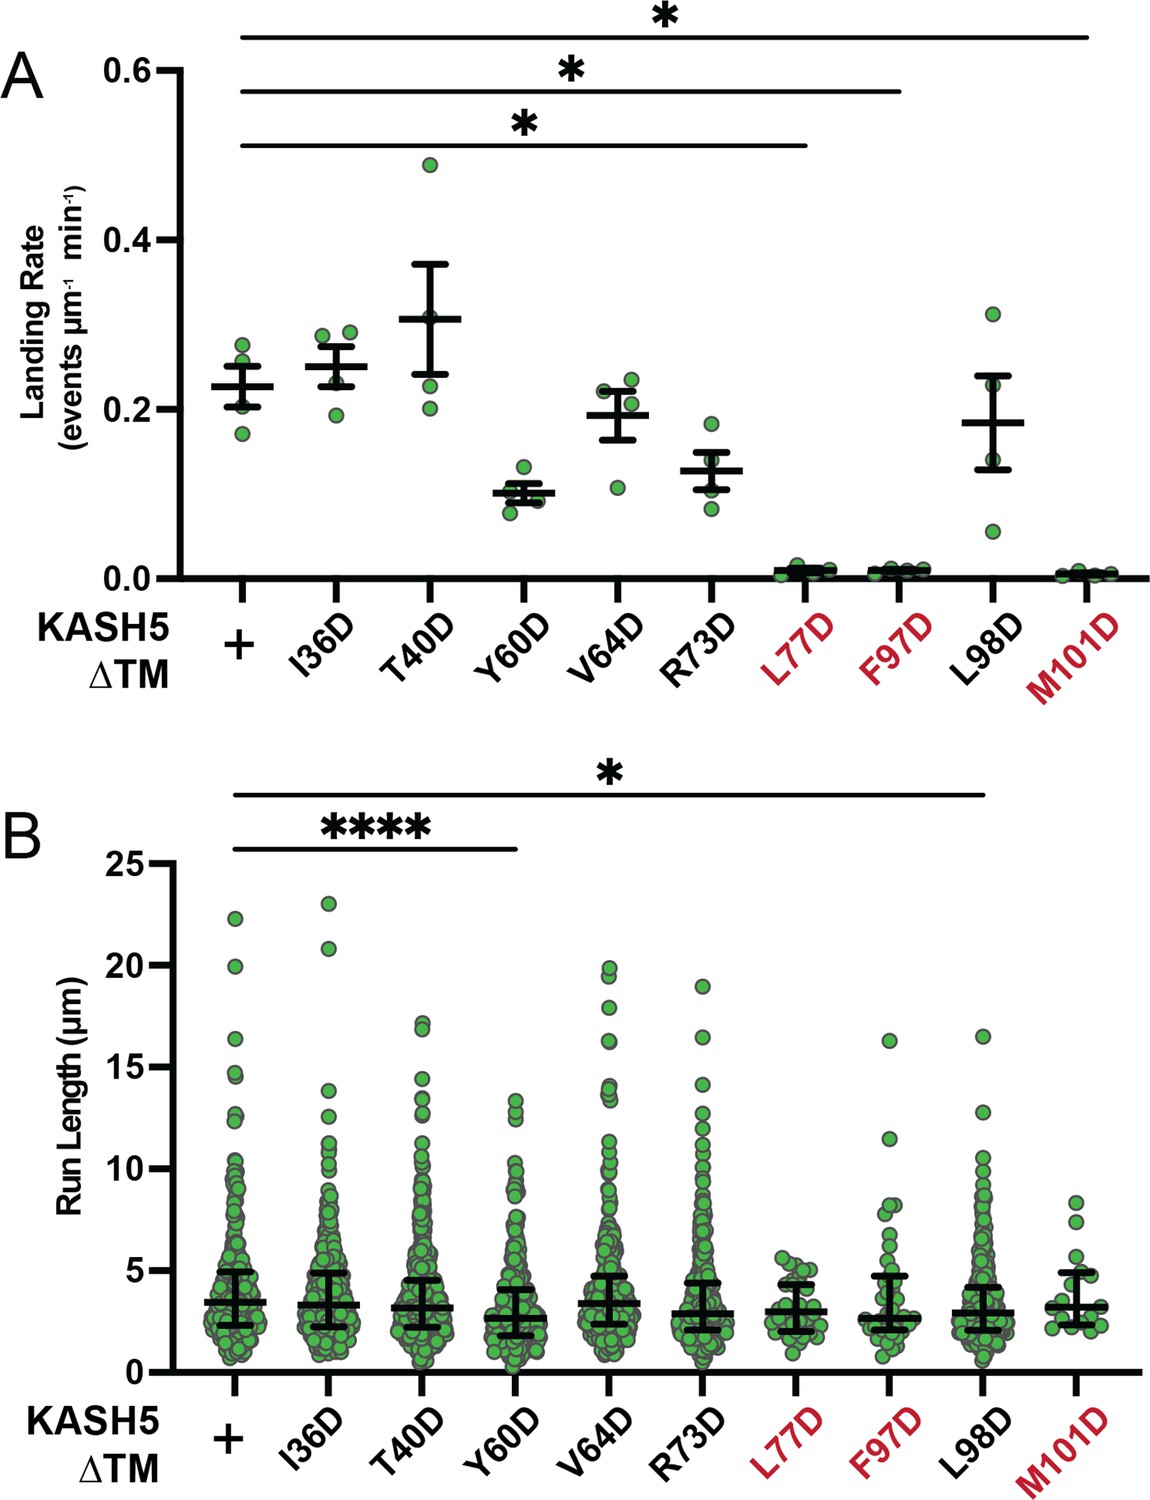
Extended motility analysis of KASH5 mutants.
(A) Landing rate of processive events for dynein immunoprecipitated with each KASH5 EF-hand mutant described. Mean and SE of the mean shown. n values are derived from the average of all microtubules analyzed from a total of two movies from two biological replicates; n=4. Significance determined with a Brown-Forsythe and Welch ANOVA test with Dunnett’s T3 multiple comparison test. *p≤0.05. (B) Run length for processive events for dynein immunoprecipitated with each KASH5 EF-hand mutant from a total of two movies from two biological replicates. Median and interquartile range shown. Each data point represents an individual processive event; n=288, 488, 453, 284, 363, 417, 34, 43, 410, and 21 for wild type (WT), I36D, T40D, Y60D, V64D, R73D, L77D, F97D, L98D, and M101D, respectively. Significance determined by a Kruskal-Wallis test with Dunn’s multiple comparisons test. *p≤0.05; ****p<0.0001.
-
Figure 4—figure supplement 1—source data 1
Numerical source data relating to (Figure 4—figure supplement 1A, B).
- https://cdn.elifesciences.org/articles/78201/elife-78201-fig4-figsupp1-data1-v2.xlsx
Figure 5

Disrupting the interaction between light-intermediate chain (LIC) and transiently expressed KASH5 inhibits dynein recruitment to the nuclear envelope (NE) of HeLa cells.
(A) A HeLa cell line stably expressing a GFP fusion of dynein heavy chain (HC) was transfected with indicated FLAG-tagged KASH5 constructs and SUN1-myc and analyzed by immunofluorescence against GFP, FLAG, and myc. Scale bar = 20 µm. (B and C) Mean and 95% CI shown for the ratio of the nuclear periphery signal versus cytoplasmic signal for GFP-dynein HC (B) and FLAG-KASH5 (C). Each data point represents the ratio of NE: cytoplasmic intensity of dynein or KASH5 in a single cell from a total of two biological replicates. n=94, 67, 45, 102, 45, 66, and 45 for untransfected, SUN1 only, KASH5-ΔTM, KASH5-FL, KASH5-FLL77D, KASH5-FLF97D, and KASH5-FLM101D. Kruskal-Wallis test was performed for every pairwise comparison for (B) and (C). *p≤0.05; **p≤0.01; ***p≤0.001; ****p≤0.0001. Only pairwise comparisons with a p-value p≤0.05 are shown.
-
Figure 5—source data 1
Numerical source data relating to Figure 5B and C.
- https://cdn.elifesciences.org/articles/78201/elife-78201-fig5-data1-v2.xlsx
Figure 6 with 1 supplement
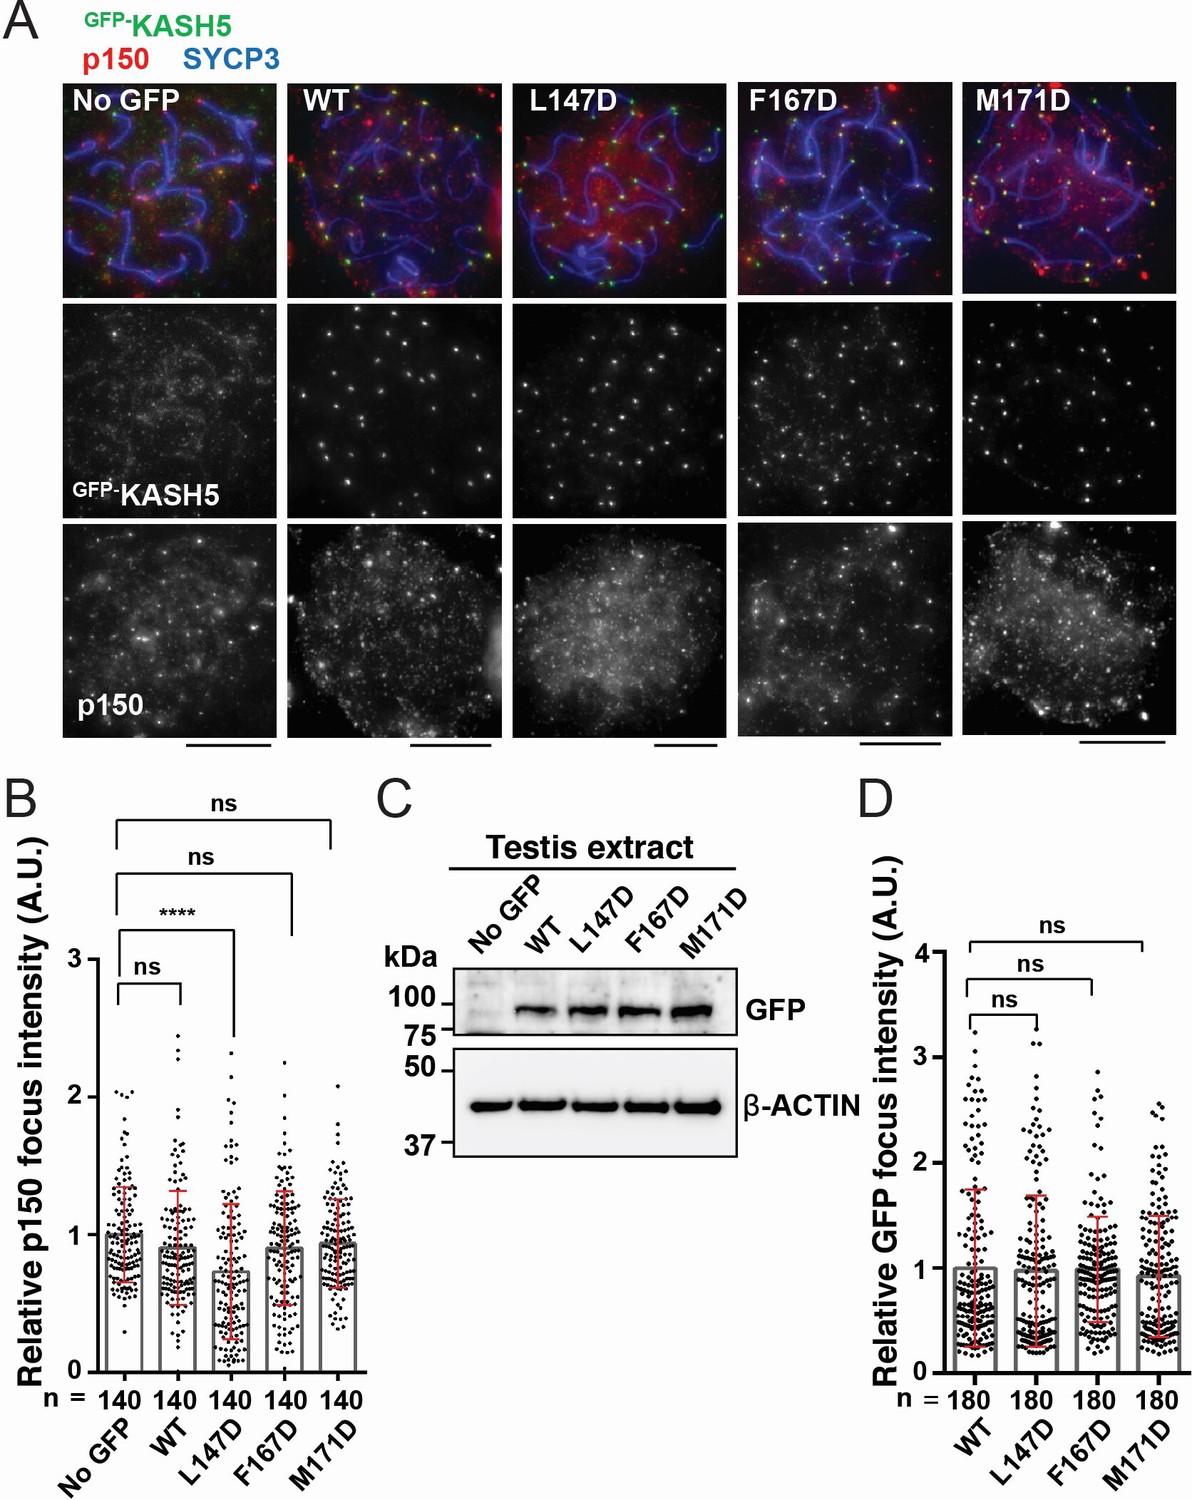
Disrupting the interaction between KASH5 and light-intermediate chain (LIC) inhibits dynactin localization at nuclear envelope-tethered telomeres in mouse spermatocytes.
(A) Immunostaining of wild type (WT) pachytene spermatocytes expressing GFP-KASH5 by in vivo electroporation. Scale bar = 5 μm. (B) The quantification of p150 signal intensities normalized with the average value of GFP negative cells. Mean values with SD are shown. n shows the analyzed foci number pooled from seven cells; n=140. ns, not significant; ****p<0.0001 by Dunnett’s multiple comparisons test. (C) Immunoblot of testis extracts without electroporation (no GFP) or after electroporating GFP-KASH5 WT and indicated KASH5 mutants, probed with the indicated antibodies. GFP and actin blots in each lane correspond to the same processed sample run on the same gel but blotted sequentially after stripping. (D) The quantification of GFP foci intensities normalized with the average value of WT. Mean values with SD are shown. n shows the analyzed foci number pooled from nine cells from electroporated mice; n=180. All analyses used Dunnett’s multiple comparisons test: ns, not significant; *** p≤0.001.
-
Figure 6—source data 1
Numerical source data relating to Figure 6B and D.
- https://cdn.elifesciences.org/articles/78201/elife-78201-fig6-data1-v2.xlsx
-
Figure 6—source data 2
Unedited Blots relating to Figure 6C.
- https://cdn.elifesciences.org/articles/78201/elife-78201-fig6-data2-v2.pdf
Figure 6—figure supplement 1
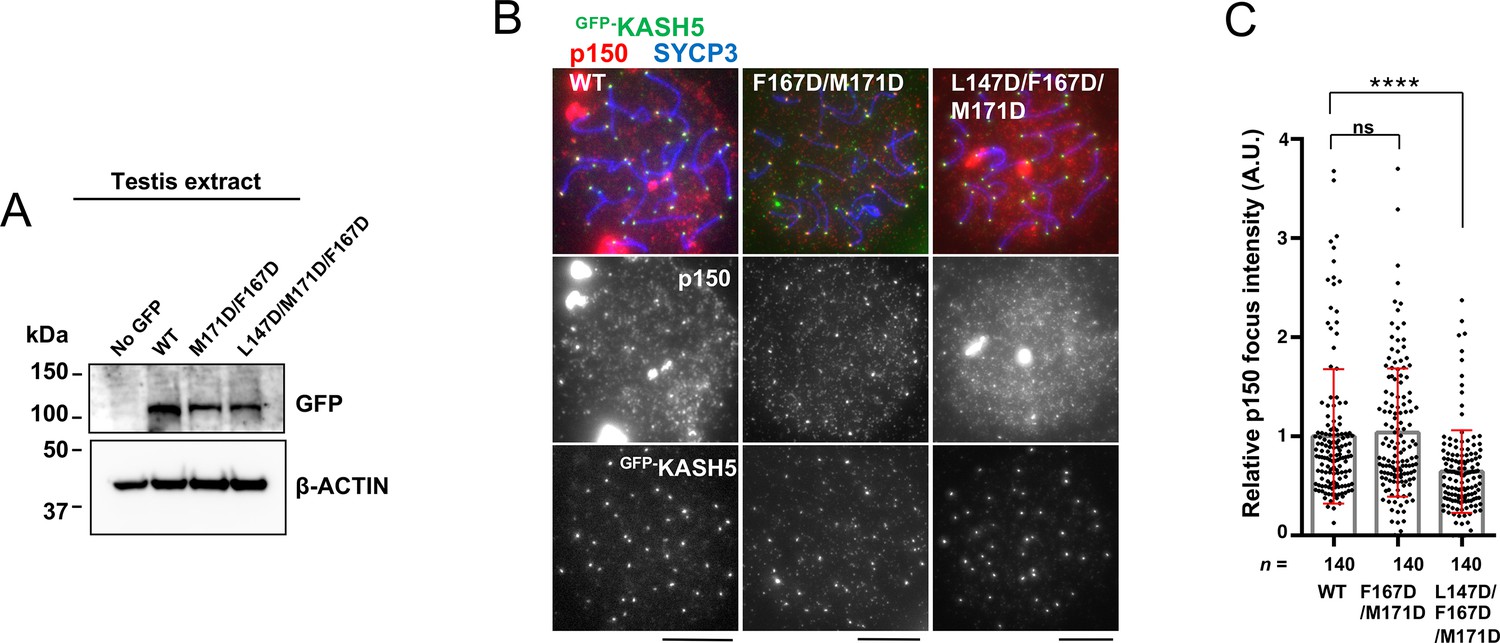
Combining mutations to disrupt the interaction between KASH5 and light-intermediate chain (LIC) to inhibit dynactin localization in vivo.
(A) Immunoblot of testis extracts without electroporation (no GFP) or after electroporating GFP-KASH5 wild type (WT) and indicated KASH5 mutants, probed with the indicated antibodies. GFP and actin blots in each lane correspond to the same processed sample run on the same gel but blotted sequentially after stripping. (B) Immunostaining of WT pachytene spermatocytes expressing GFP-KASH5 by in vivo electroporation. Scale bar = 5 μm. (C) The quantification of p150 signal intensities normalized with the average value of GFP-KASH5 WT expressing cells. Mean values with SD are shown. n shows the analyzed foci number pooled from seven cells; n=140. ns, not significant; ****p<0.0001 by Dunnett’s multiple comparisons test.
-
Figure 6—figure supplement 1—source data 1
Numerical source data relating to Figure 6—figure supplement 1C.
- https://cdn.elifesciences.org/articles/78201/elife-78201-fig6-figsupp1-data1-v2.xlsx
-
Figure 6—figure supplement 1—source data 2
Unedited blots related to Figure 6—figure supplement 1A.
- https://cdn.elifesciences.org/articles/78201/elife-78201-fig6-figsupp1-data2-v2.pdf
Additional files
-
Supplementary file 1
Summary of statistical information.
This table contains all Kd values determined via isothermal titration calorimetry (ITC); all median velocity, mean percent processivity, median run length, and mean landing rates determined via total internal reflection fluorescence (TIRF); all median intensities determined via immunofluorescence; and reports all statistical tests used and all p-values determined in the manuscript.
- https://cdn.elifesciences.org/articles/78201/elife-78201-supp1-v2.docx
-
Transparent reporting form
- https://cdn.elifesciences.org/articles/78201/elife-78201-transrepform1-v2.docx
-
Source data 1
Supplemental files.
- https://cdn.elifesciences.org/articles/78201/elife-78201-data1-v2.zip
Download links
A two-part list of links to download the article, or parts of the article, in various formats.
Downloads (link to download the article as PDF)
Open citations (links to open the citations from this article in various online reference manager services)
Cite this article (links to download the citations from this article in formats compatible with various reference manager tools)
The KASH5 protein involved in meiotic chromosomal movements is a novel dynein activating adaptor
eLife 11:e78201.
https://doi.org/10.7554/eLife.78201


