Fat2 polarizes the WAVE complex in trans to align cell protrusions for collective migration
- Department of Molecular Genetics and Cell Biology, University of Chicago, United States
- Committee on Development, Regeneration, and Stem Cell Biology, University of Chicago, United States
- Institute for Biophysical Dynamics, University of Chicago, United States
Figures
Figure 1
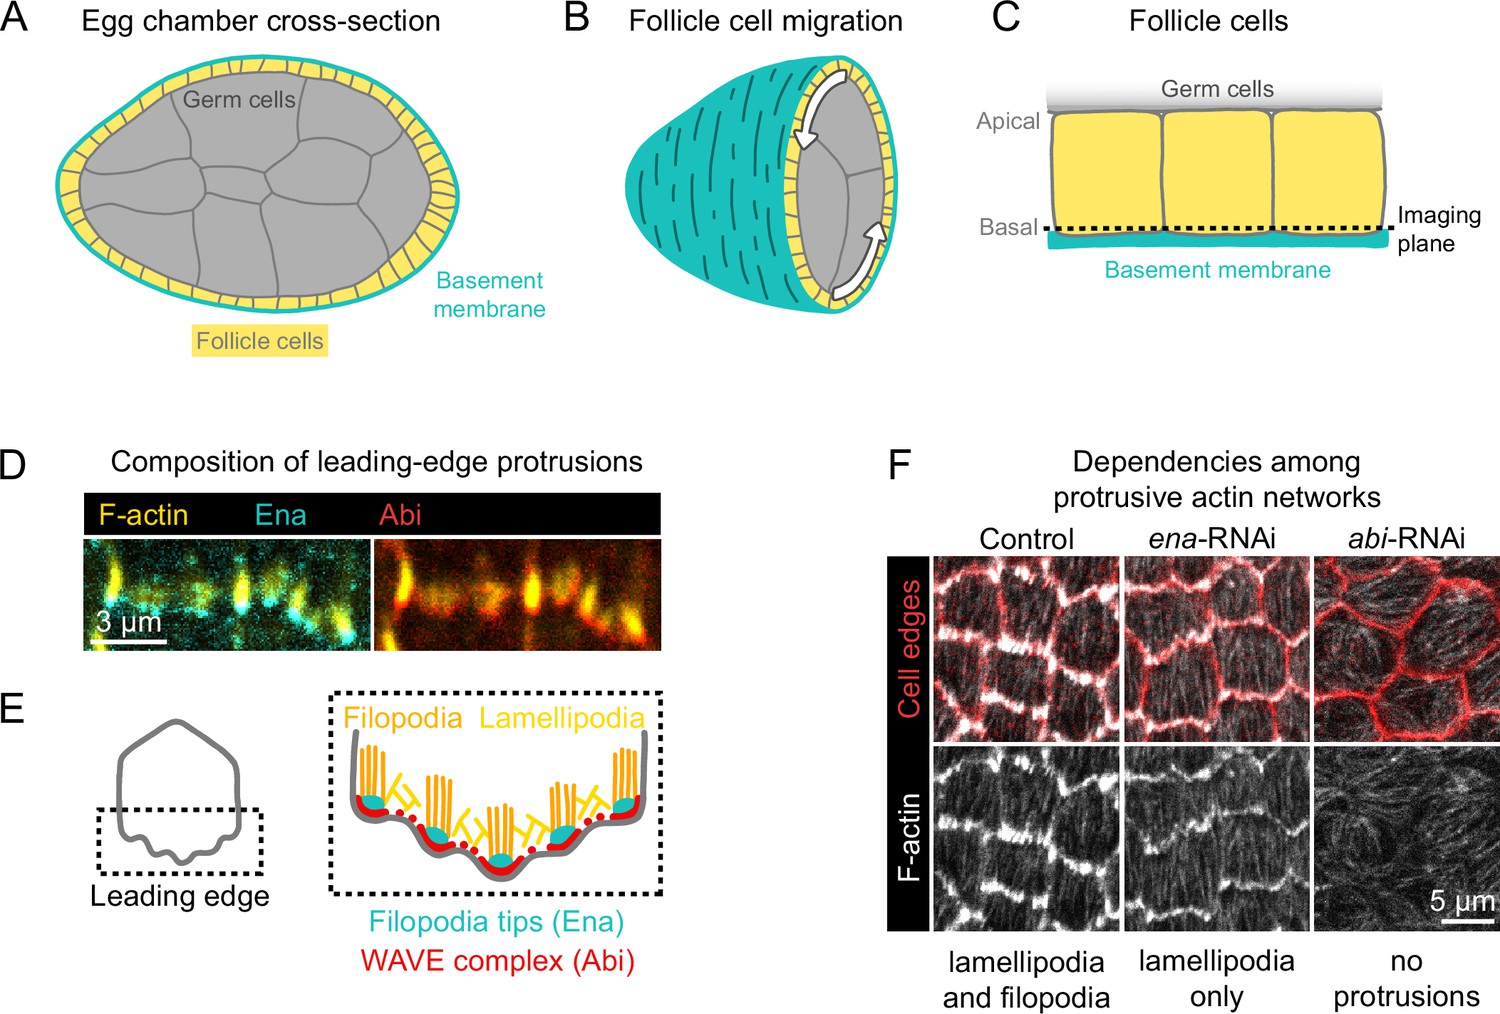
Introduction to egg chamber rotation and follicle cell protrusions.
(A) Diagram of a stage 6 egg chamber in cross-section. Anterior is left, posterior right. (B) Three-dimensional diagram of an egg chamber with the anterior half shown. Arrows indicate the migration of follicle cells along the basement membrane and the resulting rotation of the egg chamber around its anterior-posterior axis. (C) Diagram of three follicle cells. Their apical surfaces adhere to the germ cells and their basal surfaces adhere to the basement membrane. The dashed line represents the basal imaging plane used throughout this study except where indicated. (D) Images of the leading edges of two cells expressing Ena-GFP and WAVE complex label Abi-mCherry, and with F-actin stained with phalloidin. (E) Diagrams showing the organization of F-actin and its regulators at the leading edge. The WAVE complex builds a lamellipodial actin network, within which Ena builds filopodia. (F) Images of F-actin (phalloidin) and cell interfaces (anti-Discs Large) in control, ena-RNAi, and abi-RNAi backgrounds. Expression of ena-RNAi strongly depletes filopodia, revealing the less-prominent lamellipodial actin network, whereas abi-RNAi expression removes both filopodia and lamellipodia.
Figure 2
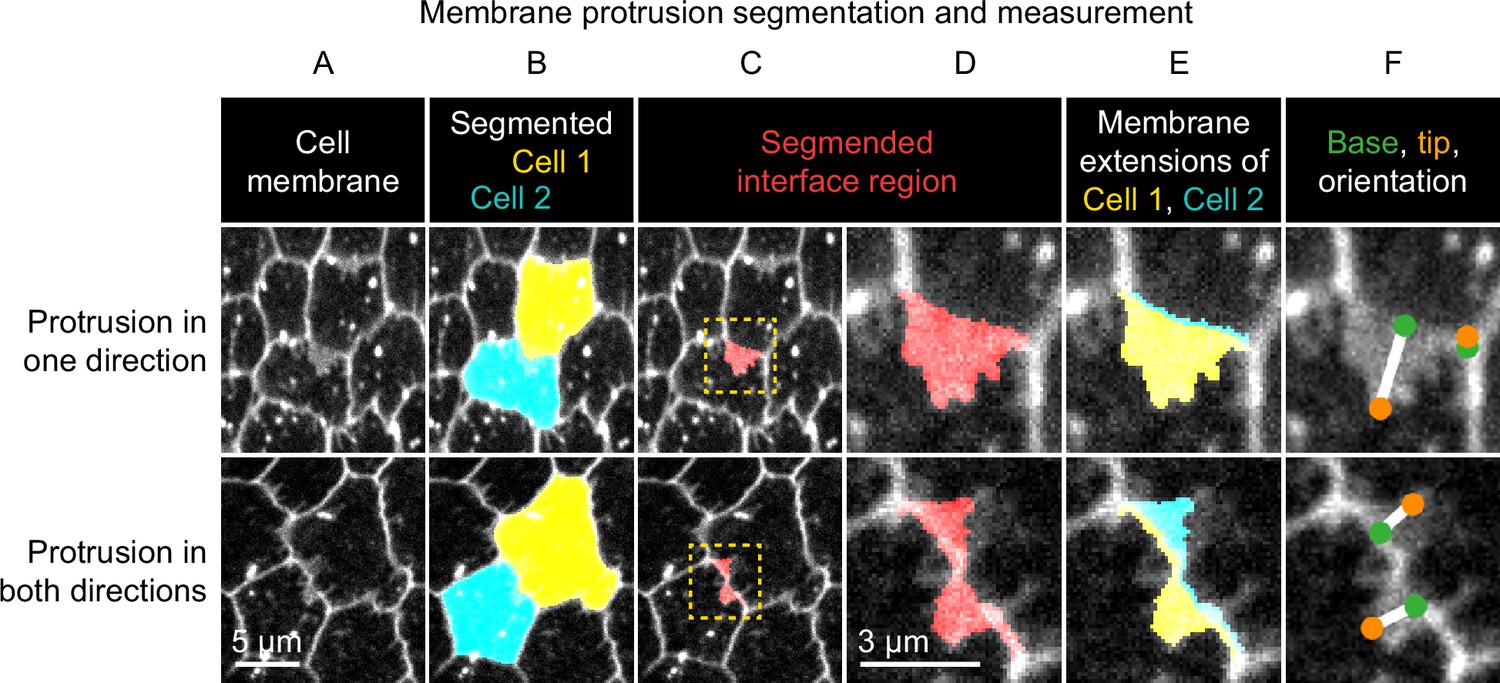
Method used to segment and measure membrane protrusions.
Top row shows an example of a pair of neighboring cells in which one cell is protruding across their shared interface. Bottom row shows a case in which both cells are protruding across the interface. (A) Cell interfaces and protrusions were labeled with a membrane dye and timelapses of the basal surface were collected. (B) Cells were automatically segmented with a watershed-based method, and segmentation errors were hand-corrected. (C) The bright interface region between each pair of neighboring cells was identified using a watershed-based method. This region includes the interface and any membrane protrusions that extend across it. (D) An enlargement of the boxed regions of (C). (E) The interface region was divided into two parts by the shortest path from vertex to vertex within the region, which approximates the true cell-cell interface position. The two resulting regions were then assigned to the cell from which they each extended. The area of these regions and the length of the interface between them were used to define average membrane extension length (as described in Materials and methods). (F) The tip and base of each region were identified, and then used to measure lengths and orientations (see Materials and methods).
Figure 3 with 5 supplements

Fat2 increases and polarizes follicle cell protrusivity.
(A) Timelapse frames of control, fat2, and CK-666-treated epithelia labeled with a membrane dye. Middle row shows segmented edges. Protrusive edges, defined as edges with average membrane extension lengths longer than the 98th percentile of those of CK-666-treated epithelia, are shown in red. Non-protrusive edges are white. Bottom row shows arrows indicating the orientation of each protrusion overlaid on labeled cell membrane. Arrows originate at protrusion bases and have lengths proportional to protrusion lengths. See related Figure 3—video 1 and Figure 3—video 3. (B) Histogram showing the distribution of average membrane extension lengths. The 98th percentile length threshold for CK-666-treated epithelia is indicated. (C) Plot showing the ratio of protrusive to total edges. The protrusivity of fat2 epithelia is variable, with a distribution overlapping with control and CK-666-treated epithelia. Welch’s ANOVA (W(2,9.3)=15.89, p=0.0012) with Dunnet’s T3 multiple comparisons test; n.s. p=0.07, *p=0.04, **p=0.004. Bars indicate mean ± SD. Counts of protrusive and total edges are listed in Figure 3—source data 1. See Figure 3—figure supplement 1 for alternate measurements of protrusivity. (D) Polar histograms of the distribution of protrusion orientations in control and fat2 epithelia. Anterior is left, posterior is right, and in control epithelia images were flipped as needed so that migration is always oriented downward. Bar areas scale with the fraction of protrusions. Protrusion counts are listed are in Figure 3—source data 1. Control protrusions point predominantly in the direction of migration, whereas fat2 protrusions are less polarized. Histograms from individual epithelia can be found in Figure 3—figure supplement 1.
-
Figure 3—source data 1
Sample sizes of dataset used to generate plots in Figure 3B-D, Figure 3—figure supplement 1, and Figure 7C.
- https://cdn.elifesciences.org/articles/78343/elife-78343-fig3-data1-v2.csv
-
Figure 3—source data 2
Membrane protrusivity of control, fat2, and CK-666-treated epithelia.
Used to generate Figure 3C.
- https://cdn.elifesciences.org/articles/78343/elife-78343-fig3-data2-v2.csv
Figure 3—figure supplement 1
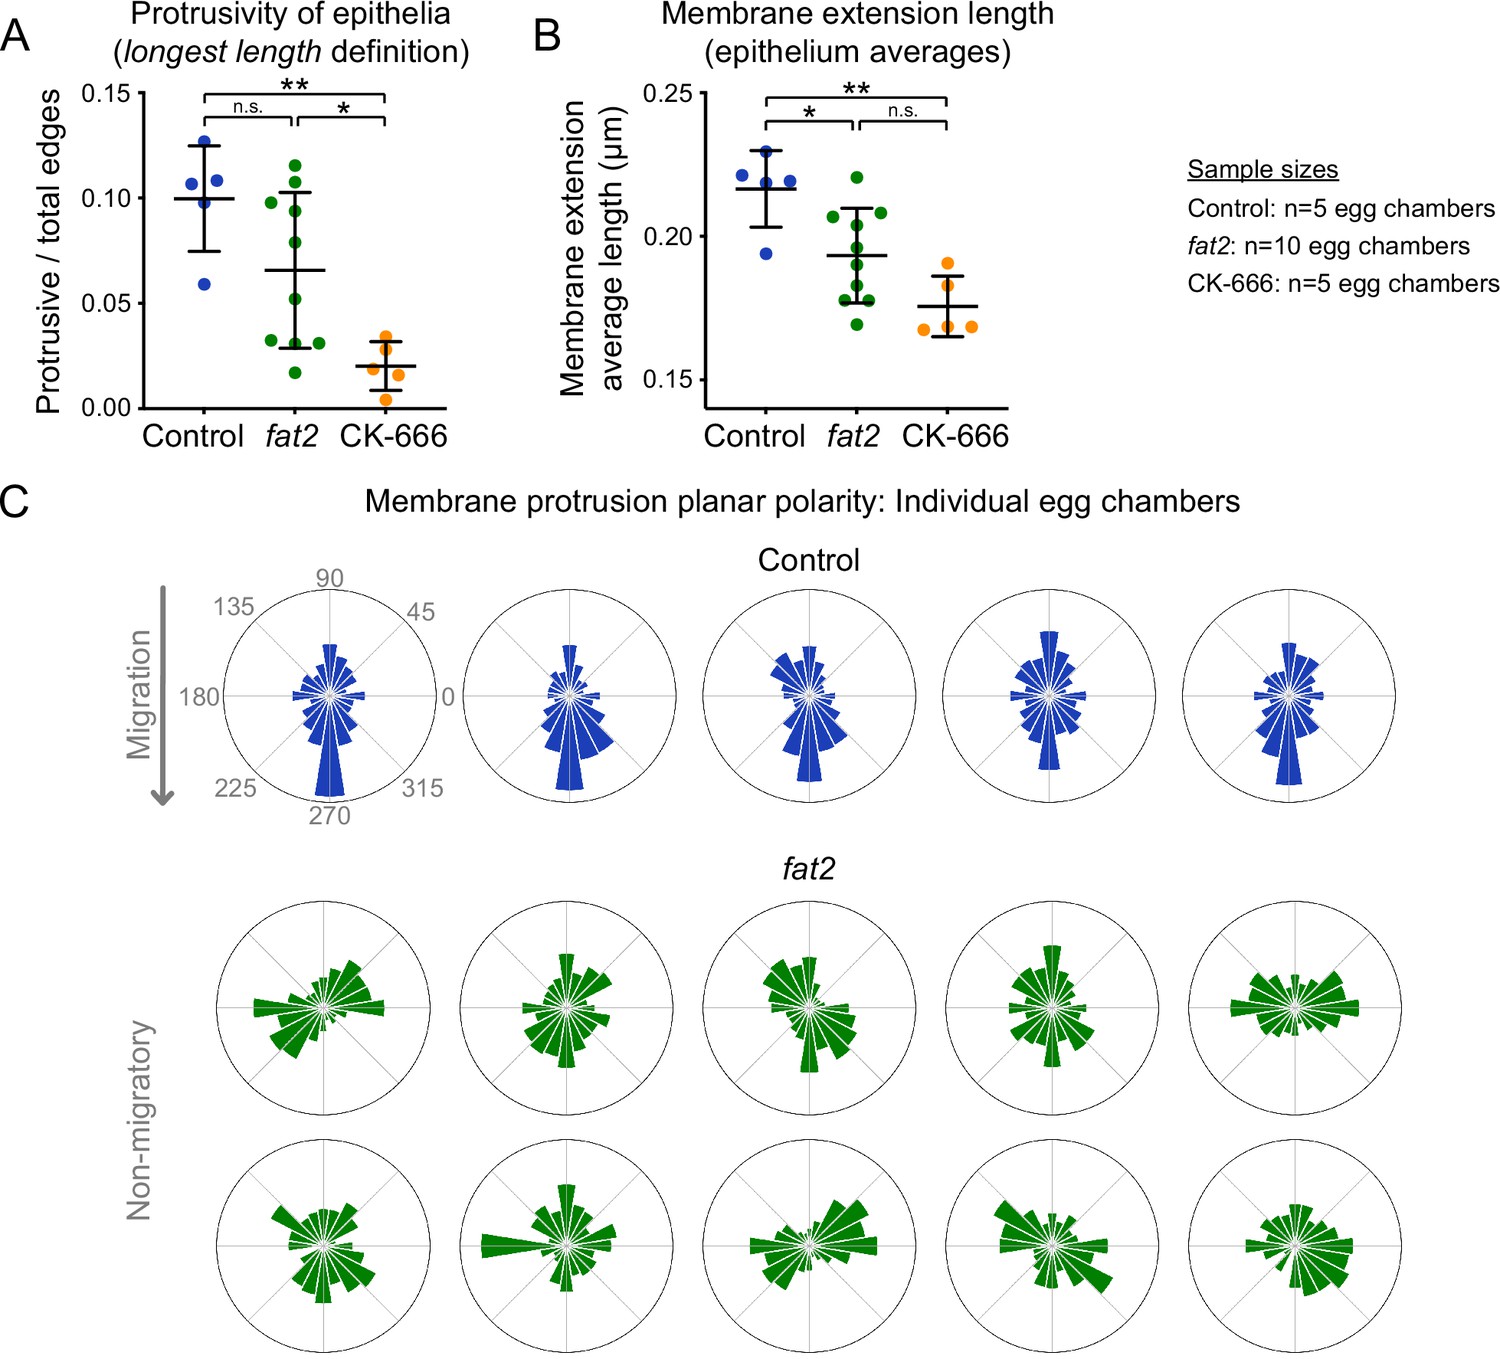
Membrane extension length and protrusion orientation in individual egg chambers.
(A) Plot showing the ratio of protrusive to total edges, with protrusivity defined in terms of membrane extension longest length (see Methods). In agreement with the average length definition, the protrusivity of fat2 epithelia is variable, with a distribution overlapping with control and CK-666-treated epithelia. Counts of protrusive and total edges are listed in Figure 3—source data 1. Welch’s ANOVA (W(2,9.4)=22.25, p=0.0003) with Dunnet’s T3 multiple comparisons test; n.s. p=0.16, *p=0.011, **p=0.0019. (B) Plot showing the mean membrane extension lengths of control, fat2, and CK-666-treated egg chambers, with membrane extension length defined as average length (see Materials and methods). With this cutoff-independent protrusivity measurement, the protrusivity of fat2 egg chambers is intermediate between control and CK-666, with a wider distribution that overlaps both. Welch’s ANOVA [W(2,9.7)=13.59, p=0.0015] with Dunnet’s T3 multiple comparisons test; n.s. p=0.076, *p=0.042, **p=0.0019. A,B, Bars indicate mean ± SD. (C) Polar histograms showing the distribution of membrane protrusion orientations in individual control and fat2 egg chambers. Anterior is left, posterior is right, and images were flipped as needed so that migration is downward for control epithelia, in which membrane protrusions are biased in the direction of migration. Bar areas scale with the fraction of protrusions. Protrusion counts are listed are in Figure 3—source data 1. In fat2 epithelia, protrusions have varying levels of axial bias and little or no vectorial bias.
Figure 3—figure supplement 2
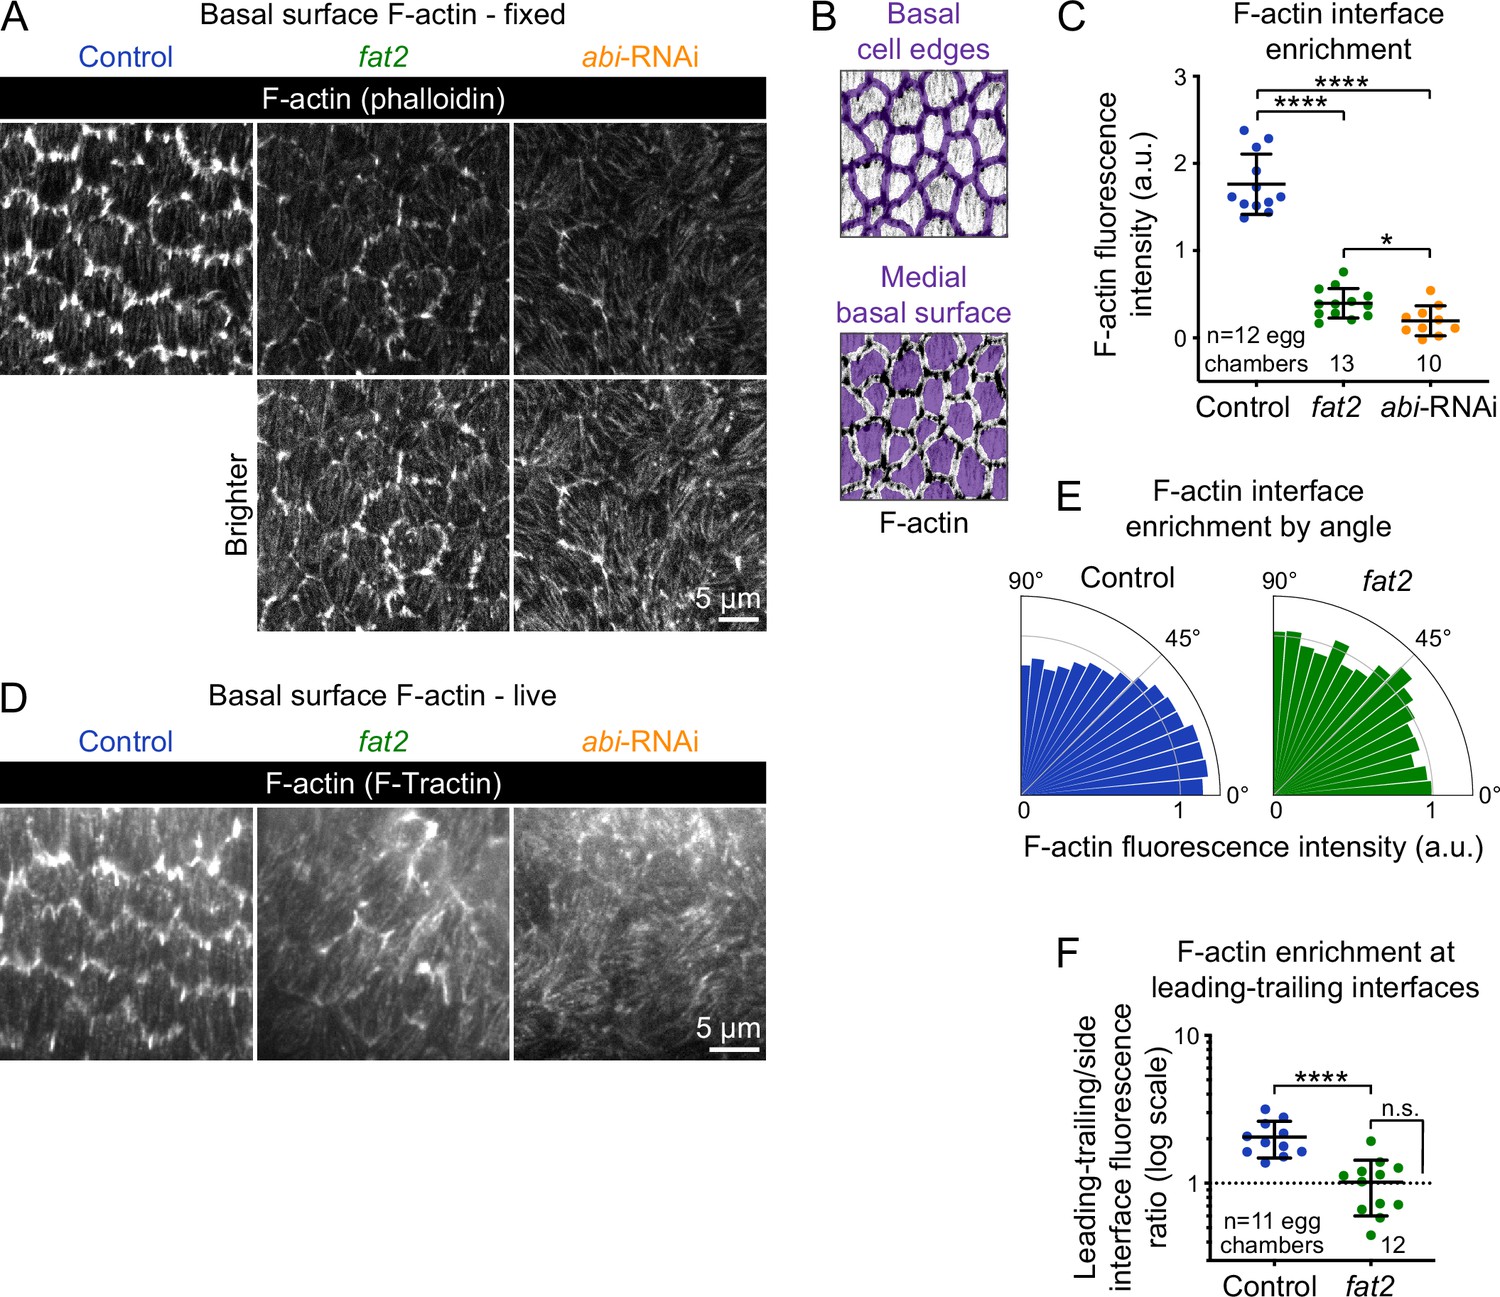
Actin protrusions are reduced and unpolarized without Fat2 and further reduced without the WAVE complex.
(A) Images showing phalloidin staining of F-actin in control, fat2, and abi-RNAi-expressing epithelia. Bottom row shows the same images with displayed brightness increased. (B) Examples of segmented cell-cell interfaces or medial basal surfaces overlayed on F-actin. (C) Plot of the difference in F-actin fluorescence intensity between cell interfaces and medial basal surfaces shows that while fat2 and abi-RNAi epithelia have less F-actin interface enrichment than control epithelia, F-actin interface enrichment remains higher in fat2 epithelia than abi-RNAi epithelia. Welch’s ANOVA [W(2, 19.84)=94.68, p<0.0001] with Dunnet’s T3 multiple comparisons test; *p=0.033, ****p<0.0001. (D) Frames from timelapse movies of control, fat2, and abi-RNAi epithelia with F-actin labeled with F-Tractin-tdTomato. As with phalloidin staining, the protrusivity of fat2 epithelia is intermediate between that of control and abi-RNAi epithelia. Brightness display settings vary between genotypes to correct for variability in F-Tractin-tdTomato expression levels. See related Figure 3—video 2. (E) Plot of F-actin fluorescence intensity at cell interfaces as a function of interface angular distance from horizontal. Bar areas are rescaled so that the mean in each condition is one. (F) Plot of the F-actin fluorescence intensity ratio between near-horizontal (0–10) and near-vertical (80-90) interfaces, corresponding with leading-trailing and side interfaces, respectively, in migratory control epithelia. F-actin is enriched along near-horizontal interfaces in control, but not fat2, egg chambers. Control-fat2 comparisons: unpaired t-test, ****p<0.0001. Comparison between fat2 and one (dashed line, the expectation if there is no enrichment): one sample t-test, n.s. p=0.88. (C,F) Bars indicate mean ± SD.
-
Figure 3—figure supplement 2—source data 1
F-actin enrichment at cell-cell interfaces of control, fat2, and abi-RNAi-expressing epithelia.
Used to generate Figure 3—figure supplement 2C.
- https://cdn.elifesciences.org/articles/78343/elife-78343-fig3-figsupp2-data1-v2.csv
-
Figure 3—figure supplement 2—source data 2
F-actin interface enrichment by angle in control and fat2 epithelia.
Used to generate Figure 3—figure supplement 2.
- https://cdn.elifesciences.org/articles/78343/elife-78343-fig3-figsupp2-data2-v2.csv
-
Figure 3—figure supplement 2—source data 3
F-actin enrichment at leading-trailing interfaces in control and fat2 epithelia.
Used to generate Figure 3—figure supplement 2.
- https://cdn.elifesciences.org/articles/78343/elife-78343-fig3-figsupp2-data3-v2.csv
Figure 3—video 1
Membrane protrusivity of control, fat2, and CK-666-treated epithelia.
Control, fat2, and CK-666-treated epithelia are labeled with a membrane dye. Bottom row shows segmented edges. Protrusive edges, defined as ones with with membrane extensions longer than the 98th percentile of those of CK-666-treated epithelia, are red. Non-protrusive edges are white. The control field of view moves to follow the cells as they migrate. Associated with Figure 3A.
Figure 3—video 2
F-actin protrusivity and protrusion polarity of control and fat2 epithelia.
Control, fat2, and abi-RNAi epithelia with F-actin labeled with F-Tractin-tdTomato. The protrusivity of fat2 epithelia is intermediate between that of control and abi-RNAi epithelia. Brightness display settings vary between genotypes to correct for variability in F-Tractin-tdTomato expression levels. Associated with Figure 3—figure supplement 2.
Figure 3—video 3
Protrusion orientation in control and fat2 epithelia.
Control and fat2 epithelia are labeled with a membrane dye, and arrows indicating the orientation of protrusions are overlayed. Arrows originate at protrusion bases and have lengths proportional to protrusion lengths. Associated with Figure 3.
Figure 4 with 1 supplement

Fat2 acts locally across the cell interface to orient membrane protrusions.
(A) Timelapse frame of a fat2 mosaic epithelium with cell membrane labeled, used to evaluate protrusion orientations in control or fat2 cells within a migratory context. Boxes indicate examples of leading-trailing interfaces between neighbor pairs with each possible combination of genotypes. Representative of 9 similar timelapse movies. See related Figure 4—video 1. (B) Larger images of the interfaces boxed in (A) showing that protrusions are misoriented when fat2 cells are ahead of the interface regardless of the genotype of the cell behind the interface. Arrows point in the direction of protrusion.
Figure 4—video 1
Membrane protrusion in a fat2 mosaic epithelium.
Used to evaluate protrusion orientations in control or fat2 cells within a migratory context. Boxes indicate examples of leading-trailing interfaces between neighbor pairs with each possible combination of genotypes.
Figure 5 with 2 supplements
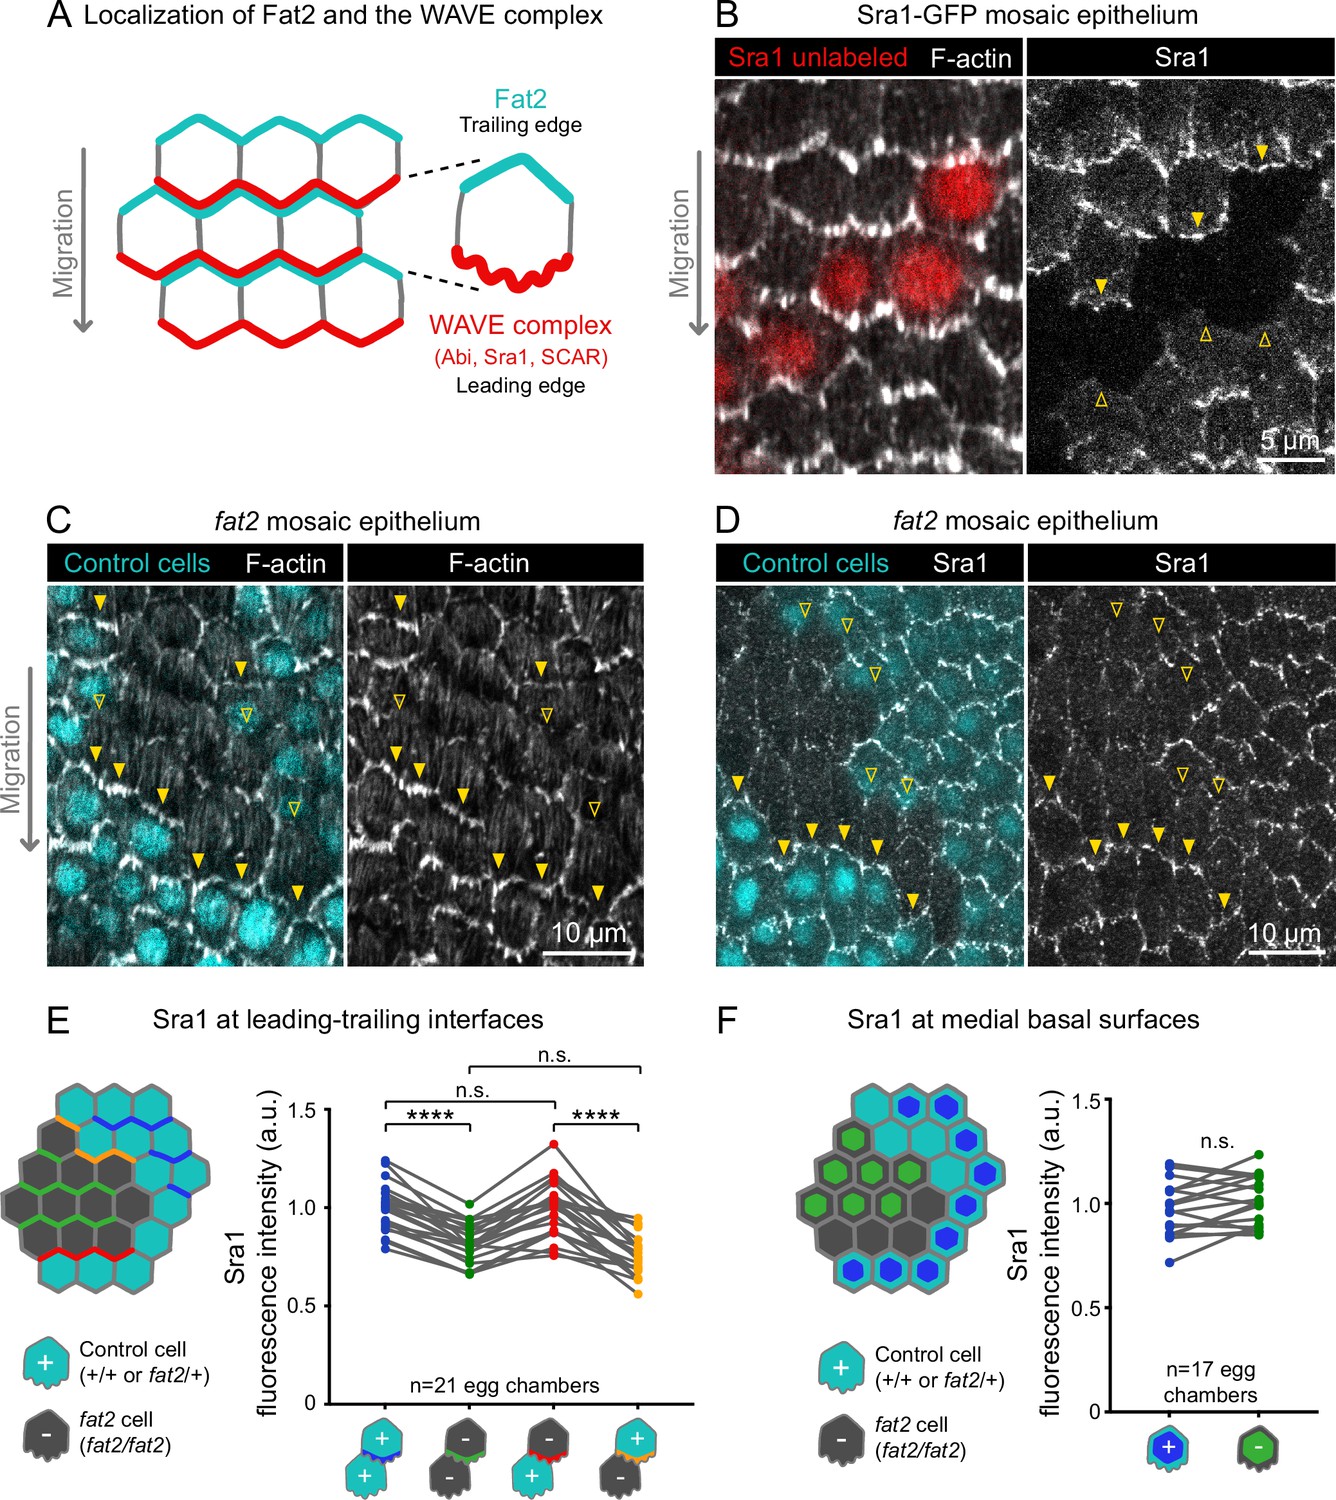
Fat2 in each cell concentrates the WAVE complex at the leading edge of the cell behind.
(A) Diagram showing Fat2 localization at the trailing edge and WAVE complex at the leading edge of the basal surface of follicle cells. The WAVE complex subunits referenced in this paper listed. (B) Images of an Sra1-GFP mosaic epithelium with phalloidin-stained F-actin, showing Sra1-GFP enrichment at leading edges (filled arrows) and not trailing edges (open arrows). (C) Images of a fat2 mosaic epithelium with phalloidin-stained F-actin. Filled arrows indicate leading edges of fat2 cells behind control cells, where protrusions are present. Open arrows indicate leading edges of control cells behind fat2 cells, where protrusions are reduced. (D) Images of a fat2 mosaic epithelium expressing Sra1-GFP. Filled arrows indicate leading edges of fat2 cells behind control cells. Open arrows indicate leading edges of control cells behind fat2 cells. (E,F) Quantification of Sra1-GFP mean fluorescence intensity in fat2 mosaic epithelia along leading-trailing interfaces (E) or medial basal surfaces (F) Diagrams to the left of plots show the measured regions with respect to control (cyan) and fat2 (gray) cells. The genotype(s) of cells in each measured category are shown below the x-axis. Lines connect measurements from the same egg chamber. (E) Sra1-GFP is reduced at the leading edge of cells of any genotype behind fat2 cells. Repeated measures ANOVA [F(3,80)=22.77, p<0.0001] with post-hoc Tukey’s test; n.s. (left to right) p=0.99, 0.24, ****p<0.0001. (F) Sra1-GFP is not significantly changed at the medial basal surface of fat2 cells. Paired t-test; n.s. p=0.08.
-
Figure 5—source data 1
Sra1 levels at the basal surface of fat2 mosaic epithelia.
Used to generate Figure 5E and F.
- https://cdn.elifesciences.org/articles/78343/elife-78343-fig5-data1-v2.csv
Figure 5—figure supplement 1
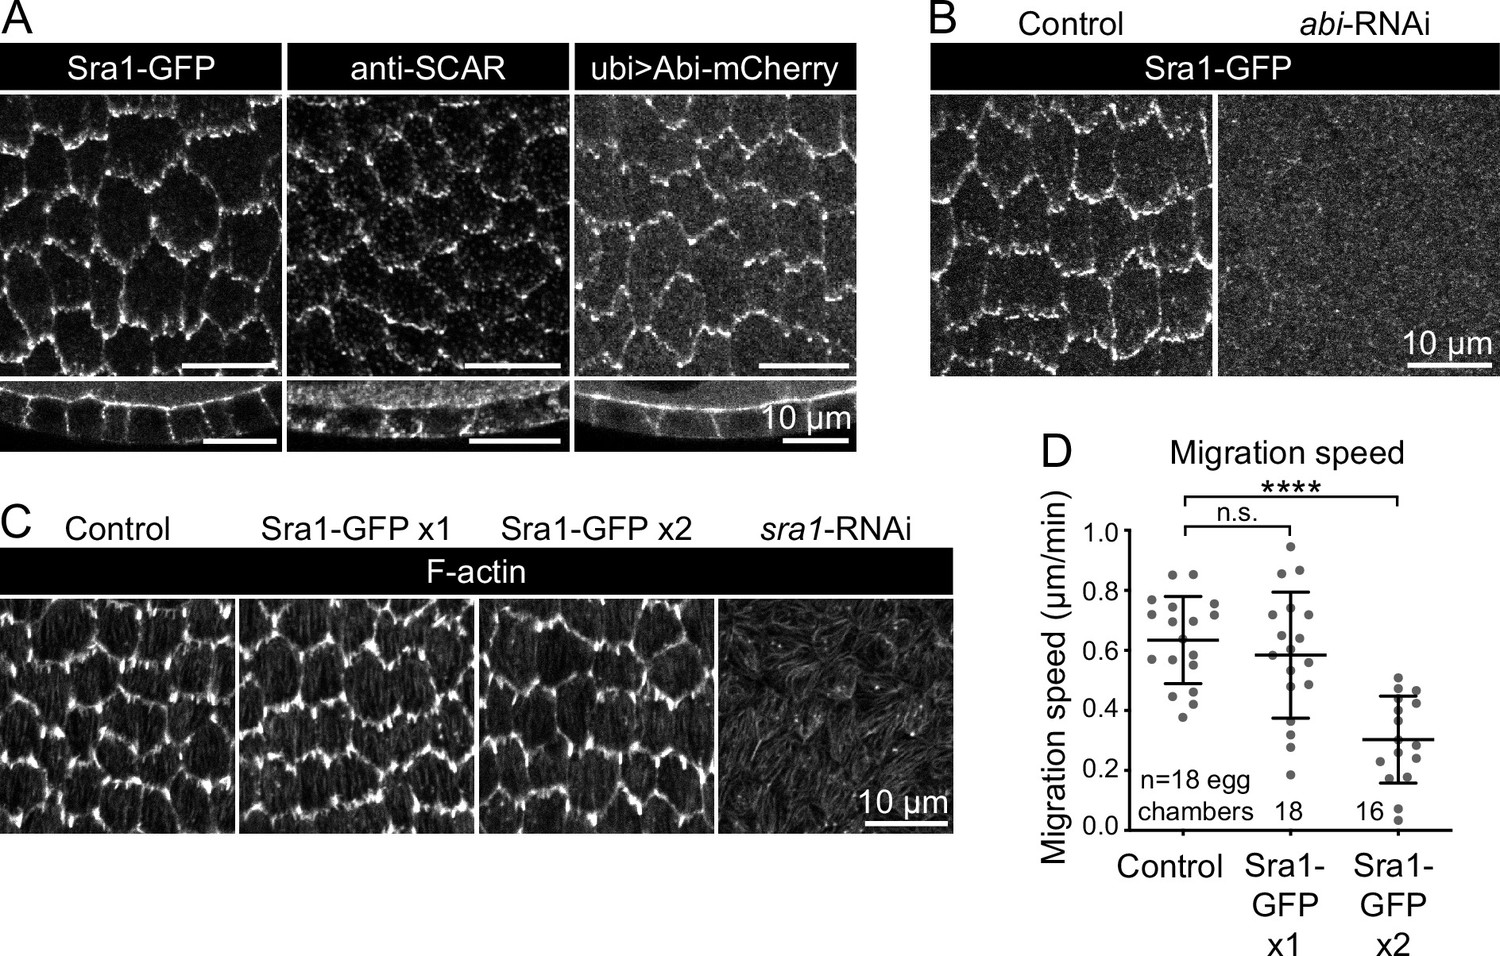
Evaluation of endogenous Sra1-GFP functionality.
(A) Images comparing the localization of markers of WAVE complex subunits: Sra1-GFP, Scar antibody, and Abi-mCherry, at the basal surface (top row) and in cross-section (bottom row). (B) Images of Sra1-GFP localization in control and abi-RNAi-expressing epithelia. Sra1-GFP is dispersed in the absence of Abi. (C) Images showing phalloidin-stained F-actin in epithelia with wild-type Sra1, one or two copies of Sra1-GFP, or expressing sra1-RNAi, used to assess the appearance of protrusions in each condition. (D) Plot of migration speed of epithelia with wild-type Sra1 or one or two copies of Sra1-GFP. Migration speed is reduced when both Sra1 copies are GFP-tagged. One-way ANOVA (F(2,49)=18.37, p<0.0001) with post-hoc Tukey’s test; n.s. 0.66, ****p<0.0001. Bars indicate mean ± SD.
-
Figure 5—figure supplement 1—source data 1
Migration speeds of epithelia expressing Sra1-GFP.
Used to generate Figure 5—figure supplement 1D.
- https://cdn.elifesciences.org/articles/78343/elife-78343-fig5-figsupp1-data1-v2.csv
Figure 5—figure supplement 2
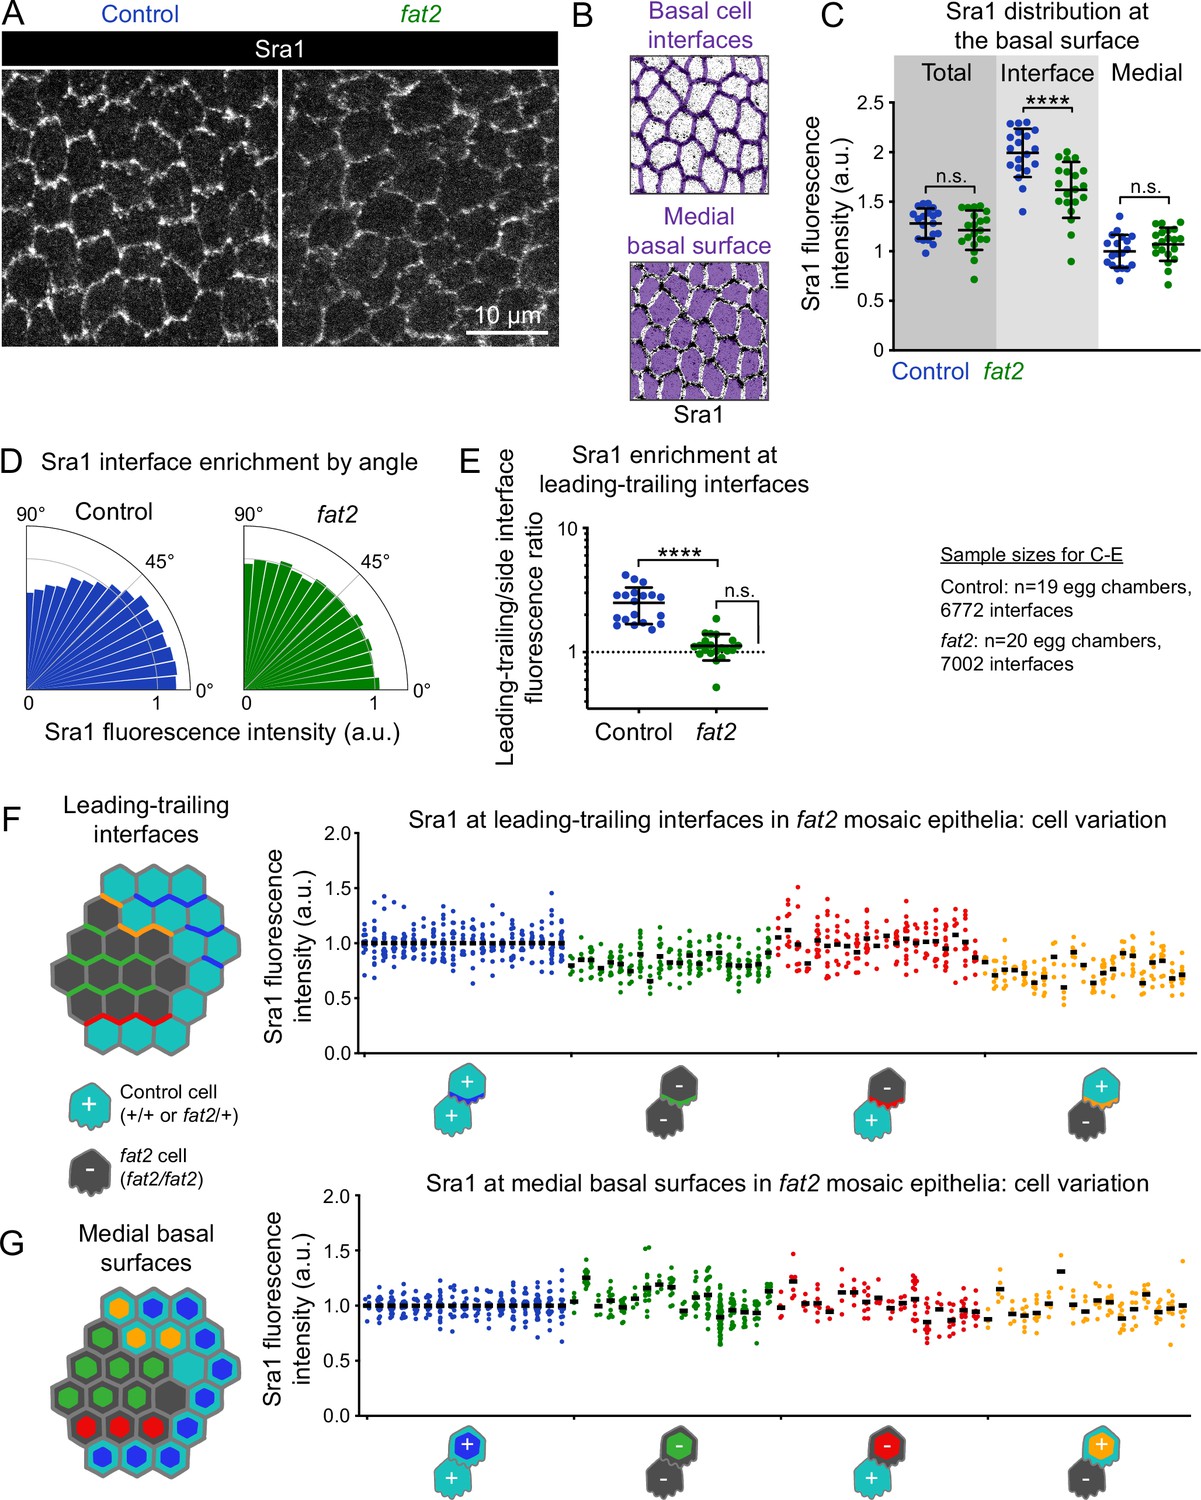
Fat2 concentrates the WAVE complex at cell-cell interfaces and polarizes it across the epithelium.
(A) Images of Sra1-GFP at the basal surface in control and fat2 epithelia. (B) Examples of segmented cell-cell interfaces or medial basal surfaces overlaid on Sra1-GFP images. (C) Plot of mean Sra1-GFP fluorescence intensity across the entire basal surface (total), at cell-cell interfaces, and at medial basal surfaces in control and fat2 epithelia. One-way ANOVA (F(5,111)=63.22, p<0.0001) with post-hoc Šidák’s test; n.s. (left to right) p=0.67, 0.64, ****p<0.0001. (D) Plot of Sra1-GFP fluorescence at cell-cell interfaces as a function of interface angular distance from horizontal. Bar areas are rescaled so that the mean in each condition is one. (E) Plot of the Sra1-GFP fluorescence intensity ratio between near-horizontal (0–10) and near-vertical (80-90) interfaces, corresponding with leading-trailing and side interfaces, respectively, in migratory control epithelia. Sra1-GFP is enriched along near-horizontal interfaces in control, but not fat2, egg chambers. Control-fat2 comparison: unpaired t-test, ****p<0.0001. Comparison between fat2 and one (dashed line, the expectation if there is no enrichment): one sample t-test, n.s. p=0.052. (C,E) Bars indicate mean ± SD. F,G, Quantification of Sra1-GFP mean fluorescence intensity in fat2 mosaic epithelia along leading-trailing interfaces (F) or medial basal surfaces (G) Diagrams to the left of plots show the measured regions with respect to control (cyan) and fat2 (gray) cells. The genotype(s) of cells in each measured category are shown below the x-axis. Each column shows data from one egg chamber with points from individual cells. Bars indicate mean. Tissue summary plots in Figure 5E and F.
-
Figure 5—figure supplement 2—source data 1
Sra 1 enrichment at cell-cell interfaces of control and fat2 epithelia.
Used to generate Figure 5—figure supplement 2.
- https://cdn.elifesciences.org/articles/78343/elife-78343-fig5-figsupp2-data1-v2.csv
-
Figure 5—figure supplement 2—source data 2
Sra 1 interface enrichment by angle in control and fat2 epithelia.
Used to generate Figure 5—figure supplement 2.
- https://cdn.elifesciences.org/articles/78343/elife-78343-fig5-figsupp2-data2-v2.csv
-
Figure 5—figure supplement 2—source data 3
Sra 1 enrichment at leading-trailing interfaces in control and fat2 epithelia.
Used to generate Figure 5—figure supplement 2.
- https://cdn.elifesciences.org/articles/78343/elife-78343-fig5-figsupp2-data3-v2.csv
-
Figure 5—figure supplement 2—source data 4
Sra 1 levels at the basal surface of cells in fat2 mosaic epithelia.
Used to generate Figure 5—figure supplement 2.
- https://cdn.elifesciences.org/articles/78343/elife-78343-fig5-figsupp2-data4-v2.csv
Figure 6 with 4 supplements
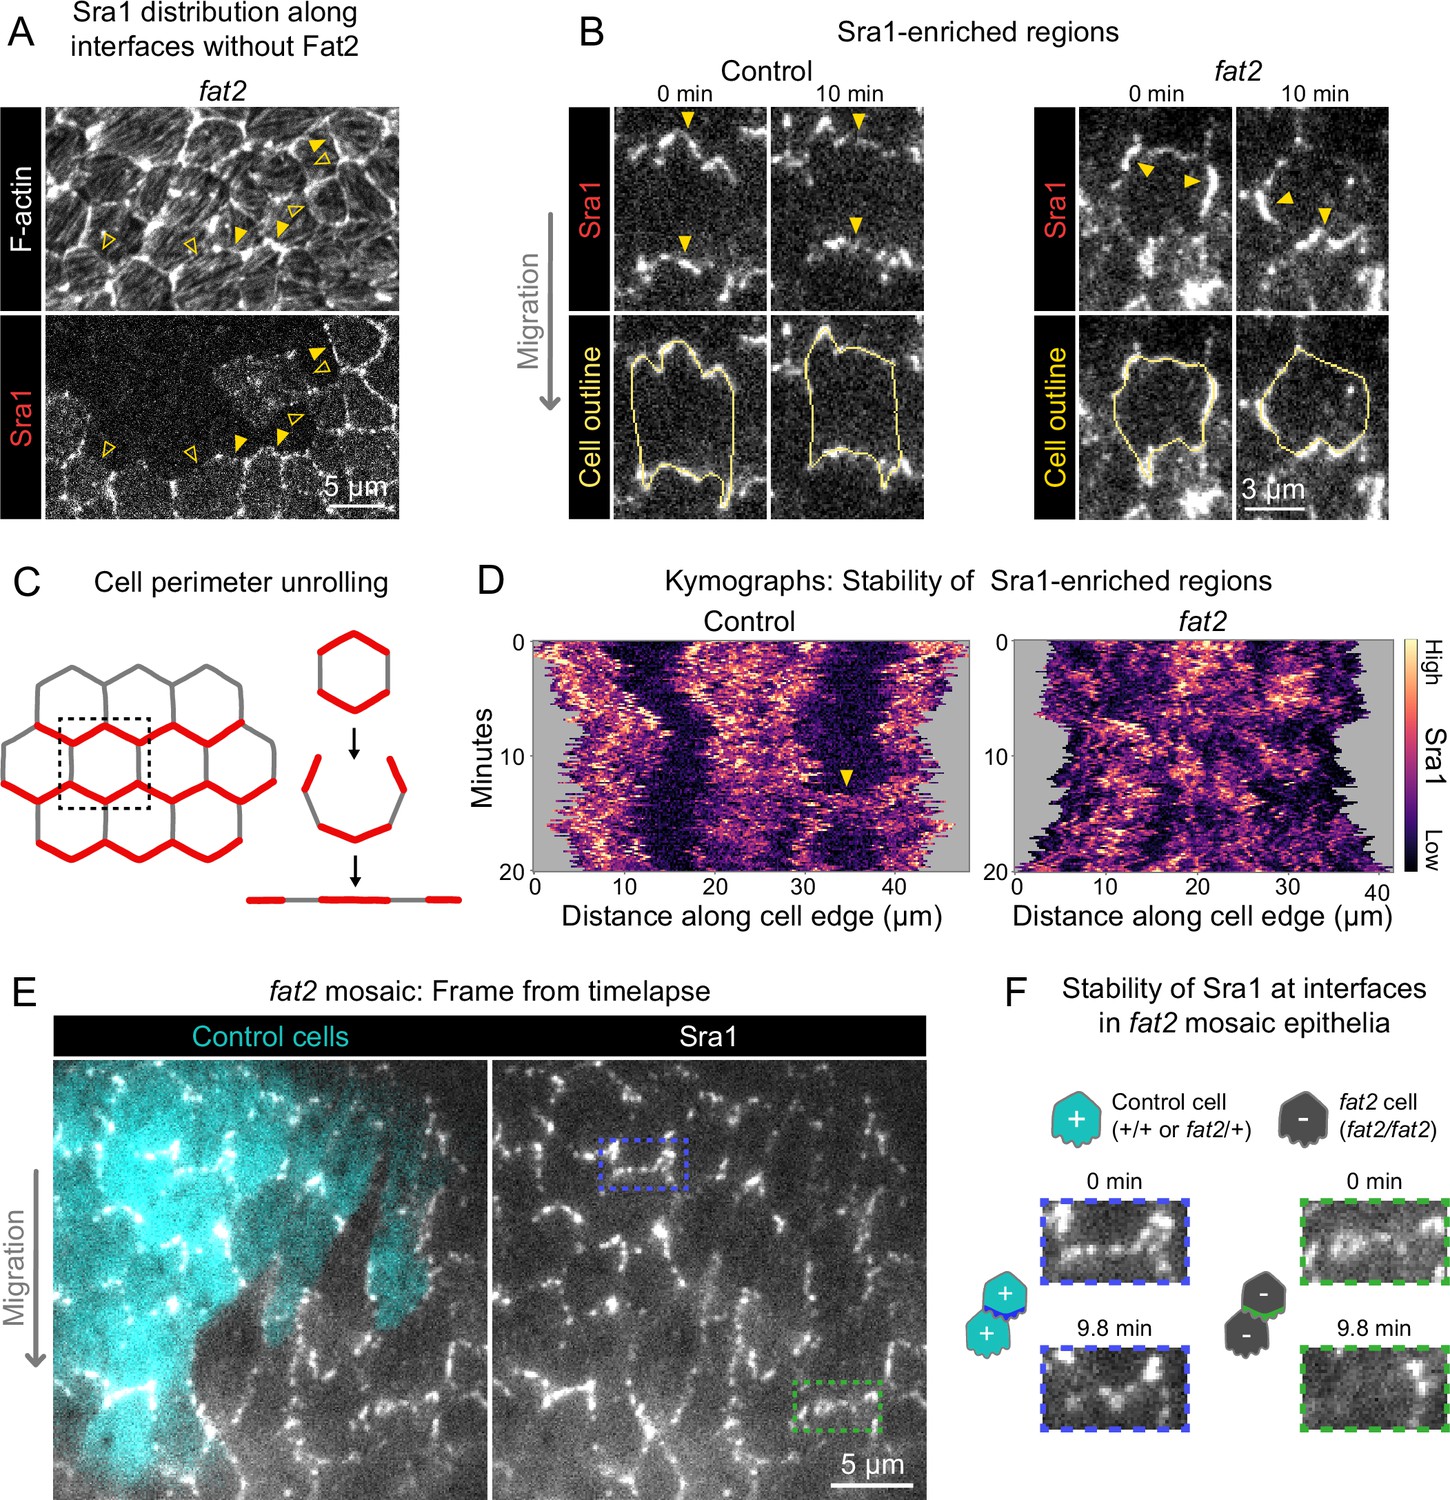
Fat2 stabilizes a region of WAVE complex enrichment in each cell.
(A) Images of phalloidin-stained F-actin and mosaically expressed Sra1-GFP in an entirely fat2 mutant epithelium. Filled and open arrows indicate genotype boundary interfaces with and without Sra1-GFP enrichment, respectively. Sra1-GFP enrichment is heterogeneous, and interfaces with Sra1-GFP enrichment have more F-actin protrusions. (B) Timelapse frames of Sra1-GFP in control and fat2 epithelia. Top row shows Sra1-GFP with arrows indicating regions of Sra1-GFP enrichment; bottom row shows Sra1-GFP and outlines of cell perimeters used to make kymographs. Laser intensity and brightness display settings differ between genotypes. See related Figure 6—video 2. (C) Diagram of cell perimeter unrolling for kymograph generation. Red represents planar-polarized Sra1 as distributed before and after unrolling. (D) Kymographs of Sra1-GFP fluorescence intensity along cell perimeter outlines exemplified in (C). The y-axis length of regions of high Sra1-GFP enrichment reports their stability over time. Control cells have Sra1-GFP regions along leading-trailing interfaces that are stable over 20 minutes. In fat2 cells, Sra1-GFP-enriched regions are less stable. The arrow indicates a transient accumulation of Sra1-GFP at a control cell side. These occur occasionally, and their stability is similar to Sra1-GFP regions in fat2 cells. (E) Timelapse frame of a fat2 mosaic epithelium in which all cells express Sra1-GFP, used to evaluate Sra1-GFP dynamics in control or fat2 cells within a migratory context. Boxes indicate a leading-trailing interface between two control cells (blue) or fat2 cells (green). Representative of 9 similar timelapse movies. See related Figure 6—video 3. (F) Larger images of the interfaces boxed in (E), taken 9.8 min apart. Sra1-GFP is initially enriched along both interfaces. It remains enriched in the control interface throughout, but loses enrichment along the fat2 interface.
Figure 6—figure supplement 1
The WAVE complex is still associated with protrusions in the absence of Fat2.
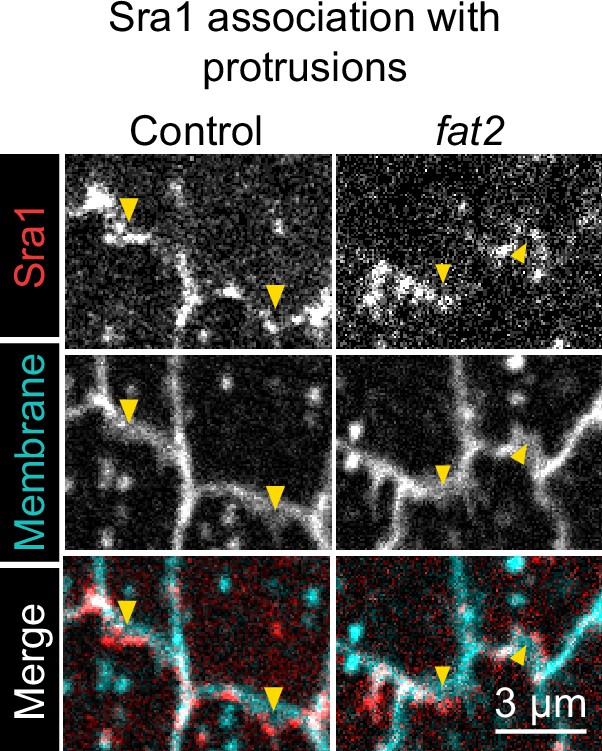
Timelapse frames showing pairs of cell interfaces from control or fat2 epithelia expressing Sra1-GFP and labeled with a membrane dye. Arrows indicate membrane protrusions. Sra1-GFP is enriched at protrusion tips in both control and fat2 epithelia. See related Figure 6—video 1.
Figure 6—video 1
Sra1 enrichment at protrusion tips in control and fat2 epithelia.
Pairs of cell edges from control or fat2 epithelia expressing Sra1-GFP and labeled with a membrane dye. Sra1-GFP is enriched at protrusion tips in both control and fat2 epithelia. The control movie field of view moves to follow the cells as they migrate. Associated with Figure 6—figure supplement 1.
Figure 6—video 2
WAVE complex-enriched region dynamics in control and fat2 epithelia.
Part one shows fields of cells from control and fat2 epithelia expressing Sra1-GFP. Part two shows individual cells from the same epithelia, with arrows indicating regions of WAVE complex enrichment in the center cell. The control movie fields of view move to follow the cells as they migrate. Laser intensity and brightness display settings differ between genotypes. Used to evaluate the stability of regions of Sra1-GFP accumulation. Associated with Figure 6B and D.
Figure 6—video 3
WAVE complex-enriched region dynamics in a fat2 mosaic epithelium.
Used to evaluate WAVE complex-enriched region dynamics in control or fat2 cells within a migratory context. Associated with Figure 6E and F .
Figure 7 with 1 supplement

Fat2 stabilizes a protrusive region in each cell.
(A) Timelapse frames of control and fat2 epithelia labeled with a membrane dye, showing the position of a cell’s protrusions over time. Top row shows the interfaces and protrusions of one cell and its neighbors. Segmented membrane extensions originating from the center cell (red) are overlaid in the bottom row. Arrows indicate sites of membrane protrusion. In the control cell, protrusion position is stable, whereas in fat2 cells it shifts either along a fixed axis (middle) or seemingly at random (right). See related Figure 7—video 1. (B) Example in which one cell and then its neighbor protrudes across a shared interface (a ‘polarity switch’). The row shows timelapse frames of an interface and associated protrusions from a fat2 epithelium labeled with membrane dye. Arrows originate in the protruding cell and point in the direction of protrusion. The bottom row shows corresponding diagrams of the interface with F-actin-rich protrusions illustrated in yellow. (C) Plot showing the frequency of interface protrusion polarity switches (exemplified in B) in timelapse movies of control and fat2 epithelia. Polarity switches occur more frequently at fat2 interfaces than control ones. Unpaired t-test; ***p=0.0002. Bars indicate mean ± SD. (D) Diagram showing the proposed role of Fat2 stabilizing a region of WAVE complex enrichment and protrusivity. Without Fat2, WAVE complex-enriched, protrusive regions are reduced and more transient.
-
Figure 7—source data 1
Frequency of interface protrusion polarity switches in control and fat2 epithelia.
Used to generate Figure 7C.
- https://cdn.elifesciences.org/articles/78343/elife-78343-fig7-data1-v2.csv
Figure 7—video 1
Dynamics of protrusive regions in control and fat2 cells.
Top row shows the interfaces and membrane protrusions of one cell and its neighbors, labeled with a membrane dye. The segmented membrane extensions originating from the centered cell are overlaid in the bottom row. The control field of view moves to follow the cell as it migrates. Associated with Figure 7A.
Figure 8 with 3 supplements
Fat2 colocalizes with the WAVE complex across leading-trailing cell-cell interfaces.
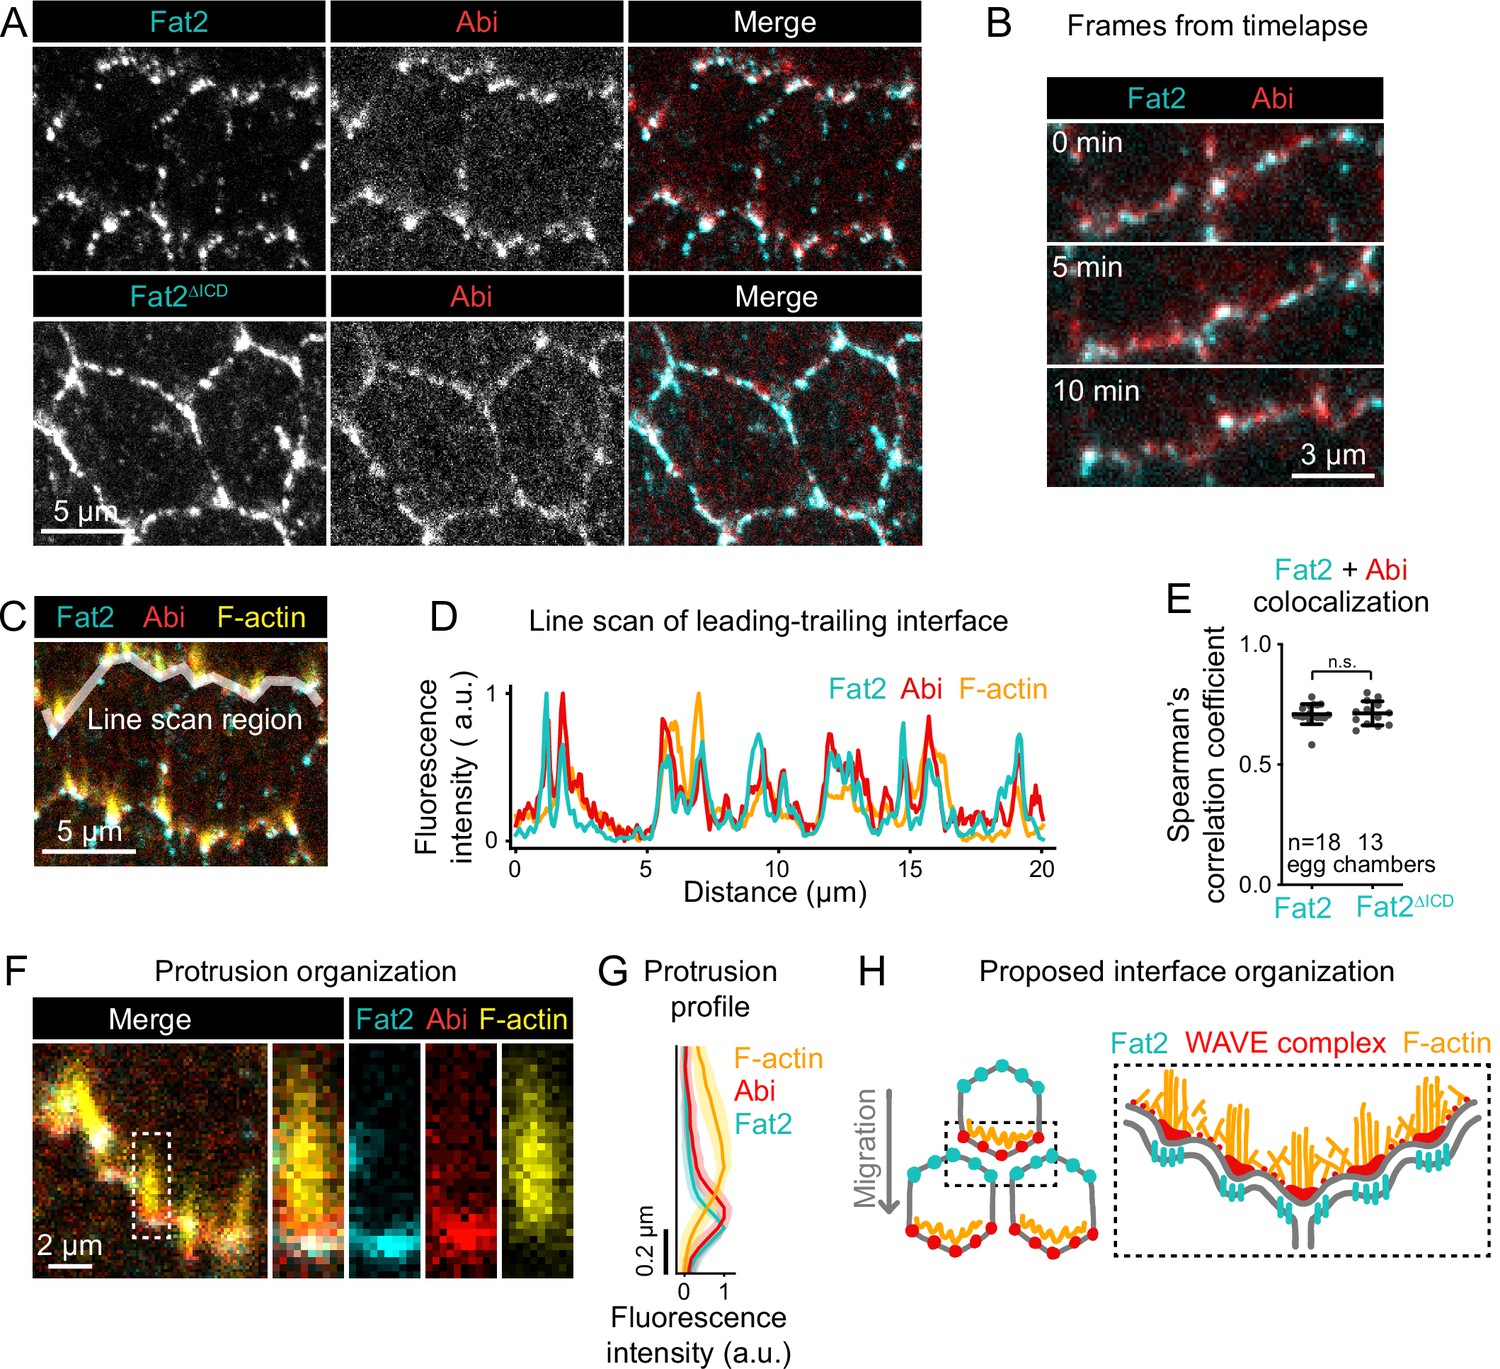
(A) Images of cells expressing Abi-mCherry and endogenous full-length Fat2-3xGFP or endogenous Fat2-3xGFP lacking the intracellular domain (Fat2ΔICD), used to assess colocalization. (B) Timelapse frames showing the leading-trailing interfaces of two cells expressing Fat2-3xGFP and Abi-mCherry, showing their colocalization over time. See related Figure 8—video 1. (C) Image showing the leading-trailing interface region used in (D); it is also an example of a region used in (E). (D) Line scan showing the fluorescence intensity of Fat2-3xGFP, Abi-mCherry, and F-actin (phalloidin) along the leading-trailing interfaces of the two cells in (C) showing their corresponding peaks of enrichment. (E) Plot of Spearman’s correlation coefficients of Fat2-3xGFP or Fat2ΔICD-3xGFP and Abi-mCherry showing no significant difference in colocalization. Bars indicate mean ± SD. One-way ANOVA (F(5,81)=44.86, p=0.0164 with Figure 8—figure supplement 1) with post-hoc Tukey’s test; n.s. p>0.99. (F) Image showing the distribution of Fat2-3xGFP, Abi-mCherry, and F-actin (phalloidin) at the leading-trailing interface and along the boxed filopodium. (G) Plot showing fluorescence intensity of traces of F-actin, Abi-mCherry, and Fat2-3xGFP showing their relative sites of enrichment along the length of filopodia. Lines and shaded regions indicate mean ± SD. n=74 protrusions (used for SD), 18 cells, 1 cell/egg chamber. (H) Diagram of proposed organization of Fat2, the WAVE complex, and F-actin along the leading-trailing interface based on the present data and previously published work (Viktorinová and Dahmann, 2013; Cetera et al., 2014; Barlan et al., 2017). Fat2 puncta at the trailing edge colocalize with WAVE complex puncta at the leading edge, ahead of filopodia embedded within the lamellipodium.
-
Figure 8—source data 1
Colocalization of Fat2 and Abi along leading-trailing interfaces.
Used to generate Figure 8E, Figure 8—figure supplement 1.
- https://cdn.elifesciences.org/articles/78343/elife-78343-fig8-data1-v2.csv
-
Figure 8—source data 2
Fat2, Abi, and F-actin distributions along the length of filopodia.
Used to generate Figure 8G.
- https://cdn.elifesciences.org/articles/78343/elife-78343-fig8-data2-v2.csv
Figure 8—figure supplement 1
Ena and Lar are not required for colocalization between Fat2 and the WAVE complex.
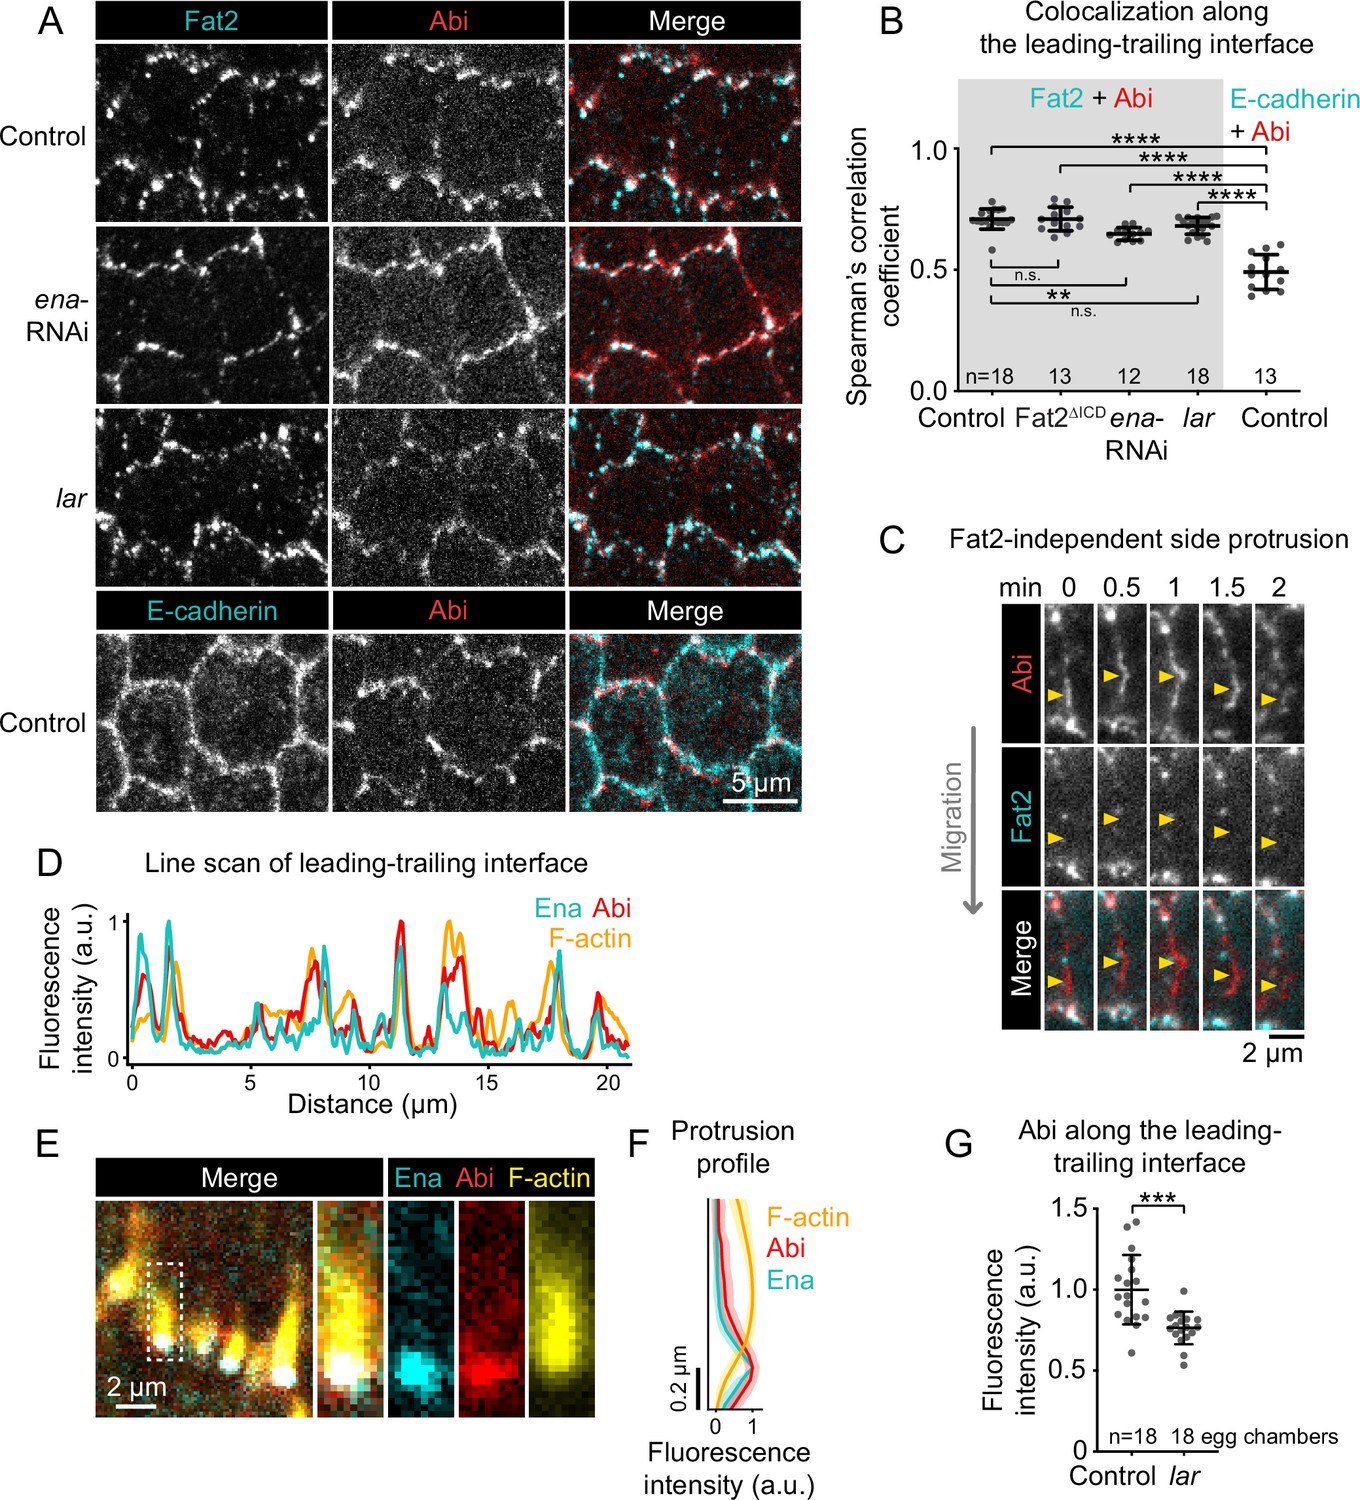
(A) Images of cells expressing Fat2-3xGFP and Abi-mCherry in control, lar, and ena-RNAi backgrounds (top 3 rows) or E-cadherin-GFP and Abi-mCherry (bottom row, negative control for colocalization measurements). (B) Plot of Spearman’s correlation coefficients of Abi-mCherry and Fat2-3xGFP (or Fat2ΔICD-3xGFP) (gray background) or E-cadherin-GFP (white background) along leading-trailing interfaces show that Fat2 and Abi colocalize in all four conditions more strongly than E-cadherin and Abi. One-way ANOVA (F(5,81)=44.86, p=0.0164) with post-hoc Tukey’s test; n.s. (left to right) p>0.99, p=0.41, **p<0.0046, ****p<0.0001. (A,B) Control, Fat2-3xGFP, and Abi-mCherry images and Spearman’s coefficients are also in Figure 8A and E. (C) Timelapse frames of a side-facing cell-cell interface from an epithelium expressing Abi-mCherry and Fat2-3xGFP. Arrows indicate a site of transient Abi-mCherry accumulation, protrusion, and dissipation with no corresponding Fat2-3xGFP enrichment. See related Figure 8—video 2. (D) Line scan of GFP-Ena, Abi-mCherry, and F-actin (phalloidin) fluorescence intensity along a leading-trailing interface region, showing their corresponding peaks of enrichment. (E) Image showing the GFP-Ena, Abi-mCherry, and F-actin (phalloidin) at the leading edge and in the boxed filopodium. (F) Plot of mean fluorescence intensity of F-actin, Abi-mCherry, and GFP-Ena along the length of filopodia showing their relative distribution. Lines and shaded regions indicate mean ± SD. n=54 filopodia (used for SD), 39 cells from 2 egg chambers. (G) Plot of mean fluorescence intensity of Abi-mCherry along leading-trailing interfaces in control epithelia or similarly-oriented interfaces in lar epithelia, some of which are non-migratory. B,F,G, Bars (B,G) or lines and shaded regions (F) indicate mean ± SD.
-
Figure 8—figure supplement 1—source data 1
Ena, Abi, and F-actin distributions along the length of filipodia.
Used to generate Figure 8—figure supplement 1.
- https://cdn.elifesciences.org/articles/78343/elife-78343-fig8-figsupp1-data1-v2.csv
-
Figure 8—figure supplement 1—source data 2
Abi enrichment at leading-trailing interfaces in the absence of Lar.
Used to generate Figure 8—figure supplement 1.
- https://cdn.elifesciences.org/articles/78343/elife-78343-fig8-figsupp1-data2-v2.csv
Figure 8—video 1
Colocalization of puncta of Fat2 and the WAVE complex along leading-trailing interfaces.
The leading-trailing interfaces of two cells expressing Fat2-3xGFP and Abi-mCherry, used to compare the distributions of Fat2 and the WAVE complex over time. The Fat2-3xGFP channel is offset 2 pixels downward so puncta positions can be more easily compared. Associated with Figure 8—video 2.
Figure 8—video 2
WAVE complex accumulation at side-facing protrusions away from Fat2.
A side-facing cell-cell interface from an epithelium expressing Abi-mCherry and Fat2-3xGFP. Arrows indicate a site of transient Abi-mCherry accumulation, protrusion, and dissipation with no corresponding Fat2-3xGFP enrichment, in contrast to the colocalized Fat2-3xGFP and Abi-mCherry on the leading-trailing interfaces above and below. Associated with Figure 8—figure supplement 1.
Tables
Key resources table
| Reagent type (species) or resource | Designation | Source or reference | Identifiers | Additional information |
|---|---|---|---|---|
| Gene (Drosophila melanogaster) | Abi | NA | FLYB:FBgn0020510 | FlyBase Name: Abelson interacting protein |
| Gene (Drosophila melanogaster) | Dlg | NA | FLYB:FBgn0001624 | FlyBase Name: discs large 1 |
| Gene (Drosophila melanogaster) | E-cadherin | NA | FLYB:FBgn0003391 | FlyBase Name: shotgun |
| Gene (Drosophila melanogaster) | Ena | NA | FLYB:FBgn0000578 | FlyBase Name: enabled |
| Gene (Drosophila melanogaster) | Fat2 (kug) | NA | FLYB:FBgn0261574 | FlyBase Name: kugelei |
| Gene (Drosophila melanogaster) | Lar | NA | FLYB:FBgn0000464 | FlyBase Name: Leukocyte-antigen- related-like |
| Gene (Drosophila melanogaster) | Scar | NA | FLYB:FBgn0041781 | FlyBase Name: SCAR |
| Gene (Drosophila melanogaster) | Sra1 (CYFIP) | NA | FLYB:FBgn0038320 | FlyBase Name: Cytoplasmic FMR1 interacting protein |
| Genetic reagent (Drosophila melanogaster) | Abi-mCherry or ubi >Abi-mCherry | Bloomington Drosophila Stock Center; FLYB:FBrf0227194 (S. Huelsmann) | FLYB:FBst0058729; BDSC:58729 | FlyBase Symbol: P{Ubi-mCherry.Abi}3 |
| Genetic reagent (Drosophila melanogaster) | abi-RNAi | National Institute of Genetics, Japan | FLYB:FBtp0079430; NIG:9749 R | |
| Genetic reagent (Drosophila melanogaster) | E-cadherin-GFP | Bloomington Drosophila Stock Center; PMID:19429710 | FLYB:FBst0060584; BDSC:60584 | FlyBase Genotype: y[1] w*; TI{TI}shg[GFP] |
| Genetic reagent (Drosophila melanogaster) | GFP-Ena or ubi >GFP-Ena | Bloomington Drosophila Stock Center; FLYB:FBrf0208868 (S. Nowotarski and M. Peiger) | FLYB:FBst0028798; BDSC:28798 | FlyBase Genotype: w*; P{Ubi-GFP.ena}3 |
| Genetic reagent (Drosophila melanogaster) | ena-RNAi | Vienna Drosophila Resource Center | FLYB:FBst0464896; VDRC:43058 | |
| Genetic reagent (Drosophila melanogaster) | Fat2-3xGFP FRT80B | Laboratory of S. Horne-Badovinac; PMID:28292425 | FLYB:FBal0326664 | FlyBase Symbol: kug[3xGFP] |
| Genetic reagent (Drosophila melanogaster) | Fat2ΔICD-3xGFP FRT80B | Laboratory of S. Horne-Badovinac; PMID:28292425 | FLYB:FBal0326665 | FlyBase Symbol: kug[ΔICD.3xGFP] |
| Genetic reagent (Drosophila melanogaster) | fat2 or fat2N103-2 FRT80B | Laboratory of Sally Horne-Badovinac; PMID:22413091 | FLYB:FBal0267777 | FlyBase Symbol: kug[N103-2] |
| Genetic reagent (Drosophila melanogaster) | UAS >Flp | Bloomington Drosophila Stock Center; PMID:9584125 | FFLYB:FBst0004539; BDSC:4539 | FlyBase Genotype: y[1] w[*]; PUAS-FLP.DJD1 |
| Genetic reagent (Drosophila melanogaster) | FRT80B | Bloomington Drosophila Stock Center; PMID:8404527 | FLYB:FBti0002073 | FlyBase Symbol: P{neoFRT}80B |
| Genetic reagent (Drosophila melanogaster) | UAS >F-Tractin-tdTomato | Bloomington Drosophila Stock Center; FLYB:FBrf0226873 (T. Tootle); PMID:24995797 | FLYB:FBst0058989; BDSC:58989 | FlyBase Genotype: w*; P{UASp-F-Tractin.tdTomato}15 A/SM6b; MKRS/TM2 |
| Genetic reagent (Drosophila melanogaster) | ubi >GFP NLS (3 L) FRT80B | Bloomington Drosophila Stock Center; FLYB:FBrf0108530 (D. Bilder and N. Perrimon) | FLYB:FBst0001620; BDSC:1620 | FlyBase Genotype: w*; P{Ubi-GFP.D}61EF P{neoFRT}80B |
| Genetic reagent (Drosophila melanogaster) | lar13.2 FRT40A | Bloomington Drosophila Stock Center; PMID:8598047 | FLYB:FBst0008774; BDSC8774 | |
| Genetic reagent (Drosophila melanogaster) | larbola1 | Bloomington Drosophila Stock Center; PMID:11688569 | FLYB:FBst0091654; BDSC:91654 | |
| Genetic reagent (Drosophila melanogaster) | MKRS hsFLP/TM6b, Cre | Bloomington Drosophila Stock Center | FLYB:FBst0001501; BDSC:1501 | y[1] w[67c23]; MKRS, P{hsFLP}86E/TM6B, P{Crew}DH2, Tb[1] |
| Genetic reagent (Drosophila melanogaster) | nanos-Cas9 | Bloomington Drosophila Stock Center; FLYB:FBrf0223952 (F. Port and S. Bullock); PMID:25002478 | FLYB:FBst0054591; BSDC:54591 | FlyBase Genotype: y[1] M{nos-Cas9.P}ZH-2A w* |
| Genetic reagent (Drosophila melanogaster) | ubi >mRFP NLS (3 L) FRT80B | Bloomington Drosophila Stock Center; FLYB:FBrf0210705 (J. Lipsick) | FLYB:FBti0129786; BDSC:30852 | FlyBase Genotype: w1118; P{Ubi-mRFP.nls}3 L P{neoFRT}80B |
| Genetic reagent (Drosophila melanogaster) | FRT82b ubi >mRFP NLS (3 R) | Bloomington Drosophila Stock Center; FLYB:FBrf0210705 (J. Lipsick) | FLYB:FBst0030555; BDSC:30555 | FlyBase Genotype: w1118; P{neoFRT}82B P{Ubi-mRFP.nls}3 R |
| Genetic reagent (Drosophila melanogaster) | Sra1-GFP | Produced for this study | Sra1 endogenously tagged with GFP using CRISPR. Available from Horne-Badovinac Lab upon request to shorne@uchicago.edu | |
| Genetic reagent (Drosophila melanogaster) | Sra1-GFP FRT80B | Produced for this study | Sra1 endogenously tagged with GFP using CRISPR, with FRT80B. Available from Horne-Badovinac Lab upon request to shorne@uchicago.edu | |
| Genetic reagent (Drosophila melanogaster) | sra1-RNAi | Bloomington Drosophila Stock Center; PMID:21460824 | FLYB:FBst0038294; BDSC:38294 | FlyBase Genotype: y[1] sc* v[1] sev[21]; P{TRiP.HMS01754}attP2 |
| Genetic reagent (Drosophila melanogaster) | tj >Gal4 | National Institute of Genetics, Japan; PMID:12324948 | FLYB:FBtp0089190; DGRC:104055 | FlyBase Symbol: P{tj-GAL4.U} |
| Genetic reagent (Drosophila melanogaster) | w1118 | Bloomington Drosophila Stock Center | FLYB:FBal0018186 | |
| Antibody | Discs Large; Dlg (mouse monoclonal) | Developmental Studies Hybridoma Bank | DSHB:4F3; RRID:AB_528203 | (1:20) |
| Antibody | Scar (mouse monoclonal) | Developmental Studies Hybridoma Bank | AB_2618386 | (1:200) |
| Antibody | Alexa Fluor 647, anti-mouse secondary (donkey polyclonal) | Thermo Fisher Scientific | Cat:A31571; RRID:AB_162542 | (1:200) |
| Chemical compound, drug | CellMask Orange Plasma Membrane Stain | Thermo Fisher Scientific | Cat:C10045 | 15 min (1:250) |
| Chemical compound, drug | CellMask Deep Red Plasma Membrane Stain | Thermo Fisher Scientific | Cat:C10046 | 15 min (1:250) |
| Chemical compound, drug | TRITC Phalloidin | Millipore Sigma | Cat:1951 | 15 min at room temp (1:300) |
| Chemical compound, drug | Alexa Fluor 647 phalloidin | Thermo Fisher Scientific | Cat:C10045 | 2 hr at room temp (1:50) |
| Chemical compound, drug | CK-666, Arp2/3 complex inhibitor | Millipore Sigma | Cat:553502 | 750 μM |
| Chemical compound, drug | Formaldehyde, 16%, methanol free, ultra pure | Polysciences | Cat:18814–10 | |
| Chemical compound, drug | Recombinant human insulin | Millipore Sigma | Cat:12643 | |
| Recombinant DNA reagent | plasmid: pU6-BbsI-chiRNA | Addgene | Addgene:45946; RRID:Addgene_45946 | PMID:23709638 |
| Recombinant DNA reagent | plasmid: pU6 chiRNA Sra1 C-term | Produced for this study | CRISPR chiRNA construct for generation of Sra1-GFP. available from Horne-Badovinac Lab upon request to shorne@uchicago.edu | |
| Recombinant DNA reagent | plasmid: pDsRed-attP | Addgene | Addgene:51019; RRID:Addgene_51019 | PMID:24478335. Vector used to make pDsRed-attP Sra1-GFP HR |
| Recombinant DNA reagent | plasmid: pTWG | Drosophila Genome Resource Center | DGRC:1076 | source of enhanced GFP for generation of Sra1-GFP |
| Recombinant DNA reagent | plasmid: pDsRed-attP Sra1-GFP HR | Produced for this study | CRISPR homologous recombinaton construct for generation of Sra1-GFP. Available from Horne-Badovinac Lab upon request to shorne@uchicago.edu | |
| Software, algorithm | Zen Blue | Zeiss | ||
| Software, algorithm | MetaMorph | Molecular Devices | ||
| Software, algorithm | FIJI (ImageJ) | PMID:22743772 | ||
| Software, algorithm | GraphPad Prism 9 for Mac | GraphPad Software | ||
| Software, algorithm | Microsoft Excel for Mac, version 16.47 | Microsoft | ||
| Software, algorithm | Python 3 | Python Software Foundation | ||
| Software, algorithm | imageio | imageio contributors | ||
| Software, algorithm | matplotlib | The Matplotlib Development team | ||
| Software, algorithm | napari | napari contributors | ||
| Software, algorithm | numpy | numpy contributors | ||
| Software, algorithm | pims | pims contributors | ||
| Software, algorithm | pandas | pandas contributors | ||
| Software, algorithm | scikit-image | scikit-image development team | ||
| Software, algorithm | scikit-ffm | scikit-fmm contributors | ||
| Software, algorithm | scipy | scipy contributors |
Table 1
Experimental genotypes.
| Figure | Panel | Name | Genotype |
|---|---|---|---|
| 1 | D | F-actin +Ena + Abi | w; ubi >GFP-EnaBDSC:28798/ubi >Abi-mCherryBDSC:58729 |
| 1 | F | Control | w; tj >Gal4DGRC:104055/+ |
| 1 | F | ena-RNAi | w; tj >Gal4DGRC:104055/UAS-ena-RNAiVDRC:43058 |
| 1 | F | abi-RNAi | w; tj >Gal4DGRC:104055/+; UAS-abi-RNAiNIG:9749R-3 |
| 2 | Top row | Protrusion in 1 direction | w1118 |
| 2 | Bottom row | Protrusion in both directions | w; fat2N103-2 FRT80B |
| 3 | A-C | Control | w1118 |
| 3 | A-C | fat2 | w; fat2N103-2 FRT80B |
| 3 | A-C | CK-666 | w1118 |
| 3 | D | Control | w1118 |
| 3 | D | fat2 | w; fat2N103-2 FRT80B |
| 4 | A,B | fat2 mosaic | w; tj >Gal4DGRC:104055, UAS >FlpBDSC:4539/+; fat2N103-2 FRT80B/ubi >GFP NLS FRT80BBDSC1620 |
| 5 | B | Sra1-GFP mosaic | w; tj >Gal4DGRC:104055, UAS >FlpBDSC:4539/+; FRT82B Sra1-GFP/FRT82B ubi >mRFP-NLSBDSC:30555 |
| 5 | C | fat2 mosaic | w; tj >Gal4DGRC:104055, UAS >FlpBDSC:4539/+; fat2N103-2 FRT80B/ubi >GFP NLS FRT80BBDSC1620 |
| 5 | D-F | Sra1-GFP mosaic | w; tj >Gal4DGRC:104055, UAS >FlpBDSC:4539/+; fat2N103-2 FRT80B Sra1-GFP/ubi >mRFP NLS FRT80BDSC:30852 |
| 6 | A | Sra1-GFP mosaic +fat2 | w; tj >Gal4DGRC:104055, UAS >FlpBDSC:4539/+; fat2N103-2 FRT80B Sra1-GFP/fat2N103-2 FRT80B FRT82B |
| 6 | B,D | Control | w;; Sra1-GFP/+ |
| 6 | B,D | fat2 | w;; fat2N103-2 FRT80B Sra1-GFP/fat2N103-2 FRT80B |
| 6 | E,F | fat2 mosaic +Sra1 | w; tj >Gal4DGRC:104055, UAS >FlpBDSC:4539/+; fat2N103-2 FRT80B Sra1-GFP/ubi >mRFP NLS FRT80BDSC:30852 |
| 7 | A,C | Control | w1118 |
| 7 | A,C | fat2 | w;; fat2N103-2 FRT80B |
| 7 | B | Example of switch | w;; fat2N103-2 FRT80B |
| 8 | A,E | Fat2 +Abi | w;; ubi >Abi-mCherryBDSC:58729, Fat2-3xGFP FRT80B/Fat2-3xGFP FRT80B |
| 8 | A,E | Fat2ΔICD + Abi | w;; ubi >Abi-mCherryBDSC:58729, Fat2ΔICD-3xGFP FRT80B/Fat2ΔICD-3xGFP FRT80B |
| 8 | B | Fat2 +Abi | w;; ubi >Abi-mCherryBDSC:58729, Fat2-3xGFP FRT80B/Fat2-3xGFP FRT80B |
| 8 | C,D,F,G | Fat2 +Abi + F-actin | w;; ubi >Abi-mCherryBDSC:58729, Fat2-3xGFP FRT80B/Fat2-3xGFP FRT80B |
| 3S1 | A | Control | w1118 |
| 3S1 | A | fat2 | w;; fat2N103-2 FRT80B |
| 3S1 | A | CK-666 | w1118 |
| 3S1 | B | Control | w1118 |
| 3S1 | B | fat2 | w;; fat2N103-2 FRT80B |
| 3S2 | A-C | Control | w; tj >Gal4DGRC:104055/+ |
| 3S2 | A-C | fat2 | w; tj >Gal4DGRC:104055/+; fat2N103-2 FRT80B |
| 3S2 | A-C | abi-RNAi | w; tj >Gal4DGRC:104055/+UAS-abi-RNAiNIG:9749R-3/+ |
| 3S2 | D | Control | w; tj >Gal4DGRC:104055/UAS >F-Tractin-tdTomatoBDSC:58989 |
| 3S2 | D | fat2 | w; tj >Gal4DGRC:104055/UAS >F-Tractin-tdTomatoBDSC:58989; fat2N103-2 FRT80B |
| 3S2 | D | abi-RNAi | w; tj >Gal4DGRC:104055/UAS >F-Tractin-tdTomatoBDSC:58989; UAS-abi-RNAiNIG:9749R-3/+ |
| 3S2 | E,F | Control | w1118 |
| 3S2 | E,F | fat2 | w;; fat2N103-2 FRT80B |
| 5S1 | A | Sra1-GFP | w;; Sra1-GFP |
| 5S1 | A | anti-SCAR | w;; Sra1-GFP |
| 5S1 | A | ubi >Abi-mCherry | w;; ubi >Abi-mCherryBDSC:58729/+ |
| 5S1 | B | Control | w; tj >Gal4DGRC:104055/+ |
| 5S1 | B | abi-RNAi | tj >Gal4DGRC:104055/+; UAS-abi-RNAiNIG:9749R-3/+ |
| 5S1 | C | Control | w1118 |
| 5S1 | C | Sra1-GFP x1 | w;; Sra1-GFP/+ |
| 5S1 | C | Sra1-GFP x2 | w;; Sra1-GFP |
| 5S1 | C | sra1-RNAi | w; tj >Gal4DGRC:104055/+; UAS >sra1-RNAiBDSC:38294/+ |
| 5S1 | D | Control | w1118 |
| 5S1 | D | Sra1-GFP x1 | w;; Sra1-GFP/+ |
| 5S1 | D | Sra1-GFP x2 | w;; Sra1-GFP |
| 5S2 | A, C-E | Control | w;; Sra1-GFP/+ |
| 5S2 | A, C-E | fat2 | w;; fat2N103-2 FRT80B Sra1-GFP/fat2N103-2 FRT80B |
| 6S1 | Control | w;; Sra1-GFP/+ | |
| 6S1 | fat2 | w;; fat2N103-2 FRT80B Sra1-GFP/fat2N103-2 FRT80B | |
| 8S1 | A,B | Control Fat2 +Abi | w;; ubi >Abi-mCherryBDSC:58729, Fat2-3xGFP FRT80B/Fat2-3xGFP FRT80B |
| 8S1 | A,B | Fat2ΔICD + Abi | w;; ubi >Abi-mCherryBDSC:58729, Fat2ΔICD-3xGFP FRT80B/Fat2ΔICD-3xGFP FRT80B |
| 8S1 | A,B | ena-RNAi, Fat2 +Abi | w; tj >Gal4DGRC:104055/UAS >ena RNAiVDRC:43058; ubi >Abi-mCherryBDSC:58729, Fat2-3xGFP FRT80B/Fat2-3xGFP FRT80B |
| 8S1 | A,B | Control Fat2 +Abi | w; larbola 1BDSC:91654/lar13.2 BDSC:8774 FRT40A; ubi >Abi-mCherryBDSC:58729, Fat2-3xGFP FRT80B/Fat2-3xGFP FRT80B |
| 8S1 | C | Fat2 +Abi | w;; ubi >Abi-mCherryBDSC:58729, Fat2-3xGFP FRT80B/Fat2-3xGFP FRT80B |
| 8S1 | D-F | Ena +Abi + F-actin | w; ubi >GFP-EnaBDSC:28798/ubi >Abi-mCherryBDSC:58729 |
| 8S1 | G | Control | w;; ubi >Abi-mCherryBDSC:58729, Fat2-3xGFP FRT80B/Fat2-3xGFP FRT80B |
| 8S1 | G | lar | w; larbola 1BDSC:91654/lar13.2 BDSC8774 FRT40A; ubi >Abi-mCherryBDSC:58729, Fat2-3xGFP FRT80B/Fat2-3xGFP FRT80B |
Table 2
Yeasting conditions.
| Figure | Panel | Days on yeast | Temp. (°C) |
|---|---|---|---|
| 1 | D | 2–3 | 25 |
| 1 | F | 3 | 29 |
| 2 | 2–3 | 25 | |
| 3 | A-D | 2–3 | 25 |
| 4 | A,B | 2–3 | 25 |
| 5 | B | 7 | 25 |
| 5 | C | 3 | 25 |
| 5 | D-F | 3 | 25 |
| 6 | A | 5 | 25 |
| 6 | B,D | 2–3 | 25 |
| 6 | E | 2–3 | 25 |
| 7 | A-C | 2–3 | 25 |
| 8 | A,E | 2–3 | 25 |
| 8 | B | 2–3 | 25 |
| 8 | C,D,F,G | 2–3 | 25 |
| S1 | A-C | 2–3 | 25 |
| S2 | A-C,E,F | 2–3 | 29 |
| S2 | D | 2–3 | 29 |
| S3 | A | 2–3 | 25 |
| S3 | B | 3 | 29 |
| S3 | C | 3 | 29 |
| S3 | D | 2–3 | 25 |
| S4 | A-E | 2–3 | 25 |
| S5 | 2–3 | 25 | |
| S6 | A,B,F | 3 | 29 |
| S6 | C | 2–3 | 25 |
| S6 | D-F | 2–3 | 25 |
Additional files
Download links
A two-part list of links to download the article, or parts of the article, in various formats.
Downloads (link to download the article as PDF)
Open citations (links to open the citations from this article in various online reference manager services)
Cite this article (links to download the citations from this article in formats compatible with various reference manager tools)
Fat2 polarizes the WAVE complex in trans to align cell protrusions for collective migration
eLife 11:e78343.
https://doi.org/10.7554/eLife.78343


