Little skate genome provides insights into genetic programs essential for limb-based locomotion
- Interdisciplinary Program in Bioinformatics, Seoul National University, Republic of Korea
- Department of Brain Sciences, DGIST, Republic of Korea
- Department of Biology, Graduate School of Arts and Science, NYU, United States
- Genome Technology Center, Division for Advanced Research Technologies, and Department of Pathology, NYU School of Medicine, United States
- Department of Agricultural Biotechnology, Seoul National University, Republic of Korea
- Neuroscience Institute, Department of Neuroscience and Physiology, New York University School of Medicine, United States
- Department of Agricultural Biotechnology and Research Institute of Agriculture and Life Sciences, Seoul National University, Republic of Korea
- eGnome, Inc, Republic of Korea
Figures
Figure 1 with 6 supplements
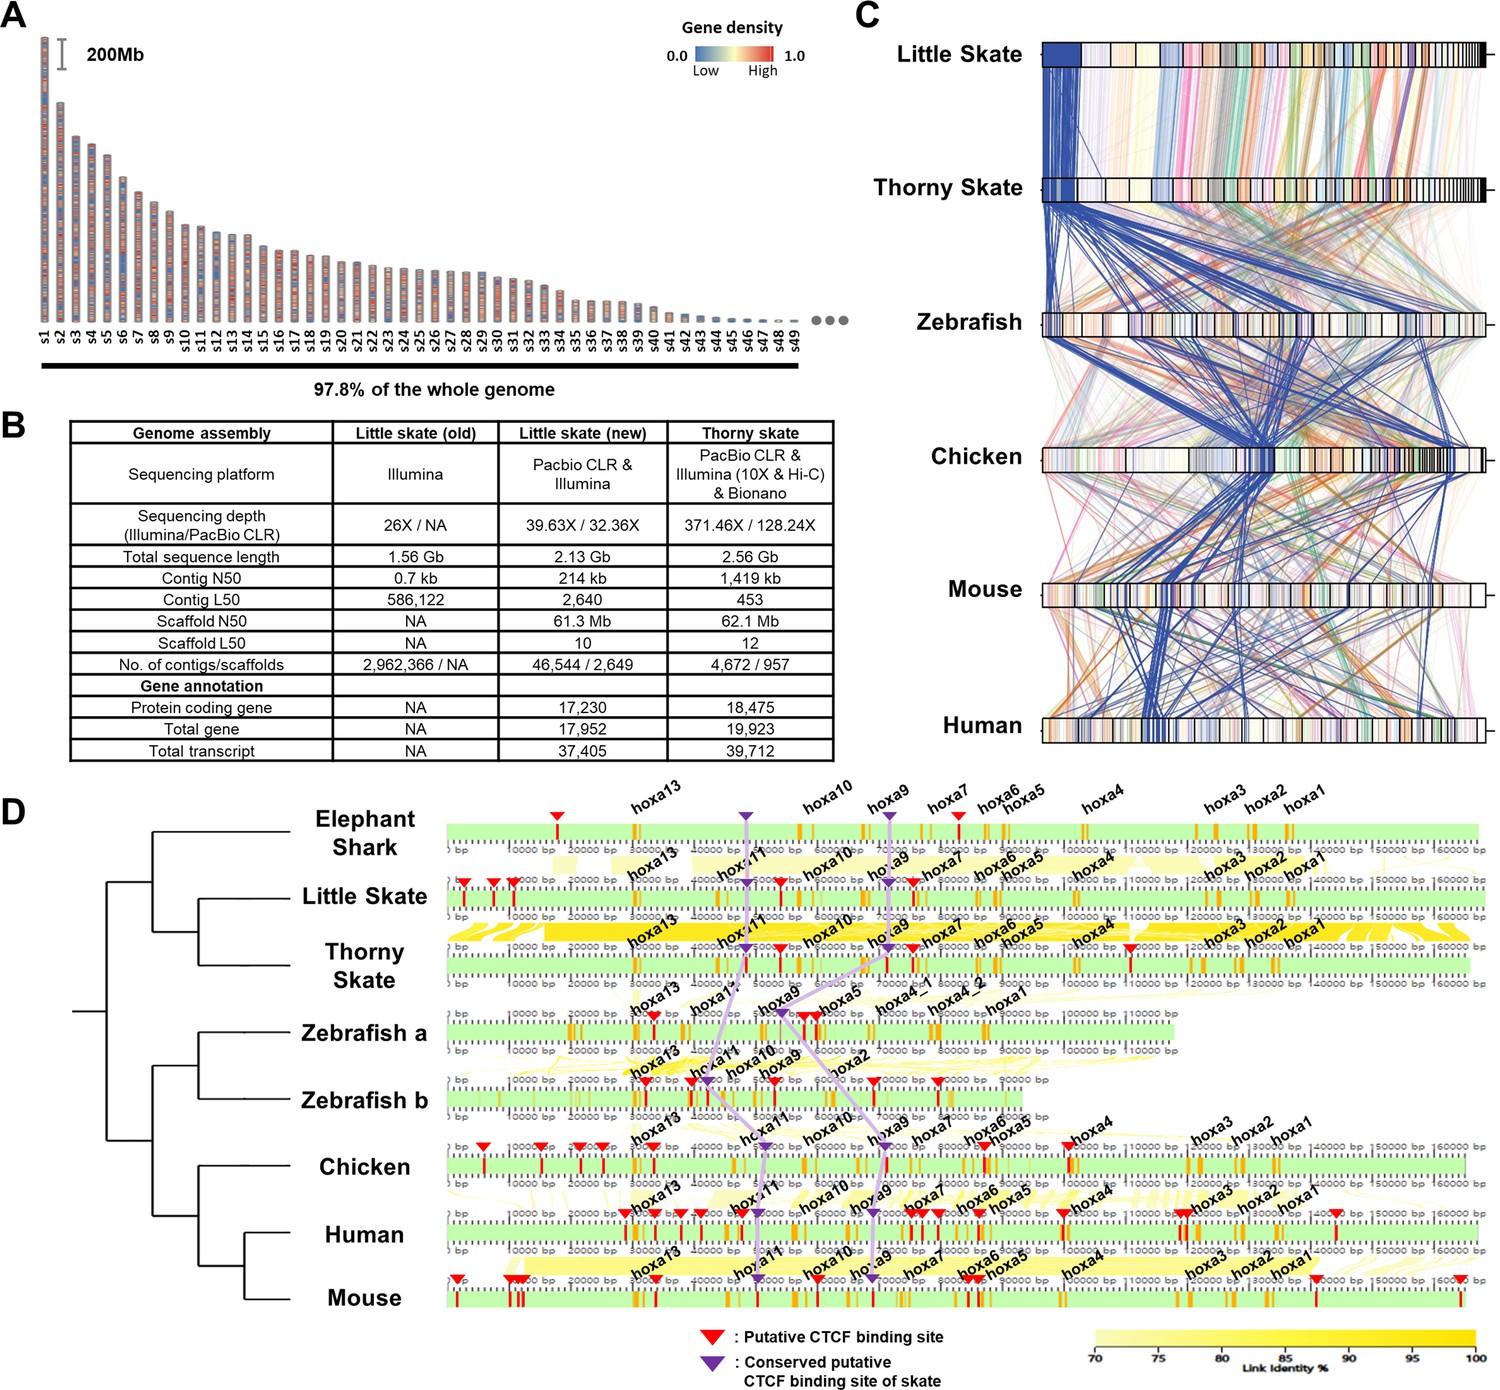
Assembly and comparison of little skate genomes across diverse phylogenetic lineages.
(A) Top 49 scaffolds ranked by the length. Gene density in the scaffolds is color coded. (B) Assembly statistics of the skate genome. (C). Comparison of BUSCO gene synteny across diverse phylogenetic lineages. The BUSCO genes in each scaffold of the new little skate genome are color coded and the longest scaffold (s1) is highlighted in blue. (D) Putative motifs of CTCF in the Hoxa cluster. CTCF motifs are predicted (described in materials and methods) and indicated by red bars and arrowheads and the ones conserved by purple bars and arrowheads. The exons in the genome are denoted by orange bars. The sequence identities of alignment blocks are indicated by the intensity of yellow color.
Figure 1—figure supplement 1
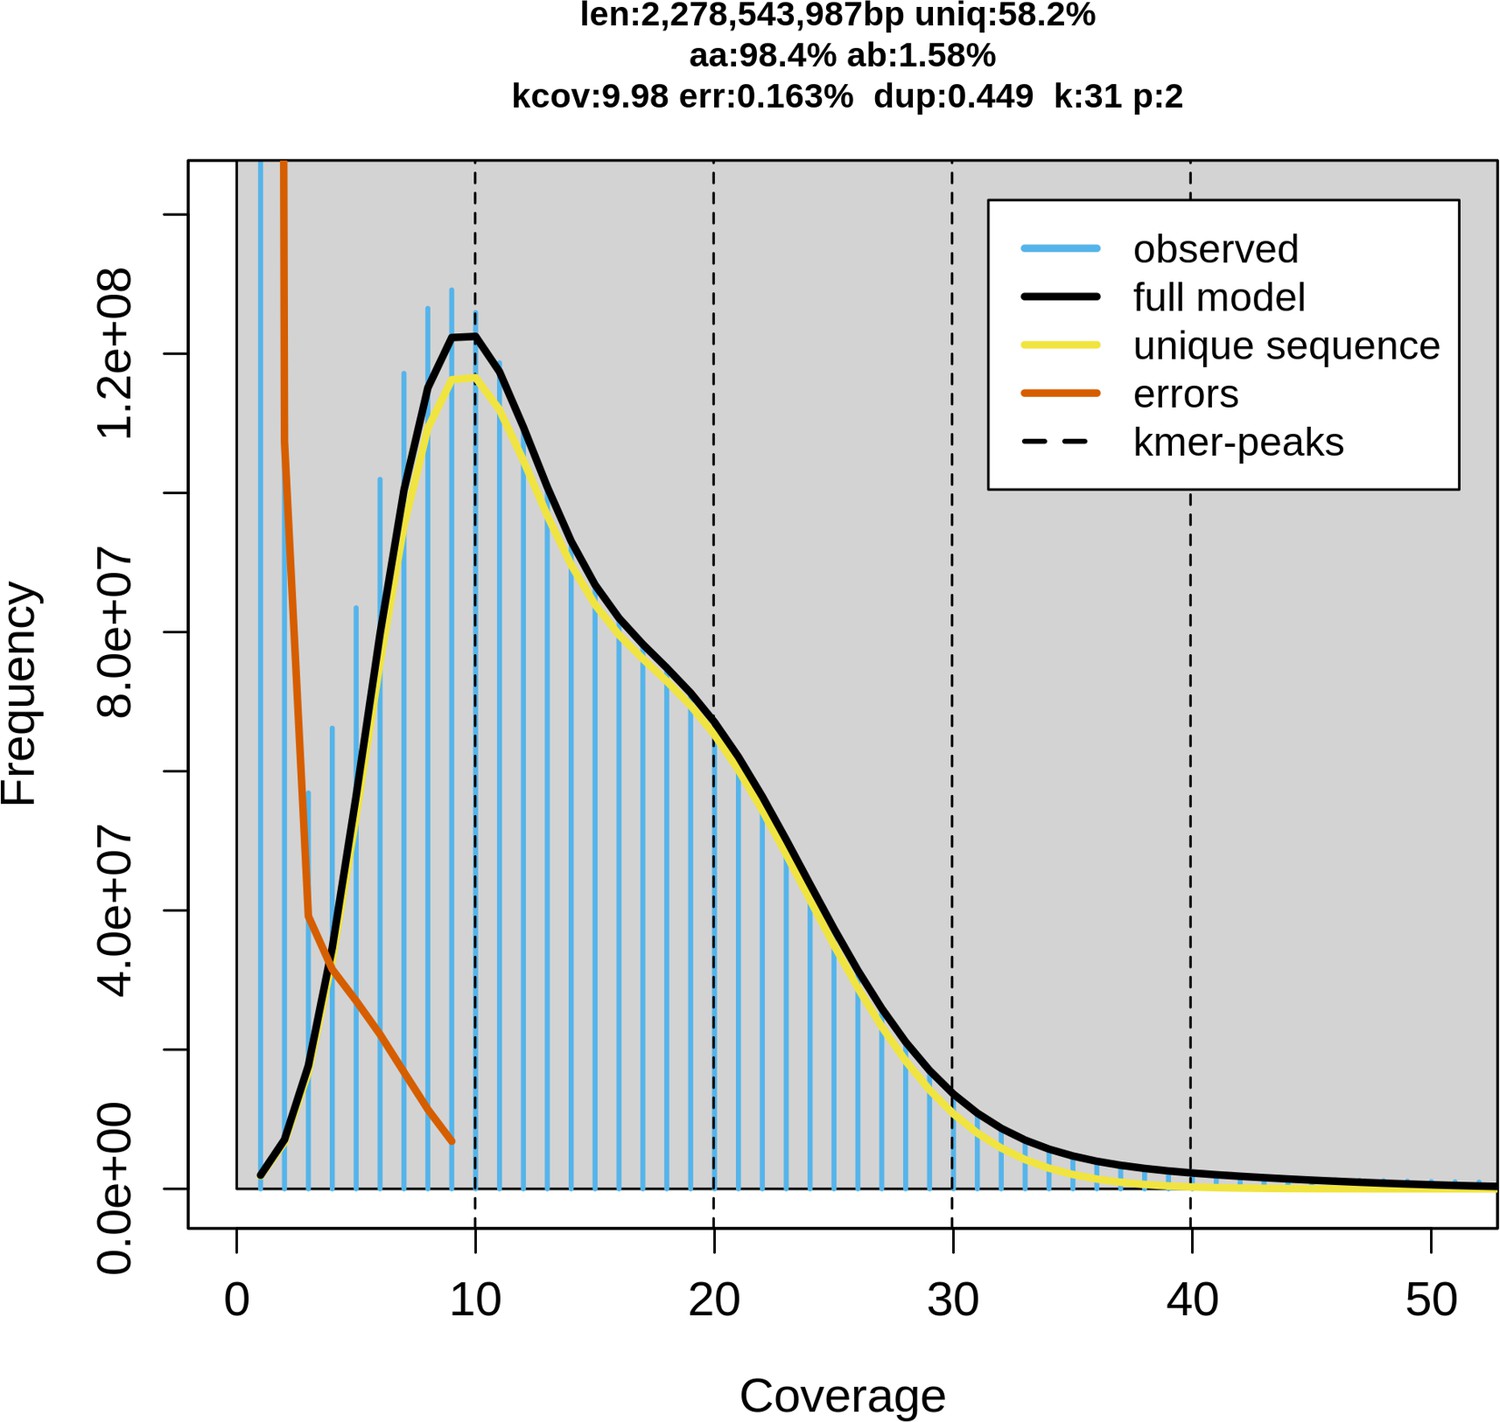
Genome size estimation via Genome Scope 2.
K-mer spectrum with K=31 and the fitted model of little skate genome. (‘len’: estimated genome size, ‘uniq’: proportion of the unique sequence, ‘aa’: homozygosity, ‘ab’: heterozygosity, ‘kcov’: K-mer coverage, ‘err’: error rate, ‘dup’: average rate of read duplications.).
Figure 1—figure supplement 2

Genome assembly process.
Improvement of the new genome assembly throughout the assembly process in terms of contiguity (contig N50), duplications and BUSCO gene contents. Y-axis on the BUSCO gene contents summary represents different classes of BUSCO genes as follows: M, missing; F, fragmented; D, complete and duplicated; S, complete and single copy; C, complete.
Figure 1—figure supplement 3
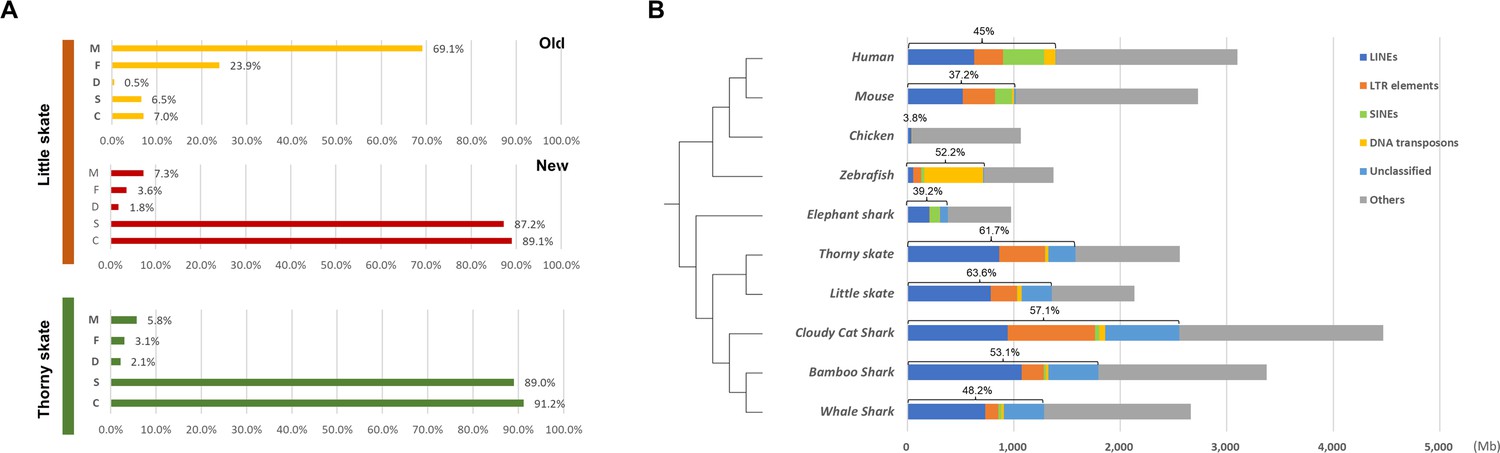
BUSCO genes and repetitive elements of little skate genome.
(A) BUSCO gene contents summarizing the completeness of the new little skate genome. Y-axis represents different classes of BUSCO genes as follows: M, missing; F, fragmented; D, complete and duplicated; S, complete and single copy; C, complete. (B) Repetitive element identified in little skate compared with diverse phylogenetic lineages.
Figure 1—figure supplement 4

Limitation of previous transcriptome data.
(A) The Alignment coverage distribution when the alignment was performed using the predicted genes of new skate genome (blue) and old transcriptome (yellow) as the reference. (B) The example of the comparison between new and previous data shown in Foxp1 locus. Number of amino acids encoded in the CDS is shown on the right.
Figure 1—figure supplement 5
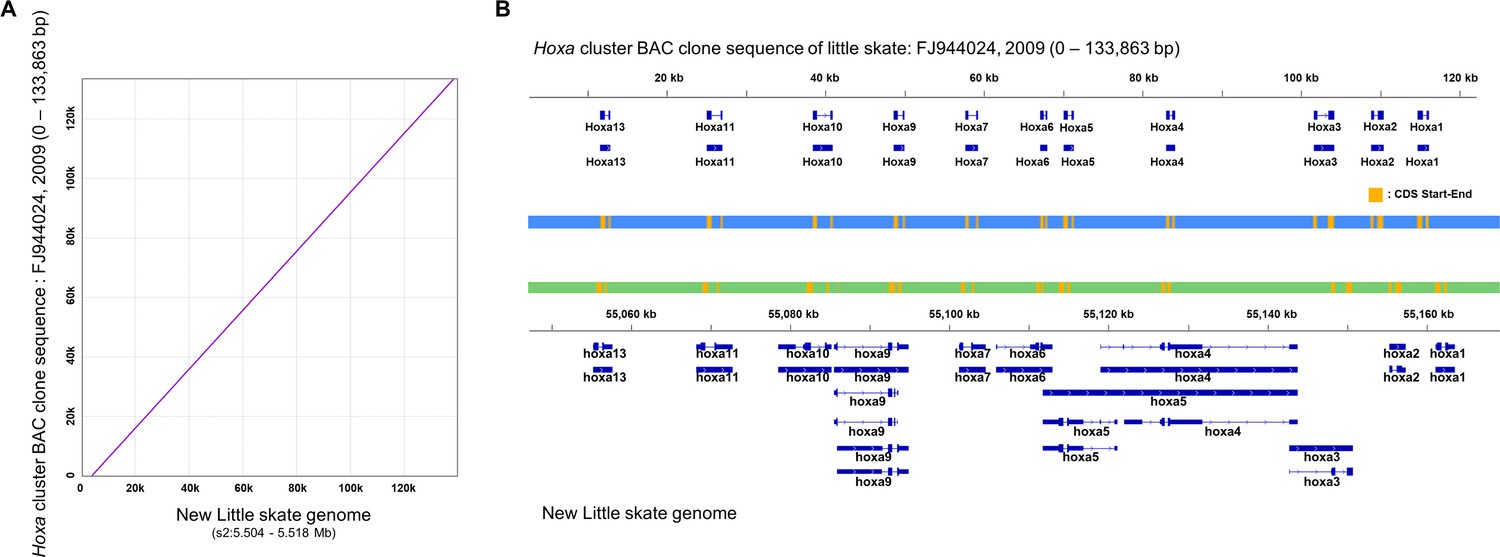
Qualitative assessment of genome assembly of Hoxa cluster.
(A) Pairwise-alignment of Hoxa cluster. (B) Hoxa genes of previous BAC clone (top) and the new genome (bottom).
Figure 1—figure supplement 6

Comparison of Hoxc clusters.
(A) The majority of ortholog genes highly conserved in multiple species near Hoxc cluster are mapped to s41 of little skate genome. (B) The repeat and gene contents near the orthologous genes. The Hoxc cluster is in general located near the region with low repeat and gene contents except in chicken and zebrafish chr11.
Figure 2
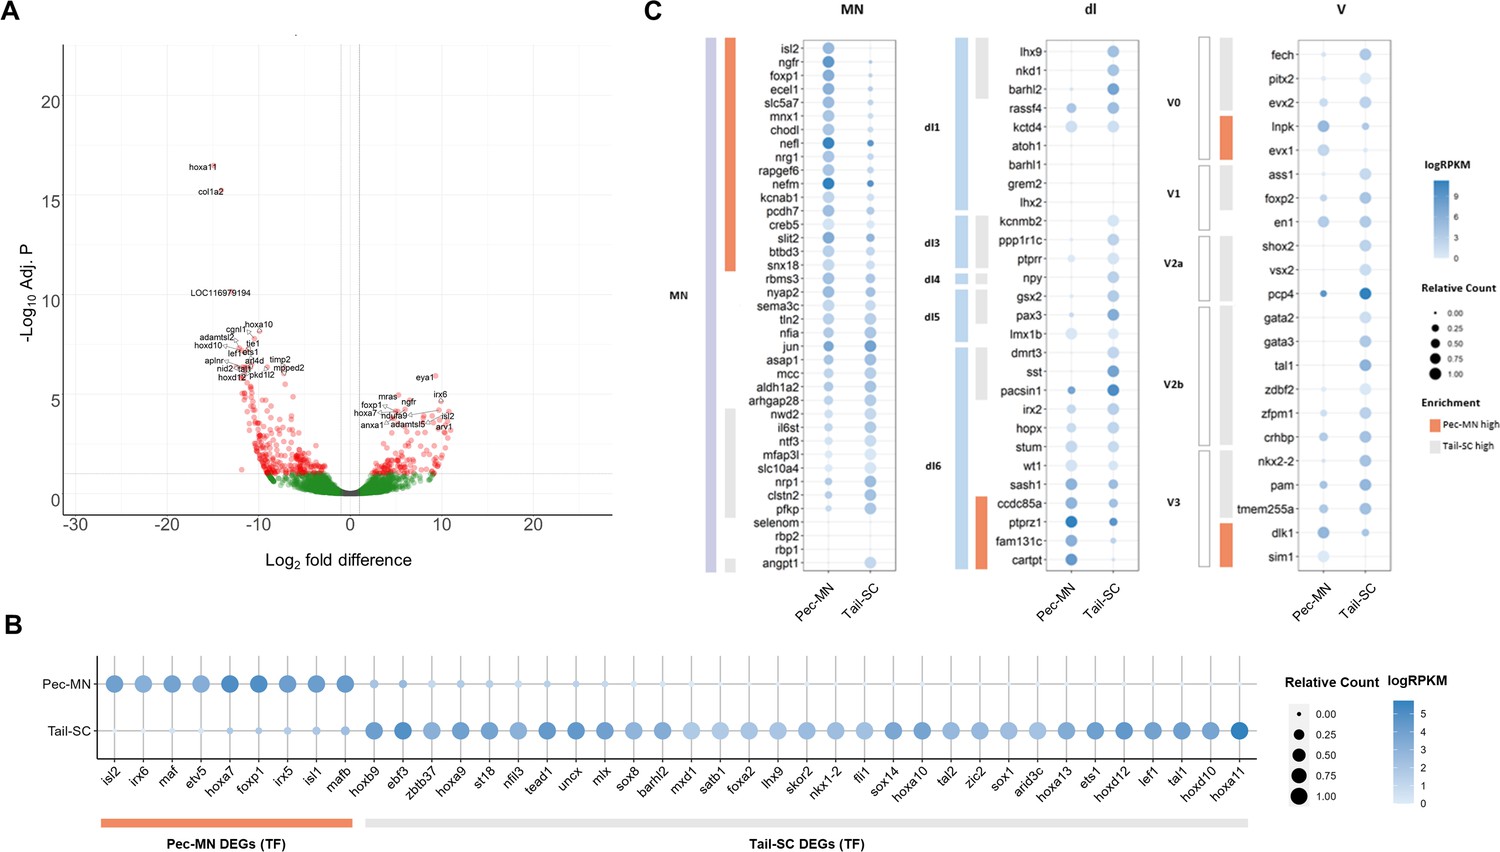
Differentially expressed genes of Pec-MNs and Tail-SC.
(A) Volcano plot of gene expression. Each dot represents individual genes, and each gene is color-coded according to its fold difference and significance: Red dots: FD ≥2, adjusted p-value (adj. p)<0.1, the top 20 genes with lowest p-value are labelled; green dots: FD ≥2, adj. p≥0.1; grey dots: FD <2, adj. p≥0.1. The genes highly expressed in pec-MNs and tail-SC are on the right and left, respectively. (B) The differentially expressed TFs under the gene ontology (GO) term ‘DNA-binding transcription factor activity’. Pec-MN and tail-SC DEGs are indicated by orange and grey bars, respectively. (C) Comparison of pec-MN and tail-SC DEGs with the gene expression of mouse MN and interneuron marker genes (Delile et al., 2019); MN: Motor neuron, dl1-6: dorsal interneurons, V0-3: Ventral interneurons. MN and interneuron markers highly expressed in pec-MNs compared to tail-SC are indicated by orange bars; while markers expressed at higher levels in the tail-SC than in pec-MNs (FD ≥2) are indicated by grey bars. Absolute expression levels are color-coded in blue and relative expression levels are indicated by circle size.
Figure 3 with 3 supplements
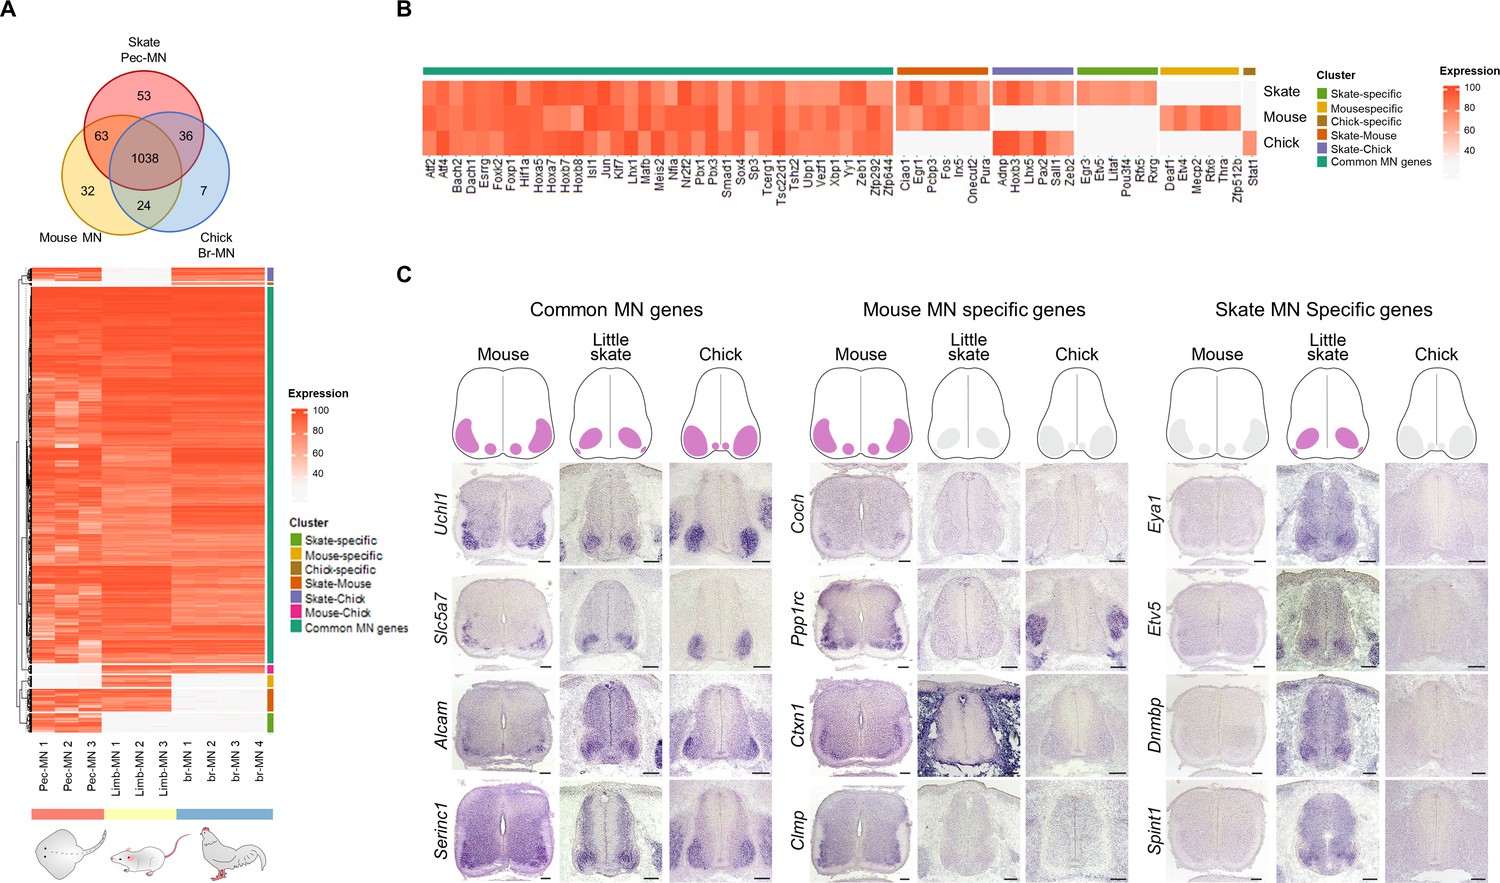
Potential MN marker genes commonly or divergently expressed in different species.
(A) Venn diagram and heatmap of MN-expressed genes (percentile expression >70) of little skate, mouse and chick. In the heatmap, expression levels are color coded according to percentile expression in each species. (B) Expression heat map of transcription factor genes. (C) Gene expression pattern in tissue sections revealed by in situ RNA hybridization. Shown on the top is the schematic summary of the expression. Common MN-expressed genes: expression levels ranked above 70th percentile in all species; Mouse MN-specific genes: expression levels ranked above 70th percentile in mouse and below 30th percentile in little skate and chick; little skate MN-specific genes: expression levels ranked above 70th percentile in little skate and below 30th percentile in mouse and chick. Tissues are from e13.5 mouse, stage 30 little skate, and HH stage 26–27 chick embryos. Scale bars: 100 μm in (C).
Figure 3—figure supplement 1
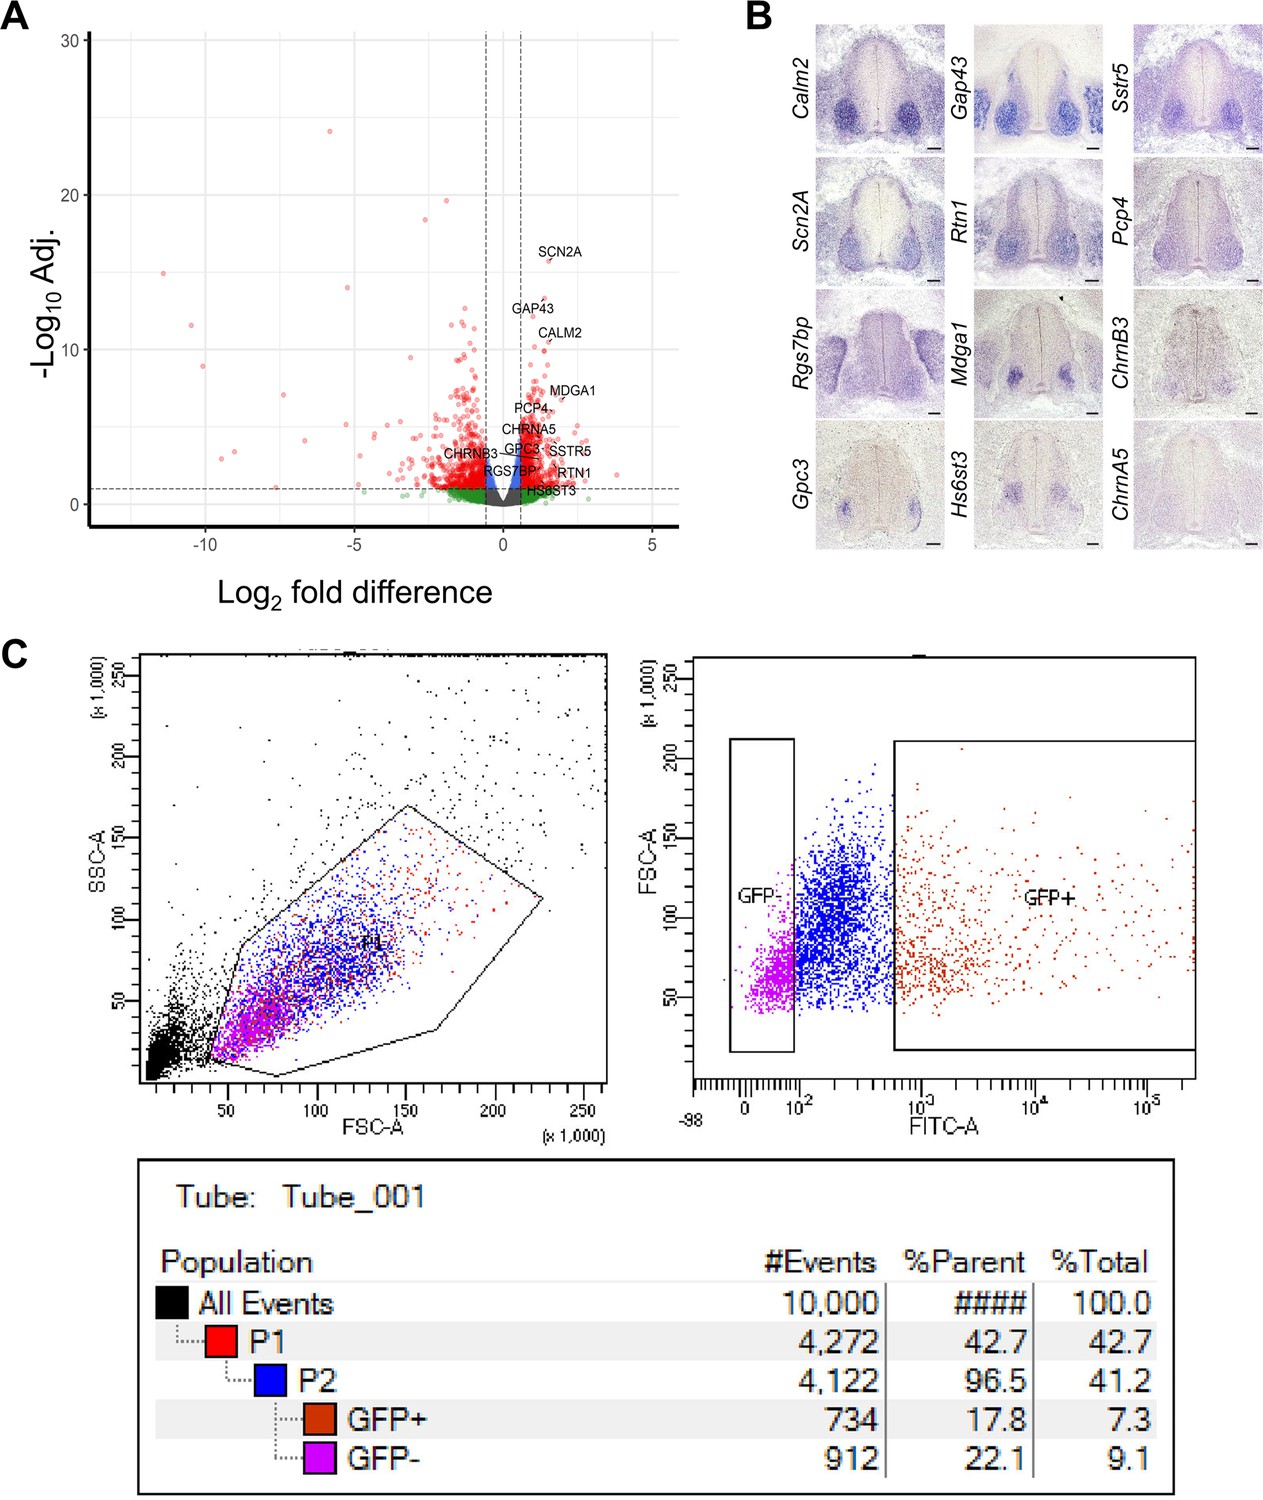
Validation of chick MN RNA-seq.
(A) volcano plot of DEG analysis of chick br-MNs compared to ce-SC. Each dot represents individual genes. Left side: enriched genes in ce-SC; right side: enriched genes in br-MNs. Dashed lines denotes FD = ±1.5 and adj.p-value=0.1 on x and y axis, respectively. The validated marker genes are labeled. (B) Expression pattern of DEGs in chick tissues revealed by in situ RNA hybridization. DEGs that are highly enriched in br-MNs compared to the ce-SC are tested. Tissues are from HH stage 26–27 chick embryos. (C) An example of scatter plots showing the fraction of YFP+ cells in a dissociated sample, measured by FACS sorter. Scale bars: 100 μm in (B).
Figure 3—figure supplement 2
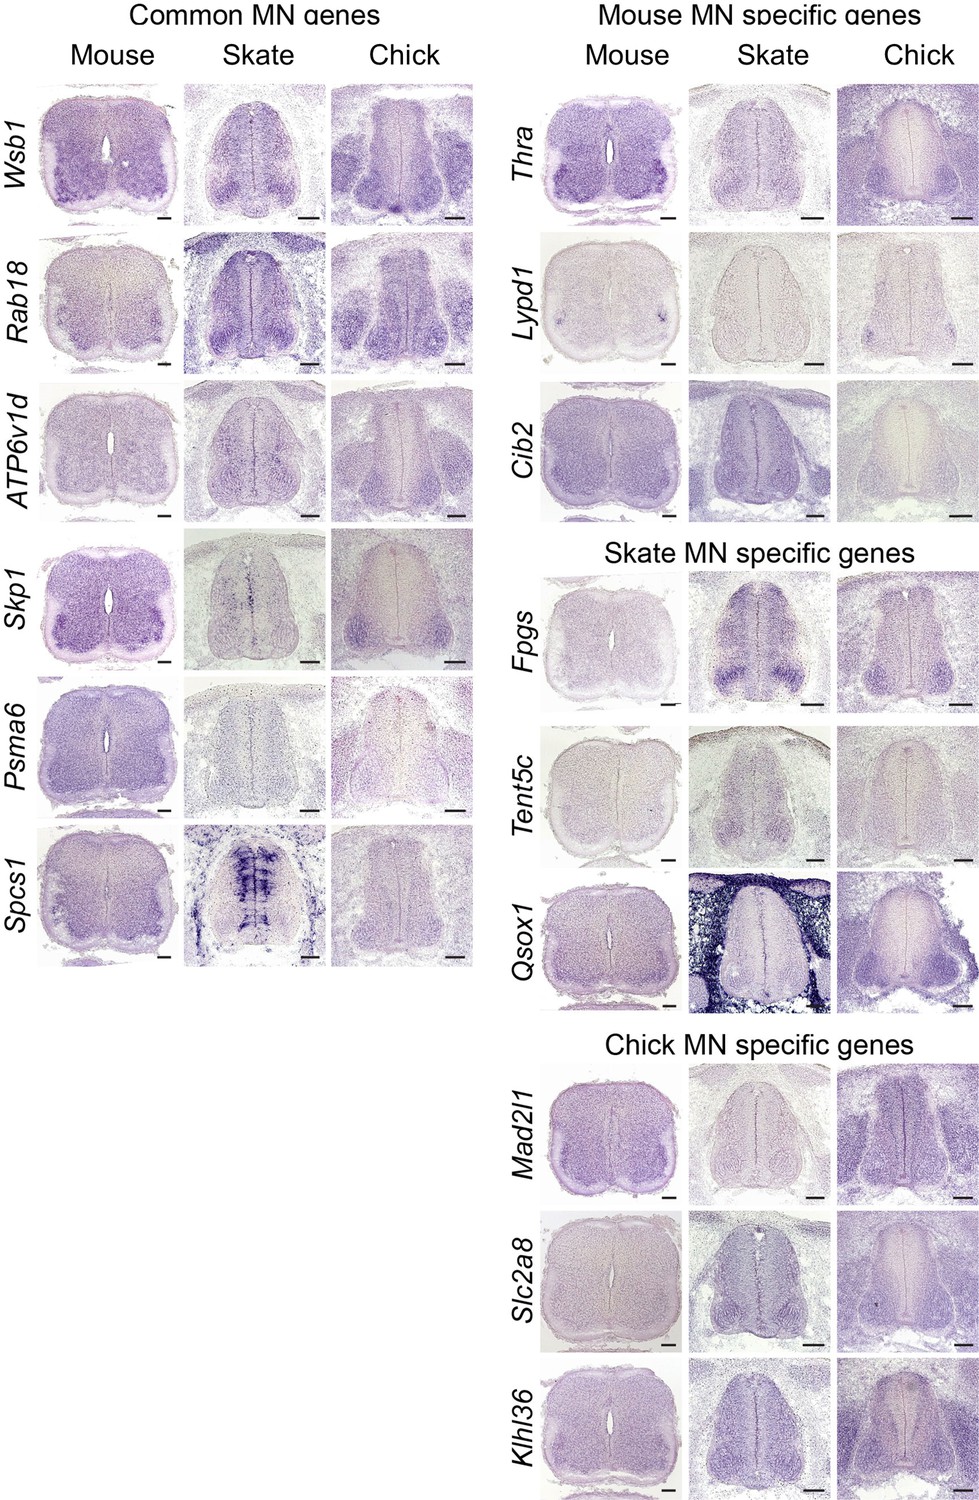
Validation of MN gene expression.
Gene expression pattern in tissue sections is revealed by in situ RNA hybridization. Common MN-expressed genes: expression levels ranked above 70th percentile in all species; Mouse MN-specific genes: expression levels ranked above 70th percentile in mouse and below 30th percentiles in little skate and chicken; little skate MN-specific genes: expression levels ranked above 70th percentile in little skate and below 30th percentile in mouse and chicken; chicken MN-specific genes: expression levels ranked above 70th percentiles in chicken and below 30th percentile in mouse and little skate. Tissues are from e13.5 mouse, stage 30 little skate, and HH stage 26–27 chicken embryos. Scale bars: 100 μm.
Figure 3—figure supplement 3
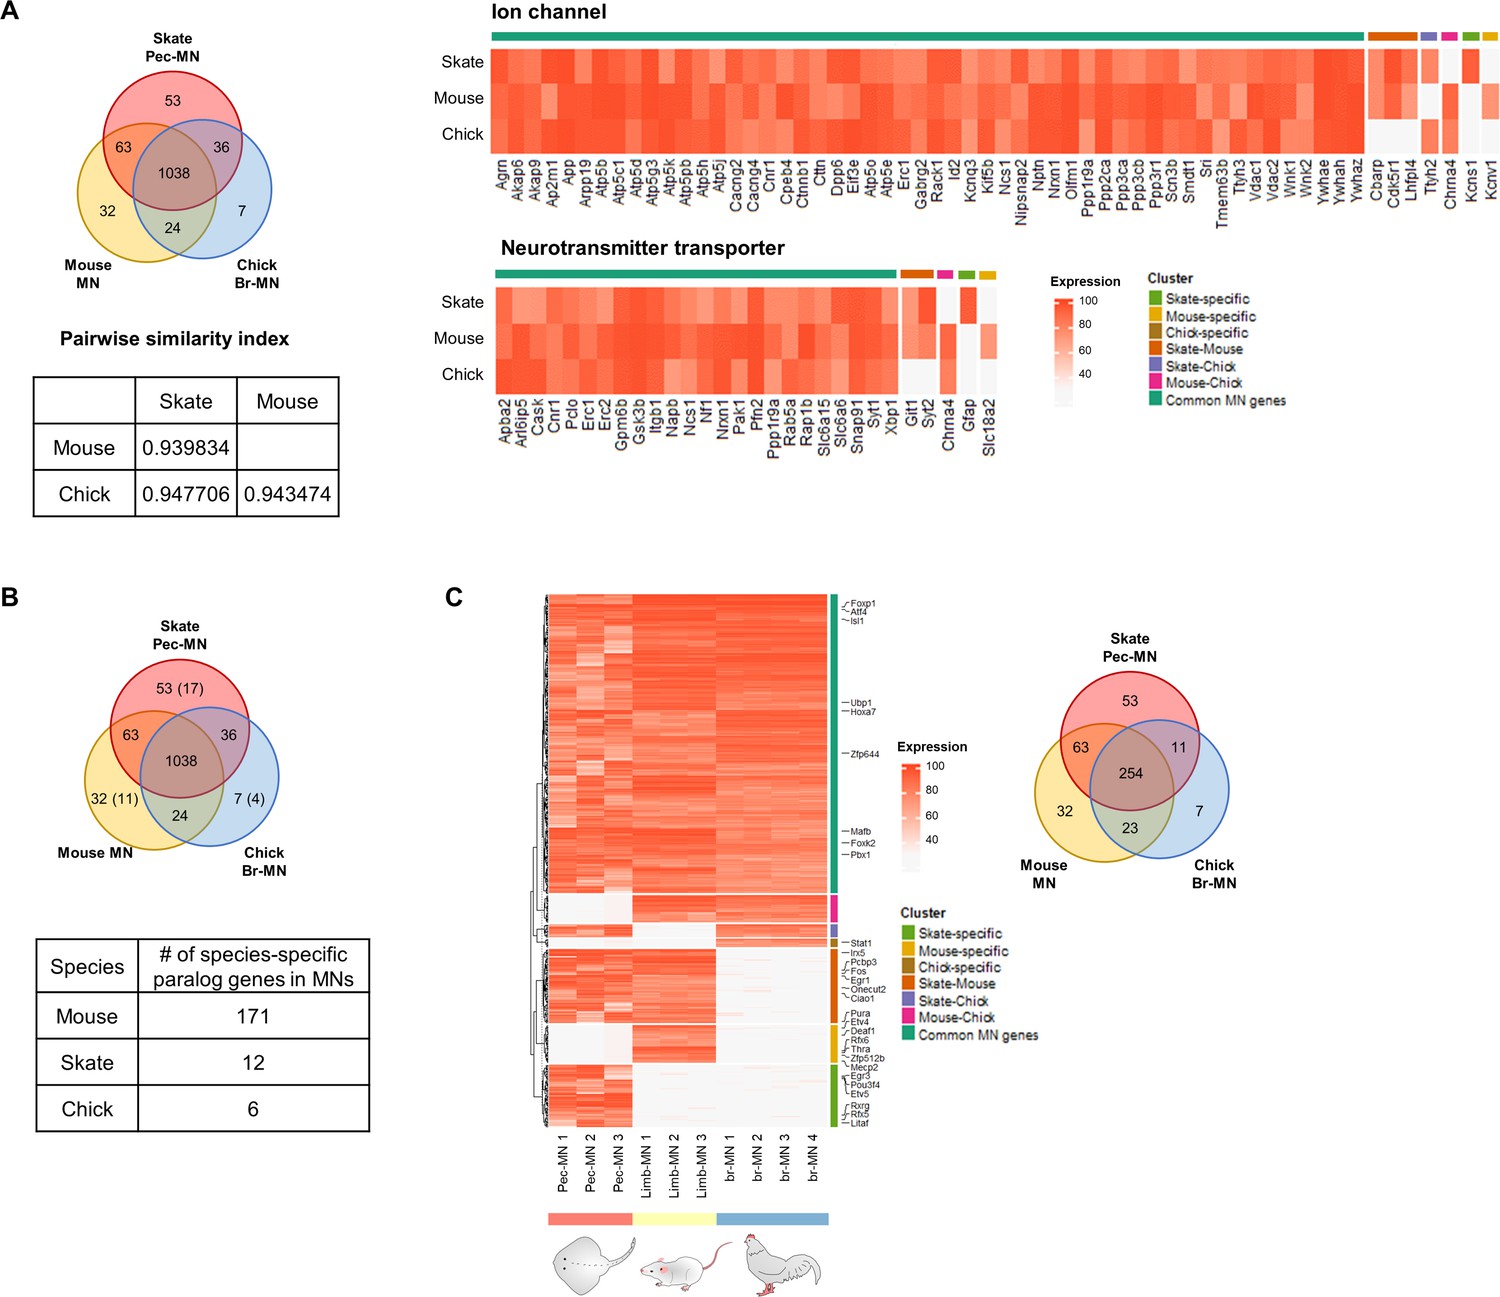
Common and species-specific genes.
(A) Similarity index between the three species based on the number of shared and specific MN-expressed genes. The heatmap of the genes associated with the ion channel and neurotransmitter transporter are shown. The intensity of the heatmap represents the average percentile expression of the three species. (B) Quantification of paralog genes. The parenthesis in the Venn diagram indicates the number of genes which are paralogs of one of the common MN-expressed genes. The table below shows the number of paralog genes excluded from ortholog gene analyses which are species-specific. The species-specific genes here were identified by comparing ortholog groups defined by eggNOG. (C) Shared and species-specific genes after removing those genes which are also highly expressed in tail-SC and ce-SC (likely to be housekeeping genes).
Figure 4 with 3 supplements
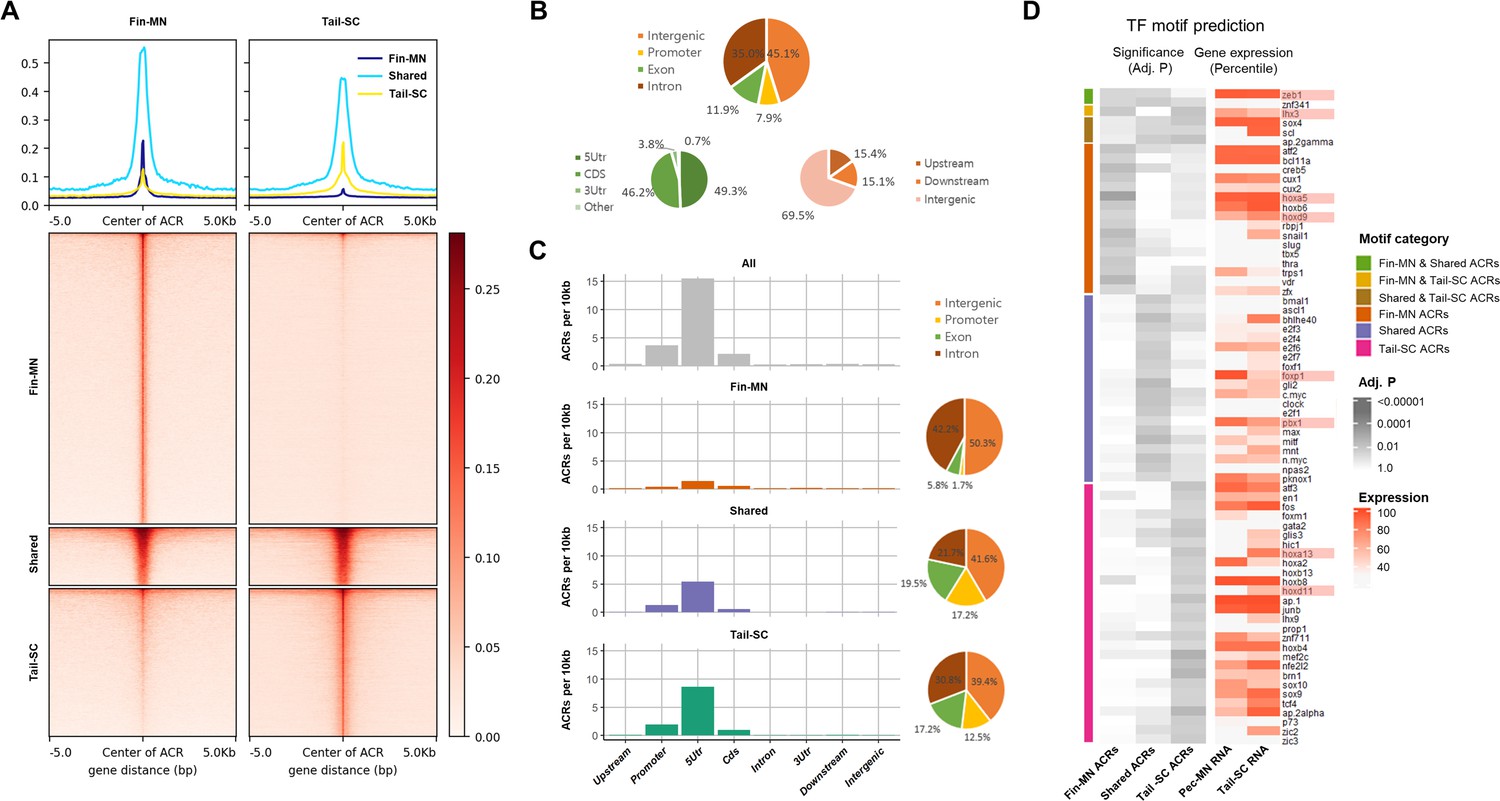
Overview of ATAC-seq data.
(A) Heatmap of 61997 ACRs. Fin-MN ACRs on the left and tail-SC ACRs on the right. The number of ACRs: shared-ACRs, 7869; fin-MNs- specific ACRs, 35741; tail-SC-specific ACRs, 18387. Higher intensity in red shows regions with higher ATAC-seq read depth. The line plot on top shows the average read depth around 5 Kb of ACR centers. (B) Proportion of all ACRs (fin-MNs and tail-SC) in different genomic regions. (C) The density of ACRs (all, fin-MN-specific, shared, and tail-SC-specific ACRs) in each genomic region normalized by the respective length. (D) TF motif prediction in ACRs (adj.p <0.05; around 10 Kb up and downstream of transcription start and end sites of each gene) of pec-MN-expressed genes (percentile >70). From left to right columns: enrichment p-values of fin-MN-specific, shared and tail-SC-specific ACRs. The respective expression in pec-MNs and tail-SC is also shown for each TF on the right two columns.
Figure 4—figure supplement 1
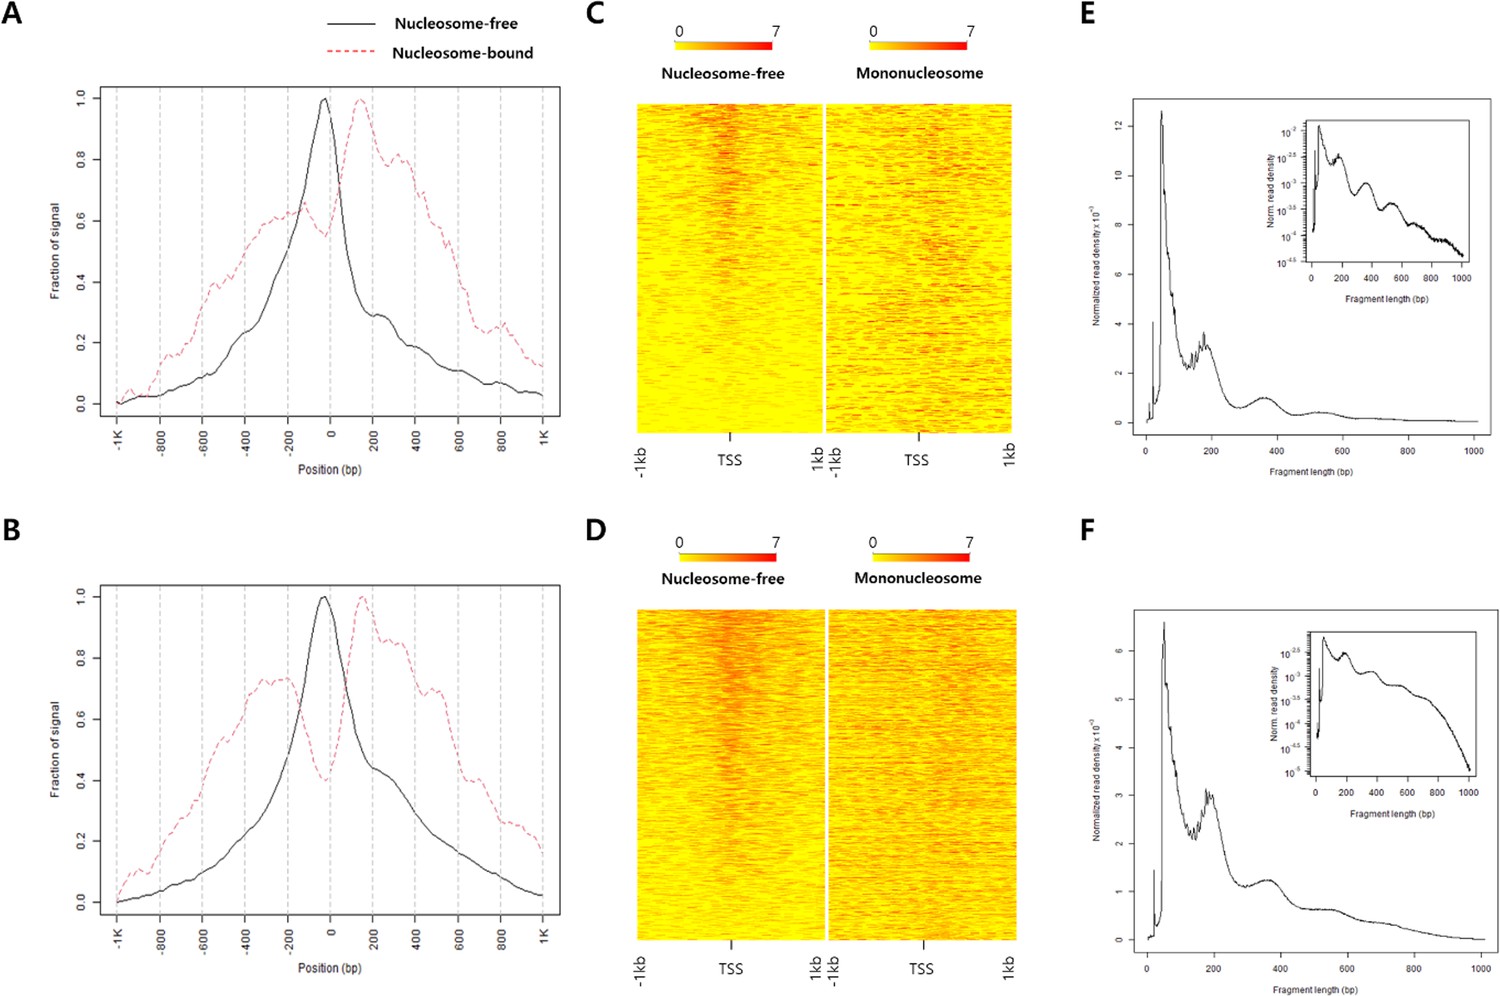
ATAC-seq data quality control.
Fraction of signal plot showing ATAC-seq read depth nearby TSS sites of (A) fin-MN and (B) tail-SC. The heatmap of 1 kb up and downstream regions of TSS sites in (C) fin-MN and in (D) tail-SC. Distribution of fragment size of the ATAC-seq data from (E) fin-MN and (F) tail-SC.
Figure 4—figure supplement 2

Chromatin accessibility of constitutively expressed genes and example genes with different peak types.
The gene expression and chromatin accessibility of constitutively expressed genes (including shared ACRs), (A) Actb, (B) Tomm70, and example genes with fin-MN and tail-SC ACRs, (C) Anxa1, (D) Trappc10.
Figure 4—figure supplement 3
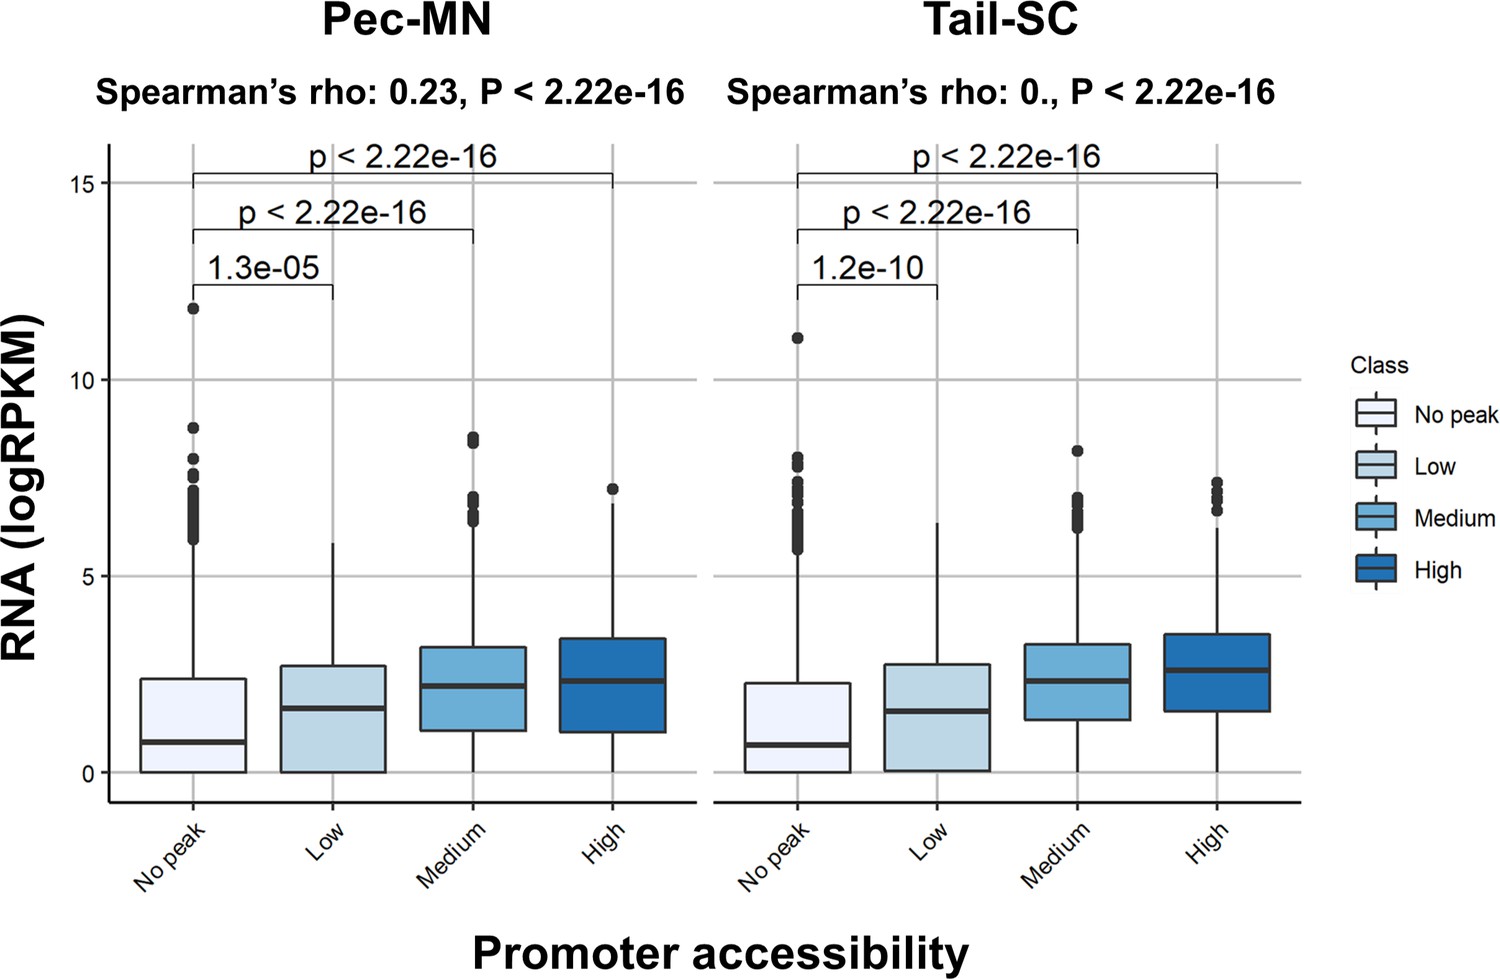
Correlation between promoter accessibility with gene expression.
No peak indicates genes without any ACR located in promoters and low, medium and high are those genes with ATAC-seq read depth <Q10, Q10 <x < Q90 and Q90 <. Center line represents median and the box limits show upper and lower quartiles. The distance to maximum or minimum data point within the 1.5 x interquartile range was used for whiskers.
Figure 5 with 2 supplements

Predicted gene regulatory modules in MNs.
(A) TF motif predictions (adj.p <0.05) identified in skate fin MN and mouse limb-level MN ACRs of MN-expressed genes (percentile >70 in either skate MNs or mouse MNs; around 10 Kb up- and downstream of transcription start and end sites of each gene). The heat map in the bottom shows the expression for the corresponding predicted TF. The significance of the enrichment and expression levels are indicated by the intensity of colors in the heatmap (grey and red). (B) Venn diagram of TF motif predictions in the ACRs of MN-expressed genes in mouse and little skate. (C) The shared motif predictions compared to motif predictions in ACRs of genes expressed in cortical PV interneuron and cortical excitatory neurons. The heatmap indicates significance of motif enrichment compared to the random background. (D) Comparison of the number of shared TFs, the number of shared motif predictions in each gene and the number of motif predictions in each ACR in the genes with percentile expression >70. * significant wilcoxon rank sum test. (E) The examples of TF motif predictions in Foxp1. Shown are the motifs of TFs expressed above 70th percentile in MNs. Predicted motifs for each TF are indicated by colored bars.
Figure 5—figure supplement 1
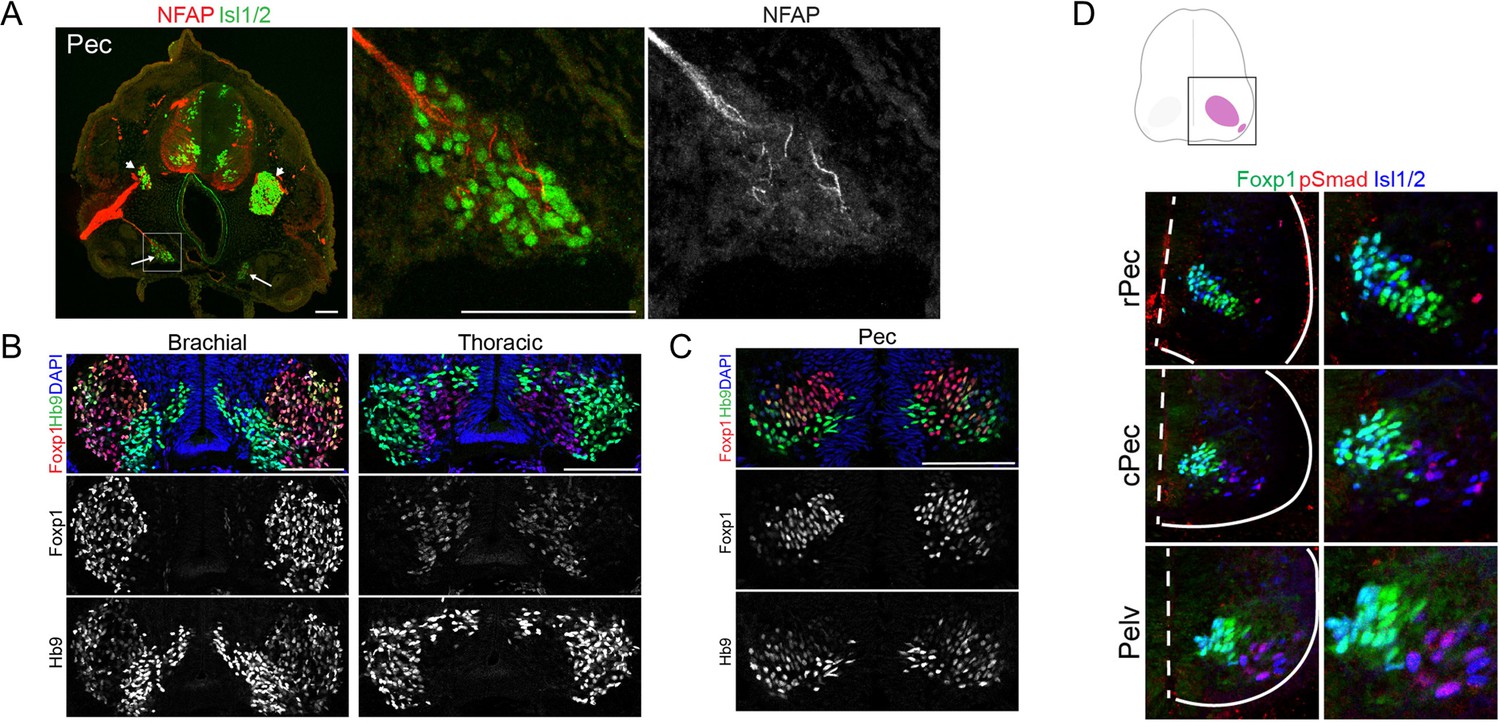
Differential regulation of Foxp1 expression in MNs of different species.
(A) The identity of PGC neurons is defined by immunofluorescence staining of marker proteins. Left: pectoral sections showing the axons (NFAP) and putative sympathetic chain ganglia (Isl1/2); middle and right: magnified image of the boxed region on the left image. Arrows indicate the putative sympathetic chain ganglia. (B) Differential expression levels of Foxp1 in wing MNs (left) and PGC MNs (right) of chick. (C) Foxp1 expression in pec-MNs of little skate. (D) The expression of Foxp1 in the putative PGC MNs (pSmad) in little skate (stage 31). Dashed line: spinal cord midline, Solid lines: spinal cord boundary.
Figure 5—figure supplement 2

Comparison of intergenic size and number of ACRs between mouse and little skate.
(A) Comparison of intergenic size of orthologous genes of mouse and little skate. (B) Distribution of the number of ACRs in all and neuronal genes. (C) Proportion of genic and intergenic ACRs for each gene.
Additional files
-
Supplementary file 1
Ortholog gene cluster.
Ortholog genes defined by the OrthoVenn2.
- https://cdn.elifesciences.org/articles/78345/elife-78345-supp1-v1.xlsx
-
Supplementary file 2
DEG results.
The DEG results for little skate (pec-MN vs tail-SC) and chick (br-MN vs ce-SC) MNs.
- https://cdn.elifesciences.org/articles/78345/elife-78345-supp2-v1.xlsx
-
Supplementary file 3
Comparison with previous RNA-seq data.
The percentile expression level and p-values of previous MN marker genes.
- https://cdn.elifesciences.org/articles/78345/elife-78345-supp3-v1.xlsx
-
Supplementary file 4
Multiple species RNA.
The percentile expression of genes displayed in Figure 3.
- https://cdn.elifesciences.org/articles/78345/elife-78345-supp4-v1.xlsx
-
Supplementary file 5
eggNOG ortholog groups.
The ortholog group information predicted by eggNOG.
- https://cdn.elifesciences.org/articles/78345/elife-78345-supp5-v1.xlsx
-
Supplementary file 6
Species-specific Paralogs.
The list of additional paralog genes which are species-specific.
- https://cdn.elifesciences.org/articles/78345/elife-78345-supp6-v1.xlsx
-
Supplementary file 7
Specific genes without common gene paralogs.
The list of species-specific genes which do not share the same ortholog groups with common genes.
- https://cdn.elifesciences.org/articles/78345/elife-78345-supp7-v1.xlsx
-
Supplementary file 8
Oligonucleotide sequences used in generating in situ probes.
T7 promoter sequence is indicated in blue
- https://cdn.elifesciences.org/articles/78345/elife-78345-supp8-v1.docx
-
Transparent reporting form
- https://cdn.elifesciences.org/articles/78345/elife-78345-transrepform1-v1.pdf
Download links
A two-part list of links to download the article, or parts of the article, in various formats.
Downloads (link to download the article as PDF)
Open citations (links to open the citations from this article in various online reference manager services)
Cite this article (links to download the citations from this article in formats compatible with various reference manager tools)
Little skate genome provides insights into genetic programs essential for limb-based locomotion
eLife 11:e78345.
https://doi.org/10.7554/eLife.78345


