Little skate genome provides insights into genetic programs essential for limb-based locomotion

  1. DongAhn Yoo
  2. Junhee Park
  3. Chul Lee
  4. Injun Song
  5. Young Ho Lee
  6. Tery Yun
  7. Hyemin Lee
  8. Adriana Heguy
  9. Jae Yong Han
  10. Jeremy S Dasen  Is a corresponding author
  11. Heebal Kim  Is a corresponding author
  12. Myungin Baek  Is a corresponding author
  1. Interdisciplinary Program in Bioinformatics, Seoul National University, Republic of Korea
  2. Department of Brain Sciences, DGIST, Republic of Korea
  3. Department of Biology, Graduate School of Arts and Science, NYU, United States
  4. Genome Technology Center, Division for Advanced Research Technologies, and Department of Pathology, NYU School of Medicine, United States
  5. Department of Agricultural Biotechnology, Seoul National University, Republic of Korea
  6. Neuroscience Institute, Department of Neuroscience and Physiology, New York University School of Medicine, United States
  7. Department of Agricultural Biotechnology and Research Institute of Agriculture and Life Sciences, Seoul National University, Republic of Korea
  8. eGnome, Inc, Republic of Korea

Abstract

The little skate Leucoraja erinacea, a cartilaginous fish, displays pelvic fin driven walking-like behavior using genetic programs and neuronal subtypes similar to those of land vertebrates. However, mechanistic studies on little skate motor circuit development have been limited, due to a lack of high-quality reference genome. Here, we generated an assembly of the little skate genome, with precise gene annotation and structures, which allowed post-genome analysis of spinal motor neurons (MNs) essential for locomotion. Through interspecies comparison of mouse, skate and chicken MN transcriptomes, shared and divergent gene expression profiles were identified. Comparison of accessible chromatin regions between mouse and skate MNs predicted shared transcription factor (TF) motifs with divergent ones, which could be used for achieving differential regulation of MN-expressed genes. A greater number of TF motif predictions were observed in MN-expressed genes in mouse than in little skate. These findings suggest conserved and divergent molecular mechanisms controlling MN development of vertebrates during evolution, which might contribute to intricate gene regulatory networks in the emergence of a more sophisticated motor system in tetrapods.

Editor's evaluation

This study provides the genome of the little skate Leucoraja erinacea, a cartilaginous fish that displays pelvic fin-driven walking-like behavior. Leveraging this genomic resource, the authors compare gene expression and chromatin accessibility profiles in motor neurons of the little skate and other species (e.g., mouse, chicken), aiming to predict conserved and divergent gene regulatory mechanisms underlying motor neuron development. The work represents an important contribution to the field of comparative genomics and evolutionary biology.

https://doi.org/10.7554/eLife.78345.sa0

Introduction

The little skate Leucoraja erinacea is a marine species of jawed vertebrate which shares a common ancestor with tetrapods 473 MYA (Kumar et al., 2017). Yet, it displays a walking-like behavior which resembles limb-based locomotion (Holst and Bone, 1993; Koester et al., 2003; Jung et al., 2018), suggesting that the genetic programs and neural subtypes essential for walking existed in a common ancestor of cartilaginous fish and tetrapods. Hence, Leucoraja erinacea is a useful model organism for the study of locomotor circuits, as it may provide insights into the genetic programs underlying limb-driven locomotion that may have originated in the common ancestor of vertebrates with paired appendages (Gillis and Shubin, 2009). Previous developmental studies on the little skate demonstrated a conserved Hox TF-dependent regulatory network that specifies MNs innervating fin and limb muscle (Jung et al., 2018). Little skate pectoral and pelvic fin MNs express forelimb MN Hox genes, Hoxa6/7 and a hindlimb MN Hox gene, Hoxa10, respectively. In addition, the little skate genome lacks the Hoxc cluster (King et al., 2011) and its spinal cord is occupied by fin MNs without an inter-fin region, which is reminiscent of the Hoxc cluster mutant mouse (Jung et al., 2014). However, the mechanisms that regulate expression of genes controlling motor circuit development remain to be identified, and how different species generate MN subtypes to innervate ~10 pelvic fin muscles of little skate (Macesic and Kajiura, 2010) versus ~50 limb muscles of tetrapods (Sweeney et al., 2018; Landmesser, 1978; Sullivan, 1962) remains to be determined.

To investigate common and divergent regulatory gene networks of the little skate and tetrapods, integrated analysis of comparative genomics, transcriptomics and epigenomics analyses, including assay for transposase-accessible chromatin using sequencing (ATAC-seq) can be applied. However, in little skate, such genome-wide omics studies have been limited due to severe fragmentation of the reference genome (Wyffels et al., 2014). Limitations of short-read sequencing, such as the 500 bp read length in the case of skate genome, are unable to cover long repeats, leading to poor assembly of repeat-rich regions. Continuous long read (CLR) sequencing provides a solution to such assembly errors. With the assistance of available high-quality reference assemblies of phylogenetically close species, long read sequencing allows for reference-guided scaffolding and comparative annotations approaches (Alonge et al., 2019; Fiddes et al., 2018).

In response to the limited reference genome of little skate, this and a similar study by Marletaz et al. generated new genome assemblies (Marletaz et al., 2022). Marletaz et al. generated a new chromosome-scale genome via combination of Pacbio, Illumina and Hi-C sequencing. Here, we generated a new genome assembly of 2.13 Gb and gene annotation of little skate by applying a combination of PacBio long-read and Illumina short-read sequencing analyses, a state-of-art assembly and annotation pipeline (Alonge et al., 2019; Fiddes et al., 2018; Kolmogorov et al., 2019). Based on the new reference genome, transcriptome and ATAC-seq analyses were performed to identify gene expression patterns and chromatin accessibility of fin-innervating MNs. Through a comparative transcriptome analysis with two well-studied tetrapods (mouse and chick), we identified both conserved and divergent gene expression patterns among different species. Comparative chromatin accessibility analysis revealed more TF motif predictions in the MN-expressed genes in mouse than in little skate, which might support the emergence of a more intricately regulated motor system during evolution. The findings of this study provide deeper insights into the origin of genetic programs underlying limb-based locomotion.

Results

High-quality little skate genome assembly through a combination of long and short read sequencing

The genome of Leucoraja erinacea was assembled using a combination of PacBio long read and Illumina short read data (Figure 1A and B). Presented in Figure 1A are the top 49 scaffolds ranked by the length which are equivalent to the number of chromosomes in thorny skate genome (sAmbRad1) (Rhie et al., 2021). The 49 scaffolds constituted 97.8% of the little skate genome. Compared to the previous assembly, our assembled genome size increased by 36.5%–2.13 Gb (Wyffels et al., 2014) ~93% of the estimated genome size based on K-mer spectra of whole genome sequencing data (Figure 1—figure supplement 1). The contiguity of the genome was also improved by over 300-fold, in terms of contig N50 of 214 Kb. The completeness of the new genome assembly is highlighted in the benchmarking universal single-copy orthologs (BUSCO) gene contents (Figure 1—figure supplements 23). Missing and fragmented BUSCO which was 69.1% and 23.9% in the previous assembly has been reduced to 7.3% and 3.6% in our assembly, respectively. Also, the proportion of complete BUSCO genes (89.1%) as well as the long transcript lengths demonstrate improved completeness than that of the previous assembly (Figure 1—figure supplements 3 and 4). As repetitive elements are reported to have large variation among cartilaginous fish genomes (Rhie et al., 2021; Hara et al., 2018), the repeats were investigated using Repeatmasker (Smit et al., 2013) and were compared. Approximately, 63.6% of the little skate genome is occupied by repetitive elements (Figure 1—figure supplement 3B), which may account for its relatively large genome size compared to elephant shark and zebrafish genomes (C.milii-6.1.3 and GRCz11) (Venkatesh et al., 2014; Howe et al., 2013). Among the repeats, long interspersed nuclear elements (LINE) were the most abundant of all classes which is similar to thorny skate and three shark genome assemblies (Hara et al., 2018).

Figure 1 with 6 supplements see all
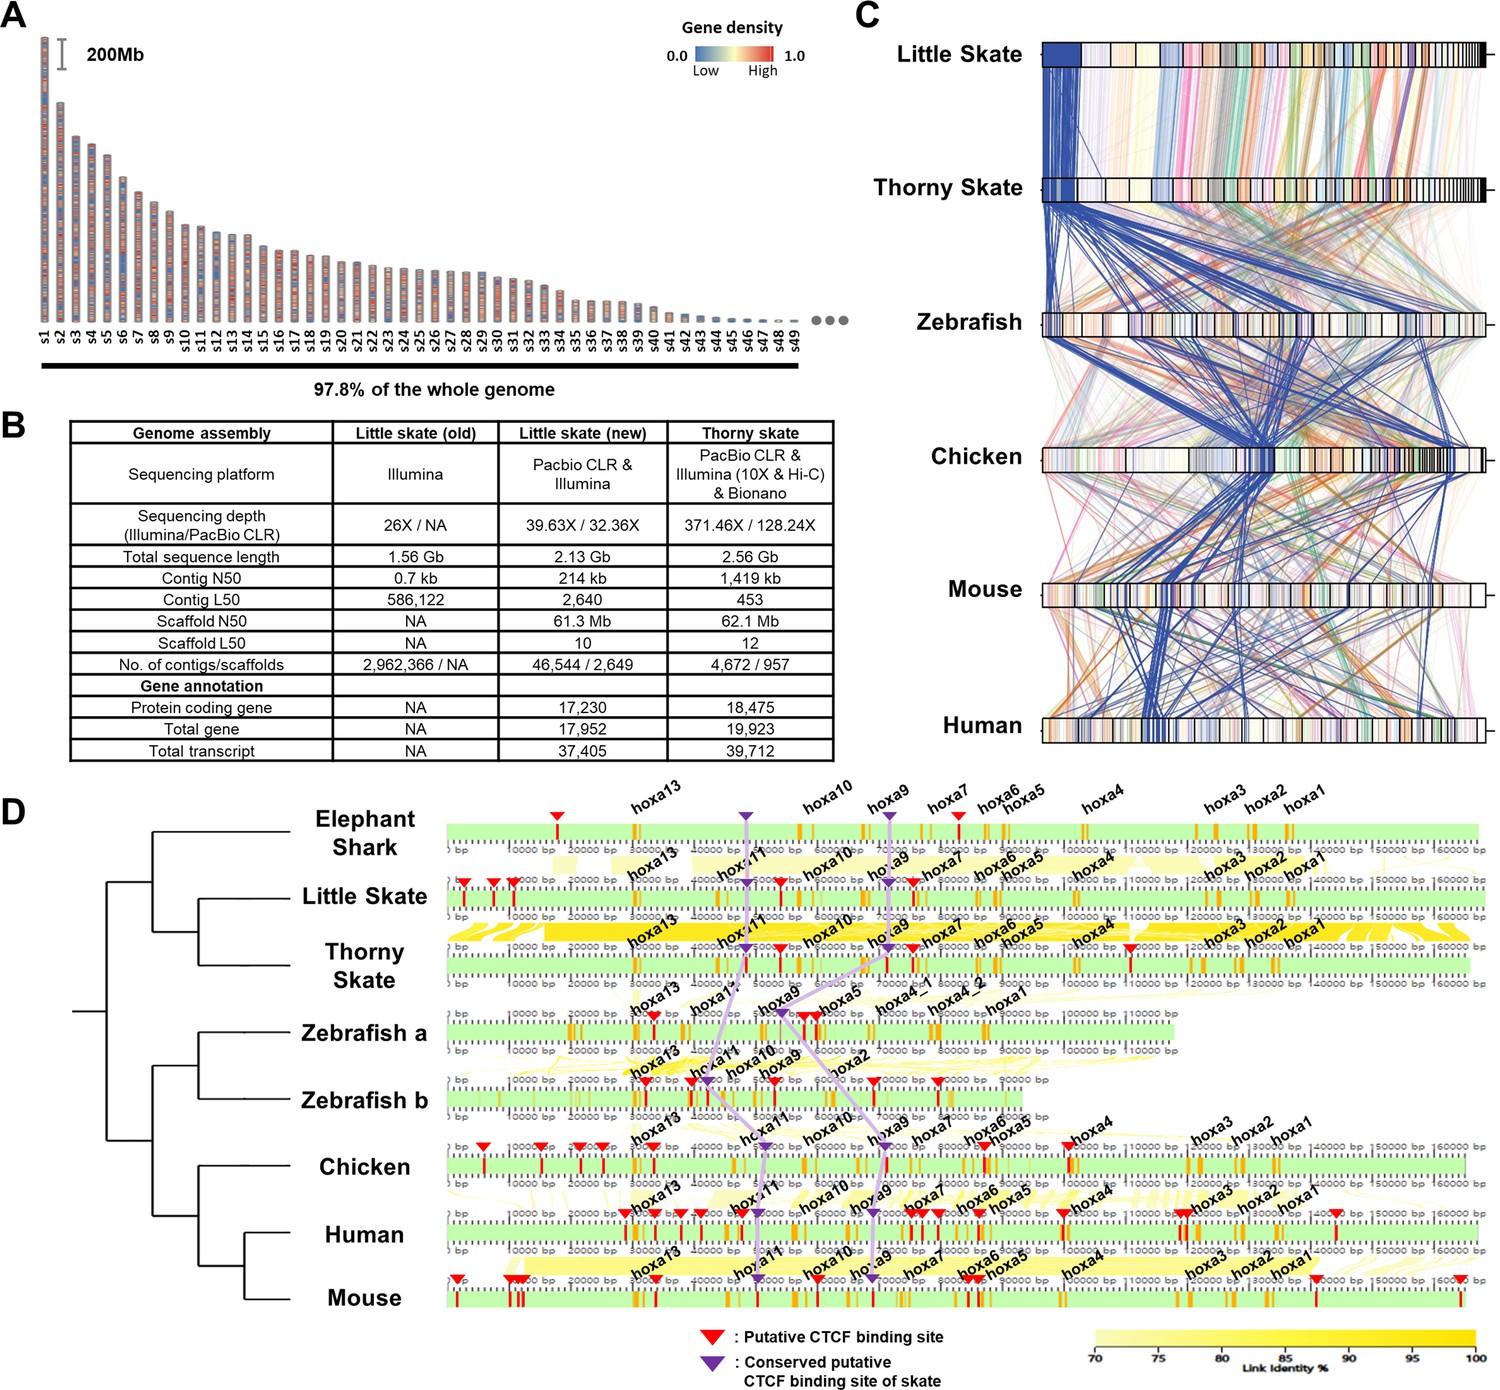
Assembly and comparison of little skate genomes across diverse phylogenetic lineages.

(A) Top 49 scaffolds ranked by the length. Gene density in the scaffolds is color coded. (B) Assembly statistics of the skate genome. (C). Comparison of BUSCO gene synteny across diverse phylogenetic lineages. The BUSCO genes in each scaffold of the new little skate genome are color coded and the longest scaffold (s1) is highlighted in blue. (D) Putative motifs of CTCF in the Hoxa cluster. CTCF motifs are predicted (described in materials and methods) and indicated by red bars and arrowheads and the ones conserved by purple bars and arrowheads. The exons in the genome are denoted by orange bars. The sequence identities of alignment blocks are indicated by the intensity of yellow color.

A scaffold N50 of 61.3 Mb of our little skate genome assembly was comparable to a recently published high-quality thorny skate genome assembly (Rhie et al., 2021; 62.1 Mb; Figure 1B). The number of protein-coding genes (17,230) and transcripts (17,952) predicted in the new genome assembly was similar to the number in the thorny skate genome (Figure 1B). As a qualitative assessment of our genome assembly, we compared an existing sequence of the Hoxa cluster constructed using a BAC clone (Mulley et al., 2009) (FJ944024), to our assembled genome. Coding sequences in our assembled Hoxa cluster aligned well with the fully sequenced BAC clone (Figure 1—figure supplement 5), highlighting the reliability of the new assembly. We observed complete loss of Hoxc cluster in the little skate genome which was also shown in the thorny skate genome (King et al., 2011; Rhie et al., 2021; Criswell et al., 2021) and relatively high repeat contents nearby genomic regions in the scaffold41 (s41), which contains the largest number of the Hoxc neighbor genes (Figure 1—figure supplement 6). Although a residual fragment of Hoxc cluster was reported in the shark genomes (Hara et al., 2018), cloudy cat shark, bamboo shark, and whale shark genomes are not visualized here due to an absence of gene annotation files.

Comparing the new little skate genome with the one of thorny skate, we found high level of conservation in terms of BUSCO gene contents (Figure 1C). Interestingly, we also observed that the BUSCO gene synteny of little skate showed more similar patterns with chicken and mammals than with zebrafish (Figure 1C). In addition to gene content, we also compared putative CTCF motifs, which are known to regulate expression of Hoxa genes during development (Kim et al., 2011; Narendra et al., 2015; Figure 1D). In tetrapods, Hoxa genes are expressed in spinal cord MNs and specify their subtype identities (Jung et al., 2014; Dasen et al., 2005; Lacombe et al., 2013), and similarly in little skate, Hoxa genes are expressed in spinal cord MN subtypes (Jung et al., 2018). Among previously reported CTCF sites in mouse (Narendra et al., 2015), one located between Hoxa7 and Hoxa9, and between Hoxa10 and Hoxa11 were conserved across diverse species and were also observed in little skate Hoxa cluster despite the phylogenetic distance (Figure 1D). On the other hand, the CTCF motifs near Hoxa13 upstream and between Hoxa5 and Hoxa6 which are conserved in other species were not found in putative CTCF sites of skate, elephant shark, and other sharks reported previously (Hara et al., 2018). The absence of the CTCF site between Hoxa5 and Hoxa6 may contribute to the relatively expanded domain of Hoxa9 in fin innervating MNs (Jung et al., 2018; Narendra et al., 2015).

DEG analysis with a new reference genome revealed comprehensive MN markers

Previous RNA sequencing data of little skate MNs (Jung et al., 2018), which was analyzed using the zebrafish transcriptome, was re-analyzed with the new little skate genome. Comparing the expression of 10,270 genes in pectoral fin MNs (pec-MNs) with tail-region spinal cord (tail-SC) identified 411 differentially expressed genes (DEGs) including 135 genes upregulated in the pec-MNs and 276 genes in the tail-SC (Figure 2). Larger number of DEGs in tail-SC may be caused by comparing heterogeneous cell types in tail-SC with homogeneous cell type in pec-MNs. Although the total number of DEGs are different from the previous data (592 vs 135 genes in pec-MN DEGs), which might be due to different statistical analysis with different reference genome, previous RNA-seq data based on de novo assembly and zebrafish-based annotation was mostly recapitulated in our DEG analysis based on our new skate genome (21 out of 24 previous fin MN marker genes have the expression level ranked above 70th percentile in Pec-MNs; Supplementary file 3). Among the identified DEGs, genes associated with the GO term ‘DNA-binding transcription factor activity’ including caudal Hox genes, Hox10-13 were highly expressed in tail-SC compared to pec-MNs while a rostral Hox gene, Hoxa7 was highly expressed in pec-MNs (Figure 2B), which is consistent with previous immunohistochemical analyses (Jung et al., 2018).

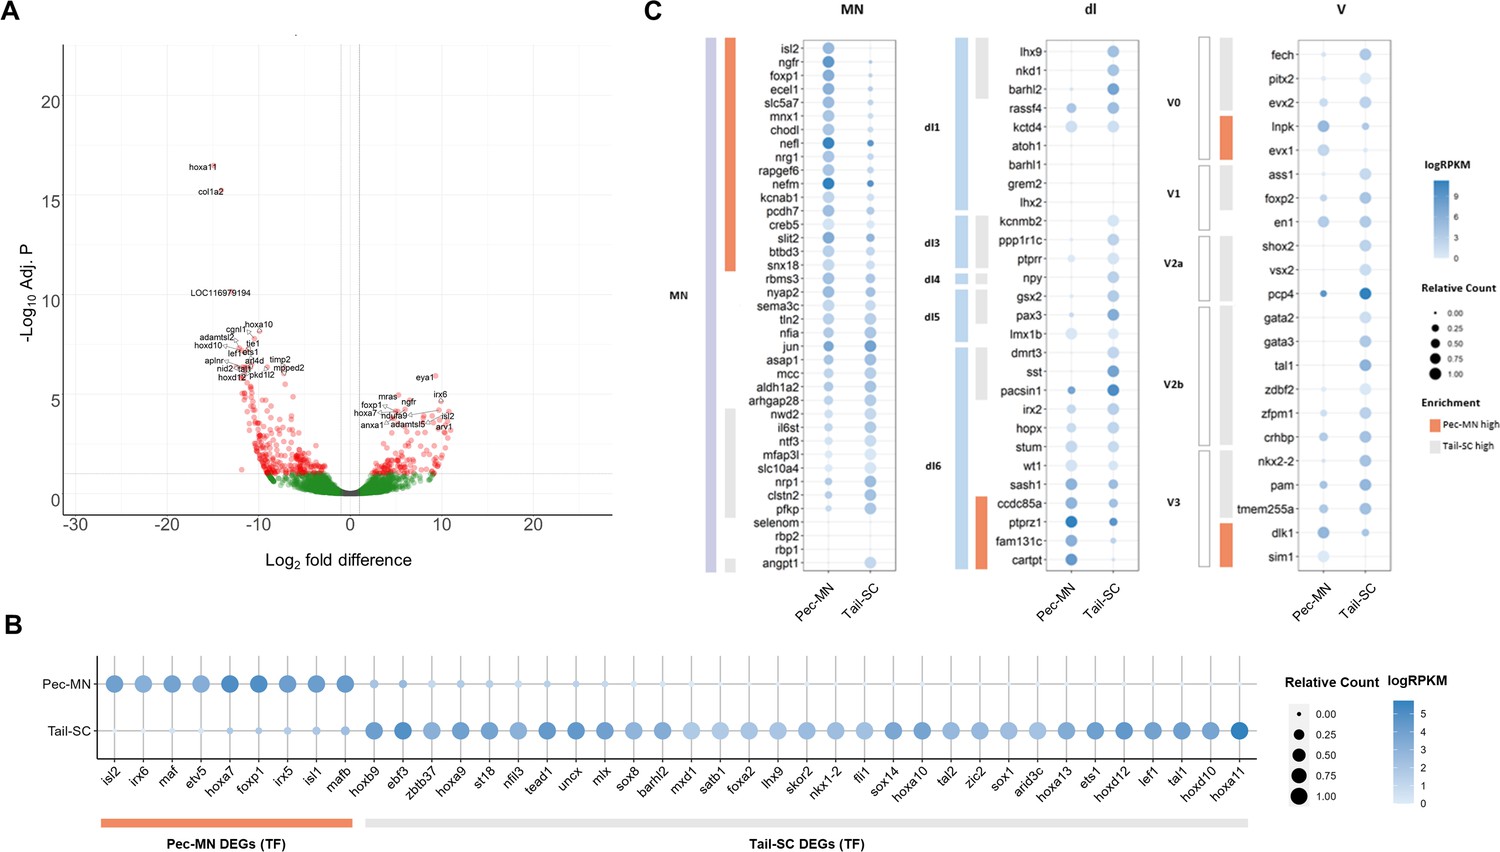
Differentially expressed genes of Pec-MNs and Tail-SC.

(A) Volcano plot of gene expression. Each dot represents individual genes, and each gene is color-coded according to its fold difference and significance: Red dots: FD ≥2, adjusted p-value (adj. p)<0.1, the top 20 genes with lowest p-value are labelled; green dots: FD ≥2, adj. p≥0.1; grey dots: FD <2, adj. p≥0.1. The genes highly expressed in pec-MNs and tail-SC are on the right and left, respectively. (B) The differentially expressed TFs under the gene ontology (GO) term ‘DNA-binding transcription factor activity’. Pec-MN and tail-SC DEGs are indicated by orange and grey bars, respectively. (C) Comparison of pec-MN and tail-SC DEGs with the gene expression of mouse MN and interneuron marker genes (Delile et al., 2019); MN: Motor neuron, dl1-6: dorsal interneurons, V0-3: Ventral interneurons. MN and interneuron markers highly expressed in pec-MNs compared to tail-SC are indicated by orange bars; while markers expressed at higher levels in the tail-SC than in pec-MNs (FD ≥2) are indicated by grey bars. Absolute expression levels are color-coded in blue and relative expression levels are indicated by circle size.

Using our newly annotated genome, we comprehensively examined the similarity of gene expression patterns between skate and tetrapod spinal neurons. The expression of a set of molecular markers for spinal MNs and interneurons of mouse embryos (Delile et al., 2019) were examined in skate pec-MNs and tail-SC. Overall, we observed a greater number of mouse MN-expressed genes were highly expressed in pec-MNs (enriched in pec-MN, 17 genes; enriched in tail-SC, 9 genes; fold difference (FD) ≥2; Figure 2C). On the other hand, a greater number of interneuron markers was observed in tail-SC (enriched in tail-SC, 29 genes; enriched in pec-MNs, 8 genes; FD ≥2), which is composed predominantly of interneuron cell-types.

The evolution of genetic programs in MNs was investigated unbiasedly by comparing highly expressed genes in pec-MNs (percentile expression >70) of little skate with the ones from MNs of mouse and chick, two well-studied tetrapod species. In order to compare gene expression with homologous cell types from each species, we performed RNA sequencing with forelimb MNs of mouse embryos at embryonic day 13.5 (e13.5) and wing level MNs of chick embryos at Hamburger-Hamilton (HH) stage 26–27, which was validated by RNA in situ hybridization (Figure 3—figure supplement 1). The comparison of orthologous MN-expressed genes revealed a large number of genes with shared expression as well as species-specific expression which could represent similarity and divergence between skate and the two tetrapod species (Figure 3; Figure 3—figure supplement 3A). Among shared genes, 1038 genes were commonly found in mouse, little skate and chick, while 63, 36, and 24 genes were identified in the little skate-mouse pair, little skate-chick pair and mouse-chick pair, respectively (Figure 3A). Species-specific genes were also identified; 53, 32, and 7 genes were highly expressed (percentile >70) in MNs of little skate, mouse and chick with almost no expression in the remaining species (percentile <30), which suggest that the genes are expressed in MNs of one species but not in MNs of other species at the similar developmental stages (Figure 3; Figure 3—figure supplement 2). However, 11, 17, and 4 genes of mouse, skate and chick MN-specific genes were found to be paralogs of at least one shared gene (Figure 3—figure supplement 3B) leaving only a few species-specific genes without paralog expression. In addition to the comparisons among ortholog genes, we also identified 12, 171, and 6 paralog genes specifically expressed by skate, mouse and chicken MNs, respectively which could further explain species-specific differences of MNs (Figure 3—figure supplement 3B; Supplementary files 6 and 7). These results were validated by performing RNA in situ hybridization in tissue sections on a subset of species-specific genes (Figure 3C; Figure 3—figure supplements 1 and 2).

Figure 3 with 3 supplements see all
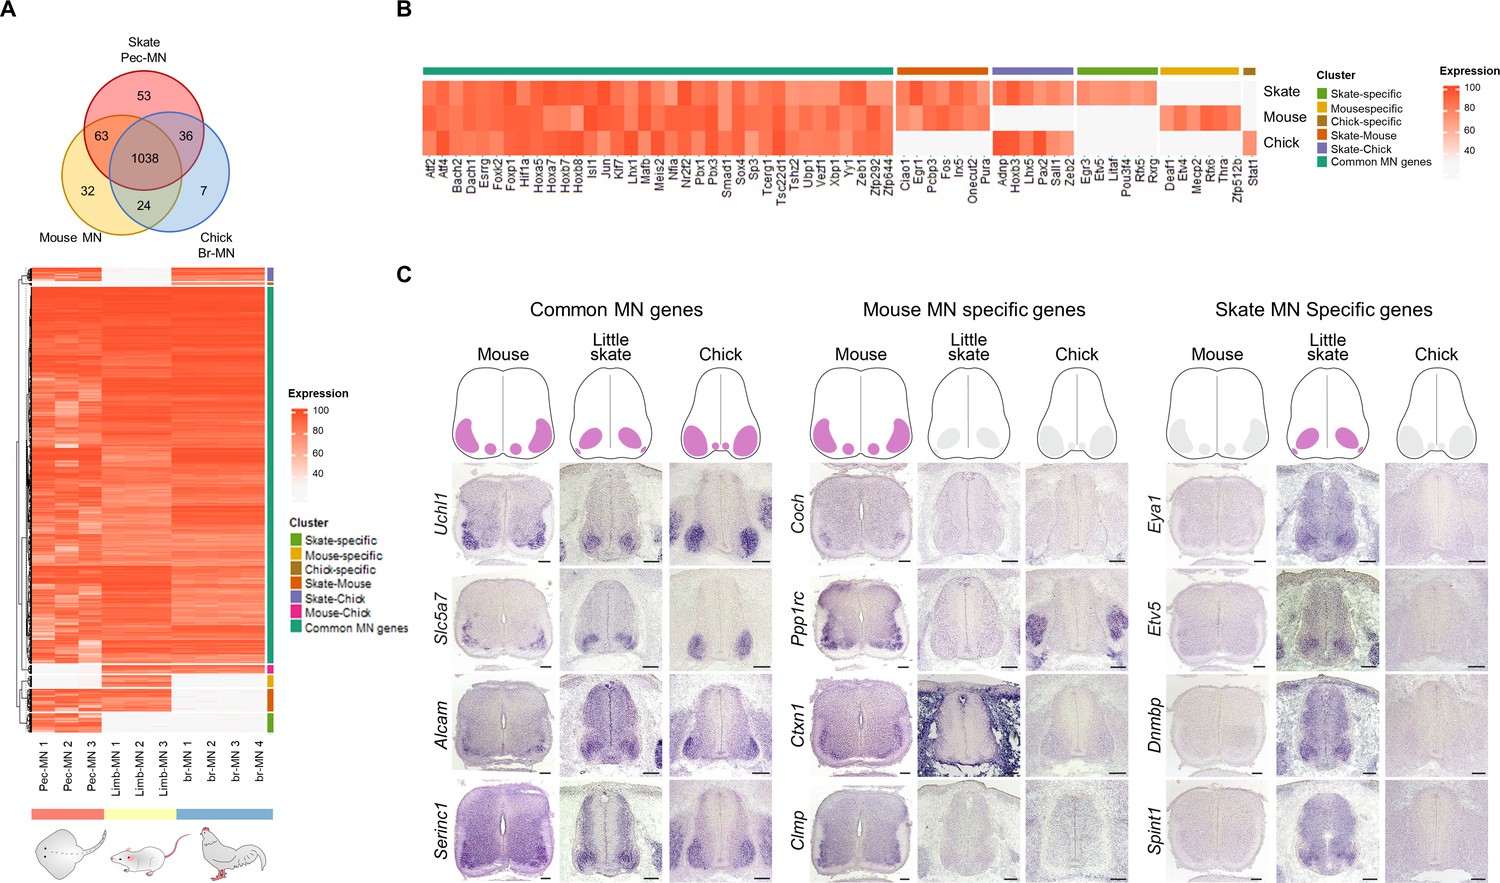
Potential MN marker genes commonly or divergently expressed in different species.

(A) Venn diagram and heatmap of MN-expressed genes (percentile expression >70) of little skate, mouse and chick. In the heatmap, expression levels are color coded according to percentile expression in each species. (B) Expression heat map of transcription factor genes. (C) Gene expression pattern in tissue sections revealed by in situ RNA hybridization. Shown on the top is the schematic summary of the expression. Common MN-expressed genes: expression levels ranked above 70th percentile in all species; Mouse MN-specific genes: expression levels ranked above 70th percentile in mouse and below 30th percentile in little skate and chick; little skate MN-specific genes: expression levels ranked above 70th percentile in little skate and below 30th percentile in mouse and chick. Tissues are from e13.5 mouse, stage 30 little skate, and HH stage 26–27 chick embryos. Scale bars: 100 μm in (C).

ATAC-seq analysis in little skate MNs uncovered putative regulators of MN DEGs

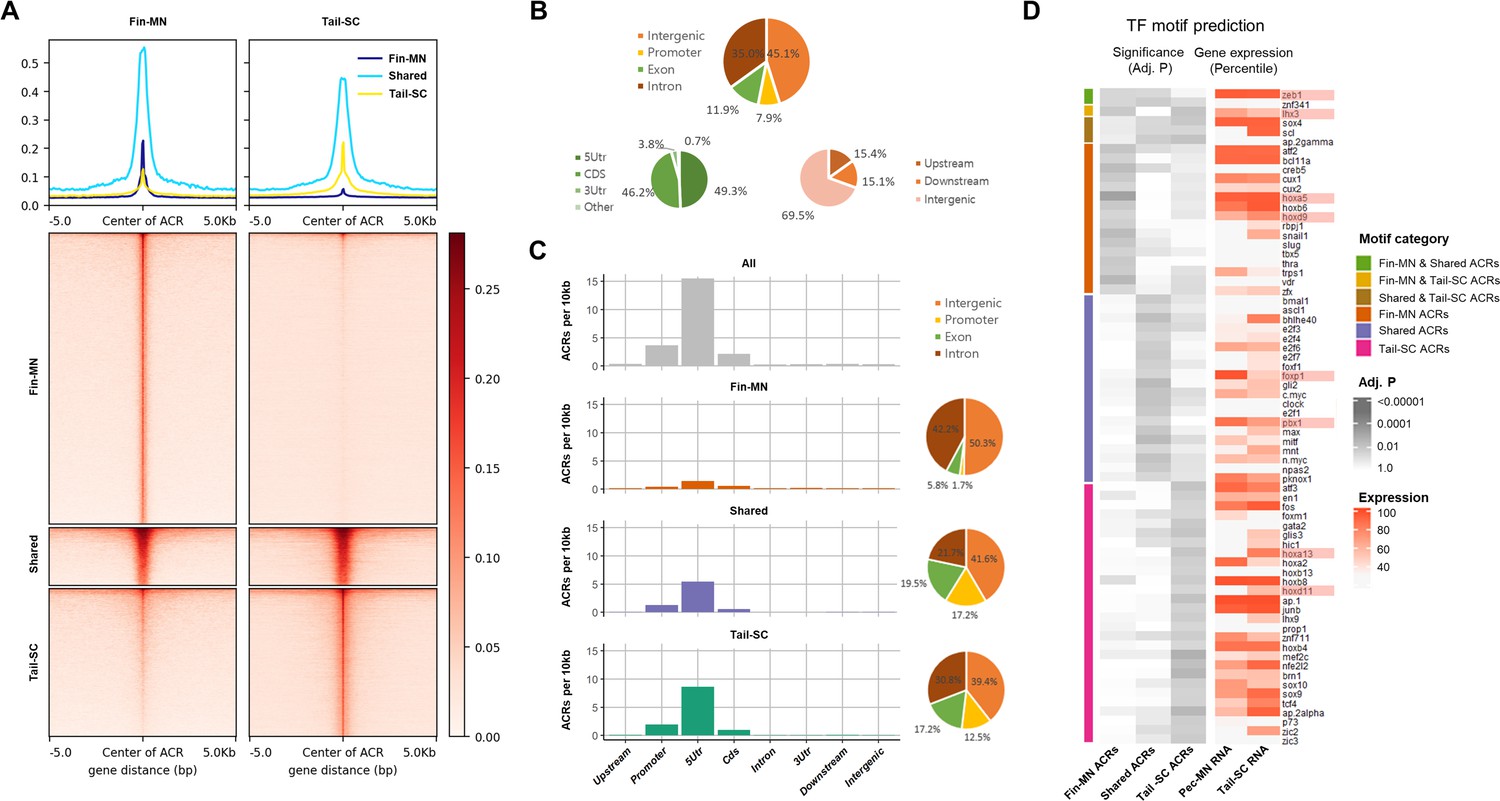
Our high-quality little skate genome assembly, with sufficient contiguity of scaffold covering potential regulatory regions, allowed us to further investigate the mechanisms of gene regulation in little skate fin MNs. We examined chromatin accessibility by performing ATAC-seq from isolated pectoral/pelvic fin MNs (fin-MNs) and tail-SC. The quality control for ATAC-seq data is summarized in Figure 4—figure supplement 1; the highest ATAC-seq read depth was observed right before the transcription start site (TSS) for nucleosome-free reads than the nucleosome-bound reads (Figure 4—figure supplement 1A-D). The distribution of insert size shows similar trends with the typical size distribution of ATAC-seq analysis (Yan et al., 2020; Figure 4—figure supplement 1E and F). Through peak calling, a total of 61,997 consensus accessible chromatin regions (ACRs) were identified in fin-MNs and tail-SC, indicated by intense red color in the heatmap (Figure 4A). Among them, 7869 ACRs were found in both fin-MNs and tail-SC while 35,741 and 18,387 ACRs were found only in fin-MNs and tail-SC, respectively (Figure 4A; Figure 4—figure supplement 2). On average, higher read depth was observed for fin-MN ACRs than that of the tail-SC.

Figure 4 with 3 supplements see all
Overview of ATAC-seq data.

(A) Heatmap of 61997 ACRs. Fin-MN ACRs on the left and tail-SC ACRs on the right. The number of ACRs: shared-ACRs, 7869; fin-MNs- specific ACRs, 35741; tail-SC-specific ACRs, 18387. Higher intensity in red shows regions with higher ATAC-seq read depth. The line plot on top shows the average read depth around 5 Kb of ACR centers. (B) Proportion of all ACRs (fin-MNs and tail-SC) in different genomic regions. (C) The density of ACRs (all, fin-MN-specific, shared, and tail-SC-specific ACRs) in each genomic region normalized by the respective length. (D) TF motif prediction in ACRs (adj.p <0.05; around 10 Kb up and downstream of transcription start and end sites of each gene) of pec-MN-expressed genes (percentile >70). From left to right columns: enrichment p-values of fin-MN-specific, shared and tail-SC-specific ACRs. The respective expression in pec-MNs and tail-SC is also shown for each TF on the right two columns.

The genome-wide distribution analysis of ACRs showed that many ACRs were found in intron and intergenic regions for all ACR types (intron, 35.0%; intergenic region, 45.1%; Figure 4B); however, normalizing each region by its length, the density of ACRs was found to be highest in promoters and 5’UTRs (Figure 4C). Even though higher number of fin-MN-specific ACRs were identified, the ACR normalized by region length showed lower density for fin-MN specific ACRs because large number of the ACRs in the fin-MNs were found in intron and intergenic regions which constitute the largest proportion of the genome. After observing that the ACR density is higher near the TSS, the correlation between chromatin accessibility in the promoter region and the gene expression level was investigated. As a result, we found that the genes with greater depth of ATAC-seq in their promoter region are generally expressed at higher levels than those genes with closed chromatin form in both fin-MNs and tail-SC (Figure 4—figure supplement 3), indicating that ACRs in the promoter region are likely to be associated with gene activation.

Using the ACR data, enrichment test of putative TF motifs was performed for genes expressed in pec-MNs (percentile >70) to reveal potential regulatory mechanisms (Figure 4D). Overall, 19, 25, and 32 TF motif predictions were found in fin-MN-specific ACRs, shared and tail-SC-specific ACRs, respectively. Interestingly, difference in the enrichment of predicted motifs of Hox proteins, well-known MN subtype regulators along the rostro-caudal axis of the spinal cord (Jung et al., 2018; Dasen et al., 2005; Dasen et al., 2003), was found in the ACRs of pec-MNs genes and tail-SC genes. Fin-MN-specific ACRs were enriched with predicted motifs of Hoxa5 and Hoxd9, which are expressed in the fin-MNs of little skate, while the tail-SC-specific ACRs were enriched with the predicted motifs of Hoxd11 and Hoxa13, expressed in tail SCs of little skate (Jung et al., 2018). In addition, motif predictions of Foxp1, Pbx1, and Lhx3, well-known regulators in MN (Dasen et al., 2008; Hanley et al., 2016; Thaler et al., 2002), were found in the ACRs; the motif predictions of Foxp1and Pbx1 in shared ACRs and Lhx3 in fin-MN-specific and tail-SC-specific ACRs, respectively (Figure 4D).

Predicted shared and diverged gene regulatory systems in MNs of little skate and mouse

To evaluate the degree of conservation of the skate gene regulatory system in MNs with that of land-walking vertebrates, the TF motif prediction was performed with the ACRs of skate fin MN compared with the mouse limb-level MN ATAC-seq data (Sawai et al., 2022; Figure 5). Among the ACRs of skate pec-MN and mouse limb-level MN-expressed genes (percentile >70; Figure 5), a larger number of TF motif predictions were found in mouse (115) compared to skate (Howe et al., 2013). However, it is important to note that the larger number of TF motif predictions in mouse MN-expressed genes could be due to the biased motif database toward mouse TFs.

Figure 5 with 2 supplements see all
Predicted gene regulatory modules in MNs.

(A) TF motif predictions (adj.p <0.05) identified in skate fin MN and mouse limb-level MN ACRs of MN-expressed genes (percentile >70 in either skate MNs or mouse MNs; around 10 Kb up- and downstream of transcription start and end sites of each gene). The heat map in the bottom shows the expression for the corresponding predicted TF. The significance of the enrichment and expression levels are indicated by the intensity of colors in the heatmap (grey and red). (B) Venn diagram of TF motif predictions in the ACRs of MN-expressed genes in mouse and little skate. (C) The shared motif predictions compared to motif predictions in ACRs of genes expressed in cortical PV interneuron and cortical excitatory neurons. The heatmap indicates significance of motif enrichment compared to the random background. (D) Comparison of the number of shared TFs, the number of shared motif predictions in each gene and the number of motif predictions in each ACR in the genes with percentile expression >70. * significant wilcoxon rank sum test. (E) The examples of TF motif predictions in Foxp1. Shown are the motifs of TFs expressed above 70th percentile in MNs. Predicted motifs for each TF are indicated by colored bars.

Among the motif predictions, 14 TF motifs were commonly found in both mouse limb-level and skate fin MN ACRs (Figure 5A and B), while only a subset of the 14 TF motifs (10 TF motifs, PV interneurons; 8 TF motifs, excitatory neurons) were enriched in ACRs of genes expressed in cortical PV interneuron and excitatory neurons (Mo et al., 2015; Figure 5C). Motif predictions of Pknox1, Pbx3, Hoxa5, and Cux1 were found in ACRs of genes expressed in skate fin MNs and mouse limb-level MNs but not in the neurons of the brain, which suggests that the shared TF motifs were not randomly observed, and the shared TF motifs may have functions in regulating cell type or regional identities of neurons.

In the ACRs of the highly expressed genes in MNs (percentile >70), we found a significantly greater number of predicted TF motifs in mouse MNs than in skate MNs (Figure 5D and E), suggesting that the greater number of predicted TFs would potentially bind to and regulate the expression of genes expressed in mouse limb-level MNs compared to skate fin MNs.

Discussion

The little skate is an emerging model to study the evolution of the neuronal circuits for locomotion. Here, in an attempt to understand the origin of the genetic program for tetrapods locomotion, we generated the new reference genome assembly of little skate with gene annotations. We predicted the regulatory mechanisms of gene expression in MNs through integrating RNA and chromatin accessibility data from multiple vertebrate species. As a result, we found both conserved and divergent gene expression in MNs across multiple species. Moreover, through chromatin accessibility analysis we found TF motif predictions that could regulate the MN-expressed genes in mouse and little skate. These findings provide deeper insights into the evolution of genetic pathways essential for limb-based locomotion.

High-quality genome assembly of little skate provides a reference for studying gene regulatory mechanisms in MNs

A previous highly fragmented and incomplete genome of Leucoraja erinacea (Wyffels et al., 2014) is unsuitable for post-genome analysis. Therefore, improving the quality of the little skate reference genome is a first step towards a more complete analysis of gene regulatory networks. To improve the quality of the little skate genome, whole genome sequencing data including PacBio long reads and Illumina short reads were generated. Even though this study used fewer resources relative to that of more recent sequencing pipelines, which used multiple sequencing technologies including chromosomal conformation capture and physical maps (Rhie et al., 2021), this study could assemble a reference genome which is highly contiguous and offers reliable coding and regulatory region data. This was accomplished by using the assembly of a closely-related species—thorny skate—as a reference during scaffolding process. However, it is important to note that the contig N50 of this little skate genome is still lower than that of the thorny skate assembly. Also, the higher number of scaffolds and the presence of little skate contigs which had not been localized to pseudo-chromosomes of thorny skate may indicate that little skate and thorny skate genomes contain a few structural disagreements.

Despite this limitation, the new reference genome allowed for a more reliable RNA-seq analysis. Through re-analyzing the previously generated RNA-seq data (Jung et al., 2018), we found genes which are consistent with the previous immunohistochemical analyses (Jung et al., 2018). In addition, we also observed that the expression patterns of MN and interneuron markers in mouse (Delile et al., 2019) are highly similar in skate, supporting previous conclusions. Previously unidentified DEGs were found through re-analysis of RNA-seq data using the new reference genome (Figure 2), which reflects the limitation of the previous analyses using the zebrafish transcriptome. Aligning the new gene annotation data against the previous de novo transcriptome, and investigating the distribution of alignment length, we also found that the previous de novo transcriptome contains many fragmented genes (Figure 1—figure supplement 4A). The previous transcripts generally cover only a small fraction (<20%) of the transcripts predicted in our genome assembly while the new transcripts cover close to 100% of the previous transcriptome. An example case is illustrated in the Foxp1 gene, a well-known limb/fin MN fate determinant (Figure 1—figure supplement 4B). This improved DEG analysis therefore offers a more complete view of gene expression profiles of MNs in little skate.

The evolution of gene regulatory modules for MN development

During the evolution of motor behaviors, a more complex nervous system likely emerged to control more sophisticated limb movements, such as hand dexterity. Little skate displays walking-like behavior using only around 10 muscles in the pelvic fin, while mammals can use up to 50 muscles in each limb. How the system evolved to generate a more intricate nervous system remains an open question. One mechanism to achieve this might be to increase the number of regulatory modules that control fine-grained gene expression. Recently, an increase in the size of intergenic regions with concomitant increase in the number of ACRs in neuronal genes was proposed as one plausible mechanism to generate a more complex nervous system (Closser et al., 2022). Although neuronal genes in little skate have much longer intergenic regions than non-neuronal genes, the intergenic regions in neuronal genes contain a similar fraction of ACRs as in non-neuronal genes as opposed to mouse with significantly increased neuronal gene ACRs (Figure 5—figure supplement 2). Other mechanisms seem to be involved in generating complex nervous system. While birds display very complex behaviors, its genome contains short intergenic regions (Zhang et al., 2014). In our study, we propose another way of achieving complex nervous system, through more intricate regulatory network. As illustrated in the Figure 5D and a greater number of shared TF motif predictions were found in MN-expressed genes of mouse than in skate allowing an intricate control of gene expression.

Foxp1, the major limb/fin MN determinant appears to be differentially regulated in tetrapod and little skate. Although Foxp1 is expressed in and required for the specification of all limb MNs in tetrapods, Foxp1 is downregulated in Pea3-positive MN pools during maturation in mice (Dasen et al., 2008; Catela et al., 2016). In addition, preganglionic motor column neurons (PGC MNs) in the thoracic spinal cord of mouse and chick express less than half the level of Foxp1 expression in limb MNs. Although PGC neurons have not yet been identified in little skate, we tested the expression level of Foxp1 using a previously characterized tetrapod PGC marker, pSmad. We observed that Foxp1 is not expressed in MNs that express pSmad (Figure 5—figure supplement 1). Since there is currently no known marker for PGC MNs in little skate, our conclusion should be taken with caution. This predicted complex mechanism of gene expression in mouse may contribute to the emergence of more complex nervous system of mouse compared to that of skate even though the hypothesis remains to be validated in additional organisms.

In summary, the comparative genomic and transcriptomic analysis of the current study suggests evidence of species-specific changes apart from the conservation. Divergent expression of genes in MN (Figure 3A; Figure 3—figure supplement 1) could allow a greater number of motor pools to be generated in mouse to control complex limb structures. Loss of the Hoxc cluster in the little skate genome, correlated with high contents of repeat elements in the genomic locus (Figure 1—figure supplement 6), might underly the expanded fin MN domain in the spinal cord without an inter-fin region; while loss of a subset of CTCF binding motifs in the Hoxa cluster of little skate (Figure 1D) may have induced the relatively expanded domain of Hoxa9. The changes in genome structure and sequence could lead to changes in the expression of MN-specific genes as well as Hox genes across the rostro-caudal axis of the spinal cord, affecting the MN organization (Jung et al., 2010; Lacombe et al., 2013; Machado et al., 2015). The changes in the MN organization along the rostro-caudal axis of the spinal cord may affect the connectivity of MNs, which would eventually lead to changes in the pattern of locomotion (Baek et al., 2017; Osseward and Pfaff, 2019). Continued effort is needed to complete an understanding of the shared and species-specific genetic systems underlying the origin and diversity of neuronal circuits controlling locomotion.

Limitations

The findings in this study demonstrates the conservation and divergence in gene expression pattern and predicted gene regulatory system among skate and tetrapod species. Whether the predicted TFs actually bind to the putative motifs and whether TFs function as activators or repressors are yet to be validated. As another limitation of the current study, the ACRs analyzed here did not consider long-range regulatory elements. For more accurate characterization of regulatory elements, future studies could provide a more comprehensive approach including ChIP-seq and chromatin conformation capture assay together with functional validation of the motifs.

Materials and methods

Animal work

Request a detailed protocol

Animal procedures were conducted under the approval of the IACUC at DGIST (DGIST-IACUC-21062403–0002).

Sampling and DNA extraction and whole genome sequencing

Request a detailed protocol

For genomic DNA extraction from little skates (Marine Biological laboratory; 5 stage and sex unmatched skate embryos), the guts were removed and washed 2 times with 1 x PBS. Around 500 µl of G2 buffer (Qiagen) with RNase A (200 µg/ml) was added to the tissue, minced with a razor blade, and transferred to 19 ml G2 buffer in a 50 ml falcon tube. 1 ml of Proteinase K (Qiagen, 19131) was added to the tube and vortexed for 5 seconds, followed by incubation for 2 hr at 50 ℃. The samples were vortexed for 10 seconds and loaded onto a genomic DNA column (Qiagen, 10262). Column purification was performed following the manufacturer’s protocol. For PacBio long read sequencing, little skate genomic DNA (6.5–9 µg in 150 µl volume) was transferred to a Covaris g-Tube (Covaris, #520079) and sheared in a tabletop centrifuge (Eppendorf, #5424) at 3600 rpm for 30 seconds. After shearing, DNA was cleaned with 0.4 x ratio of Ampure XP magnetic beads (Beckman coulter). Eluted DNA was processed in a PacBio SMRTbell template prep kit v1.0 (PacBio, #100-222-300) following the manufacture’s protocol. The SMRTbell templates larger than 15 Kb were enriched using a Blue Pippen size-selection system (Sage Science, #BLF7510). Following size selection, the DNA was cleaned and concentrated using Ampure Xp magnetic beads. The sequencing was performed on the PacBio Sequel system. For Illumina short read sequencing, 1 µg of the high-quality skate DNA was put into Kapa-Roche Library prep kit. The sample underwent 1 PCR cycle. 150 bp paired-end sequencing was performed on the Hiseq4000 with v4 chemistry (Illumina, CA).

Mouse and chick MN RNA sequencing

Request a detailed protocol

For mouse MN RNA sequencing, spinal cords of Hb9-GFP mouse (Jackson laboratory) were dissociated and GFP+ MNs were manually collected as described (Hempel et al., 2007). The regions for forelimb MNs were visualized under a fluorescence dissection scope and separated from other neurons using a sharp scalpel. The spinal cords were digested with pronase for 30 min at RT. Total RNAs from 400 to 600 MNs were extracted using Picopure RNA isolation kit (Arcturus, KIT0202). The RNAs were amplified using Nugen Trio low input library prep kit (Nugen, 0507). 50 bp paired-end sequencing was performed on the HiSeq4000 with v4 chemistry (Illumina, CA).

For chick MN RNA sequencing, HH stage 12–13 chick embryos were electroporated with a plasmid that drives nuclear YPF expression under the control of Hb9 promoter (Lee et al., 2004). After 3-day incubation, br-level spinal cords were isolated and dissociated as described (Hempel et al., 2007). After electroporation only well electroporated embryos (>50% of the brachial MNs) were selected and used for cell sorting. During the FACS sorting, the YFP positive cells were counted to be around 5–10% of the entire population, shown in Figure 3—figure supplement 1C. After the FACS sorting, we confirmed under fluorescence microscope that most of the sorted cells (>90%) were YFP positive. 5000–23,000 YFP+ MNs were collected using a FACS sorter (BD, FACSAria III) and PicoPure RNA Isolation Kit (Arcturus, KIT0202) was used to extract total RNAs. cDNA was synthesized and amplified using Ovation RNA amplification system v2 (Nugen, 3100–12). The sequencing library was prepared using the TruSeq RNA sample prep Kit (Illumina, CA). The suitable fragments (350–450 bp) were selected as templates for PCR amplification using BluePippin 2% agarose gel cassette (Sage Science, MA). 150 bp paired-end sequencing was performed in the NovaSeq6000 (Illumina, CA).

Immunohistochemistry

Request a detailed protocol

For in situ RNA hybridization, 300–1000 bp cDNA region was amplified by PCR with primers listed in Supplementary file 8. The amplified PCR products were used for generating DIG labeled RNA probe by in vitro transcription with T7 RNA polymerase. In situ RNA hybridization and immunofluorescence was performed as previously described (Jung et al., 2018). Immunofluorescence images were acquired in a confocal microscope (LSM800, Zeiss).

The antibodies used are as follows:

  • Primary antibodies: Rabbit anti-Foxp1 (Dasen et al., 2008), guinea pig anti-Foxp1 (Dasen et al., 2008), mouse anti-Hb9/Mnr2 (81.5C10, DSHB), mouse anti-Lhx3/Lim3 (67.4E12, DSHB), mouse anti-Isl1/2 (39.4D5, DSHB), mouse anti-NFAP (3A10, DSHB), rabbit anti-pSmad (Dasen et al., 2008), chicken anti-GFP (GFP-1020, Aves), anti-DIG-AP Fab fragments (#11093274910, Sigma-Aldrich)

  • Secondary antibodies: Cy3 anti-rabbit antibody (#711-165-152, Jackson immunoResearch), Alexa 647 anti-mouse antibody (#715-605-150, Jackson immunoResearch), Alexa 488 anti-chicken antibody (#703-545-155), Alexa 488 anti-guinea pig antibody (A11073, Invitrogen)

In ovo chick electroporation

Request a detailed protocol

Chick in ovo electroporation was performed as previously described (Jung et al., 2018). In brief, pHb9-nuYFP (2 μg/μl) plasmid was co-electroporated into the neural tube of HH stage 12–15 chick embryos.

Collection of public data

Request a detailed protocol

The RNA-seq raw data of little skate pec-MNs and tail-SC used in differential gene expression analysis available under accession number PRJNA414974 from the NCBI SRA were downloaded. The ATAC-seq raw data of mouse limb-level MNs (brachial and lumbar) published under the GEO accession of GSE175503 (Sawai et al., 2022) was used for comparing with skate ATAC-seq data. The mouse cortical PV interneuron and excitatory neuron RNA-seq and ATAC-seq data (Mo et al., 2015) with GEO accession of GSE63137 were downloaded.

The human (GRCh38), mouse (GRCm38), chicken (GRCg6a), zebrafish (GRCz11), and elephant shark (C.milii-6.1.3) reference genomes were collected from Ensemble FTP. The thorny skate (sAmbRad1) reference genome was downloaded from NCBI. Lastly, the three shark genomes were collected from the previous study (Hara et al., 2018).

Sampling of tissues and generation of ATAC-seq data

Request a detailed protocol

In stage 30 (Maxwell et al., 2008) little skates, pectoral and pelvic MNs were labeled by injecting rhodamine-dextran (3 K, Invitrogen). After 1–2 day incubation at RT, cell dissociation was performed as described (Hempel et al., 2007) with some modifications. Spinal cords were isolated and digested with pronase (11459643001, Roche) for 30 min at RT and dissociated MNs from several labeled spinal cords were collected manually and processed for ATAC sequencing library preparation as described (Corces et al., 2017). In brief, 150–426 labeled MNs were collected in 25 µl cold ATAC-seq RSB (10 mM Tris-HCl pH7.4, 10 mM NaCl, and 3 mM MgCl2 in Nuclease free water) and centrifuged at 500 rcf for 10 min in a pre-chilled fixed-angle centrifuge. The supernatant was removed and 10 µl of transposition mix (3.3 µl PBS, 1.15 µl Nuclease free water, 5 µl 2 x TD buffer, 0.25 µl Tn5 (1/10 diluted: 5 µl 2 x TD buffer, 4 µl nuclease free water, 1 µl Tn5), 0.1 µl 1% digitonin) was added and resuspended by pipetting six times. The samples were incubated with shaking at 1000 rpm for 30 min at 37 °C. Tagmented DNA was purified with Qiagen minelute reaction cleanup kit (Qiagen, 28206). PCR mixtures (10 µl Nuclease free water, 2.5 µl 25 µM primer (Ad1), 2.5 µl 25 µM primer (Ad2.X), 25 µl 2 x NEB master mix, transposed sample 20 µl) were prepared and primary PCR was performed in the following condition: 72 °C 5 min, 1 cycle; 98 °C 30 sec, 1 cycle; 98 °C 10 sec, 63 °C 30 sec, 72 °C 1 min 5 cycles; hold at 4 °C. PCR mixture (3.76 µl nuclease free water, 0.5 µl 25 µM primers (Ad1.1), 0.5 µl 25 µM primers (Ad2.X), 0.24 µl 25 x SybrGold in DMSO, 5 µl 2 x NEB master mix, 5 µl pre-Amplified sample) were prepared and quantitative PCR was performed as follows: 98 °C 30 sec, 1 cycle; 98 °C 10 sec, 63 °C 30 sec, 72 °C 1 min 20 cycles; hold at 4 °C. 1/4 max cycles were determined (N) and the primary PCR reaction products underwent N more PCR cycles. For the tail-SC, 240–1000 cells from two embryos were used for ATAC sequencing library preparation. The sequencing was performed on a paired end 50 cycle lane of the Hiseq 4000 using v4 chemistry.

The sequences of primes used in the ATAC library preparation were as follows:

  • AD1.1: AATGATACGGCGACCACCGAGATCTACACTAGATCGCTCGTCGGCAGCGTCAGATGTG;

  • AD2.1: TAAGGCGACAAGCAGAAGACGGCATACGAGATTCGCCTTAGTCTCGTGGGCTCGGAGATGT;

  • AD2.2: CGTACTAGCAAGCAGAAGACGGCATACGAGATCTAGTACGGTCTCGTGGGCTCGGAGATGT;

  • AD2.3: AGGCAGAACAAGCAGAAGACGGCATACGAGATTTCTGCCTGTCTCGTGGGCTCGGAGATGT;

  • AD2.4: TCCTGAGCCAAGCAGAAGACGGCATACGAGATGCTCAGGAGTCTCGTGGGCTCGGAGATGT;

  • AD2.5: GGACTCCTCAAGCAGAAGACGGCATACGAGATAGGAGTCCGTCTCGTGGGCTCGGAGATGT

Genome assembly of little skate

Request a detailed protocol

The initial contig assembly of little skate genome was performed using raw PacBio reads as input via Flye (v. 2.7.1) (Kolmogorov et al., 2019). Default parameter was used for this initial assembly. Haplotypic duplication of the initial contig was identified and removed based on read depth using purge_dups (Guan et al., 2020). Scaffolding was performed on the duplicate-removed contigs via reference-guided approach implemented in RaGOO (Alonge et al., 2019) using the reference genome of thorny skate or Amblyraja radiata available from RefSeq accession GCA_010909765.1. The scaffolded genome of little skate was further polished using Illumina short reads with FreeBayes (Garrison and Marth, 2012). The vertebrate gene data (vertebrata_odb10) of Benchmarking Universal Single-Copy Orthologs (BUSCO v. 5. 2. 2) was used to evaluate the final assembly (Seppey et al., 2019). The synteny of BUSCO gene was visualized via ChrOrthLink (Chul Lee and Rhie, 2021; https://github.com/chulbioinfo/chrorthlink/) (Rhie et al., 2021). The simplified process of genome assembly is summarized in Figure 1—figure supplement 2. Comparison among genome assemblies and with previous genome assembly or libraries was made using MashMap (Jain et al., 2018).

For gene annotation, comparative annotation approach was used. Cactus (v. 1.0.0) (Armstrong et al., 2020) alignment of thorny skate and little skate genome was performed. Comparative annotation toolkit (CAT) (Fiddes et al., 2018) was run using the annotation of thorny skate (GCA_010909765.1). Repetitive elements were analyzed using Windowmasker (Morgulis et al., 2006). To investigate different classes of repeats, RepeatModeler v2.0.1 (Flynn et al., 2020) was used to create species-specific repeat library using default parameters. Repeat annotation was performed by RepeatMasker v4.1.2 (Smit et al., 2013). Paralog genes were investigated using eggNOG (Huerta-Cepas et al., 2019). Based on the ortholog groups predicted from eggNOG, genes ancestral to Vertebrata were defined as paralogs.

Identification of ortholog clusters

Request a detailed protocol

Using the amino acid sequence of the protein-coding genes of skate, mouse (GRCm38), chicken (GRCg6a), orthologous gene clusters were investigated. OrthoVenn2 was used to identify the orthologous gene clusters using the e-value of 0.01 and the default inflation value (Xu et al., 2019). Among the identified ortholog gene clusters, single-copy orthologs identified in all three species were used for next multiple-species RNA-seq analysis.

RNA-seq data processing and differential gene expression analysis

Request a detailed protocol

Quality of RNA-seq raw reads were checked with FastQC (v. 0.11.9). Next, the raw data was trimmed for low quality and Illumina truseq adapter sequences using trimmomatic-0.39 (Bolger et al., 2014) with the following options: “ILLUMINACLIP:[AdapterFile]:2:30:10 LEADING:20 TRAILING:20 SLIDINGWINDOW:4:20 MINLEN:50”. The resulting clean reads were aligned to the reconstructed little skate genome with STAR (v. 2.7.5 a) (Dobin et al., 2013) and were quantified using featureCounts (Liao et al., 2014). To explore differential expression between the two tissues (pec-MNs and tail-SC), statistical test was performed via DESeq2 (Love et al., 2014) with generalized linear model. Genes with FDR-adjusted p-value of <0.1 were considered significant (Benjamini and Hochberg, 1995). For the visualization of RNA-seq data, bigwig files were generated using deeptools (v. 3.4.3) with CPM read depth normalization. For the comparison of known markers, the specific markers provided by Delile et al., 2019 was used.

For the comparison of gene expression across multiple species, RNA-seq data generated from pec-MNs of little skate, br-MNs of chick and forelimb MNs of mouse were used. The comparison was made using 9253 orthologous genes present in all species. The orthologous genes were further filtered to obtain the list of genes showing minimum expression level of 20 average read counts for each species. To account for different gene length in multiple species, RPKM normalization was used. Genes with the average percentile expression of above 70 were considered highly expressed in MNs. The common genes were defined as those genes with percentile expression greater than 70 in all three species. Species-specific genes were defined as those genes with average percentile expression >70 at the same time, the average percentile expression of the remaining species below 30. The visualization of the gene expression was done via R ‘ComplexHeatmap’ package. Similarity index between two species shown in Figure 3—figure supplement 3A was calculated using the following formula:

SI=1-1-ba+b*1-bb+c

SI represents the similarity index. The number of species-specific genes of two species are indicated by a and c, while the number of common genes is represented by b.

ATAC-seq data processing and differential accessibility analysis

Request a detailed protocol

For chromatin accessibility assay, ATAC-seq data was used. Similar to RNA-seq data, the quality of the raw sequence data was investigated with FastQC (v. 0.11.9) followed by trimming of sequences with low quality and NexteraPE adapter sequences using trimmomatic-0.39 (Bolger et al., 2014) with following options: ‘ILLUMINACLIP:[AdapterFile]:2:30:10 LEADING:20 TRAILING:20 SLIDINGWINDOW:4:20 MINLEN:30’. The clean reads were aligned to the reference genome of little skate with BWA (v. 0.7.17). The quality of the ATAC-seq reads were further checked using R ‘ATACseqQC’ package. After the alignment, duplicated reads were removed with Picard (v. 2.23.2) (RRID:SCR_006525, v. 2.23.2; http://broadinstitute.github.io/picard/). Moreover, reads with low mapping quality and those reads that were originated from MT genome were removed with samtools (Li et al., 2009) (v. 1.9). Peak calling was performed for each tissue after pooling the replicates of respective tissue (fin-MNs and tail-SC) using MACS2 (v. 2.2.7.1) with the following options: ‘–keep-dup all –nomodel, -q 0.05– -f BAMPE -g 1,974,810,099’. ACRs were defined by merging the peaks from the two tissues using bedtools merge (v. 2.29.2). For the visualization of ATAC-seq data, bed files of ACRs and bigwig files generated by deeptools (v. 3.4.3) were used.

The ACRs identified were further classified into different regions based on gene annotation (including upstream, promoter, 5’UTR, CDS, intron, 3’UTR, downstream and intergenic). The region covering 1000 bp upstream of start of a gene was defined as promoter region and 10,000 bp upstream of promoter region or downstream of 3’ end of a gene was defined as upstream or downstream, respectively. ACRs located in the remaining non-genic regions were considered intergenic ACRs.

TF binding motif predictions

Request a detailed protocol

For the ACRs of interest and promoter regions of the candidate genes, motif enrichment analysis was performed with HOMER and ‘annotatePeaks.pl’ script was used to locate the binding motifs (Heinz et al., 2010) using the collection of homer vertebrate TFs and the binding motifs of Hox gene families available in HOCOMOCO database v11 (Kulakovskiy et al., 2018). The putative CTCF motif prediction was also performed using HOMER vertebrate CTCF binding motifs.

Code availability

View detailed protocol

This study does not involve previously unreported computer code or algorithms. The list of software, their versions and options used are described in the Materials and methods section.

Data availability

The genome sequence of little skate is archived on NCBI BioProject under accession PRJNA747829. The RNA-seq data of chick br-MN and mouse limb MNs, and ATAC-seq data of little skate are available from the NCBI Gene Expression Omnibus database under accession number GSE180337.

The following data sets were generated
The following previously published data sets were used
    1. Jung H
    (2018) NCBI BioProject
    ID PRJNA414974. Genomewide screening for pectoral fin MN specific markers.
    1. Closser M
    (2020) NCBI BioProject
    ID PRJNA630707. An expansion of genomic regulatory complexity underlies vertebrate neuronal diversity (house mouse).
    1. Institute of Molecular and Cell Biology
    (2020) Ensembl release 102
    ID Callorhinchus_milii-6.1.3. Elephant shark assembly and gene annotation.
    1. Vertebrate Genomes Project
    (2019) NCBI BioProject
    ID PRJNA593039. Amblyraja radiata (thorny skate) genome, sAmbRad1.
    1. Hara Y
    (2018) Data Bank of Japan
    ID PRJDB6260. Shark genomes provide insights into elasmobranch evolution and the origin of vertebrates.
    1. Sawai A
    (2022) NCBI Bioproject
    ID PRJNA732648. PRC1 Sustains the Memory of Neuronal Fate Independent of PRC2 Function (house mouse).

References

    1. Holst R
    2. Bone Q
    (1993) On bipedalism in skates and rays
    Philosophical Transactions of the Royal Society of London. Series B 339:105–108.
    https://doi.org/10.1098/rstb.1993.0007
    1. Howe K
    2. Clark MD
    3. Torroja CF
    4. Torrance J
    5. Berthelot C
    6. Muffato M
    7. Collins JE
    8. Humphray S
    9. McLaren K
    10. Matthews L
    11. McLaren S
    12. Sealy I
    13. Caccamo M
    14. Churcher C
    15. Scott C
    16. Barrett JC
    17. Koch R
    18. Rauch G-J
    19. White S
    20. Chow W
    21. Kilian B
    22. Quintais LT
    23. Guerra-Assunção JA
    24. Zhou Y
    25. Gu Y
    26. Yen J
    27. Vogel J-H
    28. Eyre T
    29. Redmond S
    30. Banerjee R
    31. Chi J
    32. Fu B
    33. Langley E
    34. Maguire SF
    35. Laird GK
    36. Lloyd D
    37. Kenyon E
    38. Donaldson S
    39. Sehra H
    40. Almeida-King J
    41. Loveland J
    42. Trevanion S
    43. Jones M
    44. Quail M
    45. Willey D
    46. Hunt A
    47. Burton J
    48. Sims S
    49. McLay K
    50. Plumb B
    51. Davis J
    52. Clee C
    53. Oliver K
    54. Clark R
    55. Riddle C
    56. Elliot D
    57. Eliott D
    58. Threadgold G
    59. Harden G
    60. Ware D
    61. Begum S
    62. Mortimore B
    63. Mortimer B
    64. Kerry G
    65. Heath P
    66. Phillimore B
    67. Tracey A
    68. Corby N
    69. Dunn M
    70. Johnson C
    71. Wood J
    72. Clark S
    73. Pelan S
    74. Griffiths G
    75. Smith M
    76. Glithero R
    77. Howden P
    78. Barker N
    79. Lloyd C
    80. Stevens C
    81. Harley J
    82. Holt K
    83. Panagiotidis G
    84. Lovell J
    85. Beasley H
    86. Henderson C
    87. Gordon D
    88. Auger K
    89. Wright D
    90. Collins J
    91. Raisen C
    92. Dyer L
    93. Leung K
    94. Robertson L
    95. Ambridge K
    96. Leongamornlert D
    97. McGuire S
    98. Gilderthorp R
    99. Griffiths C
    100. Manthravadi D
    101. Nichol S
    102. Barker G
    103. Whitehead S
    104. Kay M
    105. Brown J
    106. Murnane C
    107. Gray E
    108. Humphries M
    109. Sycamore N
    110. Barker D
    111. Saunders D
    112. Wallis J
    113. Babbage A
    114. Hammond S
    115. Mashreghi-Mohammadi M
    116. Barr L
    117. Martin S
    118. Wray P
    119. Ellington A
    120. Matthews N
    121. Ellwood M
    122. Woodmansey R
    123. Clark G
    124. Cooper JD
    125. Cooper J
    126. Tromans A
    127. Grafham D
    128. Skuce C
    129. Pandian R
    130. Andrews R
    131. Harrison E
    132. Kimberley A
    133. Garnett J
    134. Fosker N
    135. Hall R
    136. Garner P
    137. Kelly D
    138. Bird C
    139. Palmer S
    140. Gehring I
    141. Berger A
    142. Dooley CM
    143. Ersan-Ürün Z
    144. Eser C
    145. Geiger H
    146. Geisler M
    147. Karotki L
    148. Kirn A
    149. Konantz J
    150. Konantz M
    151. Oberländer M
    152. Rudolph-Geiger S
    153. Teucke M
    154. Lanz C
    155. Raddatz G
    156. Osoegawa K
    157. Zhu B
    158. Rapp A
    159. Widaa S
    160. Langford C
    161. Yang F
    162. Schuster SC
    163. Carter NP
    164. Harrow J
    165. Ning Z
    166. Herrero J
    167. Searle SMJ
    168. Enright A
    169. Geisler R
    170. Plasterk RHA
    171. Lee C
    172. Westerfield M
    173. de Jong PJ
    174. Zon LI
    175. Postlethwait JH
    176. Nüsslein-Volhard C
    177. Hubbard TJP
    178. Roest Crollius H
    179. Rogers J
    180. Stemple DL
    (2013) The zebrafish reference genome sequence and its relationship to the human genome
    Nature 496:498–503.
    https://doi.org/10.1038/nature12111
  1. Software
    1. Smit A
    2. Hubley R
    3. Green P
    (2013)
    RepeatMasker
    Open-4.0.

Decision letter

  1. Paschalis Kratsios
    Reviewing Editor; University of Chicago, United States
  2. Catherine Dulac
    Senior Editor; Harvard University, United States

Our editorial process produces two outputs: (i) public reviews designed to be posted alongside the preprint for the benefit of readers; (ii) feedback on the manuscript for the authors, including requests for revisions, shown below. We also include an acceptance summary that explains what the editors found interesting or important about the work.

Decision letter after peer review:

Thank you for submitting your article "Little skate genome exposes the gene regulatory mechanisms underlying the evolution of vertebrate locomotion" for consideration by eLife. Your article has been reviewed by 3 peer reviewers, and the evaluation has been overseen by a Reviewing Editor and Catherine Dulac as the Senior Editor.

The reviewers have discussed their reviews with one another, and the Reviewing Editor has drafted this to help you plan the next steps. The reviewers agree that the paper has potential, but extensive revision and new data are needed.

Essential revisions:

1. The authors report the identification of conserved and divergent molecular markers across multiple species with RNA-Seq, but they do not validate the expression of novel markers in either category with an independent method (e.g. in situ or antibody staining).

Such validation is needed to substantiate the authors' conclusions.

2. The reviewers do recognize that functional analyses are not feasible in the little skate. However, to substantiate the claim that more complex regulatory mechanisms have evolved in tetrapods to accommodate sophisticated motor behaviors, the authors should conduct additional gene expression experiments. For example, as pointed out by reviewer 1, the authors can focus on Foxp1 and Snail.

3. Reviewers 1 and 3 raised a number of important issues regarding the bioinformatic comparisons (e.g., completeness of datasets, quality control, introduction of bias) that must be carefully addressed. First, the authors must show validation of their RNA-Seq method in chick, as suggested by reviewer 1. Second, the reviewers would like to see a re-analysis of the RNA-Seq datasets in an unbiased manner, for example, by directly comparing MN expression of orthologous genes in the different species (e.g., compare highly expressed genes in MNs of the different species). Two reviewers stressed that comparing a pure MN population to tail tissue in the skate and DRGs in the mouse was not an appropriate comparison. Third, comparisons of mouse and skate-accessible chromatin regions should be done without biasing first to DEX genes. Lastly, additional key aspects of evolution, such as paralogue substitution or expression of species-specific genes should also be considered. Authors could follow comparisons similar to: 10.1038/s41559-021-01580-3.

4. The reviewers agree that a significantly improved version of the little skate genome is an important contribution. In the first part of the manuscript, the authors should mention the work by Marletaz et al. (bioRxiv) that also provides a new little skate sequenced genome.

5. There is a propensity to overstate claims throughout the manuscript. For example, without functional data in little skate, the claim that the TF networks are much simpler is not substantiated simply by ATACseq and predicted binding sites. The authors should tone down statements in Abstract and Discussion (as indicated by the reviewers) and always make it very clear that they are simply predicting regulatory connections between all these genes.

Reviewer #1 (Recommendations for the authors):

1) Based on the low convergence of mouse, skate and chick MN transcriptomes it may be a possibility that one of the datasets is incomplete. The authors should go back to their RNAseq datasets and check for the expression of known MN markers that are conserved in the 3 species to identify where this inconsistency arises. It would also be helpful to show validation of their chick RNAseq method, for example, show the efficiency and specificity of GFP expression in MNs, and what % of MNs were electroporated and sorted before sequencing.

2) Another surprising finding is that a higher number of putative TF binding sites are found in the tail-SC-specific ACRs for pectoral MNs and that the expression levels of these TFs do not correlate with this trend. The authors should comment on this discrepancy. Similarly, while they were found to be highly expressed in pectoral MNs, 5 genes including Isl1, show no associated ACR (Figure 5C). Do the authors think that this is due to long-range regulation of those genes? Some discussion of this would be clarifying.

Reviewer #2 (Recommendations for the authors):

As already stated, the main limitation of the study seems to be the strategy followed for the RNAseq and ATACseq comparative analysis. The use of a prior intra-species comparison with heterogeneous criteria is not well-justified, it is a potential source of bias and should be avoided. Why authors do not directly compare MN expression and ATACseq of orthologous genes in the different species? In addition, it is known that there are extensive paralogue substitutions that indicate common regulatory mechanisms but might be missed if not analysed directly. Authors could follow comparisons similar to previously published articles: 10.1038/s41559-021-01580-3.

Comments on each section:

1) Abstract:

Several statements are not strongly supported by data:

"Conserved MN genes were enriched for early-stage nervous system development."

"conservation of the potential regulators with divergent transcription factor (TF) networks through which expression of MN genes is differentially regulated."

"TF networks in little skate MNs are much simpler than those in mouse MNs."

2) Figure 1 data:

In the first part of the manuscript, the authors should mention biorxiv Marletaz et al.'s work which also provides a new little skate sequenced genome and analysis, with a higher number of identified coding genes compared to this work and also with 3D chromatin structure data that identifies TAD boundaries that coincide with CTCF sites in Hoxa and Hoxd clusters mentioned in Baek et al.

3) Figure 2 data:

(3.1) The comparison of Pectoral MN with tail SC, compares a purified population with a mix of cell types including MN. This unbalanced comparison could explain why tail SC shows 3 times more DEX genes than pec-MN.

(3.2) In the previous analysis published by the group, 592 genes were identified as 2 fold enriched in pectoral MN, why the new analysis retrieves only 135 genes? This should be clarified for the reader.

(3.3) Also from previous work of the authors several genes were determined to be expressed in little skate MN (HB9, lhx3, lhx1, Ephs, Ephrins, slit3, onecut1, nell2, nrcam, ngfr, pappa2, cdh7, amigo1, unc5c, lrx5, lrp1b, Zfp804a, etc), which of these genes are predicted to be enriched (or expressed at least) in the Pec-MN data set? Were all the genes found? This could be used as quality control of the data set or data set analysis.

4) Figure 3 data:

(4.1) Compares "Highly expressed genes in pec-MN". What are the criteria followed to assigned "highly expressed genes"?

(4.2) This data set is now compared with DEX of mouse embryonic MN compared to sensory neurons. Which type of mouse MN? at what A-P level?

(4.3) If skate genes are selected by high expression, why do mouse MN not follow the same criteria to avoid bias of comparison? As a control for bias in the criteria: What is the overlap of mouse highly expressed genes (with similar criteria to skate gene selection) with the data set of mouse MN DEX compared to sensory mouse neuron?

(4.4) Same for chick data, how equivalent are brachial MN to mouse MN dataset? Why select DEX compared to the brachial spinal cord and not sensory neurons as in mouse.

Without any justification for the followed strategy, it seems different populations and comparisons will introduce important biases that limit the conclusions.

The best strategy would be to compare highly expressed genes in MN in the different species and clarify if used populations are really "homologous" cell types in the different species.

(4.5) The variability of sampled populations or the biases introduced in the analysis might explain the low overlap found among the 3 species (Figure 3A). For the Venn diagram, is the overlap among categories higher/lower/equal to what would be expected by chance?

5) Figure 4 data:

(5.1) Similar to previous comments: Why limit TF motif enrichment of ACRs to only DEXs in pec-MN and tail-SC that (1) highly reduced the number of ACRs and (2) Induces a bias in the analysis? Analysis should be performed with all MN ACRs.

(5.2) Line 224: On the other hand, the tail-SC-specific ACRs in the pec-MN DEGs were enriched with the binding sites of Hoxa9, Hoxa11, Hoxd10 and Hoxd11, most of which are expressed in fin-MNs of little skate.

Could the authors provide a sentence to try to explain this observation? I found confusing that this is mentioned without providing more context.

6) Figure 5 data:

(6.1) Similar to previous comments, conclusions driven by this analysis might be biased by wrong comparative strategies to start with, thus conclusions are not well supported. Comparative of mouse and skate ACRs should be done without biasing first to DEX genes, which highly reduced the number of analysed ACRs, particularly to shared genes that are only 40.

(6.2) MN TF enrich motifs are broadly found in mouse sensory and skate tail DEX genes, which might be a strong indication that the strategy used in the analysis is not suitable for the identification of MN gene regulatory networks.

(6.3) Figure 5C: Most TF binding motifs in databases are built with experimental data from mouse or human TFs. Although core sequences for TF binding sites in the same families are conserved, small differences arise in individual members or between species. Could this explain why there is a higher number of motifs found in mouse than in skate? In addition, is the number of motifs in mouse and skate normalized by the size of analysed sequence?

7) General comments on format:

(7.1) Figures 3-5: differences among circles sizes are difficult to appreciate, maybe color heatmaps would be more informative.

(7.2) Figure 4 B, C could be included in supplementary.

Reviewer #3 (Recommendations for the authors):

The authors should be careful in their phrasing so as to always make it clear that they are simply predicting regulatory connections between all these genes.

For instance, on Page 3, line 29:

"Comparison of accessible chromatin regions between mouse and skate MNs revealed conservation of the potential regulators with divergent transcription factor (TF) networks through which expression of MN genes is differentially regulated. TF networks in little skate MNs are much simpler than those in mouse MNs, suggesting a more fine-grained control of gene expression operates in mouse MNs."

As one can see, without functional data in little skate, the claim that the TF networks are much simpler is not substantiated simply by ATACseq and predicted binding sites.

A similar claim on Page 17, line 338 indicates the same propensity to overstate these claims:

"As illustrated in the Figure 5C, a greater number of shared TFs binds to their downstream TFs in mouse MNs than in skate pec-MNs, allowing an intricate control of gene expression and thus the more complex nervous system of mouse compared to that of skate"

Again, there was no demonstration of little skate TFs binding to any downstream TF genes, only predicted binding sites. Thus, the claim is unsubstantiated.

These examples indicate an overall propensity by the authors to gloss over the fact that no functional connections between any TFs or genes were experimentally demonstrated in little skate. I do not believe it is appropriate to substitute binding motif enrichment for experimentally determined regulatory connections when inferring gene regulatory networks in something as complex as vertebrate development. There are a number of reasons why this is problematic.

[Editors’ note: further revisions were suggested prior to acceptance, as described below.]

Thank you for resubmitting your work entitled "Little skate genome exposes the gene regulatory mechanisms underlying the evolution of vertebrate locomotion" for further consideration by eLife. Your revised article has been evaluated by Catherine Dulac (Senior Editor), myself (reviewing editor), and 3 reviewers.

The revised manuscript has been significantly improved by the validation of RNA-Seq findings, the re-analysis of RNA-Seq and ATAC-Seq datasets, and the requested text changes. However, there are some remaining issues that need to be addressed, as outlined below (please see detailed comments by reviewers #1 and #3):

Essential revisions:

1. Please clarify whether you performed ATAC-seq from mouse MNs.

2. The findings on Snail1 are not described, and this part should be removed.

3. Please address the concerns raised by reviewer #3 about Figure 5.

4. We acknowledge that the revised version has toned down most claims on gene regulatory mechanisms, but we further suggest toning down the claim made in the title of the paper.

5. The manuscript should be edited for language and grammatical errors and carefully proofread.

Because your manuscript provides valuable datasets (e.g., little skate genome, new RNA-Seq data, new ATAC-Seq data), myself and all reviewers agree that your manuscript should be considered under the "Tools and Resources" article type.

Reviewer #1 (Recommendations for the authors):

The manuscript is much improved, as the authors have addressed a number of the major previous concerns, including re-analyzing RNA-seq data, generating a new set of mouse RNA-seq data, and validating their results with in situ hybridization. The new analysis seems much more convincing than the previous one. Some lingering concerns remain, mostly regarding figure 5 and the central claim of the paper, which is still not functionally supported. The authors did however tone down their claims and pointed out the limitations of the study.

(1) Did the authors perform ATAC-seq from mouse MNs? They show some data in figure 5 but it was not clear from the description of the methods or the results whether they performed the experiment.

(2) It seems that repeating the motif analysis of the ATAC-seq data gave completely new regulatory factors for FoxP1, even though the same regions as in the original manuscript are shown. It appears that Snai1 is no longer on the list so the experiment in the supplemental figures testing its function is somewhat moot. The authors also do not describe the experiment at all in the Results section so it should be taken out.

Reviewer #3 (Recommendations for the authors):

The revised manuscript has made important efforts in answering some of the raised concerns but did not address other key issues, particularly at the end of the manuscript.

The description of the little skate genome is, with no doubt, useful for the field of Evolutionary Biology. Then authors, re-analyse previously published experimental data and compare differential gene expression between isolated pectoral motorneurons and a mixed population of the tail spinal cord of little skate (Figure 2) and differential accessible chromatin regions between Fin motorneurons (Pectoral+pelvic) compared to a mixed population of the tail spinal cord (Figure 4). These two figures are descriptive and it is unclear what insights are provided by the comparison of these heterogeneous populations of cells. Thus do not seem to constitute a great advancement in the understanding of gene regulatory networks present in the little skate or their evolution.

In the new version of the manuscript authors now compared homologous motorneuron populations of the little skate, mouse, and chick, which reveals a remarkable degree of conservation of the transcriptomes in the 3 species (Figure 3), which is even higher when considering possible paralog substitutions in the few divergently expressed genes. This is radically different from the initial version of the manuscript and I think is an important observation.

Finally, the authors attempt to describe and compare motorneuron gene regulatory networks in mouse and skate in Figure 5. I think this is the weakest part of the manuscript, not only I found it hard to follow, not clearly explained, and using vague terms and overstatements but in addition the methodology and strategy for the analysis seem incorrect, leading to potentially wrong conclusions.

To start, it is unclear to me what is exactly the mouse motorneuron population that is being compared and how equivalent it is to the mixed Pectoral and pelvic motorneuron population from the little skate.

More importantly, Figure 5A: authors describe 18 TF motifs commonly enriched in mouse and skate MN ACRs, among which 6 TFs predicted to bind those motifs are expressed both in mouse and skate. What does this mean? Is this overlap biologically meaningful? How many would overlap if enriched motifs in skate ACRs are compared to motifs in mouse ACRs of a non-related neuron type at a similar developmental stage, such as cortical interneurons cortical projection neurons? Less? More? similar number?

Authors then look for motif enrichment of these 6 common motif/TFs in ACRs of other expressed TFs (either expressed both in mouse and skate or only in one of them). It is unclear why TFs with enriched motifs in mouse and skate should be upstream of the other TFs, it is equally possible that the 6 common motif/TFs are downstream of the expressed TFs. In addition, using the term "interactions" for motif enrichment of one TF in the ACRs of another TF is an overstatement.

It is also striking that "interactions" of the 6 mouse common motif/TFs seem equally prevalent within ACRs of mouse-expressed TFs compared to ACRs of TFs expressed in skate but not in mouse. Similarly, for the skate data, motif enrichment in ACRs of commonly expressed TFs or TFs only expressed in the skate is not higher than in ACRs of TF expressed in mouse only. These results again raise doubts if this analysis is meaningful at all. Would it be different using just randomly picked ACRs from other TFs not expressed in MN? Finally, as already mentioned in the first review, the increasing number of motifs for mouse TFs could be again due to methodological limitations (based on known motifs in mouse compared to skate, etc) but not biologically meaningful, it should be stated right away when described and not as a separate paragraph in the section of limitations for the study.

Considering all these methodologic concerns, together with the lack of any experimental validation of predicted binding sites for any of the TFs, it would be advisable to completely remove that figure.

In summary, the manuscript has valuable information, namely the description of the little skate genome and the comparison of mouse, chick, and little skate MN transcriptome. It also provides a description and comparison of some heterogeneous populations of neurons in little skate which provide limited insights into gene regulation in skate motorneurons. Most importantly, I think the last part of the manuscript (Figure 5) is below the standards required for a journal such eLife. Unfortunately, I don´t think the paper, in its current revised format, provides any mechanism underlying the evolution of vertebrate locomotion as stated in the title.

Other comments:

Authors constantly use the term "MN genes" or similar expressions when should be referring to "MN expressed genes" or "MN enriched genes". Other non-accurate expressions:

"Number of predicted TFs enriched" when it refers to TF motif predictions, "expression of each predicted TF" when meaning "TF expression for the corresponding TF enriched motif ", "predicted shared TFs found in MN ACRs" meaning " predicted shared enriched TF motifs found in MN ACRs", etc.

This lack of accuracy makes it harder for the reader to follow the text.

Methods include snail cDNA electroporation, but I don't think those results are included in the manuscript.

In figure 4D, the legend states ACR group but would be clearer to label as Motif category or Motif distribution in ACR categories.

Line 251: "Together with the predicted binding sites of the Hox proteins, the binding sites of Foxp1 and Pbx1 and Lhx3, which are well-known regulators in MN(31-33), were enriched in shared ACRs and fin-MN-specific and tail-SC-specific ACRs, respectively (Figure 4D)"

However in the figure Pbx1 is also in the shared category as Foxp1, not in fin-MN specific, correct?

Why Figure 5 shows common TFs only 16 TFs, if figure 3 shows many more?

https://doi.org/10.7554/eLife.78345.sa1

Author response

Essential revisions:

1. The authors report the identification of conserved and divergent molecular markers across multiple species with RNA-Seq, but they do not validate the expression of novel markers in either category with an independent method (e.g. in situ or antibody staining).

Such validation is needed to substantiate the authors' conclusions.

We have added RNA in situ hybridization results in Figure 3C and Figure 3—figure supplement 1 and 2. Most of the genes were expressed in tissues in accordance with the sequencing results (6 out of 9 common MN genes; 4 out of 6 mouse specific genes; 5 out of 7 skate specific genes). Specifcally, Uchl1, Slc5a7, Alcam, and Serinc1 are expressed in MNs of all three species; Coch, Ppp1rc, Ctxn1, and Clmp are expressed in MNs of mouse but not in MNs of other species; Eya1, Etv5, Dnmbp, and Spint1 are expressed in MNs of skate but not in MNs of other species. In the result section, we have summarized the results as follow:

“These results were validated by performing RNA in situ hybridization in tissue sections on a subset of species-specific genes …”

2. The reviewers do recognize that functional analyses are not feasible in the little skate. However, to substantiate the claim that more complex regulatory mechanisms have evolved in tetrapods to accommodate sophisticated motor behaviors, the authors should conduct additional gene expression experiments. For example, as pointed out by reviewer 1, the authors can focus on Foxp1 and Snail.

We have added further discussion and data about differential expression of Foxp1 in mouse and little skate in Figure 5—figure supplement 16 and have discussed as follows: “Foxp1, the major limb/fin MN determinant appears to be differentially regulated in tetrapod and little skate. Although Foxp1 is expressed in and required for the specification of all limb MNs in tetrapods, Foxp1 is downregulated in Pea3 positive MN pools during maturation in mice (Catela et al., 2016; Dasen et al., 2008). In addition, preganglionic motor column neurons (PGC MNs) in the thoracic spinal cord of mouse and chick express half the level of Foxp1 expression than limb MNs. Although PGC neurons have not yet been identified in little skate, we tested the expression level of Foxp1 using a previously characterized tetrapod PGC marker, pSmad. We observed that Foxp1 is not expressed in MNs that express pSmad (Figure 5‒figure supplement 3). Since there is currently no known marker for PGC MNs in little skate, our conclusion should be taken with caution.”

As for Snai1, in the revision we performed a motif enrichment analysis with an unbiased gene list where Snai1 didn’t show up. However, when we performed an RNA in situ hybridization experiment for Snai1 (Figure 5—figure supplement 3), we found that Snai1 is expressed in MNs of both mouse and little skate, but not in chick, which has been shown previously (Cheung et al., 2005). In order to examine the function of Snai1 in the regulation of Foxp1 expression, we ectopically expressed Snai1 in chick spinal cord by performing in ovo electroporation. However, we did not detect any changes in Foxp1. Instead we observed an increase in the number of neurons and abnormal MN exits from the spinal cord, which is the reminiscent of a previous observation (Zander et al., 2014). Although we did not detect any changes in Foxp1 expression, we cannot rule out the possibility that Snai1 regulates Foxp1 in mouse and little skate, which may require a gene knock out experiment. Because binding sites of Snai1 were not enriched in the new gene sets that we analyzed in the revision, we have not further discussed the Snai1 in the text.

3. Reviewers 1 and 3 raised a number of important issues regarding the bioinformatic comparisons (e.g., completeness of datasets, quality control, introduction of bias) that must be carefully addressed. First, the authors must show validation of their RNA-Seq method in chick, as suggested by reviewer 1. Second, the reviewers would like to see a re-analysis of the RNA-Seq datasets in an unbiased manner, for example, by directly comparing MN expression of orthologous genes in the different species (e.g., compare highly expressed genes in MNs of the different species). Two reviewers stressed that comparing a pure MN population to tail tissue in the skate and DRGs in the mouse was not an appropriate comparison. Third, comparisons of mouse and skate-accessible chromatin regions should be done without biasing first to DEX genes. Lastly, additional key aspects of evolution, such as paralogue substitution or expression of species-specific genes should also be considered. Authors could follow comparisons similar to: 10.1038/s41559-021-01580-3.

Regarding the four suggestions, additional experiments and analyses have been added.

1) An additional experiment was conducted on the marker genes of chicken MN to support RNA-seq data and has been added to the Figure 3—figure supplement 1. In summary 11 out of 11 genes showed highly enriched expression pattern in MNs. The gene list includes Galm2, Cap43, str5, Scn2A, Rtn1, Pcp4, Tgs7bp, Mdga1, ChrnB3, Gpc3, and Hs6st3. In the result section, we have added as follow:

“…wing level MNs of chick embryos at Hamburger-Hamilton (HH) stage 26–27, which was validated by RNA in situ hybridization (Figure 3—figure supplement 1).”

2) The RNA-seq data has been extensively re-analyzed to address the concerns from the reviewers. Instead of using data from tail-SC of skate and sensory neuron tissues of mouse, comparison was made among the homologous MN populations, and Figures 3 and 5 have been updated accordingly.

3) The comparison between mouse and skate ACRs was reanalyzed without biasing to DEGs. The entire gene set and the highly expressed genes (expression percentile > 70) were used in the new analysis to avoid biasing genes (Figure 5 and Figure 5—figure supplement 1). Figure 5 has been revised following this new result.

4) As the reviewer mentioned, our analysis (Figure 3) could not compare genes which do not have one-to-one orthologues. To account for this, additional analysis was conducted on paralog genes. The eggNog program was used to identify paralogs, and species-specific genes whose functions could be substituted by paralogues are discussed (Figure 3—figure supplement 3, Additional Data 5 and 6). Also, species-specific ortholog groups missed on the analyses with the ortholog genes (Figure 3) were identified.

4. The reviewers agree that a significantly improved version of the little skate genome is an important contribution. In the first part of the manuscript, the authors should mention the work by Marletaz et al. (bioRxiv) that also provides a new little skate sequenced genome.

We have referenced the study by Marletaz in the introduction as follows:

“In response to the limited reference genome of little skate, this and a similar study by Marletaz et al., generated new genome assemblies. Marletaz et al. generated a new chromosome-scale genome via combination of Pacbio, Illumina and Hi-C sequencing.”

5. There is a propensity to overstate claims throughout the manuscript. For example, without functional data in little skate, the claim that the TF networks are much simpler is not substantiated simply by ATACseq and predicted binding sites. The authors should tone down statements in Abstract and Discussion (as indicated by the reviewers) and always make it very clear that they are simply predicting regulatory connections between all these genes.

We have rephrased some of the misleading statements to tone them down as suggested by the reviewers.

Reviewer #1 (Recommendations for the authors):

1) Based on the low convergence of mouse, skate and chick MN transcriptomes it may be a possibility that one of the datasets is incomplete. The authors should go back to their RNAseq datasets and check for the expression of known MN markers that are conserved in the 3 species to identify where this inconsistency arises. It would also be helpful to show validation of their chick RNAseq method, for example, show the efficiency and specificity of GFP expression in MNs, and what % of MNs were electroporated and sorted before sequencing.

We have validated the chick RNA sequencing by performing RNA in situ hybridization. The results are shown in Figure 3—figure supplement 1. Out of 11 tested genes, 11 genes were expressed in MNs. We have also added details of chick electroporation experiment as follow:

“After electroporation only well electroporated embryos ( > 50% of the brachial MNs) were selected and used for cell sorting. During the FACS sorting, the YFP positive cells were counted to be around 5–10% of the entire population, shown in Figure 3‒figure supplement 1C. After the FACS sorting, we confirmed under fluorescence microscope that most of the sorted cells (> 90%) were YFP positive.”

2) Another surprising finding is that a higher number of putative TF binding sites are found in the tail-SC-specific ACRs for pectoral MNs and that the expression levels of these TFs do not correlate with this trend. The authors should comment on this discrepancy. Similarly, while they were found to be highly expressed in pectoral MNs, 5 genes including Isl1, show no associated ACR (Figure 5C). Do the authors think that this is due to long-range regulation of those genes? Some discussion of this would be clarifying.

We have addressed these issues in the Discussion as follows:

“In addition, whether the predicted TFs actually bind to the putative binding sites and whether TFs function as activators or repressors are yet to be validated.”

We only consider ACRs in the region of 10 kb upstream and 10 kb downstream from the genes, which may exclude the long-range enhancers. As reviewer #2 suggested, we discussed this issue as follows:

“As another limitation of the current study, the ACRs analyzed here did not consider longrange regulatory elements, which might have caused the lack of associated ACRs in the MN genes (Figure 5C). For more accurate characterization of regulatory elements, future studies could provide a more comprehensive approach including ChIP-seq and chromatin conformation capture assay together with functional validation of the binding sites.

Reviewer #2 (Recommendations for the authors):

As already stated, the main limitation of the study seems to be the strategy followed for the RNAseq and ATACseq comparative analysis. The use of a prior intra-species comparison with heterogeneous criteria is not well-justified, it is a potential source of bias and should be avoided. Why authors do not directly compare MN expression and ATACseq of orthologous genes in the different species? In addition, it is known that there are extensive paralogue substitutions that indicate common regulatory mechanisms but might be missed if not analysed directly. Authors could follow comparisons similar to previously published articles: 10.1038/s41559-021-01580-3.

As reviewer #2 suggested, we have extensively re-analyzed the RNA-seq and ATAC-seq data. To avoid biases caused by heterogeneous cell type data, RNA sequencing data was generated from forelimb MNs of mouse and the new analysis focuses on comparisons of homologous MN populations between different species (Figure 3). In addition, the ATACseq data was re-analyzed while avoiding biasing the genes to statistically significant DEGs. The new analysis use all genes or highly expressed genes (Figure 4, 5 and Figure 5‒—figure supplement 1). We agree that there are extensive paralogue substitutions in the homologous cell types during evolution. To account for those genes without one-to-one orthologs, which could also be important for creating species-specific differences, we have added paralog gene analysis using eggNOG. The species-specific genes whose functions could be substituted by paralogues (Figure 3—figure supplement 3, Additional Data 5 and 6). Also, species-specific ortholog groups missed out on the analyses with the ortholog genes (Figure 3) were identified. We have summarized the results as follows:

“However, considering 11, 17 and 4 genes of mouse, skate and chick MN-specific genes are paralogs of one of the shared genes (Figure 3—figure supplement 3B), the degree of conservation is remarkable between MNs of these species while there are only a few remaining genes which could be species-specific. In addition to the comparisons among ortholog genes, we also identified 12, 171 and 6 paralog genes specifically expressed by skate, mouse and chicken MNs, respectively which could further explain species-specific differences of MNs (Figure 3—figure supplement 3B).”

Comments on each section:

1) Abstract:

Several statements are not strongly supported by data:

"Conserved MN genes were enriched for early-stage nervous system development."

"conservation of the potential regulators with divergent transcription factor (TF) networks through which expression of MN genes is differentially regulated."

"TF networks in little skate MNs are much simpler than those in mouse MNs."

The statements have been toned down following the reviewer #2’s comment. The abstract is rephrased as follows:

“Through interspecies comparison of mouse, skate and chicken MN transcriptomes, shared and divergent MN expression profiles were identified. Comparison of accessible chromatin regions between mouse and skate MNs predicted shared regulators with divergent transcription factor (TF) binding sites, which could be used for achieving differential regulation of MN-restricted genes. Predicted number of TF binding sites in the genic region in mouse MNs were much larger than those in the little skate MNs.”

2) Figure 1 data:

In the first part of the manuscript, the authors should mention biorxiv Marletaz et al.'s work which also provides a new little skate sequenced genome and analysis, with a higher number of identified coding genes compared to this work and also with 3D chromatin structure data that identifies TAD boundaries that coincide with CTCF sites in Hoxa and Hoxd clusters mentioned in Baek et al.

We have addressed this comment in the essential revisions #4.

3) Figure 2 data:

(3.1) The comparison of Pectoral MN with tail SC, compares a purified population with a mix of cell types including MN. This unbalanced comparison could explain why tail SC shows 3 times more DEX genes than pec-MN.

We agree with reviewer #2. In the revision, we have addressed this issue in the Results as follow:

“Larger number of DEGs in tail-SC may be caused by comparing heterogeneous cell types in tail-SC with homogeneous cell type in pec-MNs.”

(3.2) In the previous analysis published by the group, 592 genes were identified as 2 fold enriched in pectoral MN, why the new analysis retrieves only 135 genes? This should be clarified for the reader.

As reviewer #2 suggested, we have clarified this in the results as follows:

“Although the total number of DEGs are different from the previous data (592 vs. 135 genes in pec-MN DEGs), which might be caused by different statistical analysis with different reference genome…”

(3.3) Also from previous work of the authors several genes were determined to be expressed in little skate MN (HB9, lhx3, lhx1, Ephs, Ephrins, slit3, onecut1, nell2, nrcam, ngfr, pappa2, cdh7, amigo1, unc5c, lrx5, lrp1b, Zfp804a, etc), which of these genes are predicted to be enriched (or expressed at least) in the Pec-MN data set? Were all the genes found? This could be used as quality control of the data set or data set analysis.

We have compared the re-analysis result with the previous RNA seq result in Figure2‒ figure supplement 1 and added this information in the Results as follows:

“… previous RNA-seq data based on de novo assembly and annotation using zebrafish was mostly recapitulated in our DEG analysis based on our new skate genome (21 out of 24 previous fin MN marker genes have the expression level ranked above 70th percentile in PecMNs; Figure 2‒figure supplement 1).”

4) Figure 3 data:

(4.1) Compares "Highly expressed genes in pec-MN". What are the criteria followed to assigned "highly expressed genes"?

In the revision, we have defined highly expressed genes as genes that have the expression levels ranked above 70th percentile in each species.

(4.2) This data set is now compared with DEX of mouse embryonic MN compared to sensory neurons. Which type of mouse MN? at what A-P level?

In order to compare homologous cell populations from different species, in the revision we newly generated RNA sequencing data of forelimb MNs in mouse embryo at e13.5, which are the homologous population of pec-MNs in skate. The sequencing results are confirmed by RNA in situ hybridization (Figure 3; Figure 3—figure supplement 2). The RNA sequencing data with sensory neuros were not used in the revision. In the result section, we have added as follows:

“In order to compare gene expression with homologous cell types from each species, we performed RNA sequencing experiments with forelimb MNs of mouse embryos at embryonic day 13.5 (e13.5)”

(4.3) If skate genes are selected by high expression, why do mouse MN not follow the same criteria to avoid bias of comparison? As a control for bias in the criteria: What is the overlap of mouse highly expressed genes (with similar criteria to skate gene selection) with the data set of mouse MN DEX compared to sensory mouse neuron?

In the revision, we have defined highly expressed genes as genes that have the expression levels ranked 70th percentile in each species.

(4.4) Same for chick data, how equivalent are brachial MN to mouse MN dataset? Why select DEX compared to the brachial spinal cord and not sensory neurons as in mouse.

As reviewer suggested, in the revision we have generated new RNA sequencing data with forelimb MNs in mouse and compared gene expression in homologous cell types in the different species (forelimb MNs in mouse; br-MNs in chicken; pec-MNs in little skate).

Without any justification for the followed strategy, it seems different populations and comparisons will introduce important biases that limit the conclusions.

The best strategy would be to compare highly expressed genes in MN in the different species and clarify if used populations are really "homologous" cell types in the different species.

As reviewer #2 suggested, we have revised the new RNA-seq analysis to show the comparisons of highly expressed genes ( > 70 percentile) in MNs. The tail-SC, ce-SC and sensory neurons which could complicate and bias the RNA-seq analysis are no longer used as the controls for interspecies comparison.

(4.5) The variability of sampled populations or the biases introduced in the analysis might explain the low overlap found among the 3 species (Figure 3A). For the Venn diagram, is the overlap among categories higher/lower/equal to what would be expected by chance?

In the revision we have compared gene expression from the MNs from the similar region in the different species. The Venn diagram was changed to include new analysis results where there are now 1038 commonly expressed genes in MNs of three species.

5) Figure 4 data:

(5.1) Similar to previous comments: Why limit TF motif enrichment of ACRs to only DEXs in pec-MN and tail-SC that (1) highly reduced the number of ACRs and (2) Induces a bias in the analysis? Analysis should be performed with all MN ACRs.

We agree with the reviewer #2. In the revision, we have re-analyzed the ATAC-seq data with all the ACRs or ACRs in highly expressed genes (> 70 percentile). The ATAC-seq results have been updated accordingly in the Figure 4, 5 and Figure 5—figure supplement 1.

(5.2) Line 224: On the other hand, the tail-SC-specific ACRs in the pec-MN DEGs were enriched with the binding sites of Hoxa9, Hoxa11, Hoxd10 and Hoxd11, most of which are expressed in fin-MNs of little skate.

Could the authors provide a sentence to try to explain this observation? I found confusing that this is mentioned without providing more context.

We meant to suggest that DEG is not only generated by gene activation but also gene repression; tail-SC Hox genes are predicted to bind to genes enriched in pec-MNs and this binding may lead to repression of the genes in tail-SC. In the revision, we restated this part and the Limitation as follows:

“Fin-MN-specific ACRs were enriched with predicted binding sites of Hoxa5 and Hoxd9, which are expressed in the fin-MNs of little skate, while the tail-SC-specific ACRs in the pecMN genes (percentile > 70) were enriched with the predicted binding sites of Hoxd11 and Hoxa13, expressed in tail SCs of little skate.”

“…whether the predicted TFs actually bind to the putative binding sites and whether TFs function as activators or repressors are yet to be validated.”

6) Figure 5 data:

(6.1) Similar to previous comments, conclusions driven by this analysis might be biased by wrong comparative strategies to start with, thus conclusions are not well supported. Comparative of mouse and skate ACRs should be done without biasing first to DEX genes, which highly reduced the number of analysed ACRs, particularly to shared genes that are only 40.

As with the response to the reviewer #2-5.1 comment, in the revision, we have re-analyzed the ATAC-seq data with all the ACRs or ACRs in highly expressed genes (> 70 percentile). The ATAC-seq results have been updated accordingly in the Figure 4, 5 and Figure 5—figure supplement 1.

(6.2) MN TF enrich motifs are broadly found in mouse sensory and skate tail DEX genes, which might be a strong indication that the strategy used in the analysis is not suitable for the identification of MN gene regulatory networks.

As with the response to the reviewer #2-5.1 comment, in the revision, we have re-analyzed the ATAC-seq data with all the ACRs or ACRs in highly expressed genes (> 70 percentile). The ATAC-seq results have been updated accordingly in the Figure 4, 5 and Figure 5—figure supplement 1.

(6.3) Figure 5C: Most TF binding motifs in databases are built with experimental data from mouse or human TFs. Although core sequences for TF binding sites in the same families are conserved, small differences arise in individual members or between species. Could this explain why there is a higher number of motifs found in mouse than in skate? In addition, is the number of motifs in mouse and skate normalized by the size of analysed sequence?

We agree with the reviewer’s concern. In the revision, we have included the limitation of the analysis as follows:

“However, it is important to note that the motif analysis may be biased towards mouse data, because our motif enrichment analysis is based on motif data from mouse TFs.”

The enrichment of motifs in Figure 5, which uses HOMER, is generated with considering the size of analyzed sequences.

7) General comments on format:

(7.1) Figures 3-5: differences among circles sizes are difficult to appreciate, maybe color heatmaps would be more informative.

The figures have been modified accordingly in response to the reviewers’ comment.

(7.2) Figure 4 B, C could be included in supplementary.

Thanks for the suggestion. The figure 4B and C quantifies the locations of ACRs that are assigned to genic regions. The genic region is used for annotating genes that each ACR is associated with, so we think this is an important piece of information to follow the manuscript and have decided to keep the 4B and C in Figure 4.

Reviewer #3 (Recommendations for the authors):

The authors should be careful in their phrasing so as to always make it clear that they are simply predicting regulatory connections between all these genes.

For instance, on Page 3, line 29:

"Comparison of accessible chromatin regions between mouse and skate MNs revealed conservation of the potential regulators with divergent transcription factor (TF) networks through which expression of MN genes is differentially regulated. TF networks in little skate MNs are much simpler than those in mouse MNs, suggesting a more fine-grained control of gene expression operates in mouse MNs."

As one can see, without functional data in little skate, the claim that the TF networks are much simpler is not substantiated simply by ATACseq and predicted binding sites.

A similar claim on Page 17, line 338 indicates the same propensity to overstate these claims:

"As illustrated in the Figure 5C, a greater number of shared TFs binds to their downstream TFs in mouse MNs than in skate pec-MNs, allowing an intricate control of gene expression and thus the more complex nervous system of mouse compared to that of skate"

Again, there was no demonstration of little skate TFs binding to any downstream TF genes, only predicted binding sites. Thus, the claim is unsubstantiated.

These examples indicate an overall propensity by the authors to gloss over the fact that no functional connections between any TFs or genes were experimentally demonstrated in little skate. I do not believe it is appropriate to substitute binding motif enrichment for experimentally determined regulatory connections when inferring gene regulatory networks in something as complex as vertebrate development. There are a number of reasons why this is problematic.

As reviewer suggested, we have revised the manuscript to avoid overstatements and we have discussed the limitations as follows:

“However, it is important to note that the motif analysis may be biased towards mouse data, because our motif enrichment analysis is based on motif data from mouse TFs. In addition, whether the predicted TFs actually bind to the putative binding sites and whether TFs function as activators or repressors are yet to be validated. As another limitation of the current study, the ACRs analyzed here did not consider long-range regulatory elements, which might have caused the lack of associated ACRs in the MN genes (Figure 5C). For more accurate characterization of regulatory elements, future studies could provide a more comprehensive approach including ChIP-seq and chromatin conformation capture assay together with functional validation of the binding sites.” [Editors’ note: further revisions were suggested prior to acceptance, as described below.]

Essential revisions (please note that no additional experiments are required at this point):

1. Please clarify whether you performed ATAC-seq from mouse MNs.

In the previous version of the manuscript, we analyzed ATAC seq data from MNs of entire spinal cord (Closser et al.). As reviewer #1 and #3 suggested, we used a more recent ATAC seq dataset acquired specifically from forelimb and hindlimb level MNs (Sawai et al., 2022), to match the cell type as close as possible to skate fin MNs. In the revised version, the source of the ATAC seq data have been referenced as follows:

“…the TF motif prediction was performed with the ACRs of skate fin MN compared with the mouse limb-level MN ATAC-seq data (34)…”

“…ACRs of genes expressed in cortical PV interneuron and excitatory neurons (35) …”

2. The findings on Snail1 are not described, and this part should be removed.

We have removed the Snai1 data.

3. Please address the concerns raised by reviewer #3 about Figure 5.

The concerns on cell types used:

To address the concerns raised by Reviewer #3, we have reanalyzed data in Figure 5 by using publicly available ATAC data of limb-level MNs (forelimb and hindlimb MNs). At limb levels, most of the MNs are of the LMC subtype, so we believe this very closely matches the compared cell types (limb MNs of mouse and fin MNs of skate). From the analysis we found more TF motif predictions in ACRs of genes that are expressed in mouse MNs than in skate MNs. As reviewer suggested, we have mentioned the caveat of this finding in the results as follows:

“However, it is important to note that the larger number of TF motif predictions in mouse MN-expressed genes could be due to the biased motif database toward mouse TFs.”

The concerns about the meaning of the comparative motif prediction analysis:

Among the TF motif predictions, 14 TF motif predictions were commonly found in genes expressed in skate fin-MNs and mouse limb-level MNs. However, only a subset (10 TF motifs in cortical PV interneurons: Sp5, Sp2, Smad3, Rfx6, Rf1, Bmyb, Klf5, Klf3, Lhx1, En1; 8 TF motifs in cortical excitatory interneurons: Sp5, Sp2, Smad3, Rfx6, Rf1, Bmyb, Klf5, Klf3) of the 14 TF motifs were enriched in ACRs of genes expressed in cortical PV interneurons and excitatory interneurons in mouse. We think this suggests that the 14 TF motifs would not be randomly observed and that the 14 TF motifs may have functions in regulating cell types or regional identities of neurons.

4. We acknowledge that the revised version has toned down most claims on gene regulatory mechanisms, but we further suggest toning down the claim made in the title of the paper.

We have edited the title as follows: “Little skate genome provides insights into genetic programs essential for limb-based locomotion”

5. The manuscript should be edited for language and grammatical errors and carefully proofread.

The language and grammatical errors in the manuscript have been proofread.

Reviewer #1 (Recommendations for the authors):

The manuscript is much improved, as the authors have addressed a number of the major previous concerns, including re-analyzing RNA-seq data, generating a new set of mouse RNA-seq data, and validating their results with in situ hybridization. The new analysis seems much more convincing than the previous one. Some lingering concerns remain, mostly regarding figure 5 and the central claim of the paper, which is still not functionally supported. The authors did however tone down their claims and pointed out the limitations of the study.

(1) Did the authors perform ATAC-seq from mouse MNs? They show some data in figure 5 but it was not clear from the description of the methods or the results whether they performed the experiment.

In the previous version of the manuscript, we analyzed ATAC seq data from MNs of entire spinal cord (Closser et al.). As reviewer #1 and #3 suggested, we used a more recent ATAC seq dataset acquired specifically from forelimb and hindlimb level MNs (Sawai et al., 2022), to match the cell type as close as possible to skate fin MNs. In the revised version, the source of the ATAC seq data have been referenced as follows:

In the Results,

“…the TF motif prediction was performed with the ACRs of skate fin MN compared with the mouse limb-level MN ATAC-seq data (34)…”

“…ACRs of genes expressed in cortical PV interneuron and excitatory neurons (35) …”

In the Materials and methods,

“The ATAC-seq raw data of mouse limb-level MNs (brachial and lumbar) published under the GEO accession of GSE175503 (34) was used for comparing with skate ATAC-seq data. The mouse cortical PV interneuron and excitatory neuron RNA-seq and ATAC-seq data (35) with GEO accession of GSE63137 were downloaded.”

(2) It seems that repeating the motif analysis of the ATAC-seq data gave completely new regulatory factors for FoxP1, even though the same regions as in the original manuscript are shown. It appears that Snai1 is no longer on the list so the experiment in the supplemental figures testing its function is somewhat moot. The authors also do not describe the experiment at all in the Results section so it should be taken out.

The figure containing the Snai1 data has been removed from the manuscript.

Reviewer #3 (Recommendations for the authors):

The revised manuscript has made important efforts in answering some of the raised concerns but did not address other key issues, particularly at the end of the manuscript.

The description of the little skate genome is, with no doubt, useful for the field of Evolutionary Biology. Then authors, re-analyse previously published experimental data and compare differential gene expression between isolated pectoral motorneurons and a mixed population of the tail spinal cord of little skate (Figure 2) and differential accessible chromatin regions between Fin motorneurons (Pectoral+pelvic) compared to a mixed population of the tail spinal cord (Figure 4). These two figures are descriptive and it is unclear what insights are provided by the comparison of these heterogeneous populations of cells. Thus do not seem to constitute a great advancement in the understanding of gene regulatory networks present in the little skate or their evolution.

In the new version of the manuscript authors now compared homologous motorneuron populations of the little skate, mouse, and chick, which reveals a remarkable degree of conservation of the transcriptomes in the 3 species (Figure 3), which is even higher when considering possible paralog substitutions in the few divergently expressed genes. This is radically different from the initial version of the manuscript and I think is an important observation.

Finally, the authors attempt to describe and compare motorneuron gene regulatory networks in mouse and skate in Figure 5. I think this is the weakest part of the manuscript, not only I found it hard to follow, not clearly explained, and using vague terms and overstatements but in addition the methodology and strategy for the analysis seem incorrect, leading to potentially wrong conclusions.

To start, it is unclear to me what is exactly the mouse motorneuron population that is being compared and how equivalent it is to the mixed Pectoral and pelvic motorneuron population from the little skate.

To address the concerns raised by Reviewer #3, we have reanalyzed data in Figure 5 by using publicly available ATAC data of limb-level MNs (forelimb and hindlimb MNs; Sawai et al.). At the limb levels most of the MNs are of the LMC subtype, so we believe this would very closely match the cell types of comparison (limb MNs of mouse and fin MNs of skate).

More importantly, Figure 5A: authors describe 18 TF motifs commonly enriched in mouse and skate MN ACRs, among which 6 TFs predicted to bind those motifs are expressed both in mouse and skate. What does this mean? Is this overlap biologically meaningful? How many would overlap if enriched motifs in skate ACRs are compared to motifs in mouse ACRs of a non-related neuron type at a similar developmental stage, such as cortical interneurons cortical projection neurons? Less? More? similar number?

Among the TF motif predictions, 14 TF motif predictions were commonly found in genes expressed in skate fin-MNs and mouse limb-level MNs. However, only a subset (10 TF motifs in cortical PV interneurons: Sp5, Sp2, Smad3, Rfx6, Rf1, Bmyb, Klf5, Klf3, Lhx1, En1; 8 TF motifs in cortical excitatory interneurons: Sp5, Sp2, Smad3, Rfx6, Rf1, Bmyb, Klf5, Klf3) of the 14 TF motifs were enriched in ACRs of genes expressed in cortical PV interneurons and excitatory interneurons in mouse. We think this suggests that the 14 TF motifs would not be randomly observed and that the 14 TF motifs may have functions in regulating cell types or regional identities of neurons.

Authors then look for motif enrichment of these 6 common motif/TFs in ACRs of other expressed TFs (either expressed both in mouse and skate or only in one of them). It is unclear why TFs with enriched motifs in mouse and skate should be upstream of the other TFs, it is equally possible that the 6 common motif/TFs are downstream of the expressed TFs. In addition, using the term "interactions" for motif enrichment of one TF in the ACRs of another TF is an overstatement.

We understand the reviewer #3’s concern. In the revised manuscript, this analysis has been removed. And the term “interaction” has been edited to avoid overstatement.

It is also striking that "interactions" of the 6 mouse common motif/TFs seem equally prevalent within ACRs of mouse-expressed TFs compared to ACRs of TFs expressed in skate but not in mouse. Similarly, for the skate data, motif enrichment in ACRs of commonly expressed TFs or TFs only expressed in the skate is not higher than in ACRs of TF expressed in mouse only. These results again raise doubts if this analysis is meaningful at all. Would it be different using just randomly picked ACRs from other TFs not expressed in MN? Finally, as already mentioned in the first review, the increasing number of motifs for mouse TFs could be again due to methodological limitations (based on known motifs in mouse compared to skate, etc) but not biologically meaningful, it should be stated right away when described and not as a separate paragraph in the section of limitations for the study.

As reviewer #3 suggested, we have mentioned the caveat of this finding in the results as follows:

“However, it is important to note that the larger number of TF motif predictions in mouse MN-expressed genes could be due to the biased motif database toward mouse TFs.”

Considering all these methodologic concerns, together with the lack of any experimental validation of predicted binding sites for any of the TFs, it would be advisable to completely remove that figure.

In summary, the manuscript has valuable information, namely the description of the little skate genome and the comparison of mouse, chick, and little skate MN transcriptome. It also provides a description and comparison of some heterogeneous populations of neurons in little skate which provide limited insights into gene regulation in skate motorneurons. Most importantly, I think the last part of the manuscript (Figure 5) is below the standards required for a journal such eLife. Unfortunately, I don´t think the paper, in its current revised format, provides any mechanism underlying the evolution of vertebrate locomotion as stated in the title.

Other comments:

Authors constantly use the term "MN genes" or similar expressions when should be referring to "MN expressed genes" or "MN enriched genes". Other non-accurate expressions:

"Number of predicted TFs enriched" when it refers to TF motif predictions, "expression of each predicted TF" when meaning "TF expression for the corresponding TF enriched motif ", "predicted shared TFs found in MN ACRs" meaning " predicted shared enriched TF motifs found in MN ACRs", etc.

This lack of accuracy makes it harder for the reader to follow the text.

The inaccurate terms have been removed or modified throughout the manuscript.

Methods include snail cDNA electroporation, but I don't think those results are included in the manuscript.

The methods describing Snai1 cDNA electroporation have been removed from the manuscript.

In figure 4D, the legend states ACR group but would be clearer to label as Motif category or Motif distribution in ACR categories.

The legend in Figure 4D have been edited to “Motif category”.

Line 251: "Together with the predicted binding sites of the Hox proteins, the binding sites of Foxp1 and Pbx1 and Lhx3, which are well-known regulators in MN(31-33), were enriched in shared ACRs and fin-MN-specific and tail-SC-specific ACRs, respectively (Figure 4D)"

However in the figure Pbx1 is also in the shared category as Foxp1, not in fin-MN specific, correct?

The statement has been corrected as follows:

“…motif predictions of Foxp1, Pbx1, and Lhx3, well-known regulators in MN(31-33), were found in the ACRs; the motif predictions of Foxp1and Pbx1 in shared ACRs and Lhx3 in fin-MN-specific and tail-SC-specific ACRs, respectively…”

Why Figure 5 shows common TFs only 16 TFs, if figure 3 shows many more?

In the previous Figure 5 we analyzed only the 16 TFs that are highly expressed in MNs but not in tail SC or cervical SC. However, in the revised manuscript the network plot showing these TFs have been removed from the manuscript to avoid misunderstanding.

https://doi.org/10.7554/eLife.78345.sa2

Article and author information

Author details

  1. DongAhn Yoo

    Interdisciplinary Program in Bioinformatics, Seoul National University, Seoul, Republic of Korea
    Contribution
    Conceptualization, Software, Formal analysis, Visualization, Writing – original draft, Writing – review and editing
    Contributed equally with
    Junhee Park
    Competing interests
    No competing interests declared
  2. Junhee Park

    Department of Brain Sciences, DGIST, Daegu, Republic of Korea
    Contribution
    Conceptualization, Resources, Writing – review and editing
    Contributed equally with
    DongAhn Yoo
    Competing interests
    No competing interests declared
  3. Chul Lee

    Interdisciplinary Program in Bioinformatics, Seoul National University, Seoul, Republic of Korea
    Contribution
    Software, Formal analysis, Writing – review and editing
    Competing interests
    No competing interests declared
  4. Injun Song

    Department of Brain Sciences, DGIST, Daegu, Republic of Korea
    Contribution
    Validation
    Competing interests
    No competing interests declared
  5. Young Ho Lee

    Interdisciplinary Program in Bioinformatics, Seoul National University, Seoul, Republic of Korea
    Contribution
    Resources, Writing – review and editing
    Competing interests
    No competing interests declared
  6. Tery Yun

    Department of Brain Sciences, DGIST, Daegu, Republic of Korea
    Contribution
    Validation
    Competing interests
    No competing interests declared
  7. Hyemin Lee

    Department of Biology, Graduate School of Arts and Science, NYU, New York, United States
    Contribution
    Validation
    Competing interests
    No competing interests declared
  8. Adriana Heguy

    Genome Technology Center, Division for Advanced Research Technologies, and Department of Pathology, NYU School of Medicine, New York, United States
    Contribution
    Resources, Writing – review and editing
    Competing interests
    No competing interests declared
  9. Jae Yong Han

    Department of Agricultural Biotechnology, Seoul National University, Seoul, Republic of Korea
    Contribution
    Writing – review and editing
    Competing interests
    No competing interests declared
    ORCID icon "This ORCID iD identifies the author of this article:" 0000-0003-3413-3277
  10. Jeremy S Dasen

    Neuroscience Institute, Department of Neuroscience and Physiology, New York University School of Medicine, New York, United States
    Contribution
    Conceptualization, Resources, Supervision, Writing – original draft, Writing – review and editing
    For correspondence
    Jeremy.Dasen@nyumc.org
    Competing interests
    No competing interests declared
    ORCID icon "This ORCID iD identifies the author of this article:" 0000-0002-9434-874X
  11. Heebal Kim

    1. Interdisciplinary Program in Bioinformatics, Seoul National University, Seoul, Republic of Korea
    2. Department of Agricultural Biotechnology and Research Institute of Agriculture and Life Sciences, Seoul National University, Seoul, Republic of Korea
    3. eGnome, Inc, Seoul, Republic of Korea
    Contribution
    Conceptualization, Supervision, Funding acquisition, Writing – original draft, Writing – review and editing
    For correspondence
    heebal@snu.ac.kr
    Competing interests
    No competing interests declared
    ORCID icon "This ORCID iD identifies the author of this article:" 0000-0003-3064-1303
  12. Myungin Baek

    Department of Brain Sciences, DGIST, Daegu, Republic of Korea
    Contribution
    Conceptualization, Resources, Data curation, Formal analysis, Supervision, Funding acquisition, Writing – original draft, Writing – review and editing
    For correspondence
    bmi008@dgist.ac.kr
    Competing interests
    No competing interests declared
    ORCID icon "This ORCID iD identifies the author of this article:" 0000-0001-8906-901X

Funding

Ministry of Science and ICT, South Korea (2021010004)

  • Myungin Baek

National Research Foundation of Korea (NRF-2019R1I1A2A01041345)

  • Myungin Baek

Ministry of Oceans and Fisheries (20180430)

  • Heebal Kim

National Institutes of Health (1S10OD023423-01)

  • Adriana Heguy

National Institutes of Health (R35 NS116858)

  • Jeremy S Dasen

The funders had no role in study design, data collection and interpretation, or the decision to submit the work for publication.

Acknowledgements

We thank NYU Langone’s Genome Technology Center for technical support. This study was supported by the DGIST R&D Program of the Ministry of Science and ICT (2021010004) to MB. It was also supported by Basic Science Research Program through the National Research Foundation of Korea (NRF) funded by the Ministry of Education (NRF-2019R1I1A2A01041345) to MB, the Marine Biotechnology Program of the Korea Institute of Marine Science and Technology Promotion (KIMST) funded by the Ministry of Ocean and Fisheries (MOF) (No. 20180430), Republic of Korea to HK, and National Institutes of Health (NIH) grant R35 NS116858 to JD. The PacBio Sequel data was obtained thanks to the National Institutes of Health Shared Instrumentation Grant 1S10OD023423-01.

Ethics

Animal procedures were conducted under the approval of the IACUC at DGIST (DGIST-IACUC-21062403-0002).

Senior Editor

  1. Catherine Dulac, Harvard University, United States

Reviewing Editor

  1. Paschalis Kratsios, University of Chicago, United States

Version history

  1. Received: March 3, 2022
  2. Preprint posted: March 16, 2022 (view preprint)
  3. Accepted: October 10, 2022
  4. Version of Record published: October 26, 2022 (version 1)

Copyright

© 2022, Yoo, Park et al.

This article is distributed under the terms of the Creative Commons Attribution License, which permits unrestricted use and redistribution provided that the original author and source are credited.

Metrics

  • 1,087
    Page views
  • 147
    Downloads
  • 0
    Citations

Article citation count generated by polling the highest count across the following sources: Crossref, PubMed Central, Scopus.

Download links

A two-part list of links to download the article, or parts of the article, in various formats.

Downloads (link to download the article as PDF)

Open citations (links to open the citations from this article in various online reference manager services)

Cite this article (links to download the citations from this article in formats compatible with various reference manager tools)

  1. DongAhn Yoo
  2. Junhee Park
  3. Chul Lee
  4. Injun Song
  5. Young Ho Lee
  6. Tery Yun
  7. Hyemin Lee
  8. Adriana Heguy
  9. Jae Yong Han
  10. Jeremy S Dasen
  11. Heebal Kim
  12. Myungin Baek
(2022)
Little skate genome provides insights into genetic programs essential for limb-based locomotion
eLife 11:e78345.
https://doi.org/10.7554/eLife.78345

Further reading

    1. Evolutionary Biology
    2. Neuroscience
    Katja Heuer, Nicolas Traut ... Roberto Toro
    Research Article

    The process of brain folding is thought to play an important role in the development and organisation of the cerebrum and the cerebellum. The study of cerebellar folding is challenging due to the small size and abundance of its folia. In consequence, little is known about its anatomical diversity and evolution. We constituted an open collection of histological data from 56 mammalian species and manually segmented the cerebrum and the cerebellum. We developed methods to measure the geometry of cerebellar folia and to estimate the thickness of the molecular layer. We used phylogenetic comparative methods to study the diversity and evolution of cerebellar folding and its relationship with the anatomy of the cerebrum. Our results show that the evolution of cerebellar and cerebral anatomy follows a stabilising selection process. We observed 2 groups of phenotypes changing concertedly through evolution: a group of 'diverse' phenotypes - varying over several orders of magnitude together with body size, and a group of 'stable' phenotypes varying over less than 1 order of magnitude across species. Our analyses confirmed the strong correlation between cerebral and cerebellar volumes across species, and showed in addition that large cerebella are disproportionately more folded than smaller ones. Compared with the extreme variations in cerebellar surface area, folial anatomy and molecular layer thickness varied only slightly, showing a much smaller increase in the larger cerebella. We discuss how these findings could provide new insights into the diversity and evolution of cerebellar folding, the mechanisms of cerebellar and cerebral folding, and their potential influence on the organisation of the brain across species.

    1. Developmental Biology
    2. Evolutionary Biology
    Salvatore D'Aniello, Stephanie Bertrand, Hector Escriva
    Feature Article

    Cephalochordates and tunicates represent the only two groups of invertebrate chordates, and extant cephalochordates – commonly known as amphioxus or lancelets – are considered the best proxy for the chordate ancestor, from which they split around 520 million years ago. Amphioxus has been an important organism in the fields of zoology and embryology since the 18th century, and the morphological and genomic simplicity of cephalochordates (compared to vertebrates) makes amphioxus an attractive model for studying chordate biology at the cellular and molecular levels. Here we describe the life cycle of amphioxus, and discuss the natural histories and habitats of the different species of amphioxus. We also describe their use as laboratory animal models, and discuss the techniques that have been developed to study different aspects of amphioxus.