Metrics of high cofluctuation and entropy to describe control of cardiac function in the stellate ganglion
- UCLA Cardiac Arrhythmia Center and UCLA Neurocardiology Research Program of Excellence, United States
- Department of Engineering Mathematics and Internetworking, Dalhousie University, Canada
- UCLA Molecular, Cellular, and Integrative Physiology Program, United States
Figures
Figure 1
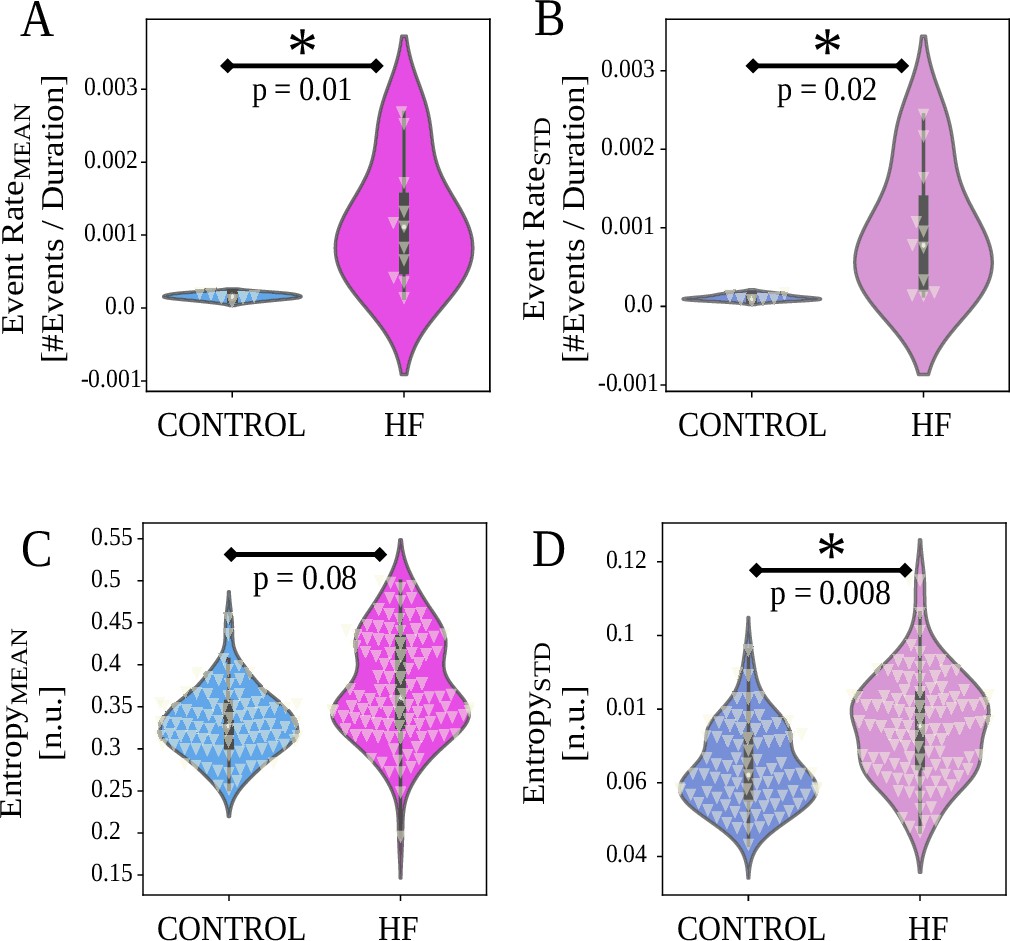
Event rate and entropy results between control and heart failure (HF) animals (horizontal axes).
White triangles indicate data points. (A, B) HF group animals show higher and compared to control group . (C, D) HF group animals show higher entropy variability (, Equation 2, , in (D)), and no difference in (Equation 2, , in (C)). For , p values are from two-sample t-test or Wilcoxon rank-sum tests, depending on normality. For entropy, p-values are from linear mixed effects (LMEs, Equation 2) detailed in Materials and methods.
Figure 2

Cofluctuation histograms (calculated from mean or standard deviation of sliding spike rate, referred as and , respectively) and log-normal fits for each animal group.
and are the respective mean and standard deviation (STD) of fitted distribution, used for 68% confidence interval bounds. (A, B) Control animals have narrower bounds and represent a better fit to log-normal distribution. (C, D) Heart failure (HF) animals display more heavily skewed distributions that indicate heavy tails.
Figure 3
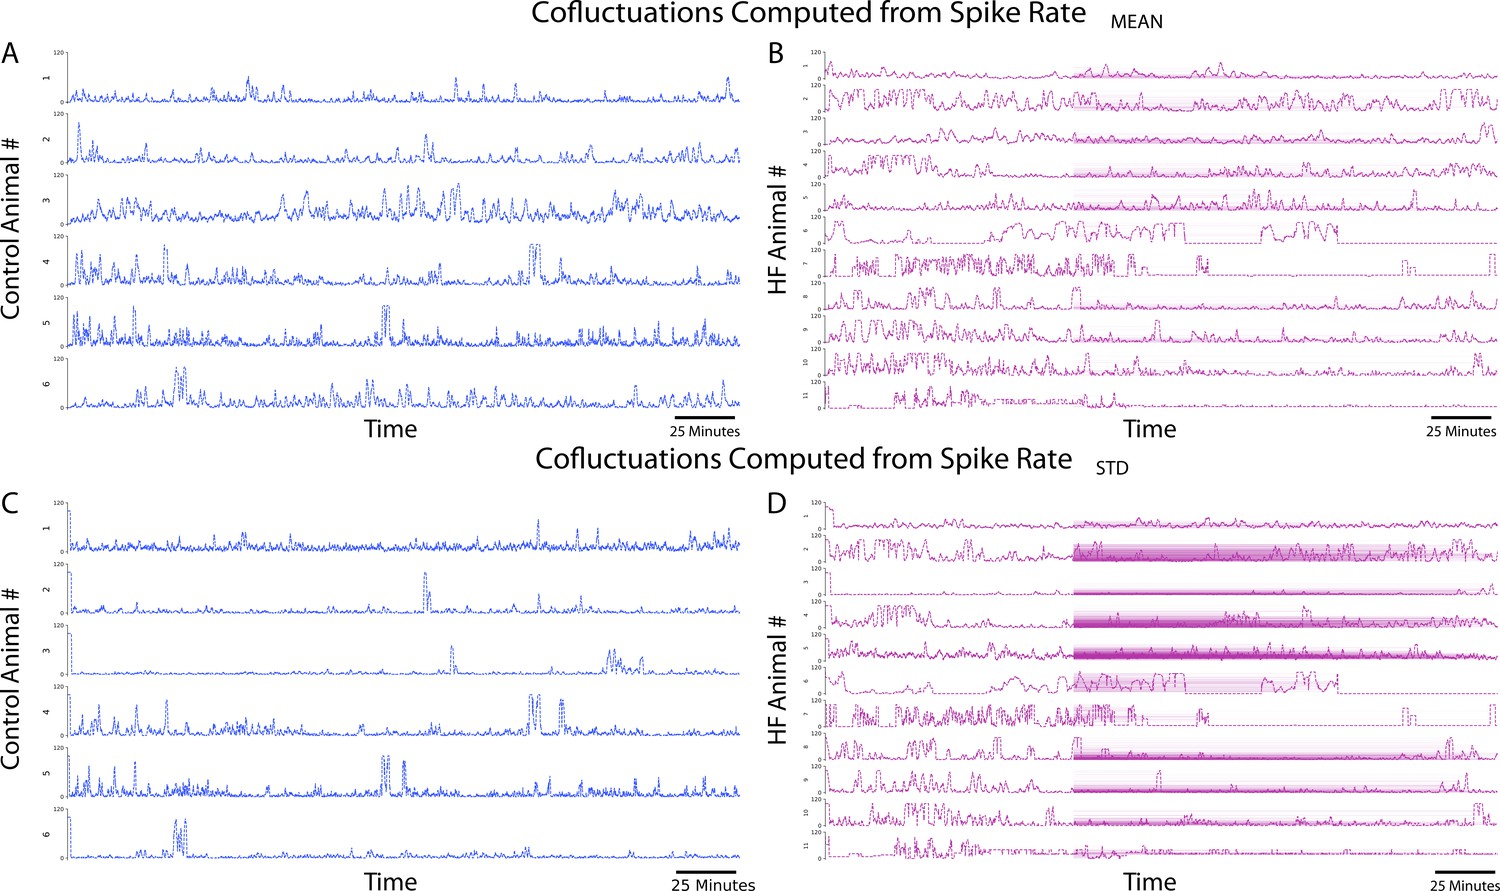
Cofluctuations time series at convergent values for each animal.
(A) Cofluctuations from coactivity calculation from mean of sliding spike rate for control animals. (B) Cofluctuations from coactivity calculation from mean of sliding spike rate for heart failure (HF) animals. (C) Cofluctuations from coactivity calculation from standard deviation of sliding spike rate for control animals. (D) Cofluctuations from coactivity calculation from standard deviation of sliding spike rate for HF animals.
Figure 4
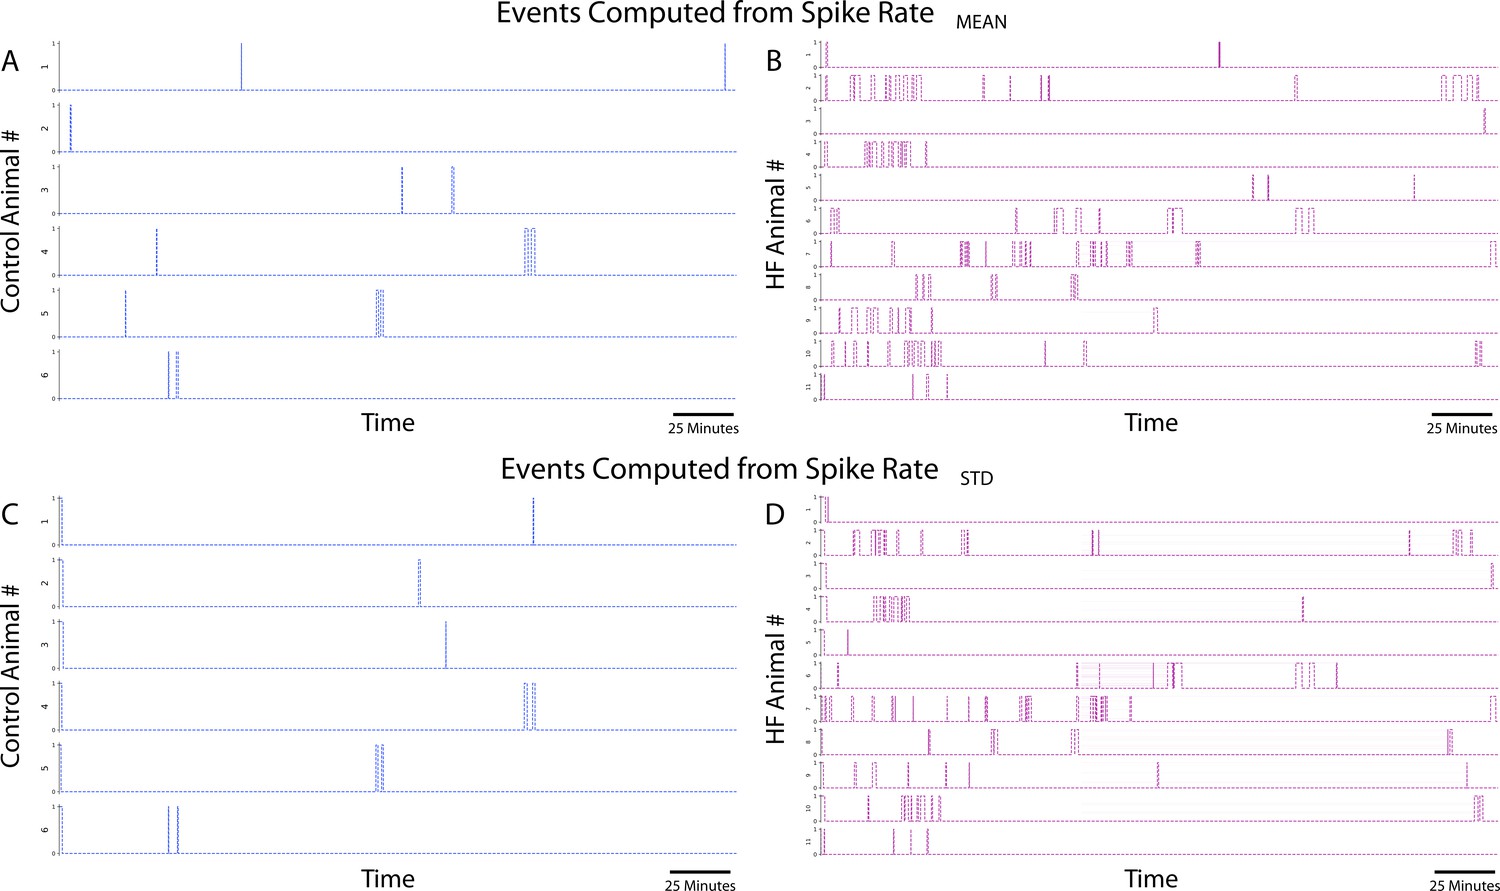
Events time series at convergent pairs for each animal.
(A) Events from coactivity calculation from mean of sliding spike rate for control animals. (B) Events from coactivity calculation from mean of sliding spike rate for heart failure (HF) animals. (C) Events from coactivity calculation from standard deviation of sliding spike rate for control animals. (D) Events from coactivity calculation from standard deviation of sliding spike rate for HF animals.
Figure 5
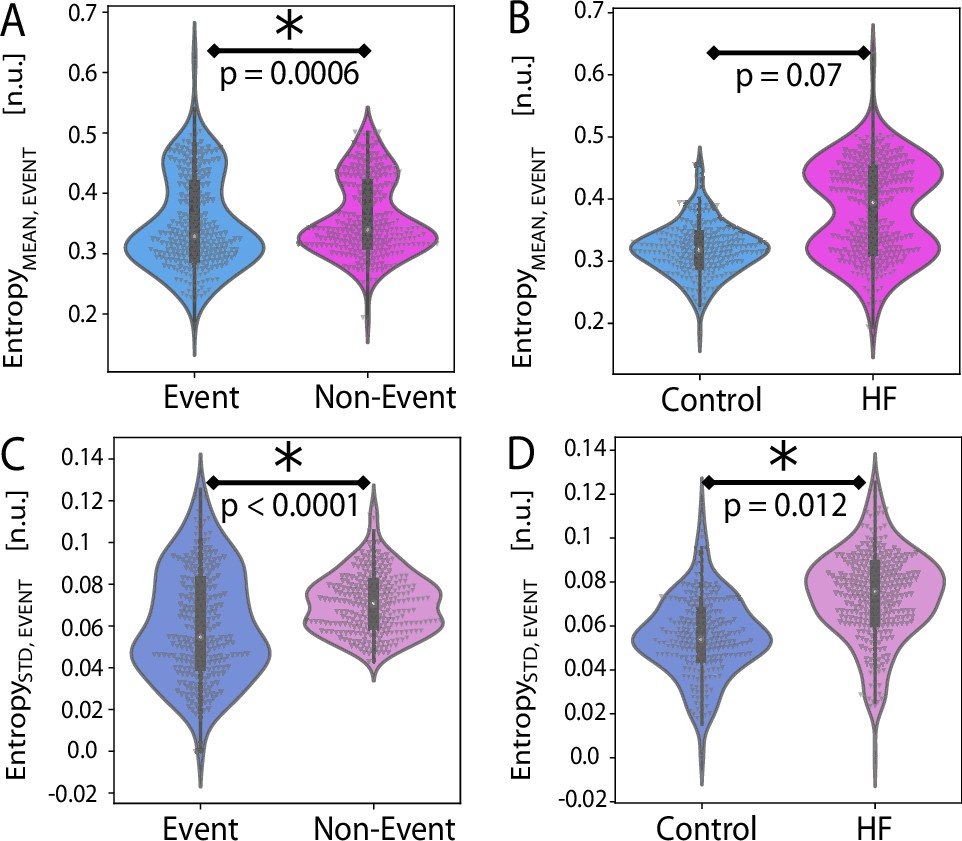
Event entropy Equation 2 investigation involved consideration of entropy values inside and outside of event regions.
(A) There is significant difference between in and across all animals . (B) There is no significant difference in between animal groups . (C) There is significant difference in between events and non-events across all animals . (D) There is significant difference in between animal groups .
Figure 6
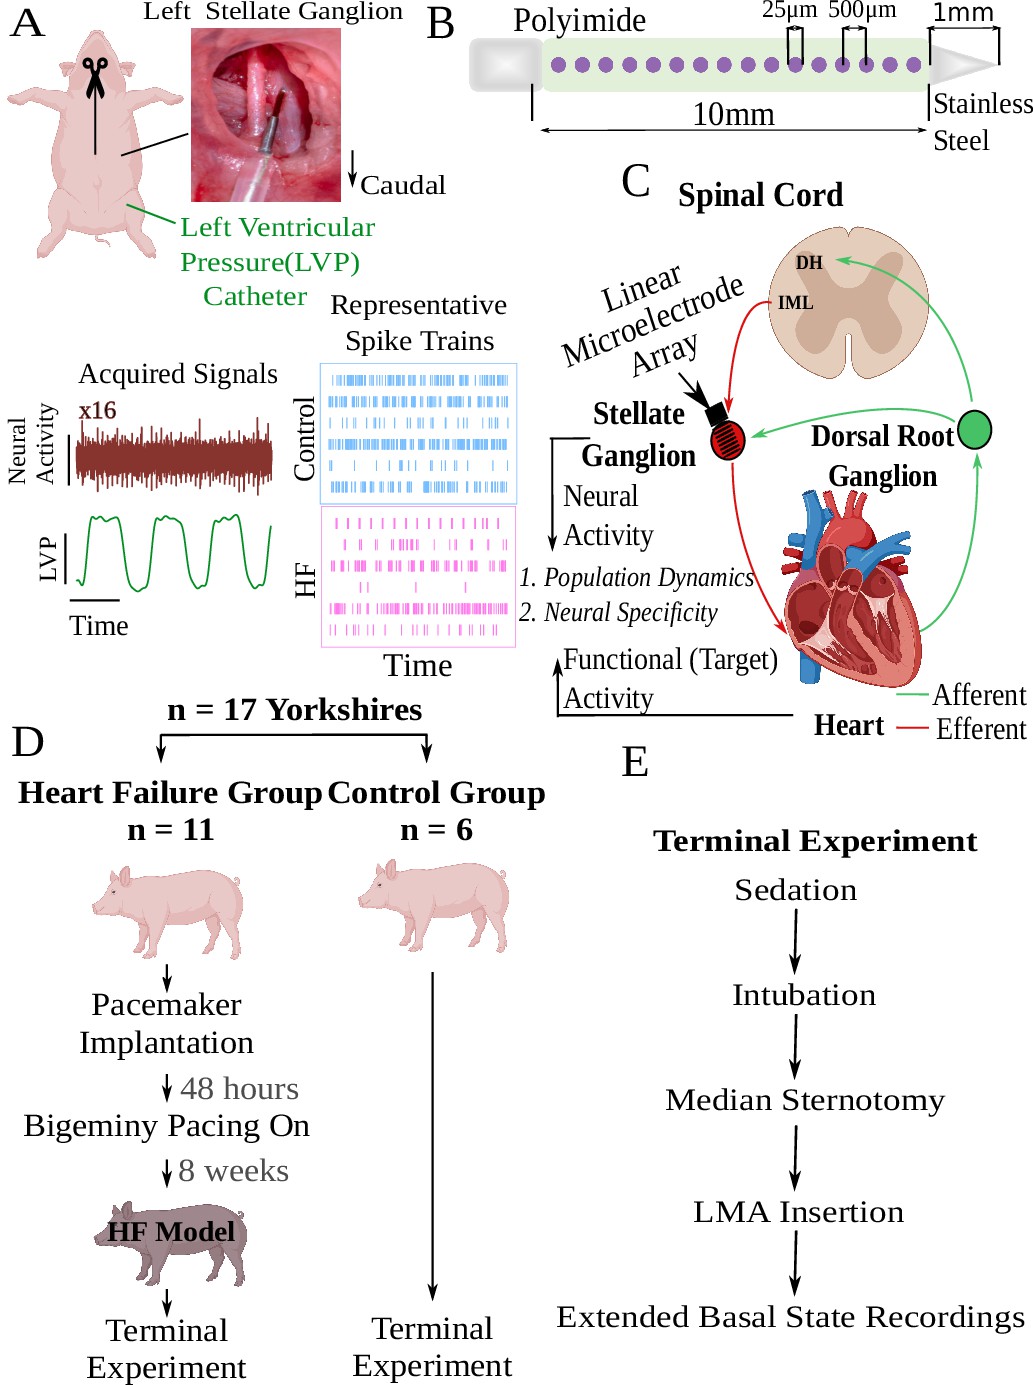
Experimental workflow and overall concept.
(A) A linear microelectrode array (LMA) was inserted to the left stellate ganglion (SG) for each animal. A total of 16 channels of neural activity were collected along with simultaneous left ventricular pressure (LVP). Representative spike trains are displayed for each animal group. (B) Specifications of the LMA. (C) Conceptual representation of this work. SG receives efferent and afferent information from the spinal cord’s intermediolateral complex (IML) and dorsal root ganglion, respectively, and transmits efferent information to the heart. In this work, we investigate neural activity and its relationship to cardiac function as represented by a control target such as LVP. (D) Among 17 Yorkshire pigs, 11 had heart failure induced by ventricular pacing, and 6 were in control group. SG recordings were collected at terminal experiments for both groups. (E) Experimental flow descripting the surgical preparation for the recordings. DH, dorsal horn.
Figure 7
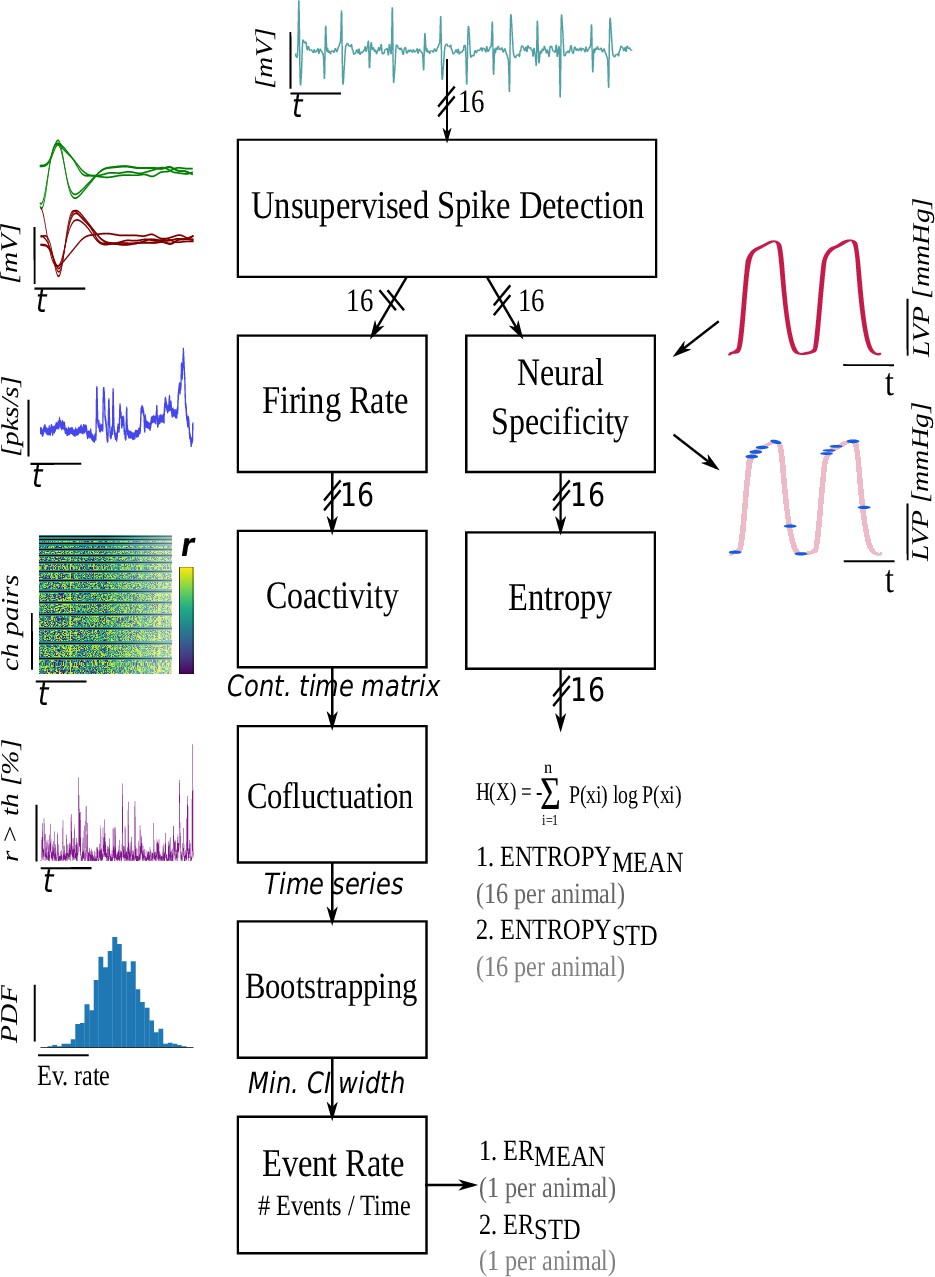
Signal processing block diagram.
Figure 8
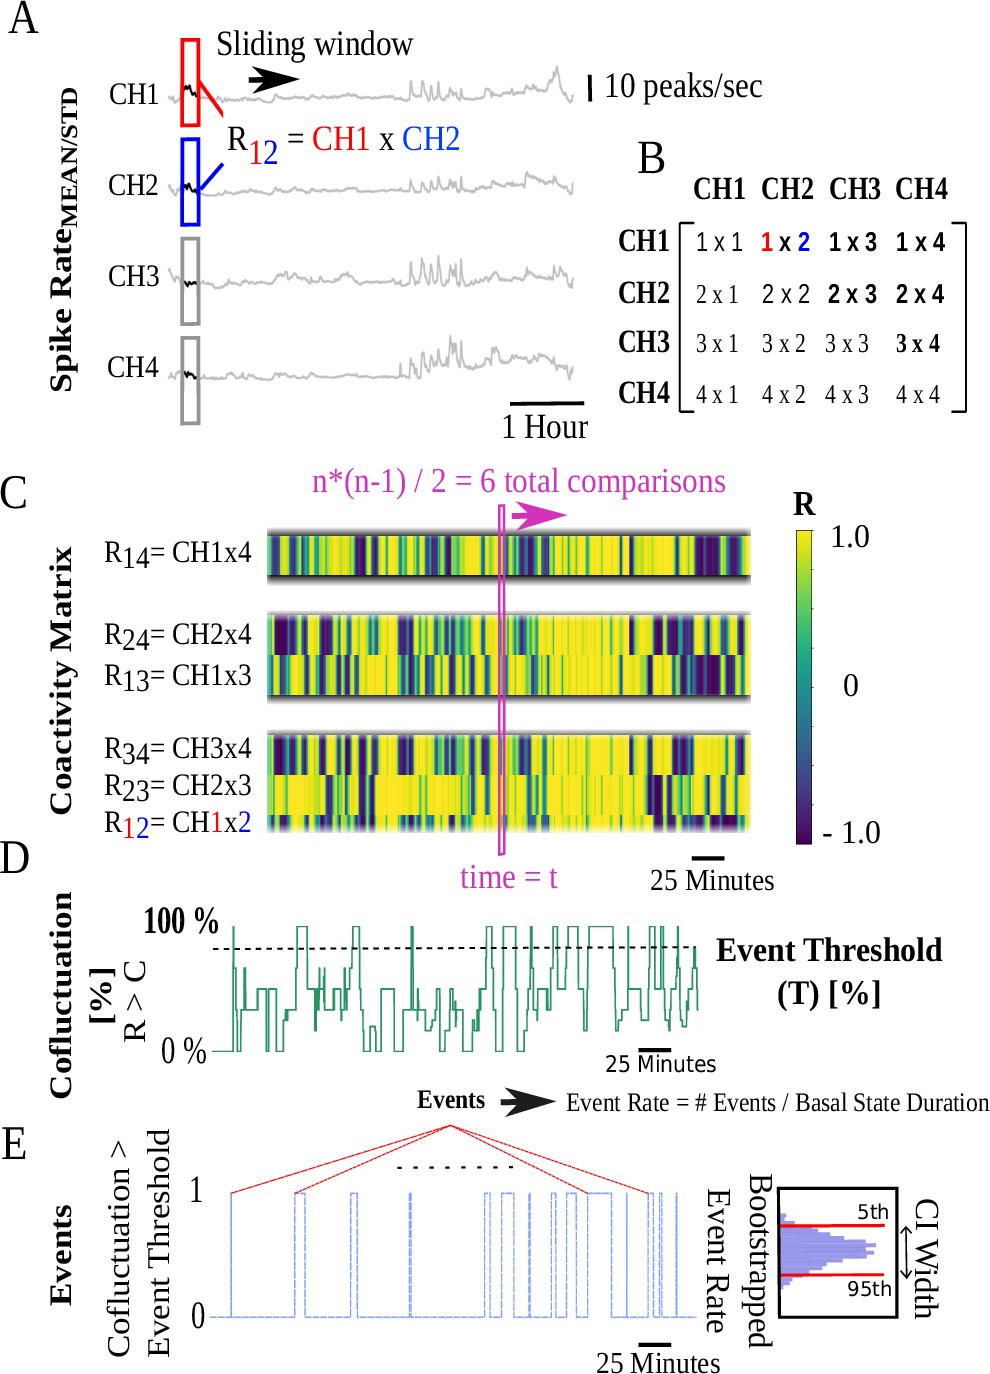
Coactivity matrix and event rate computation pipeline illustrated for four channels.
(A) Pearson’s cross-correlation coefficients of pairwise sliding spike rate windows for four channels. (B) values for cross-correlation of ‘i’ and ‘j’ channels are stored in the ‘i’ and ‘j’ positions of a 4×4 matrix at each timestamp. (C) Coactivity matrix super-diagonals at each timestamp are vertically stacked. At each timestamp t, unique cross-correlations are possible corresponding to super-diagonals with 3, 2, and 1 members. The y-axis begins at the bottom with the three members of the first super-diagonal followed by subsequent super-diagonals. Colors represent the value. (D) Cofluctuation time series are the percentage of Pearson’s values at each timestamp that exceed a cofluctuation threshold . (E) Discrete events correspond to time intervals when cofluctuations show an up/down crossing through an event threshold .
Appendix 1—figure 1
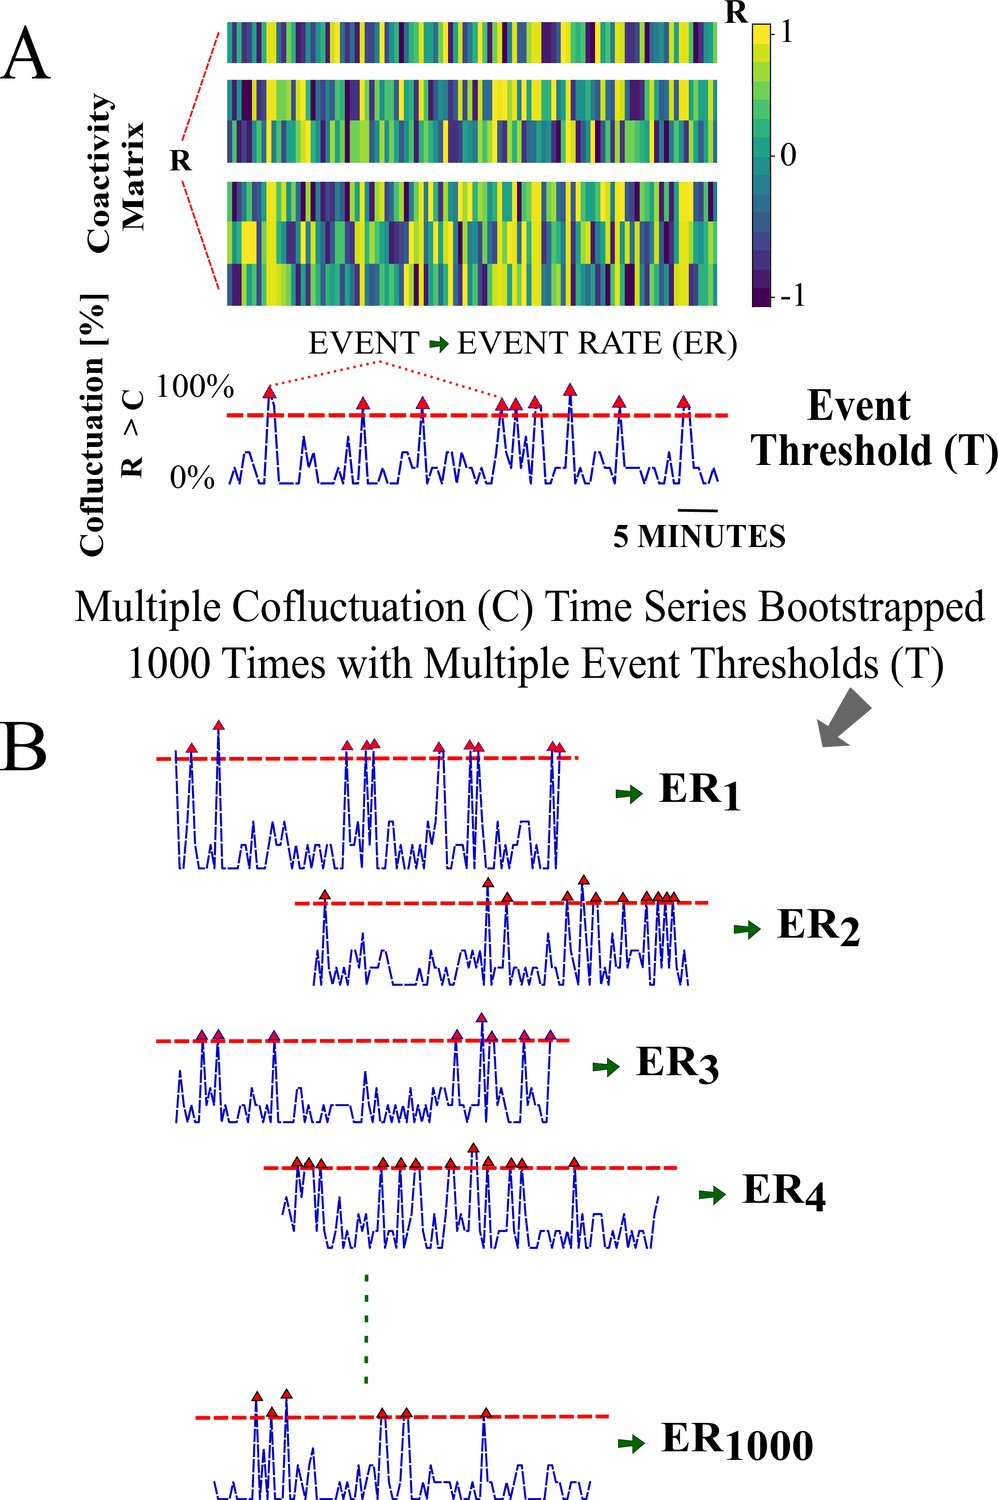
Cofluctuation bootstrapping pipeline for individualized event rate (ER) for each animal—Part I.
(A) Coactivity matrix and cofluctuation time series for a cofluctuation threshold and event threshold pair . (B) Cofluctuation time series with depicted events (red triangles are up-crossing timestamps) for a range of pairs. Panel A is further explained in Appendix 1—figure 5.
Appendix 1—figure 2
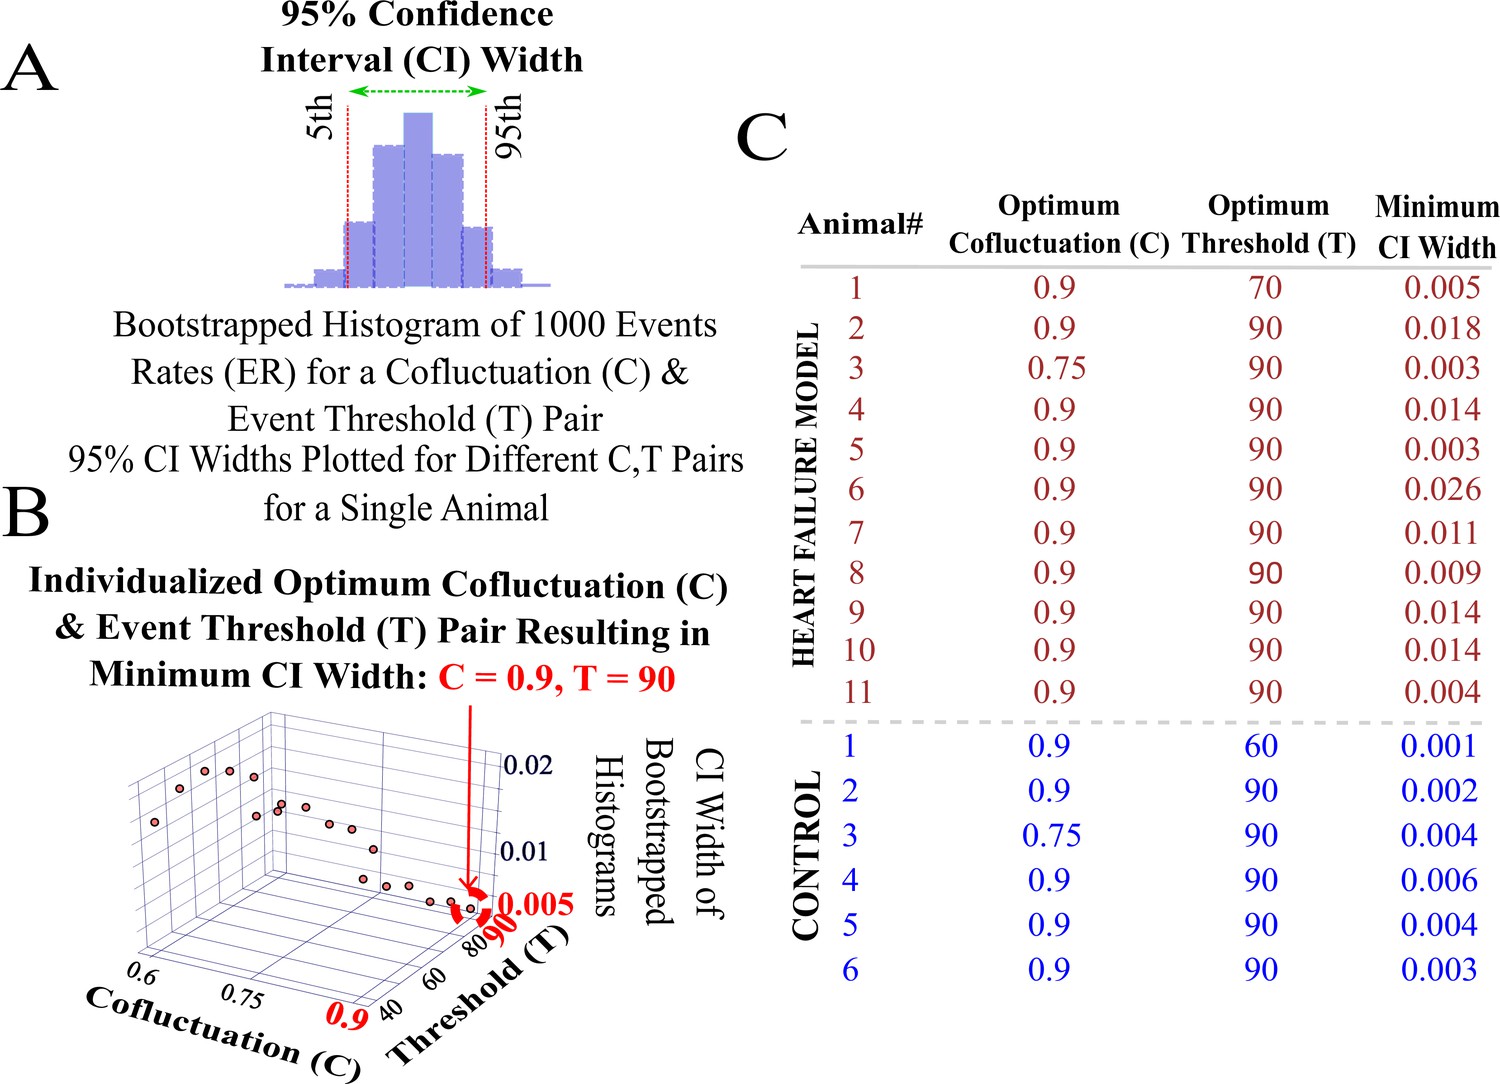
Cofluctuation bootstrapping pipeline for individualized event rate (ER) for each animal—Part II.
(A) Bootstrapped histogram of ERs for a single pair with 95% confidence interval width. (B) Threshold pair is chosen for an animal given non-zero and convergence. Depicted widths are found at all of the depicted pairs available on the axes grid. (C) List of pairs that show convergence with widths for each animal.
Appendix 1—figure 3
Neural specificity and entropy computation—Part I.
(A) Neural specificity sample showing left ventricular pressure (LVP) and neural spikes. Spiking activity is more specific or biased (yellow), over random sampling, to LVP just below systolic pressures. (B) Normalized histograms of random and neurally sampled LVP. (C) Bars show subtracted histograms and colors indicate the specificity thresholded with : specificity exceeding is yellow, below is blue, and between the bounds is teal.
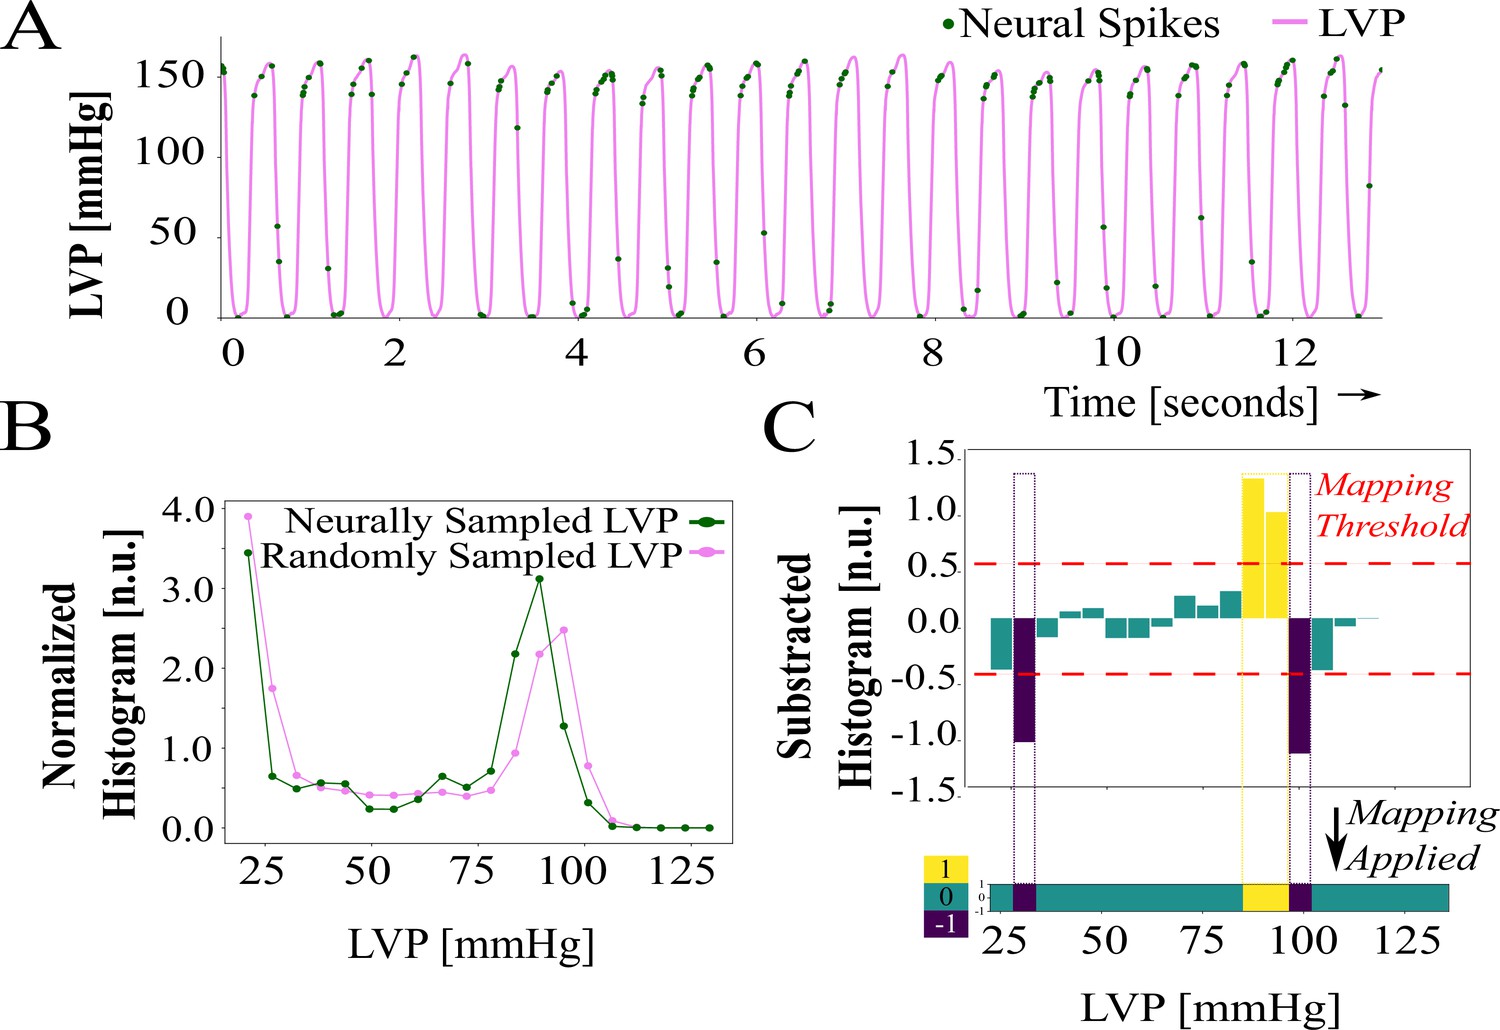
Appendix 1—figure 4
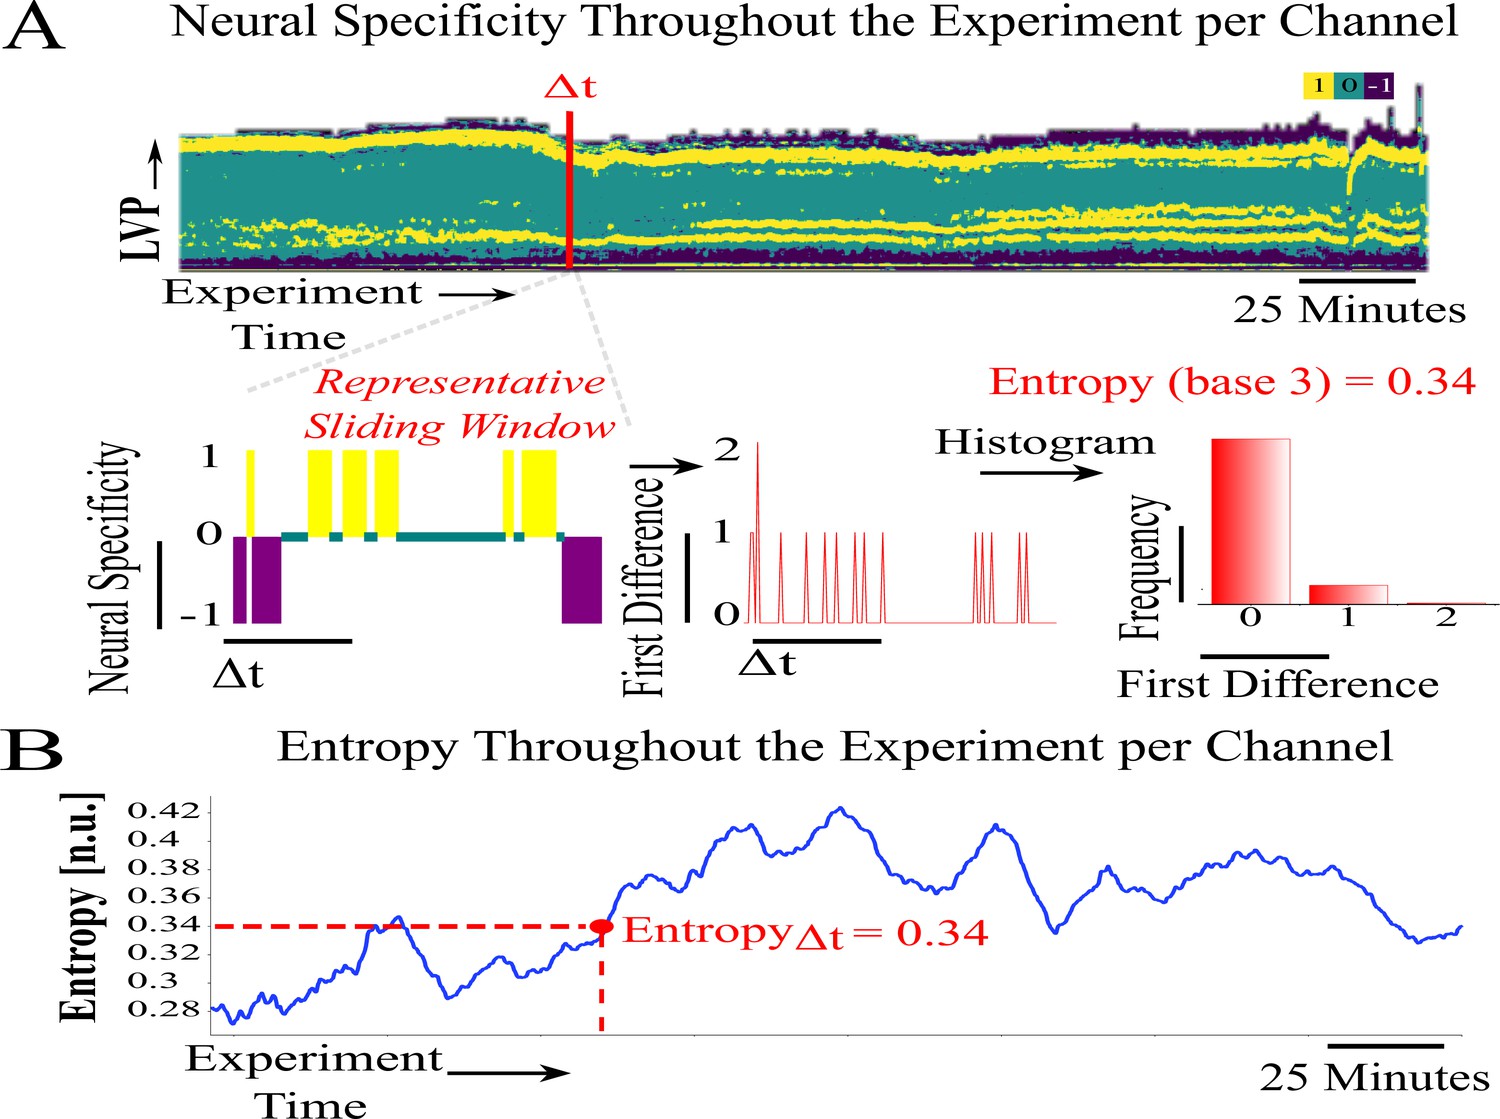
Neural specificity and entropy computation—Part II.
(A) Sliding neural specificity time series (top) for a selected sliding window width . Entropy of neural specificity, computed from red highlighted window of width, absolute difference (shown for a sample at bottom). (B) Entropy time series corresponding to the overall experiment, entropy sample computed from steps in (D). An animated version is in Appendix 1—Animation 1.Appendix 1—Animation 1
Appendix 1—figure 5
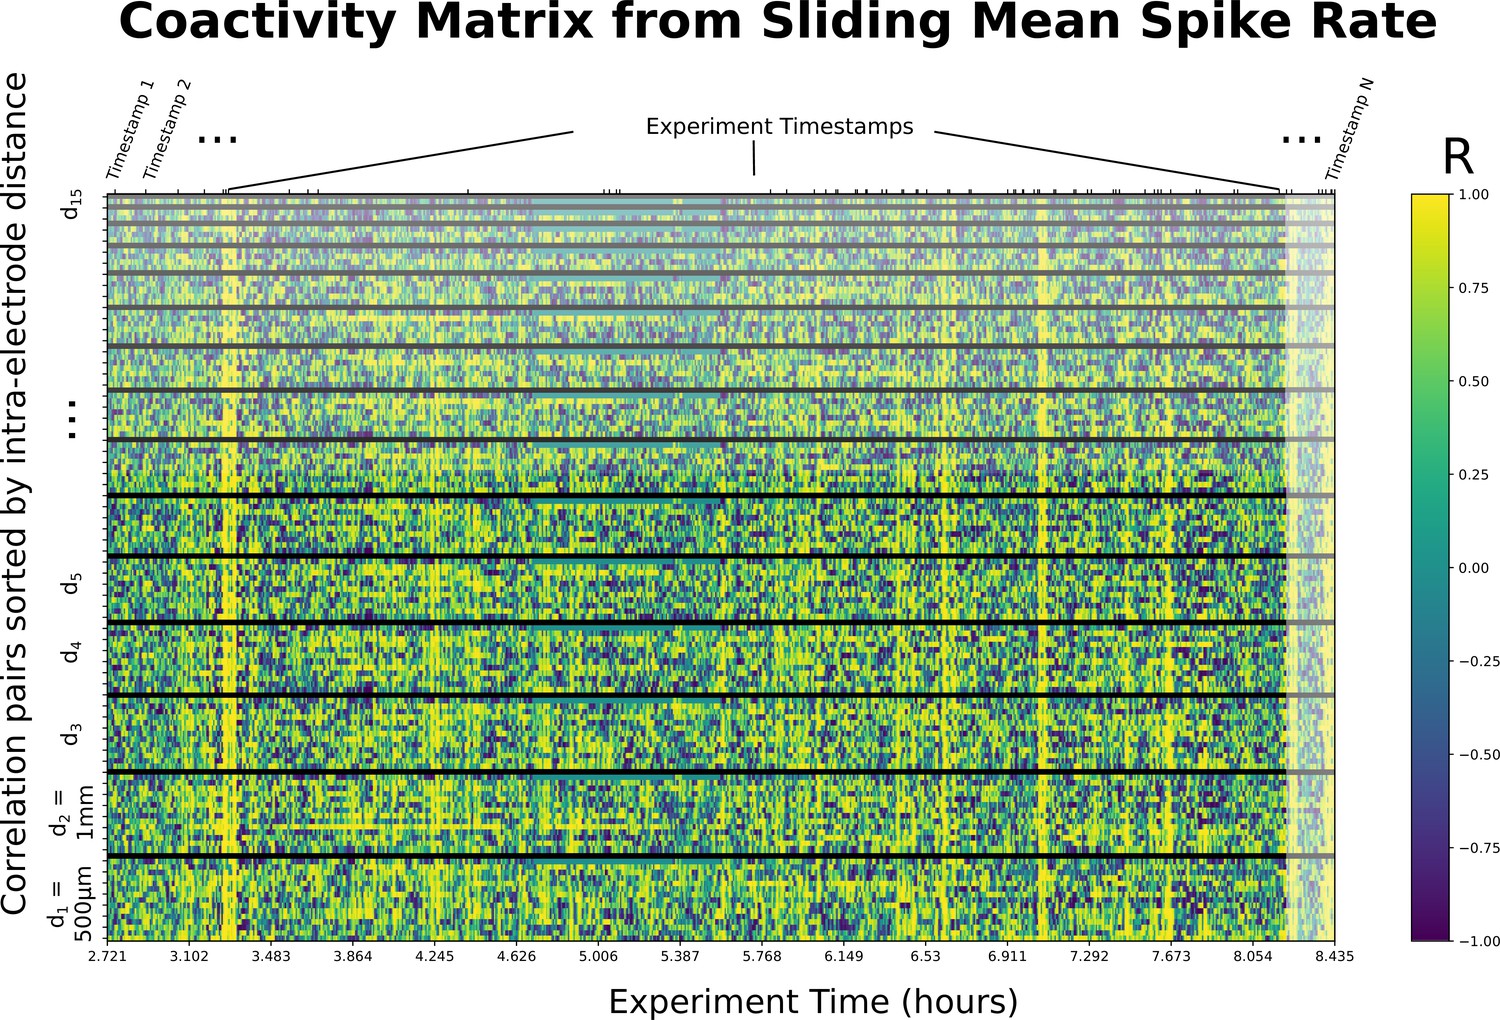
16-Channel version of Appendix 1—figure 1A.
A sample coactivity matrix computed from the sliding (rolling) mean of spike rate for the 16-channel linear mapping array (LMA) used throughout an experiment. Y axis shows correlation pairs (i.e., Channel 1 vs. Channel 2). Correlation pairs are stacked such that the lowest row corresponds to channels separated by the minimum inter-electrode distance (, 1-electrode away), and inter-electrode distance increasing from a separation of 1–15 channels at the top. For instance, the highest row shows the pair separated by the maximum inter-electrode distance (, 15-electrodes away). The order corresponds to the super-diagonals of the 16×16 correlation matrix. Y axis includes 120 comparisons for 16 channels, colors indicate Pearson’s correlation coefficients specified in the color legend.
Author response image 1
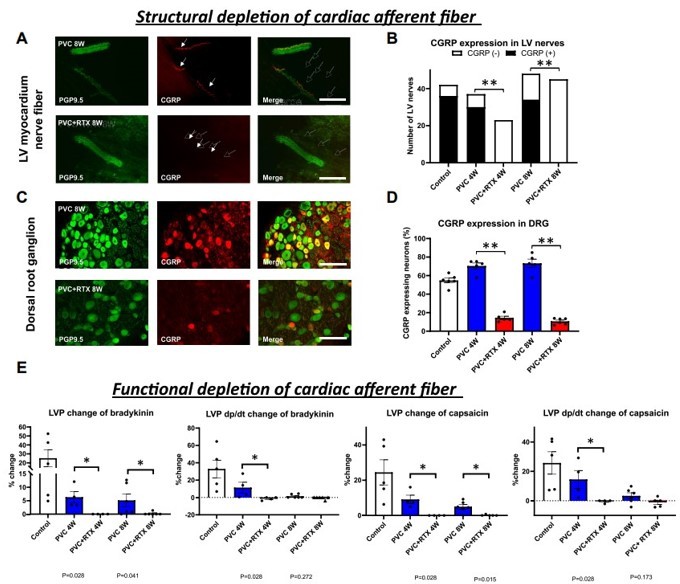
Structural and functional TRPV1 afferent depletion by RTX, from Hori et al.
(A): Representative images of LV nerve fibers demonstrating depletion of cardiac TRPV1 channel. Depletion of cardiac TRPV1 channel was confirmed by expression of CGRP. PVC 8W group (top row) shows double immunostaining for PGP9.5 and CGRP in LV nerve fibers (solid arrows), whereas the RTX-treated group (bottom row) showed no CGRP expression in nerve fibers (arrows). (B): Percentage of CGRP-expressing nerve fibers in the total of nerves confirmed in each group. The RTX-treated group showed a significant decrease of CGRP expression in both the 4-week and 8-week PIC models. (C): Representative images of decreasing CGRP-expressing neurons in DRG T1 due to cardiac TRPV1 channel depletion. (D): Percentage of CGRP-expressing neurons in DRG. CGRP expression significantly decreased with RTX treatment at both 4 weeks and 8 weeks. (E): Functional TRPV1 afferent depletion was confirmed by the response to the agonist of TRPV1 channel bradykinin and capsaicin. The RTX-treated group showed significantly weaker hemodynamic changes compared to the nontreated group for both of the agonists of the TRPV1 channel, and in 4-week and 8-week data. *P<0.05; **P<.01. Abbreviations: 4W = 4 weeks; 8W = 8 weeks; CGRP = calcitonin gene-related peptide; DRG = dorsal root ganglia; LV = left ventricle; LVP = left ventricular pressure; PGP9.5 = protein gene product 9.5; TRPV = transient receptor potential vanilloid-1.
Author response image 2
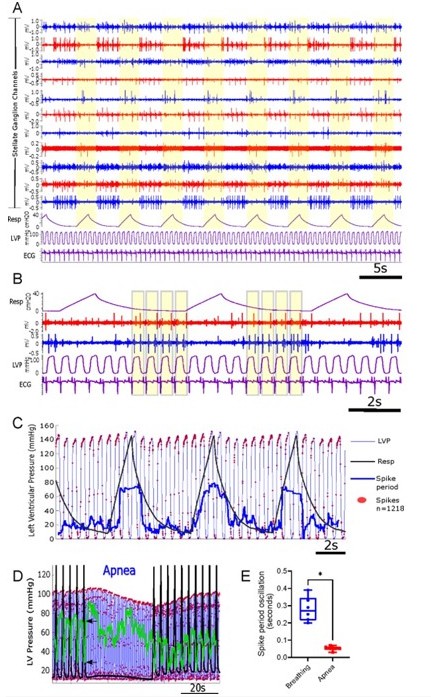
Cardiopulmonary integration is reflected in stellate ganglion neural activity [Sudarshan et al.2021].
(A-B): Representative recordings from several electrodes (blue and red tracings) using the 16channel linear array, along with respiration (Resp), left ventricular pressure (LVP), and the electrocardiogram (ECG) in purple tracings. Yellow bars highlight respiration (panel A) and the cardiac cycle (panel B). Activity in the blue and red channels are locked to cardiac and/or pulmonary. (C): Stellate ganglion (SG) neuron activity (red dots are individual spikes) shows increased firing rate at peak and near-peak LV pressures, however firing is inhibited during respiration, as reflected by increased spike period (heavy blue line) mirroring inspiration and expiration. (D): Representative response of SG neural activity to apnea (60 seconds). Black trace is scaled up respiratory activity, and black arrows identify baseline peak and trough of the spike period (green trace). (E): Spike period oscillation (peak – trough values) while breathing at baseline, and over the same period in apnea. n=6, *p=0.016, two-tailed Wilcoxon rank sum test.
Videos
Appendix 1—animation 1
Entropy animation.
The Animation 1.gif file contains an animation of the building of the neural specificity metricwith respect to left ventricular pressure (LVP). Row 1: Computation of the neural specificity metric for different frames is shown in the form of 20 s moving windows on a 45-s segment of the LVP data. The LVP data are shown in blue tracings with the neural spikes represented as red dots. Row 2: Two normalized histograms for each of the moving windows are calculated and shown in the second row. The histogram of the LVP computed at spike times (neurally sample LVP) is on the left. The histogram of the LVP in the window (randomly sampled LVP) is on the right. Row 3: The computed histograms are then used to compute two matrices in the third row. The matrices contain all the corresponding histograms computed in the previous step arranged vertically with a hard threshold of 0.5 applied, that is, histogram valuesgreater than 0.5 are set to 0.5 (colored yellow). Row 4: The two matrices computed in row 3 are subtracted to obtain the neural specificity metric shown in the fourth row. The color scheme is explained in Appendix 1—figure 4. Row 5: Entropy shown in the fifth row is obtained by calculating the Shannon entropy (such as depicted in Appendix 1—figure 4) for the subtracted histogram in each of the moving windows for the duration of the metric.
Additional files
Download links
A two-part list of links to download the article, or parts of the article, in various formats.
Downloads (link to download the article as PDF)
Open citations (links to open the citations from this article in various online reference manager services)
Cite this article (links to download the citations from this article in formats compatible with various reference manager tools)
Metrics of high cofluctuation and entropy to describe control of cardiac function in the stellate ganglion
eLife 11:e78520.
https://doi.org/10.7554/eLife.78520


