A critical role for heme synthesis and succinate in the regulation of pluripotent states transitions
- Laboratory of Biochemistry and Cell Biology (URBC), NAmur Research Institute for LIfe Sciences (NARILIS), University of Namur (UNamur), Namur, Belgium, Belgium
- Institute for Stem Cell and Regenerative Medicine, University of Washington, United States
- Department of Comparative Medicine, University of Washington, United States
Figures
Figure 1 with 1 supplement
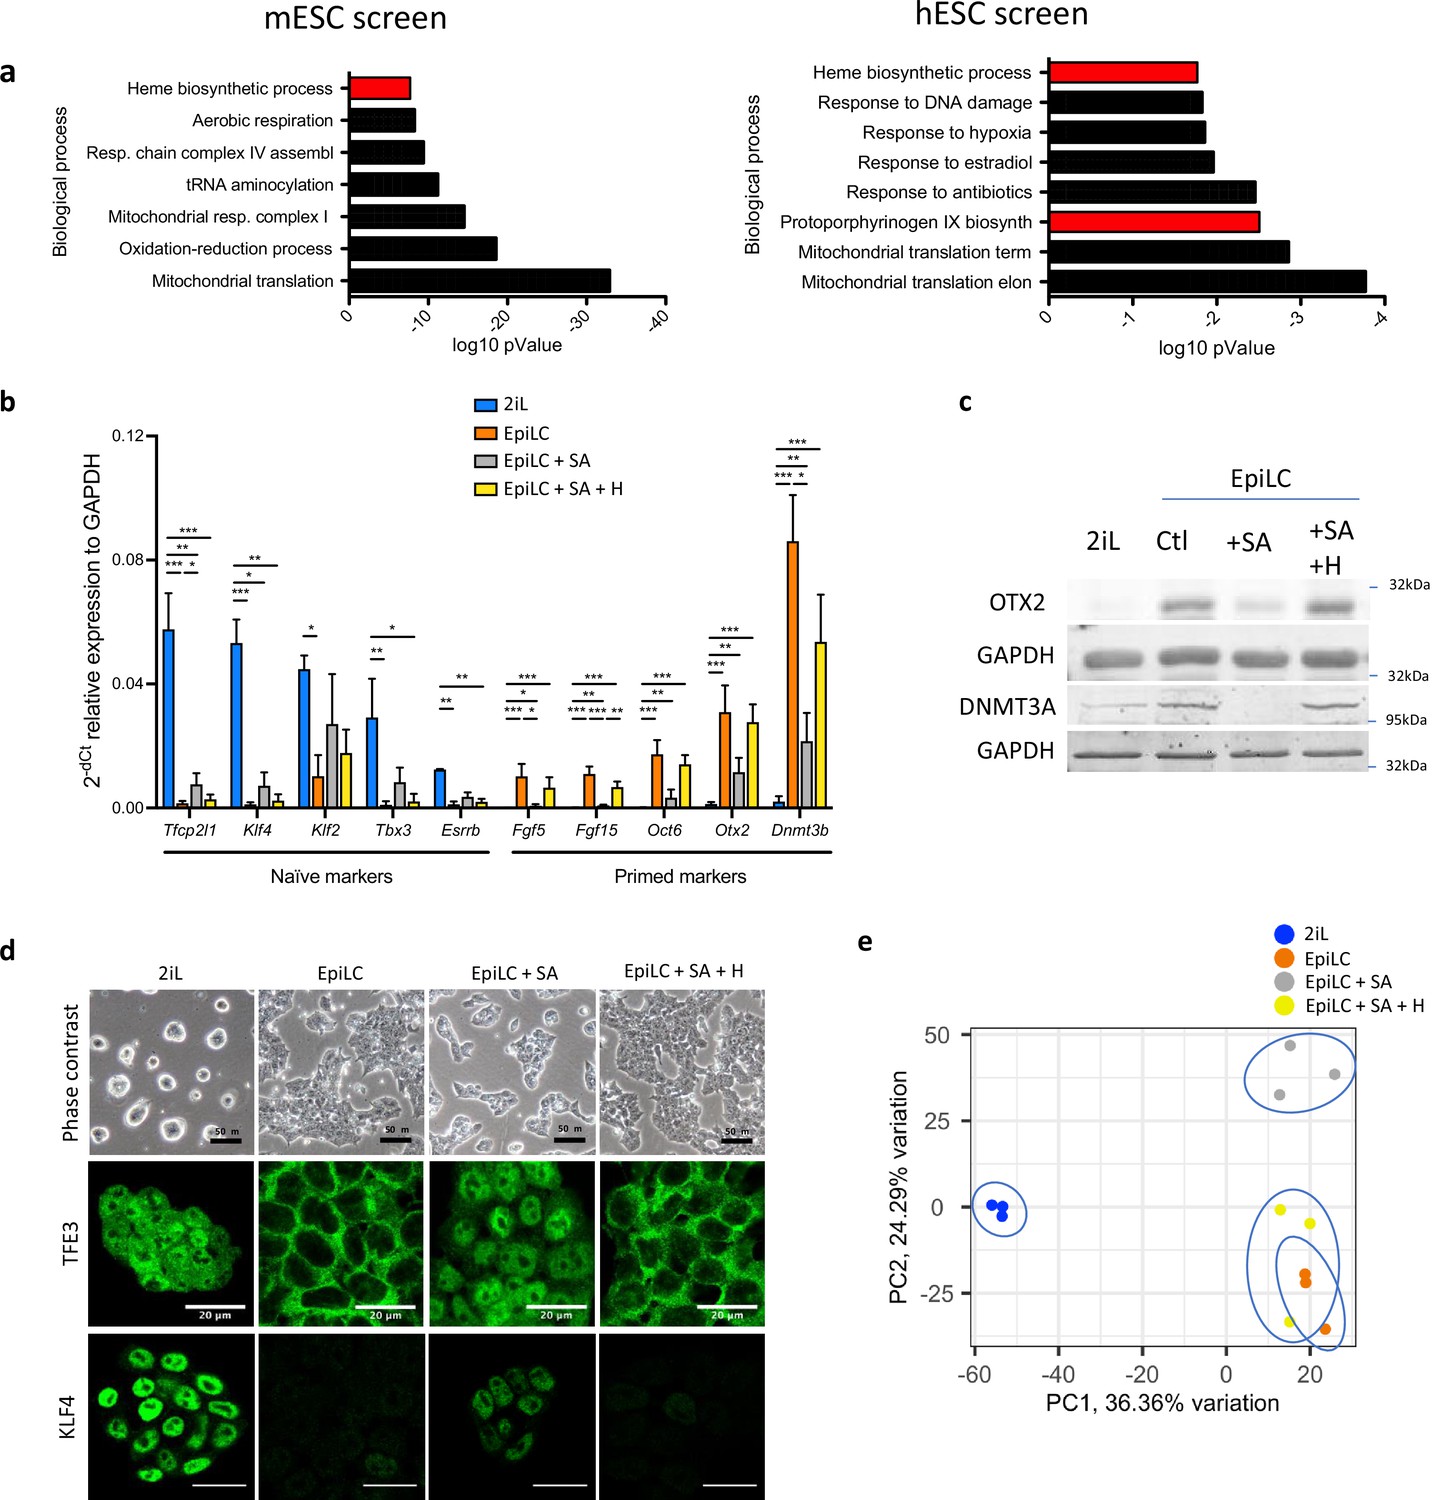
Heme synthesis inhibition impairs the exit of mESCs from the naïve state; effect mediated by heme.
(a) DAVID biological processes GO enrichment from two independent CRISPR-Cas9 screens for the naive state exit, in mouse (left panel) (Li et al., 2020) and in human (right panel) (Mathieu et al., 2019). The heme biosynthetic pathway is highlighted In red. (b) Relative expression of naïve and primed markers of mESCs in naïve conditions (2iL), in transition for 2 days to the Epi stage (EpiLC) with or without 0.5 mM succinylacetone as heme synthesis inhibitor (EpiLC +SA) and 10 µM hemin supplementation (EpiLC +SA + H), assessed by RT-qPCR relative to Gapdh expression (Tfcp2l1, transcription factor CP2-like 1; Esrrβ, estrogen-related receptor β; Klf2/4, Kruppel-like factor 2/4; Tbx3, T-Box Transcription Factor 3; Fgf5/15, fibroblast growth factor-5/15; Zic2, zic family member 2; Otx2, homeobox protein 2). Results expressed as mean +/-S.D. *p<0.05, **p<0.01, ***p<0.001. ANOVA-1. n=3 independent biological replicates. (c) Western blot analysis of the protein abundance of OTX2 and DNMT3A relative to GAPDH as a loading control for cells in naïve conditions (2iL), in transition for 2 days to the Epi stage (EpiLC) with 0.5 mM SA (+SA) and 10 µM hemin (+H) supplementation. Representative blot of three biological replicates. (d) Phase contrast micrographs of cells in naive (2iL), or in transition to the primed (EpiLC) state with treatment with SA and hemin (H). Scale bar = 50 μm. Confocal micrographs of mESCs in naive stage or in transition for TFE3 (Transcription Factor Binding To IGHM Enhancer 3) and KLF4, in green. Scale bar = 20 μm. TFE3 n=3 and KLF4 n=3 biological replicates (e) Principal component analysis (PCA) of the normalized RNAseq data transcripts.
-
Figure 1—source data 1
Raw uncropped and annotated western blot images for Figure 1c.
- https://cdn.elifesciences.org/articles/78546/elife-78546-fig1-data1-v2.zip
Figure 1—figure supplement 1
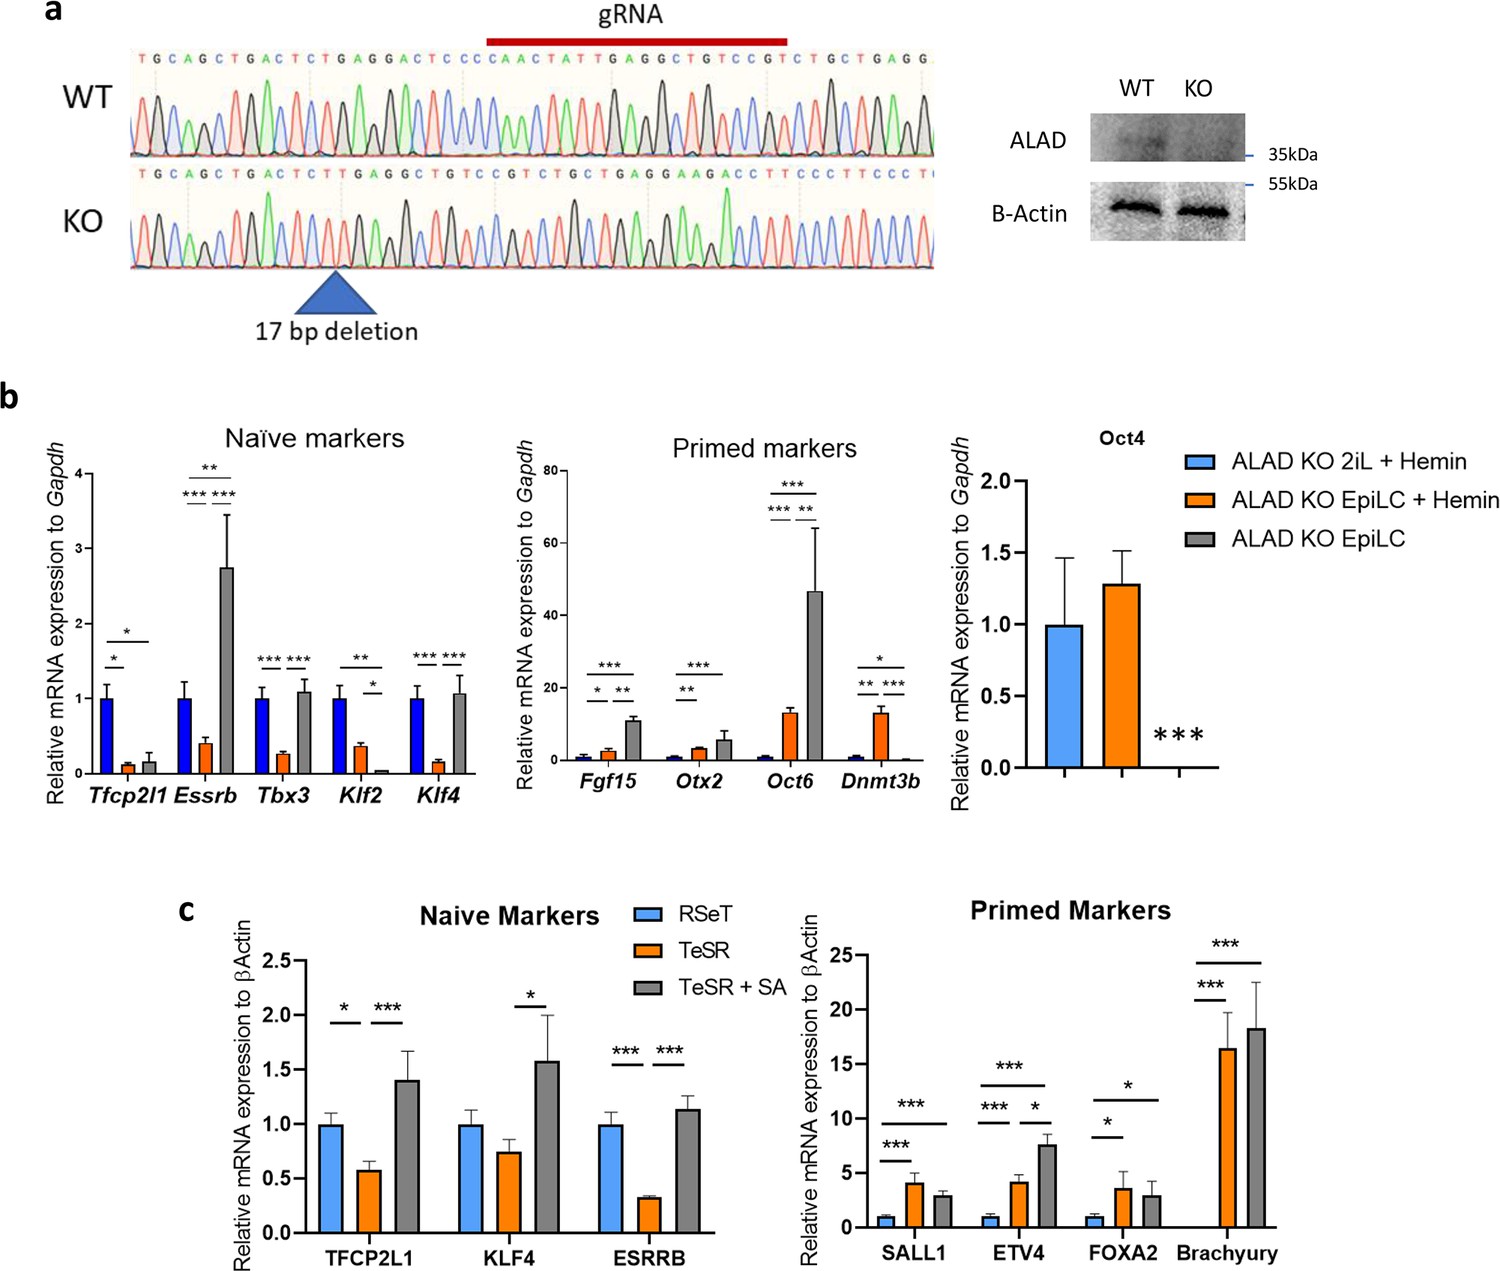
Heme synthesis inhibition perturbs the exit of the naïve state in mESCs and hESCs.
(a) Validation of the knock-out of ALAD in mESCs. Trace file of the sequencing of the guide region in WT and KO clone cells and western blot analysis of the ALAD protein abundance. (b) Relative expression of naïve and primed markers of ALAD KO mESCs in naïve conditions (2iL +hemin), in transition for 2 days to the EpiLC stage (EpiLC +hemin) or EpiLC without hemin to reveal the ALAD KO phenotype, assessed by RT-qPCR relative to Gapdh expression. Data shown as mean +/-S.D. *p<0.05, **p<0.01, ***p<0.001. ANOVA-1. n=3 independent biological replicates. (c) Relative expression of naïve (TFCP2L1; KLF4 and ESRRB) and primed (SALL1, ETV4, FOXA2, T-Brachyury) markers of hESCs (Elf1 cell line) assessed by RT-qPCR relative to β-Actin expression and normalized to RSeT naive control, during the 4 days transition in TeSR media with or without 0.5 mM of SA. n=3 independent biological replicates. Results expressed as mean +/-S.D. * p<0.05, **p<0.01, ***p<0.001; ANOVA-1.
-
Figure 1—figure supplement 1—source data 1
Raw uncropped and annotated western blot images for Figure 1—figure supplement 1c.
- https://cdn.elifesciences.org/articles/78546/elife-78546-fig1-figsupp1-data1-v2.zip
Figure 2 with 1 supplement
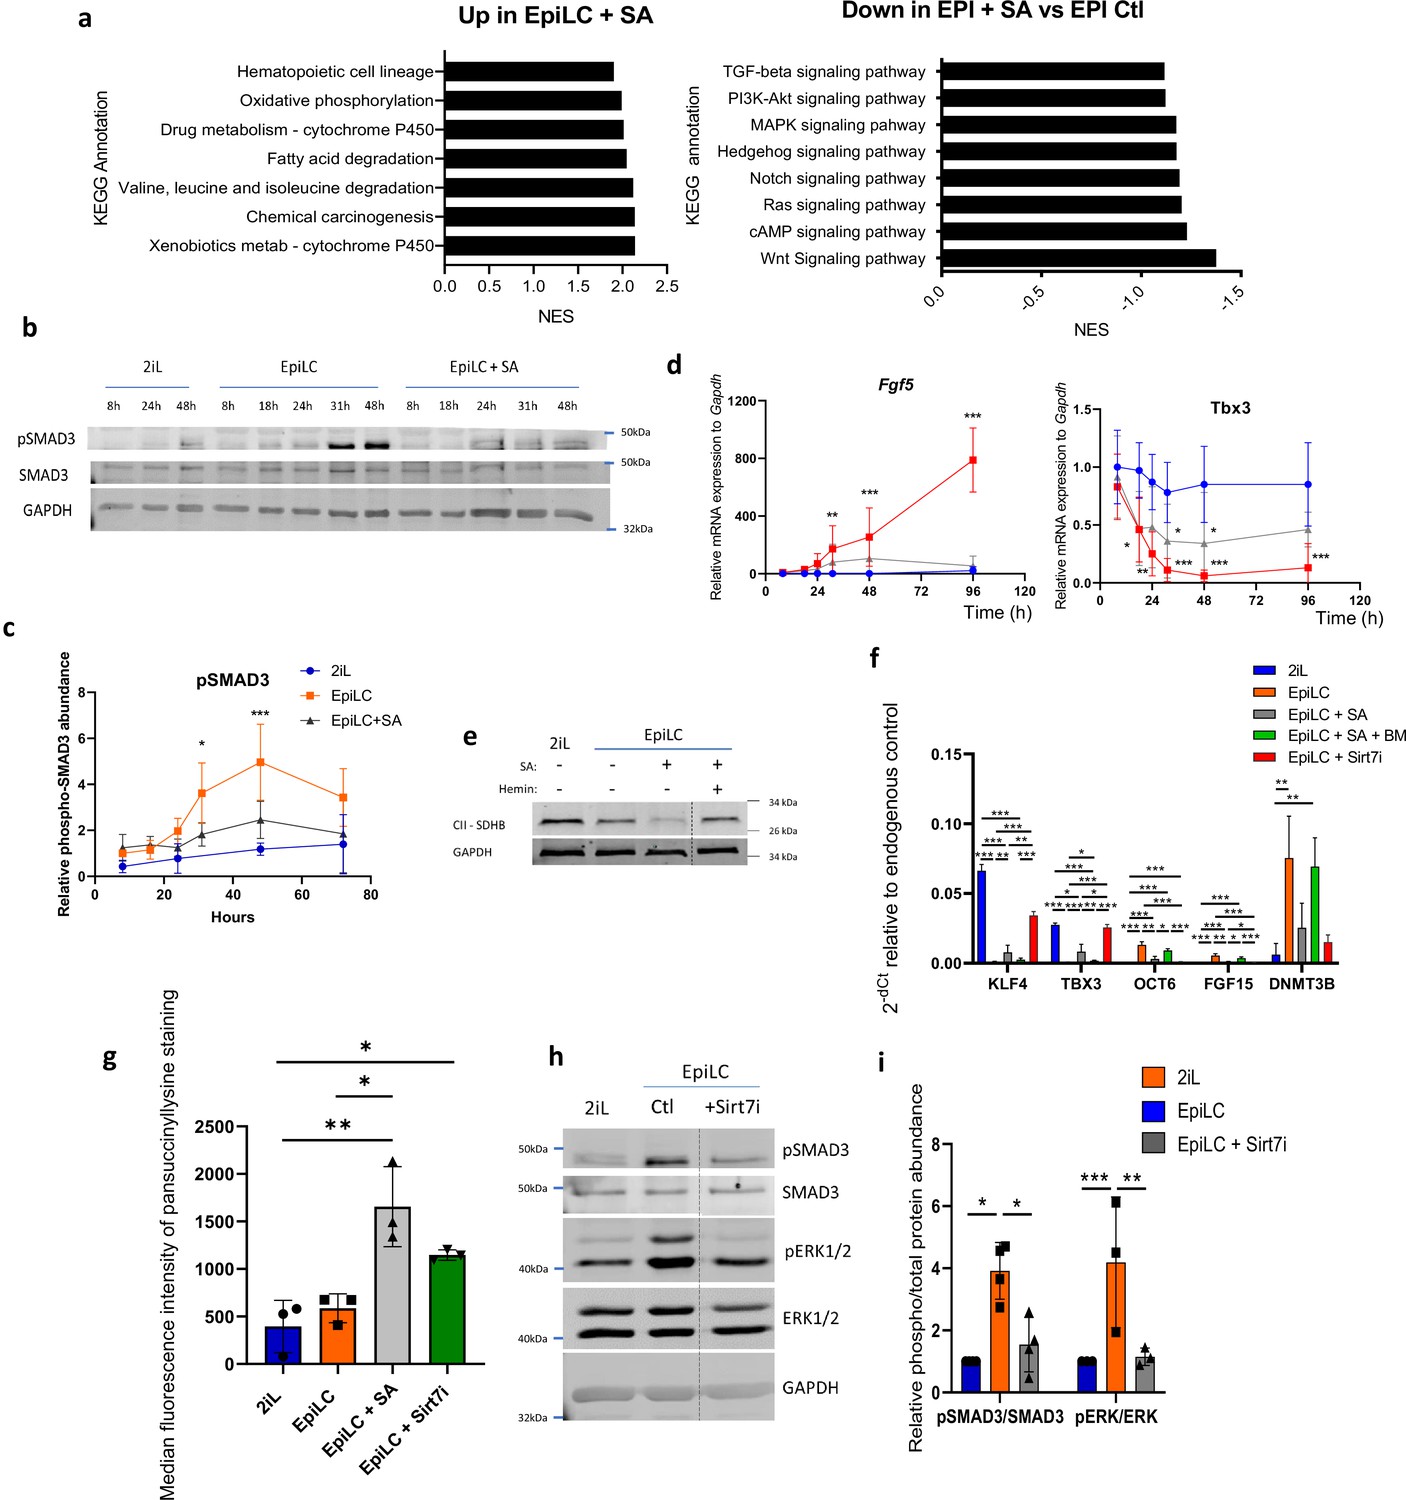
SA prevents the activation of the MAPK and Activin A-SMAD pathways during the mESC transition through the cytosolic accumulation of succinate.
(a) GSEA performed on RNAseq data were analyzed for KEGG pathways. Up- and Down-regulated KEGG pathways in EpiLC + SA versus EpiLC Ctl, represented as normalized enrichment scores (NES). (b) Western blot analysis of the time course protein abundance of SMAD3 and phospho-SMAD3 relative to GAPDH as a loading control for cells in naïve conditions (2iL), in transition for up to 2 days to the Epi stage (EpiLC) with 0.5 mM SA as heme synthesis inhibitor. Representative blot of 5 biological replicates, and quantified in (c). (d) Time course gene expression analysis of Fgf5 and Tbx3 assessed by RT-qPCR, expressed as mean +/-S.D. ANOVA-2. n=5 independent biological replicates. (e) Western blot analysis of SDHB during the transition, relative to GAPDH as loading control. Representative blot of 2 biological replicates. (f) Relative expression of naïve and primed markers of mESCs in naïve conditions (2iL), in transition for 2 days to the Epi stage (EpiLC) with or without 0.5 mM SA (EpiLC + SA), 1 µM butylmalonate (+BM) or 5 µM of Sirt7 inhibitor supplementation, assessed by RT-qPCR relative to Gapdh expression. n=3 independent biological replicates. ANOVA1 (g) Median fluorescence intensity of succinyllysine residues measured by flow cytometry for mESC in transition with 5 µM Sirt7 inhibitor (Sirt7i). n=3 independent biological replicates, ANOVA1. (h) Representative western blot analysis of the abundance of the total and phosphorylated forms of SMAD3 and ERK1/2, using GAPDH as loading control, for mESC in transition with a Sirt7 inhibitor (Sirt7i), and quantified in (i).
-
Figure 2—source data 1
Raw uncropped and annotated western blot images for Figure 2b.
- https://cdn.elifesciences.org/articles/78546/elife-78546-fig2-data1-v2.zip
-
Figure 2—source data 2
Raw uncropped and annotated western blot images for Figure 2e.
- https://cdn.elifesciences.org/articles/78546/elife-78546-fig2-data2-v2.zip
-
Figure 2—source data 3
Raw uncropped and annotated western blot images for Figure 2h.
- https://cdn.elifesciences.org/articles/78546/elife-78546-fig2-data3-v2.zip
Figure 2—figure supplement 1

SA prevents the activation of the MAPK and Activin A-SMAD pathways during the mESC transition.
(a) Representative Confocal micrographs of mESCs in naïve stage (2iL) or in transition (EpiLC) for BACH1. Dapi as a nuclear counterstain. Scale bar = 20 µm. (b) Western blot analysis of the protein abundance of phospho-eukaryotic translation initiation factor 2α (EIF2α) relative to GAPDH as a loading control for cells in naïve conditions (2iL), in transition for 2 days (EpiLC) with 0.5 mM SA (+SA) and 10 µM hemin (SA +H) supplementation. (c) Representative western blot of SunSET analysis (puromycin incorporation assay) and quantification of puromycin-labelled protein abundance relative to histone 3 (H3) as a loading control. Cells were exposed 10 minutes to 10 μg/ml of puromycin. Data presented as mean intensity +/-S.d. One-way ANOVA. n=3 independent biological replicates. (d) SunSET of mESCs cultured in 2iL and exposed or not to 0.5 mM of succinylacetone (SA) or to 0.5, 2 or 5 μM of BTdCPU for 2 days. (e) Relative expression of naïve and primed markers by RT-qPCR relative to Gapdh expression in mESCs grown in naïve conditions (2iL), in transition for 2 days (EpiLC) with 0.5 mM SA (+SA) or 2 µM BTdCPU. S.d *p<0.05, **p<0.01, ***p<0.001. One-way ANOVA. n=3 independent biological replicates. (f) Relevant PC loadings. Genes contributing to principal components separating naïve 2iL, EpiLC with or without SA and hemin during the exit. (g) Western blot analysis and quantification of the protein abundance of ERK1/2 and phospho-ERK1/2 (Thr202/Tyr204) relative to GAPDH as a loading control for cells in naïve conditions (2iL), in transition for 2 days to the Epi stage (EpiLC) with 0.5 mM SA, 10 µM hemin (H) supplementation and/or 1 µM MEK inhibitor (PD0325901; MEKi). Representative blot of three biological replicates. (h) Confocal analysis of the immunostaining of SMAD2/3 (green) in cells in naïve conditions (2iL), in transition to the Epi stage (EpiLC) with SA, hemin (H) supplementation or a SMAD3 inhibitor (SIS3, 5 µM), representative of three independent experiments. (i) Relative expression of naïve and primed markers of mESCs in naïve (2iL), in transition (EpiLC) with or without SA 0.5 mM, Hemin 10 µM, SIS3 5 µM, MEKi 1 µM (PD0325901), or with FGF2 and Activin A supplementation (j) assessed by RT-qPCR relative to Gapdh expression. Data shown as mean +/-S.D. n=3 independent biological replicates. ANOVA1.
-
Figure 2—figure supplement 1—source data 1
Raw uncropped and annotated western blot images for Figure 2—figure supplement 1b.
- https://cdn.elifesciences.org/articles/78546/elife-78546-fig2-figsupp1-data1-v2.zip
-
Figure 2—figure supplement 1—source data 2
Raw uncropped and annotated western blot images for Figure 2—figure supplement 1c.
- https://cdn.elifesciences.org/articles/78546/elife-78546-fig2-figsupp1-data2-v2.zip
-
Figure 2—figure supplement 1—source data 3
Raw uncropped and annotated western blot images for Figure 2—figure supplement 1d.
- https://cdn.elifesciences.org/articles/78546/elife-78546-fig2-figsupp1-data3-v2.zip
-
Figure 2—figure supplement 1—source data 4
Raw uncropped and annotated western blot images for Figure 2—figure supplement 1g.
- https://cdn.elifesciences.org/articles/78546/elife-78546-fig2-figsupp1-data4-v2.zip
Figure 3
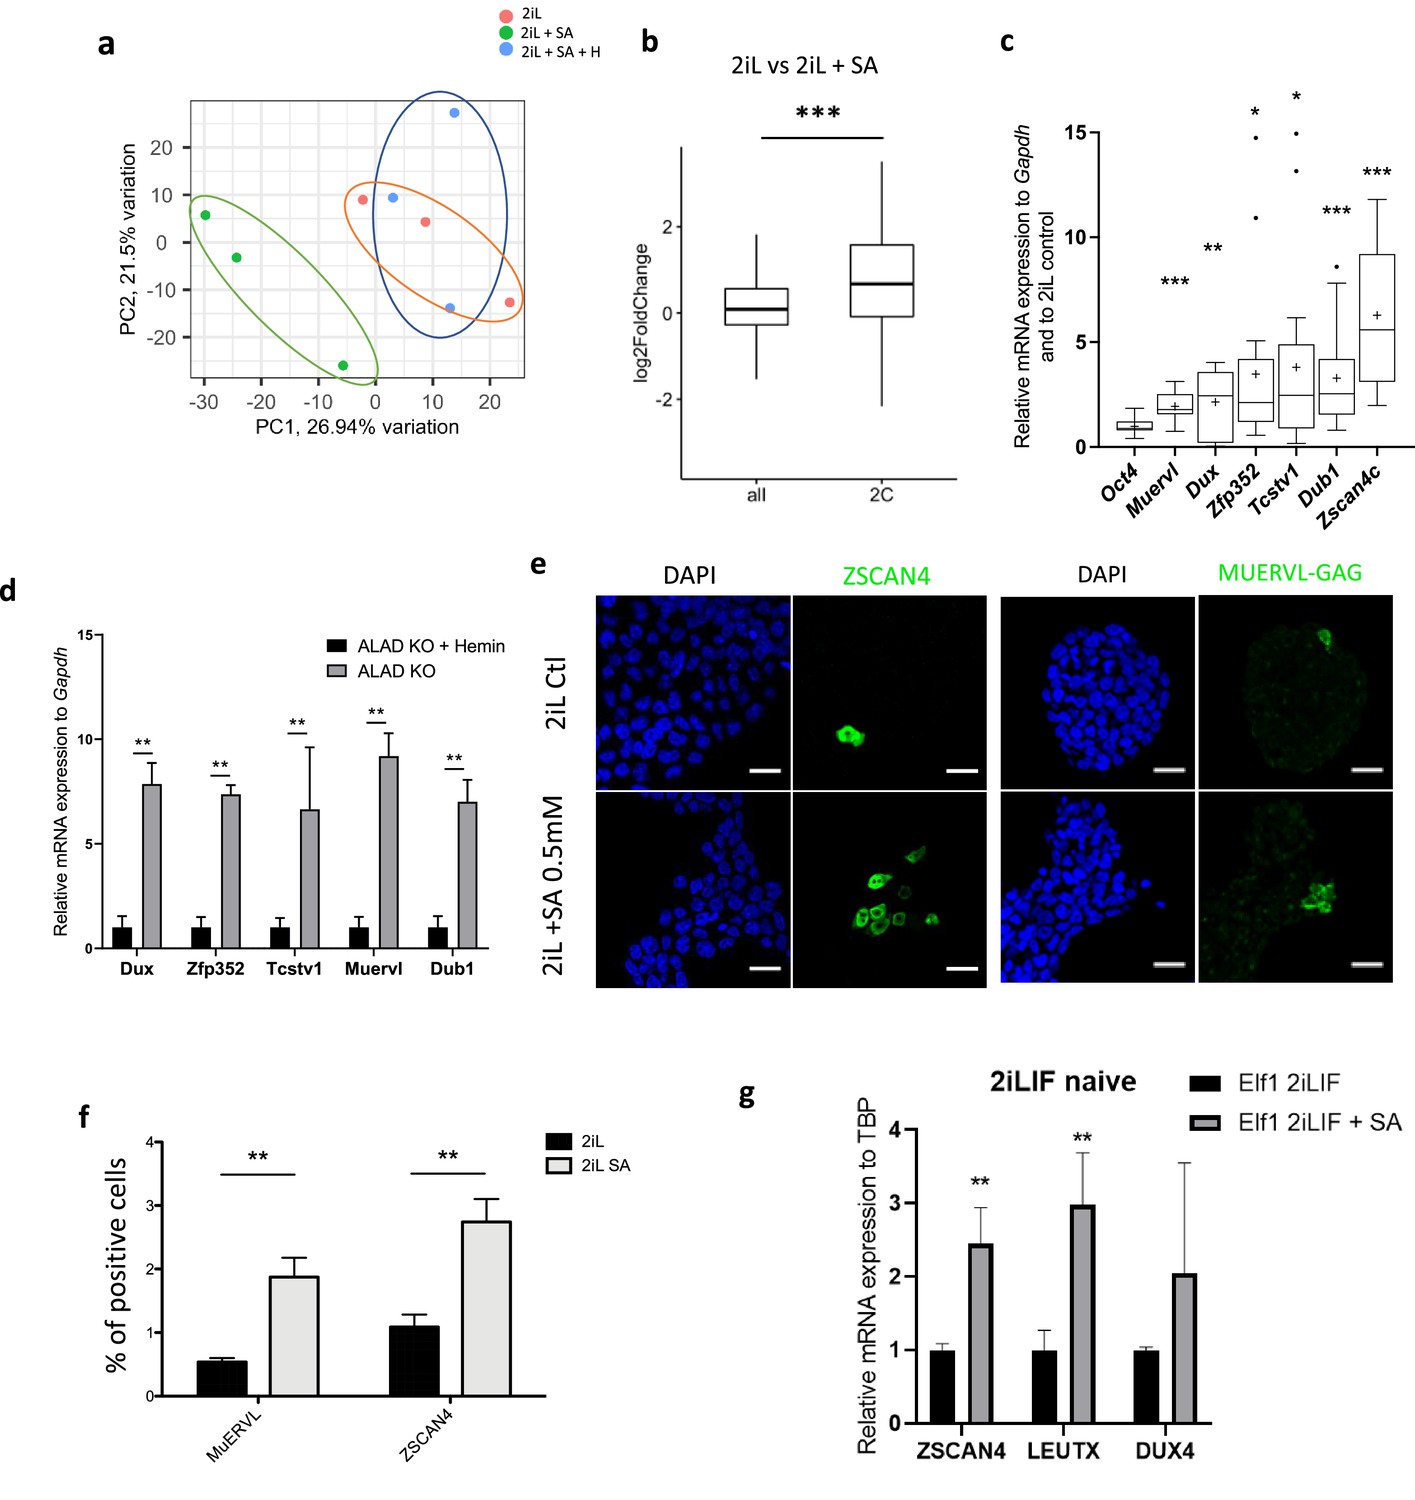
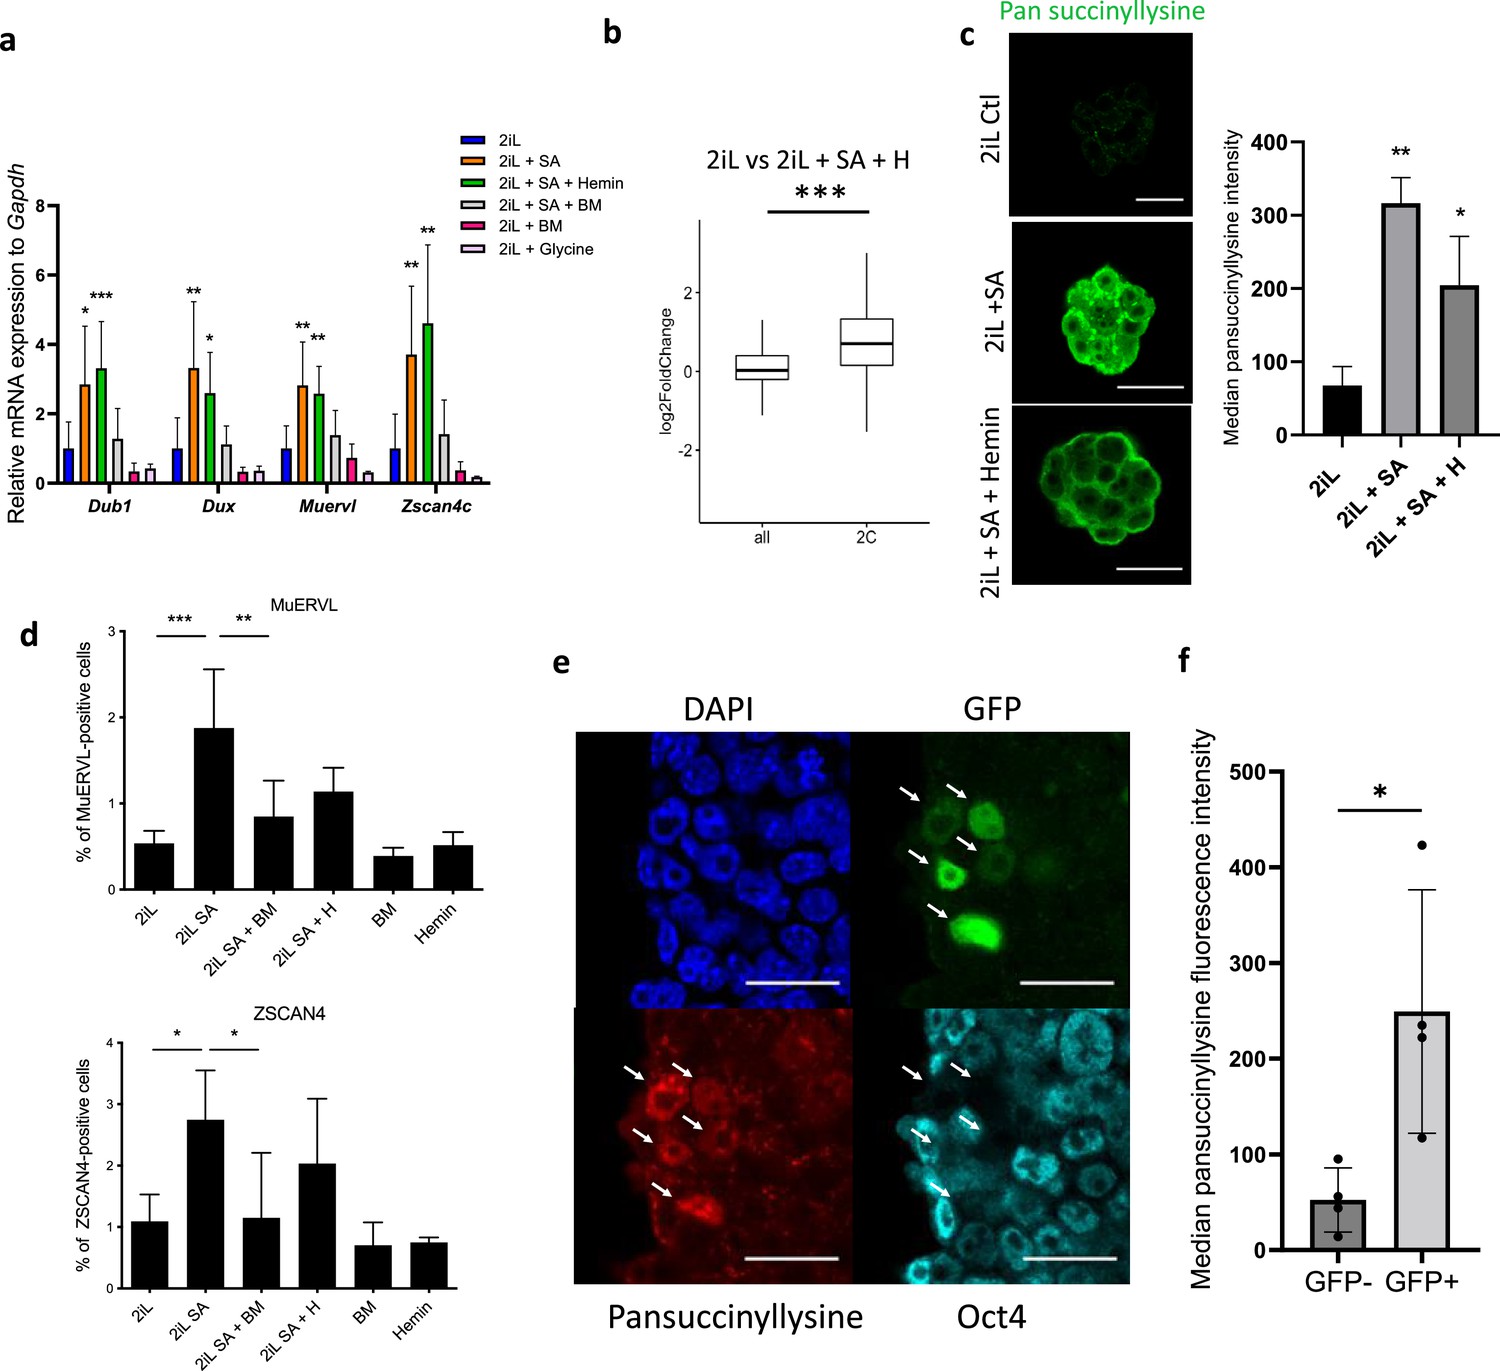
Heme synthesis inhibition pushes mESCs toward a 2C-like stage.
(a) Principal component analysis (PCA) of the normalized RNAseq data transcripts of naïve mESCs (2iL) treated for 48 hr with 0.5 mM SA ± 10 μM Hemin. (b) Boxplot of mean Log2FC of 2 C markers defined in Macfarlan et al., 2012 or all analyzed mRNAs in 2iL +SA versus 2iL control cells. Statistical significance is calculated by Student T-test. p<0.001. (c) Relative expression of 2 C gene markers of mESCs assessed by RT-qPCR relative to Gapdh expression and to 2iL naive control represented as a Tukey box and whisker plot. The line represents the median and the +is the mean. Oct4=octamer-binding transcription factor 4, Muervl = murine endogenous retrovirus-like, Dux = double homeobox, Zfp352=Zinc-finger protein 352, Tcstv1=2-cell-stage variable group member 1, Dub1=Ubiquitin Specific Peptidase 36, Zscan4c=Zinc Finger And SCAN Domain Containing 4, isoform c. n=9. (d) Gene expression analysis of 2CLC markers of ALAD KO mESCs grown for 2 days with or without 10 µM Hemin, assessed by RT-qPCR. n=3 biological replicates. ANOVA1 (e) Immunostaining of ZSCAN4 or MUERVL-GAG in untreated naive cells (2iL control) or treated with SA at 0.5 mM. DAPI is used as a nuclear counterstain. Scale bar = 20 μm. (f) Percentage of MUERVL- or ZSCAN4-positive cells in the whole population of naïve (2iL) mESCs or naïve treated or not with SA (2iL SA), counted from confocal micrographs as in (f) with 10 images per condition for at least 1000 cells per condition. n=4 independent biological replicates. Results expressed as mean +/-S.D. ** p<0.01; T-Tests. (g) Relative expression of ZGA related genes in hESCs assessed by RT-qPCR relative to TBP expression and normalized to naive 2iL +IGF + FGF2 (2iLIF) control, with or without 0.5 mM of SA. n=3 independent biological replicates. Results expressed as mean +/-S.D. * p<0.05, **p<0.01, ***p<0.001; t-tests.
Figure 4 with 1 supplement
mESC ‘2C-like’ reprogramming by SA is due to extramitochondrial succinate accumulation.
(a) Relative expression of 2 C markers of mESCs assessed by RT-qPCR relative to Gapdh expression and normalized to 2iL naive control, in mESCs treated for 2 days with 0.5 mM SA (2iL SA), with or without 10 μM Hemin (2iL SA + H), 1 μM diethyl butylmalonate (2iL SA + BM), 1 μM BM alone (BM) or 10 mM glycine. S.D. * p<0.05, **p<0.01, ***p<0.001. ANOVA-1. n=3–6 independent biological replicates. (b) Boxplot of mean Log2FC of 2 C markers defined in Macfarlan et al., 2012 or all analyzed mRNAs in 2iL + SA + H versus 2iL control cells. Statistical significance is calculated by Student T-test. p<0.001. (c) Immunostaining of succinylated lysine residues (green) in mESCs treated for 2 days with 0.5 mM SA, with or without 10 μM Hemin (SA + Hemin) and quantified by flow cytometry. Representative image of n=3 independent experiments. Scale bar = 20 μm. Results expressed as median fluorescence +/-S.D. * p<0.05, **p<0.01; ANOVA-1 (d) Percentage of MUERVL or ZSCAN4-positive cells in the whole population of naïve (2iL) mESCs or naive cells treated for 2 days with SA (2iL SA) with or without 10 μM hemin (2iL SA + H) or 1 μM diethyl butylmalonate (2iL SA + BM). n=4 independent biological replicates. Results expressed as mean +/-S.D. * p<0.05, **p<0.01, ***p<0.001; ANOVA-1. (e) Immunostaining of succinyllysine residues (Red) and Oct4 (cyan) of TBG4 cells (ES-E14TG2a mESCs with a 2C-GFP (green) reporter construct) (Mills et al., 2018). Representative image of n=3 independent experiments. Scale bar = 20 μm. Arrows indicate 2CLCs according to the GFP reporter. (f) Quantification of the median fluorescence intensity of the succinyllysine residues in the GFP +and GFP- populations of TBG4 mESCs separated by flow cytometry. n=4 independent biological replicates. * p<0.05, T-test.
Figure 4—figure supplement 1
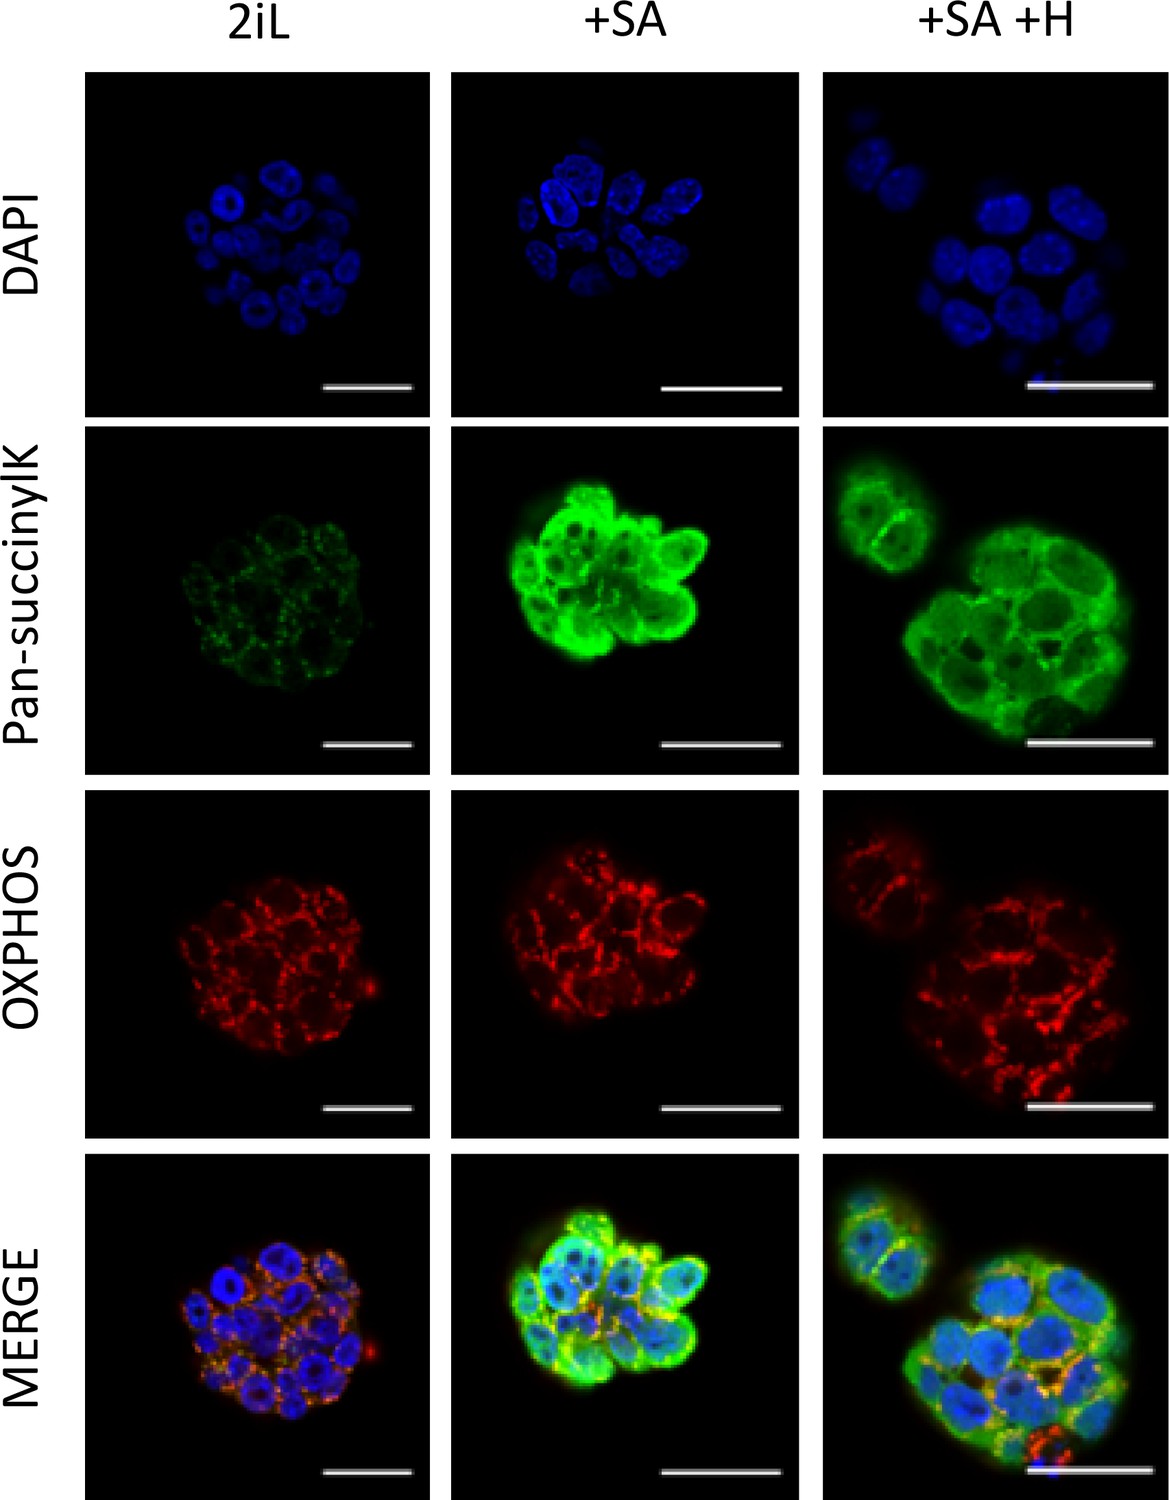
Treatment with SA induces a delocalization of succinyllysine-modified proteins outside of mitochondria.
Immunostaining of succinyllysine residues (green) and OXPHOS complexes (red) in mESCs 2iL naïve control, in mESCs treated with 0.5 mM SA (+SA), with or without 10 μM Hemin (+SA + H). DAPI is used as nuclear counterstain. Representative images of n=3 independent experiments. Scale bar = 20 μm.
Figure 5 with 2 supplements
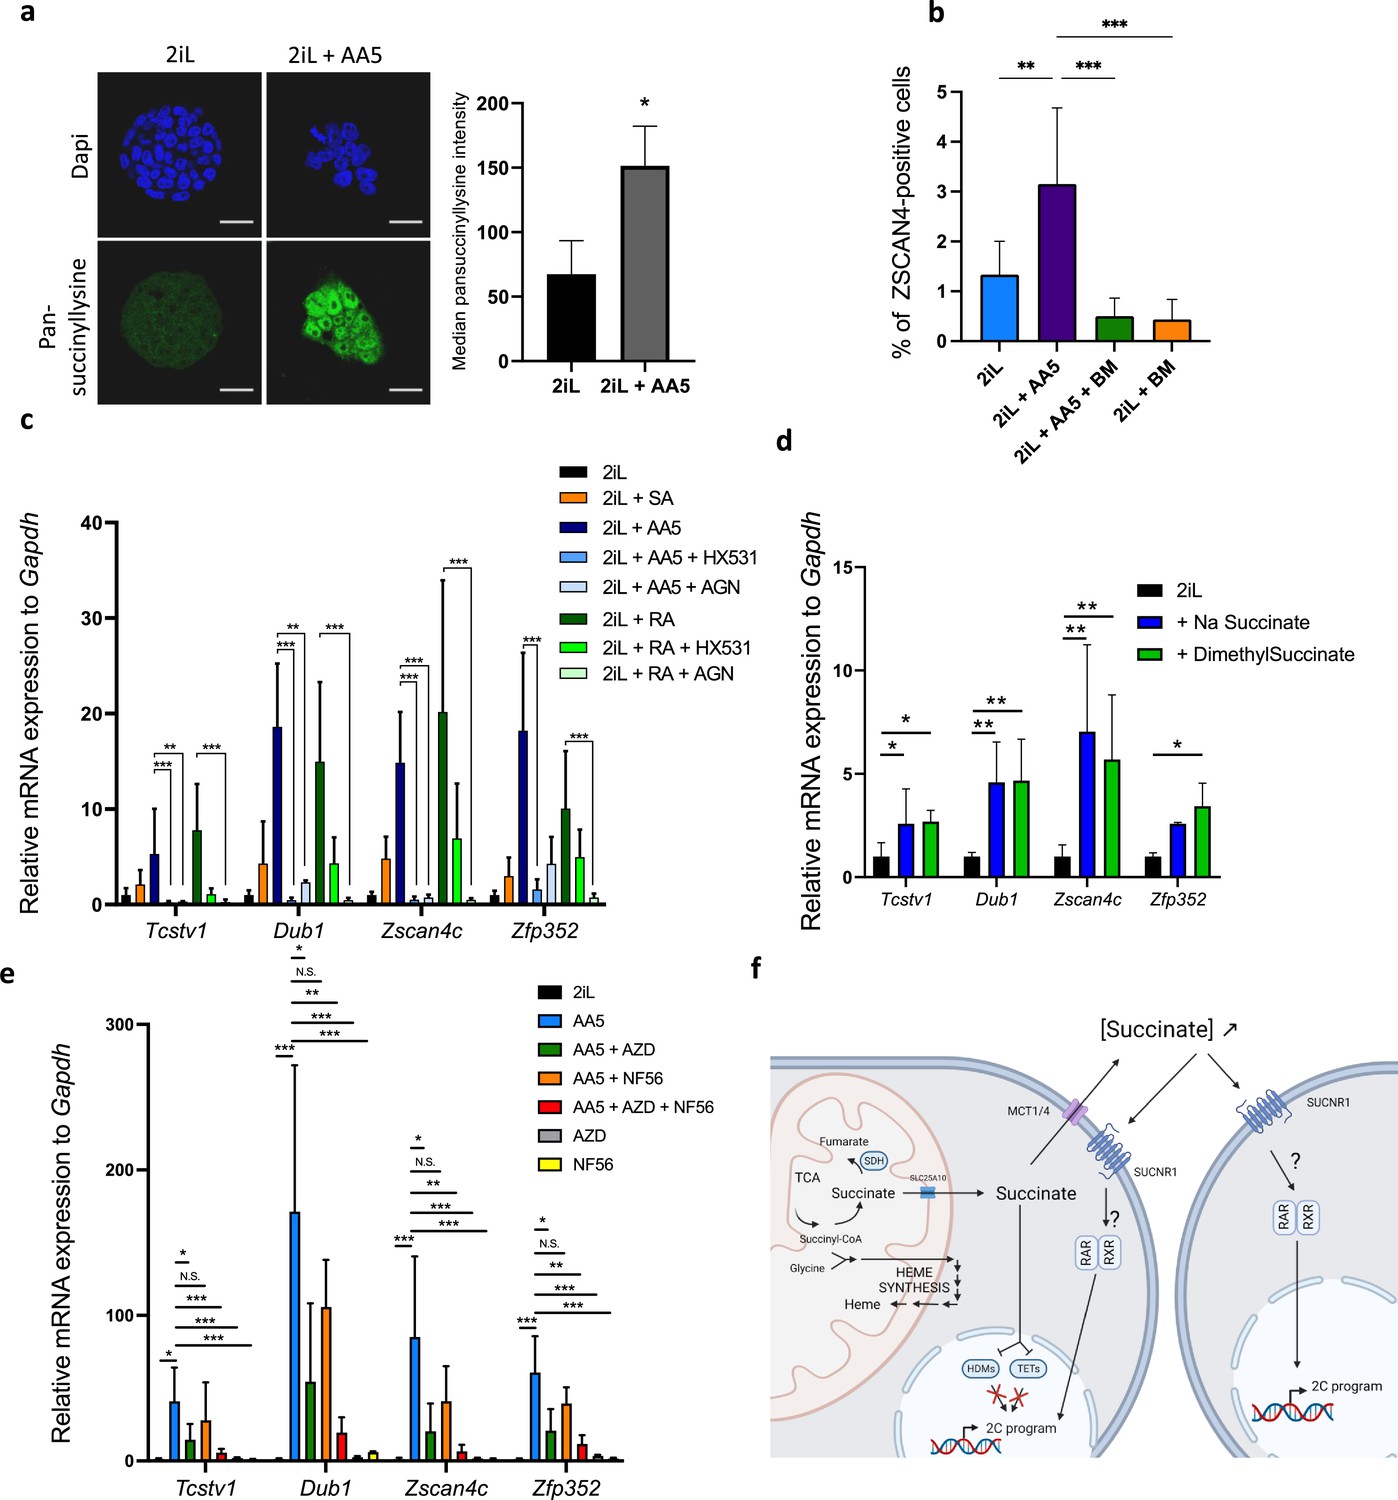
Inhibition of SDH leading to an increase in succinate accumulation recapitulates the increase in 2CLCs due to a leakage to the extracellular space.
(a) Immunostaining of succinylated lysine residues (green) in mESCs in 2iL media or treated with 250 nM AA5. Representative image of n=3 independent experiments and quantified by flow cytometry. T-test. Scale bar = 20 μm (b) Percentage of ZSCAN4-positive cells in the whole population of naïve (2iL) mESCs or naïve treated with 250 nM AA5, with or without 1 μM diethyl butylmalonate (BM), counted from confocal micrographs with 10 images per conditions for at least 1000 cells per condition. n=3 independent biological replicates. ANOVA1 (c) Relative expression of the 2CLC genes in response to 250 nM AA5 or 0.5 µM retinoic acid (RA), with or without 10 µM HX531 and 100 nM AGN193109. (d-e) Relative expression of 2C-gene markers of mESCs assessed by RT-qPCR relative to Gapdh expression in naïve 2iL mESCs and treated with 16 mM dimethyl succinate, 40 mM sodium succinate (Na succinate), 1 μM of MCT1 and 4 inhibitor (AZD3965; AZD) and 1 μM SUCNR1 receptor antagonist (NF-56-EJ40; NF56). Data shown as mean +/-S.D. *p<0.05, **p<0.01, ***p<0.001. ANOVA-1 followed by a Tukey post-test. n=4 independent biological replicates. (f) Graphical representation of the succinate-induced 2CLC reprogramming. Created with https://www.biorender.com/.
Figure 5—figure supplement 1

Treatment with SA or AA5 does not trigger HIF1α stabilization.
Immunostaining of HIF1α (green), OCT4 as stemness marker (red) and DAPI as nuclear counterstain in mESCs 2iL naive control, in mESCs treated with 100 μM of CoCl2 as positive control or 0.5 mM SA and 250 nM AA5. Representative images of n=3 independent experiments. Scale bar = 20 μm.
Figure 5—figure supplement 2
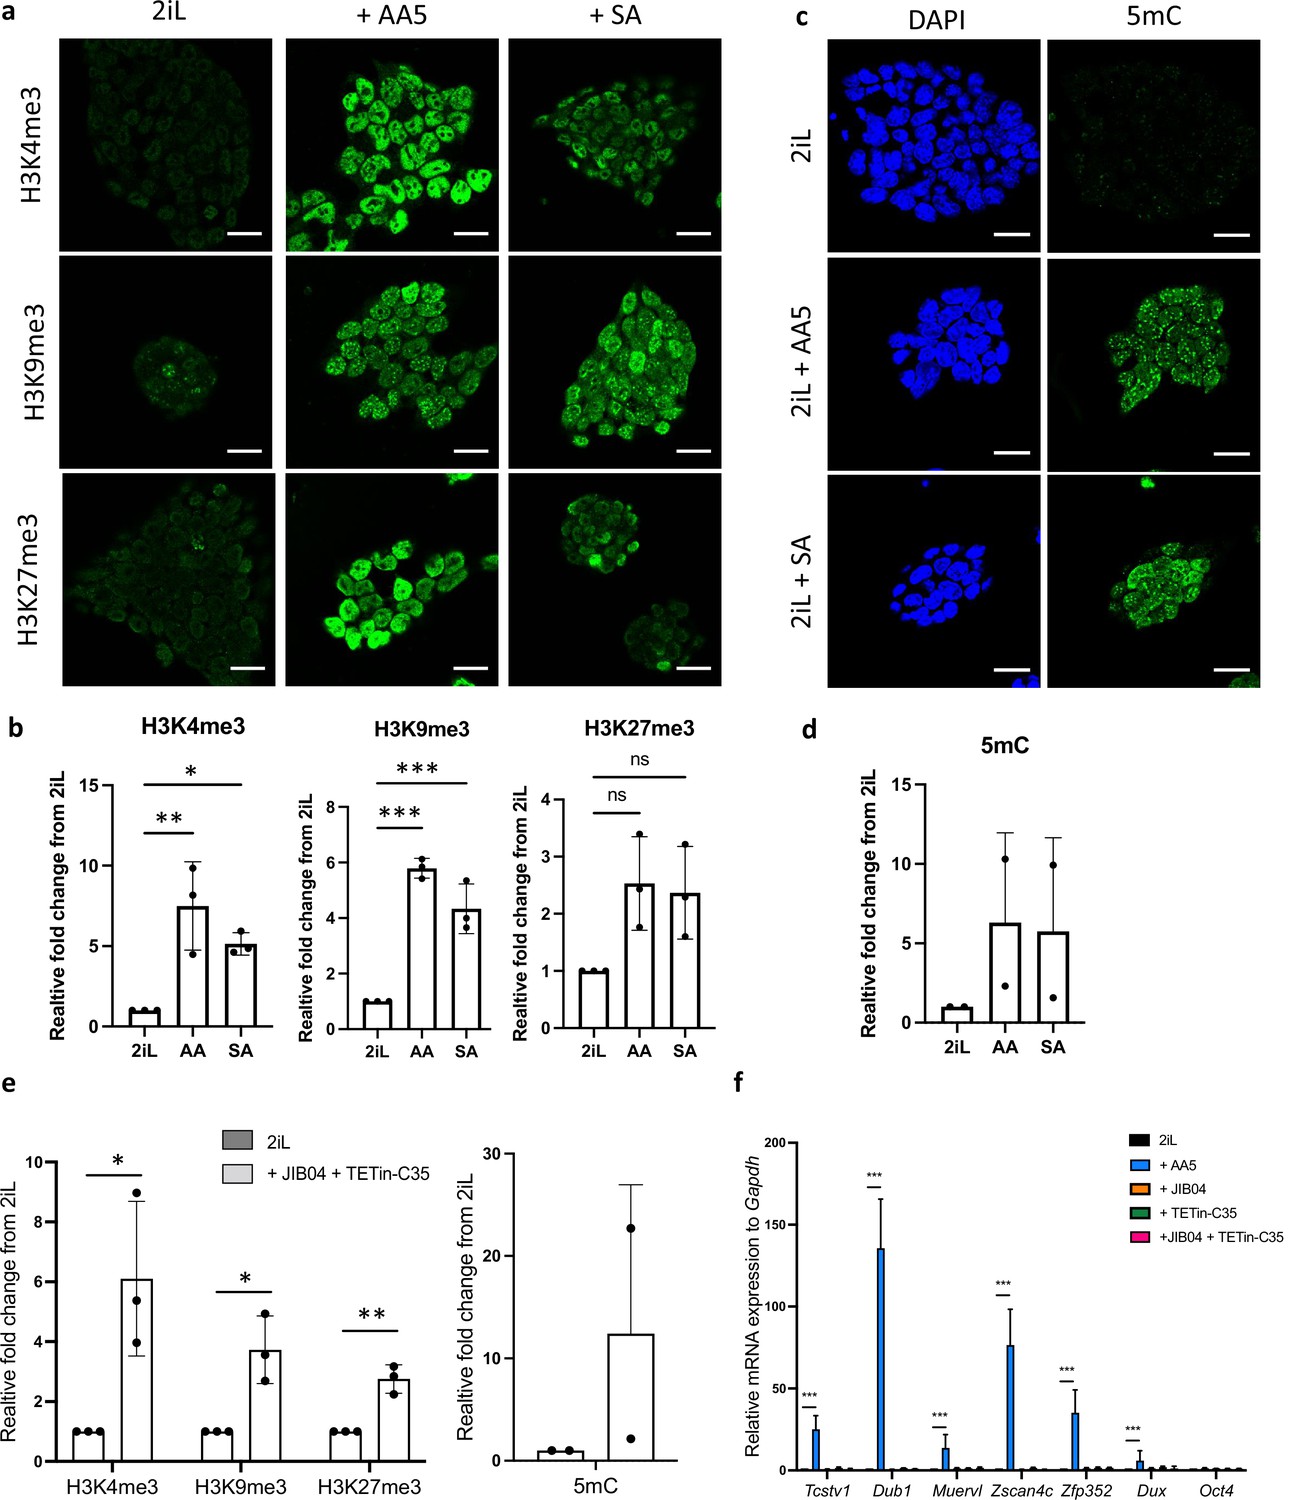
Treatment with SA or AA5 triggers an increase of the methylation of histones and DNA that does not cause a 2C-like reprogramming.
(a) Immunostaining of of trimethylated histone 3 (H3) residues (green) in mESCs 2iL naïve control, treated with 0.5 mM SA (+SA) or with 250 nM AA5 (+AA5). Scale bar = 20 μm. (b) Relative quantification of the methylated histone 3 fluorescent signal from confocal analysis. Data shown as mean +/-S.D. *p<0.05, **p<0.01, ***p<0.001. N.S. p>0.05 from ANOVA-1 analysis. n=3 independent biological replicates, with at least 200 cells per condition analyzed. (c) Immunostaining of of 5-methylcytosine (5mC; green) in mESCs 2iL naïve control, treated with 0.5 mM SA (+SA) or with 250 nM AA5 (+AA5). DAPI is used as nuclear counterstain. Scale bar = 20 μm. (d) Relative quantification of the 5mC fluorescent signal from confocal analysis. Data shown as mean +/-S.D. n=2 independent biological replicates. (e) Relative quantification of the trimethylated histone 3 (H3) residues signal from confocal analysis of naive 2iL mESC or treated with 250 nM JIB04 as a HDM inhibitor and 5 µM TETin-C35 as a TET DNA demethylase inhibitor. Data shown as mean +/-S.D. n=3 independent biological replicates. T-tests (f) Relative expression of 2 C gene markers of mESCs assessed by RT-qPCR relative to Gapdh expression. Data shown as mean +/-S.D. *p<0.05, **p<0.01, ***p<0.001. T-test (e) or ANOVA-1 (f). n=3 biological replicates.
Author response image 1

Effect of heme synthesis (SA) and SDH (AA5) inhibitors on mESC homeostasis.
(A) Cell survival analysis of mESCs in 2iL naïve control, in mESCs treated with 0.5 mM SA or 250 nM Atpenin A5 (AA5) for 2 days, assessed using calcein-AM and ethidium homodimer-1 (Invitrogen) in confocal microscopy, expressed as % of Calcein-AM-positive cells to the whole population and represented as means +/- S.D. N.S p>0.05, ANOVA1. n=3 biological independent replicates. (B) Cells cycle analysis of mESCs in 2iL naïve control, in mESCs treated with 0.5 mM SA or 250 nM Atpenin A5 (AA5) for 2 days and assessed using propidium iodide by flow cytometry and quantified with FLowJo software. n=3 biological independent replicates.
Author response image 2

Expression of trophoblast lineage markers after differentiation.
Relative mRNA expression of trophoblasts lineage markers of mESCs differentiated for 6 days after culture for 2 days in naïve 2iL control condition (blue) or with 0.5 mM SA (orange), or 250 nM AA5 (grey), assessed by RT-qPCR. Data shown as means +/- S.D. n=6 biological independent replicates.
Author response image 3

Inhibitors of pentose phosphate pathway and fatty acid oxidation do not trigger a 2CLC signature.
Relative expression of 2C markers of mESCs assessed by RT-qPCR relative to Gapdh expression and normalized to expression level of 2iL naïve control, in mESCs treated with 50 µM Etomoxir or 50 µM 6-aminonicotinamide for 48 h. n=3 independent biological replicates.
Author response image 4

Heme synthesis inhibition in naïve hESCs triggers a ZGA gene signature.
Relative expression of ZGA related genes in hESCs assessed by RT-qPCR relative to TBP expression and normalized to naïve control, with or without 0.5 mM of SA. n=3 independent biological replicates. Results expressed as means +/- S.D. * p < 0.05, **p < 0.01, ***p < 0.001 ; t-tests.
Author response image 5

Glycine supplementation does not trigger a 2CLC gene signature.
Relative expression of 2C gene markers of mESCs assessed by RT-qPCR relative to Gapdh expression and to 2iL naïve control, after supplementation with 10 mM of glycine for 48 h. n=3 independent replicates. Data shown as means +/-S.D. p>0.05, T-tests.
Author response image 6

Succinate accumulation induces a 2CLC gene signature in mESCs grown in FBS+LIF conditions.
Gene expression analysis of 2CLC genes of mESCs grown in a media with 15% FBS supplemented with LIF, with or without addition of 250nM atpenin A5 and 10µM butylmalonate, assessed by RT-qPCR relative to Gapdh expression and to FBS/LIF control. Results expressed as mean +/- S.D. *p<0.05, **p < 0.01, ***p < 0.001. ANOVA-1. n=3 independent biological replicates.
Tables
Table 1
Relative expression of heme synthesis enzymes.
(a) Fold change expression of the 8 enzymes of the heme synthesis pathway, based on normalized data from bulk RNAseq or proteomics analysis, extracted from published datasets. (b) Normalized gene expression counts of heme synthesis enzymes from in vivo mouse blastocysts analyzed by RNAseq.
| a | Human ESCs | Mouse ESCs | b | Mouse blastocysts | |||||||
|---|---|---|---|---|---|---|---|---|---|---|---|
| Source | Di Stephano et al. | Grow et al. | Sperber et al. | Nakamura et al. | This study | Nakamura et al. | |||||
| Type | Proteomics | Transcriptomics | Stage | E4.5 | E5.5 | E6.5 | |||||
| Enzyme | ALAS | 0,7 | 0,88 | 1,22 | 0,95 | 0,85 | 1,016 | Alas | 17 | 12 | 16 |
| ALAD | 0,47 | 0,29 | 0,81 | 0,96 | 0,54 | 0,92 | Alad | 40 | 22 | 33 | |
| HMBS | 1,43 | 0,84 | 1,22 | 1,27 | 1,15 | 0,81 | Hmbs | 73 | 65 | 60 | |
| UROD | 1,12 | 1,05 | 0,62 | 1,10 | 1,33 | 0,64 | Uros | 2,2 | 5,4 | 5,7 | |
| UROS | 2,09 | 1,58 | 0,78 | 1,12 | 0,50 | 0,75 | Urod | 43 | 53 | 80 | |
| CPOX | 1,24 | 2,07 | 1,02 | 1,25 | 1,12 | 0,87 | Cpox | 22 | 13 | 14 | |
| PPOX | 2,09 | 1,54 | 1,16 | 1,37 | 1,25 | 0,56 | Ppox | 14 | 7 | 7 | |
| FECH | 0,98 | 1,10 | 1,28 | 0,77 | 1,06 | 1,30 | Fech | 8 | 26 | 28 | |
Table 2
List of primers used in qPCR.
| Gene | Sequences (5’ → 3’) |
|---|---|
| Mouse | |
| DNMT3A | F: CTGCTGTGGAATACCCTGTTAG R: CTTTCTACCTGCTGCCATACTC |
| ESRRB | F: GCACCTGGGCTCTAGTTGC R: TACAGTCCTCGTAGCTCTTGC |
| FGF5 | F: GGGATTGTAGGAATACGAGGAGTT R: CCAGAAGAATGGACGGTTGT |
| FGF15 | F: TGTTTCACCGCTCCTTCTTT R: TTCTCCATCCTGTCGGAATC |
| GAPDH | F: CATGGCCTTCCGTGTTCCT R: CCTGCTTCACCACCTTCTTG |
| KLF2 | F: CTAAAGGCGCATCTGCGTA R: TAGTGGCGGGTAAGCTCGT |
| KLF4 | F: CCAGCAAGTCAGCTTGTGAA R: GGGCATGTTCAAGTTGGATT |
| OCT4 | F: CACGAGTGGAAAGCAACTCA R: AGATGGTGGTCTGGCTGAAC |
| OTX2 | F: TATCTAAAGCAACCGCCTTACG R: AAGTCCATACCCGAAGTGGTC |
| REX1 | F: CCCTCGACAGACTGACCCTAA R: TCGGGGCTAATCTCACTTTCAT |
| TFCP2L1 | F: GCTGGAGAATCGGAAGCTAGG R: AAAACGACACGGATGATGCTC |
| ZIC2 | F: CAAGGTCCGGGTGCTTACC R: ATTAAAGGGAGGCCCCGAATA |
| TBX3 | F: CTCCATTCCAGTTTGGTCAA R: CAACAGCAGCCTGGTTACAC |
| OCT6 | F: TTTCTCAAGTGTCCCAAGCC R: ACCACCTCCTTCTCCAGTTG |
| DNMT3B | F: GGCAAGGACGACGTTTTGTG R: GTTGGACACGTCCGTGTAGTGAG |
| DUX | F: AAAGGAAGAGCATGTGCCAGC R: GCAGTAAGCTGTCCTGGGAAC |
| ZFP352 | F: AAGTCCCACATCTGAAGAAACAC R: GGGTATGAGGATTCACCCACA |
| TCSTV1 | F: TGAACCCTGATGCCTGCTAAGACT R: AGATGGCTGCAAAGACACAACTGC |
| ZSCAN4C | F: CCGGAGAAAGCAGTGAGGTGGA R: CGAAAATGCTAACAGTTGAT |
| MuERV-L | F: CCCATCATGAGCTGGGTACT R: CGTGCAGATCCATCAGTAAA |
| DUB1 | F: GCAGGCCAACCTCAAACAG R: CGCAGGGCTCTCCTAAATCTT |
| Human | |
| ZSCAN4 | F: TGGAAATCAAGTGGCAAAAA R: CTGCATGTGGACGTGGAC |
| LEUTX | F: GCTACAATGGGGAAACTGGR: CTCTTCCATTTGGCACGCTG |
| DUX4 | F: AGGAAGAATACCGGGCTCTG R: AGTCTCTCACCGGGCCTAG |
| TFCP2L1 | Hs01011666_m1 |
| KLF4 | F: GGGAGAAGACACTGCGTCA R: GGAAGCACTGGGGGAAGT |
| ESRRB | hs01584024_m1 |
| SALL1 | F: AGAGAACTCACACTGGAGAG R: CATGTGTACCTTAAGATTGCCT |
| ETV4 | F: CGACTCTGAAGATCTCTTCC R: TCATCACTGTCTGGTACCT |
Author response table 1
Overrepresentation analysis (ORA) of mESC screen.
Top 50 hit of the biological process gene ontology (GO) terms from the mouse CRISPR-Cas9 screen
GO:0140053
mitochondrial RNA metabolic process
| ID | Description | GeneRatio | BgRatio | pvalue | p.adjust |
|---|---|---|---|---|---|
| mitochondrial gene expression | 59/530 | 108/23355 | 2,1943E-68 | 8,1912E-65 | |
| GO:0032543 | mitochondrial translation | 50/530 | 76/23355 | 5,4613E-64 | 1,0194E-60 |
| GO:0033108 | mitochondrial respiratory chain complex assembly | 47/530 | 84/23355 | 2,9765E-55 | 3,7037E-52 |
| GO:0010257 | NADH dehydrogenase complex assembly | 37/530 | 49/23355 | 3,0091E-51 | 2,2466E-48 |
| GO:0032981 | mitochondrial respiratory chain complex I assembly | 37/530 | 49/23355 | 3,0091E-51 | 2,2466E-48 |
| GO:0007005 | mitochondrion organization | 79/530 | 489/23355 | 4,5039E-44 | 2,8022E-41 |
| GO:0006091 | generation of precursor metabolites and energy | 59/530 | 404/23355 | 1,7562E-30 | 9,3653E-28 |
| GO:0045333 | cellular respiration | 40/530 | 159/23355 | 2,1561E-30 | 1,0061E-27 |
| GO:0022900 | electron transport chain | 30/530 | 84/23355 | 3,6581E-28 | 1,5173E-25 |
| GO:0022904 | respiratory electron transport chain | 29/530 | 80/23355 | 1,7473E-27 | 6,5225E-25 |
| GO:0046034 | ATP metabolic process | 43/530 | 256/23355 | 6,2247E-25 | 2,1125E-22 |
| GO:0006119 | oxidative phosphorylation | 30/530 | 107/23355 | 1,3283E-24 | 4,1322E-22 |
| GO:0015980 | energy derivation by oxidation of organic compounds | 42/530 | 250/23355 | 2,222E-24 | 6,3806E-22 |
| GO:0042773 | ATP synthesis coupled electron transport | 24/530 | 62/23355 | 9,046E-24 | 2,4121E-21 |
| GO:0042775 | mitochondrial ATP synthesis coupled electron transport | 23/530 | 58/23355 | 4,023E-23 | 1,0012E-20 |
| GO:0000959 | 18/530 | 45/23355 | 1,8641E-18 | 4,3491E-16 | |
| GO:0043039 | tRNA aminoacylation | 17/530 | 43/23355 | 2,1272E-17 | 4,671E-15 |
| GO:0043038 | amino acid activation | 17/530 | 44/23355 | 3,3946E-17 | 7,0399E-15 |
| GO:0006399 | tRNA metabolic process | 26/530 | 161/23355 | 3,9816E-15 | 7,8229E-13 |
| GO:0006418 | tRNA aminoacylation for protein translation | 15/530 | 40/23355 | 4,2779E-15 | 7,9846E-13 |
| GO:0017004 | cytochrome complex assembly | 14/530 | 34/23355 | 7,4415E-15 | 1,3228E-12 |
| GO:0006120 | mitochondrial electron transport, NADH to ubiquinone | 12/530 | 22/23355 | 8,676E-15 | 1,4722E-12 |
| GO:0008535 | respiratory chain complex IV assembly | 12/530 | 24/23355 | 3,4812E-14 | 5,6501E-12 |
| GO:0070129 | regulation of mitochondrial translation | 12/530 | 27/23355 | 2,1033E-13 | 3,2715E-11 |
| GO:0006744 | ubiquinone biosynthetic process | 10/530 | 17/23355 | 5,6158E-13 | 8,0629E-11 |
| GO:1901663 | quinone biosynthetic process | 10/530 | 17/23355 | 5,6158E-13 | 8,0629E-11 |
| GO:0006520 | cellular amino acid metabolic process | 28/530 | 244/23355 | 2,2261E-12 | 3,0777E-10 |
| GO:0062125 | regulation of mitochondrial gene expression | 12/530 | 32/23355 | 2,4637E-12 | 3,2847E-10 |
| GO:0006743 | ubiquinone metabolic process | 10/530 | 19/23355 | 2,5607E-12 | 3,2962E-10 |
| GO:0034660 | ncRNA metabolic process | 38/530 | 445/23355 | 2,942E-12 | 3,6609E-10 |
| GO:0006401 | RNA catabolic process | 28/530 | 258/23355 | 8,6577E-12 | 1,0426E-09 |
| GO:0033617 | mitochondrial cytochrome c oxidase assembly | 10/530 | 21/23355 | 9,3856E-12 | 1,0949E-09 |
| GO:0009060 | aerobic respiration | 16/530 | 76/23355 | 1,2209E-11 | 1,3811E-09 |
| GO:0034248 | regulation of cellular amide metabolic process | 35/530 | 409/23355 | 2,0566E-11 | 2,258E-09 |
| GO:0006417 | regulation of translation | 32/530 | 350/23355 | 2,7541E-11 | 2,9374E-09 |
| GO:0006783 | heme biosynthetic process | 10/530 | 23/23355 | 2,9224E-11 | 2,9937E-09 |
| GO:0032259 | methylation | 32/530 | 351/23355 | 2,9672E-11 | 2,9937E-09 |
| GO:0007034 | vacuolar transport | 20/530 | 143/23355 | 9,0443E-11 | 8,8848E-09 |
| GO:0006402 | mRNA catabolic process | 24/530 | 220/23355 | 2,4302E-10 | 2,3261E-08 |
| GO:0006779 | porphyrin-containing compound biosynthetic process tetrapyrrole biosynthetic process | 10/530 | 28/23355 | 3,0269E-10 | 2,7019E-08 |
| GO:0033014 | 10/530 | 28/23355 | 3,0269E-10 | 2,7019E-08 | |
| GO:0043414 | macromolecule methylation | 28/530 | 300/23355 | 3,0399E-10 | 2,7019E-08 |
| GO:0019827 | stem cell population maintenance | 21/530 | 172/23355 | 4,0678E-10 | 3,5106E-08 |
| GO:0000956 | nuclear-transcribed mRNA catabolic process | 17/530 | 109/23355 | 4,1379E-10 | 3,5106E-08 |
| GO:0098727 | maintenance of cell number | 21/530 | 176/23355 | 6,2463E-10 | 5,1816E-08 |
| GO:0016569 | covalent chromatin modification | 35/530 | 464/23355 | 6,4242E-10 | 5,2133E-08 |
| GO:0016570 | histone modification | 34/530 | 450/23355 | 1,0876E-09 | 8,6383E-08 |
| GO:0042168 | heme metabolic process | 10/530 | 32/23355 | 1,3714E-09 | 1,0666E-07 |
| GO:0032008 | positive regulation of TOR signaling | 11/530 | 43/23355 | 2,2114E-09 | 1,6847E-07 |
Author response table 2
Overrepresentation analysis (ORA) of hESC screen.
Top 50 hit of the biological process gene ontology (GO) terms from the human CRISPR-screen
| ID | Description | GeneRatio | BgRatio | pvalue | p.adjust |
|---|---|---|---|---|---|
| GO:0097194 | execution phase of apoptosis | 8/160 | 94/18862 | 1,3494E-06 | 0,00187098 |
| GO:0006414 | translational elongation | 9/160 | 134/18862 | 2,1432E-06 | 0,00187098 |
| GO:0032543 | mitochondrial translation | 9/160 | 134/18862 | 2,1432E-06 | 0,00187098 |
| GO:0090200 | positive regulation of release of cytochrome c from mitochondria | 5/160 | 27/18862 | 2,8639E-06 | 0,00187515 |
| GO:0070125 | mitochondrial translational elongation | 7/160 | 88/18862 | 9,8885E-06 | 0,00453049 |
| GO:0140053 | mitochondrial gene expression | 9/160 | 165/18862 | 1,1757E-05 | 0,00453049 |
| GO:2001235 | positive regulation of apoptotic signaling pathway | 8/160 | 126/18862 | 1,2109E-05 | 0,00453049 |
| GO:0097193 | intrinsic apoptotic signaling pathway | 11/160 | 283/18862 | 3,0718E-05 | 0,0099803 |
| GO:0090199 | regulation of release of cytochrome c from mitochondria | 5/160 | 44/18862 | 3,4297E-05 | 0,0099803 |
| GO:0051204 | protein insertion into mitochondrial membrane | 5/160 | 48/18862 | 5,2618E-05 | 0,01378068 |
| GO:1900739 | regulation of protein insertion into mitochondrial membrane involved in apoptotic signaling pathw | 4/160 | 26/18862 | 6,445E-05 | 0,01406611 |
| GO:1900740 | positive regulation of protein insertion into mitochondrial membrane involved in apoptotic signali | 4/160 | 26/18862 | 6,445E-05 | 0,01406611 |
| GO:0090151 | establishment of protein localization to mitochondrial membrane | 5/160 | 53/18862 | 8,5226E-05 | 0,01586063 |
| GO:0046501 | protoporphyrinogen IX metabolic process | 3/160 | 11/18862 | 9,4023E-05 | 0,01586063 |
| GO:0006919 | activation of cysteine-type endopeptidase activity involved in apoptotic process | 6/160 | 87/18862 | 9,7175E-05 | 0,01586063 |
| GO:0001836 | release of cytochrome c from mitochondria | 5/160 | 55/18862 | 0,00010191 | 0,01586063 |
| GO:0006400 | tRNA modification | 6/160 | 89/18862 | 0,00011028 | 0,01586063 |
| GO:0070126 | mitochondrial translational termination | 6/160 | 89/18862 | 0,00011028 | 0,01586063 |
| GO:0001844 | protein insertion into mitochondrial membrane involved in apoptotic signaling pathway | 4/160 | 30/18862 | 0,00011506 | 0,01586063 |
Additional files
Download links
A two-part list of links to download the article, or parts of the article, in various formats.
Downloads (link to download the article as PDF)
Open citations (links to open the citations from this article in various online reference manager services)
Cite this article (links to download the citations from this article in formats compatible with various reference manager tools)
A critical role for heme synthesis and succinate in the regulation of pluripotent states transitions
eLife 12:e78546.
https://doi.org/10.7554/eLife.78546


