Ablation of palladin in adult heart causes dilated cardiomyopathy associated with intercalated disc abnormalities
- University of Milan-Bicocca, Italy
- IRCCS Humanitas Research Hospital, Italy
- Institute of Genetic and Biomedical Research, National Research Council, Milan unit, Italy
- University of California, San Diego, United States
- Department of Experimental and Clinical Medicine, University of Florence, Italy
- Department of Cell Biology and Physiology, University of North Carolina at Chapel Hill, United States
- Department of Cardiac Surgery, Goethe University, Germany
- Institute of Physiology II, University of Münster, Germany
- Department of Neuroscience, Imaging and Clinical Sciences and Center for Advanced Studies and Technology, University G. d'Annunzio, Italy
Figures
Figure 1 with 4 supplements
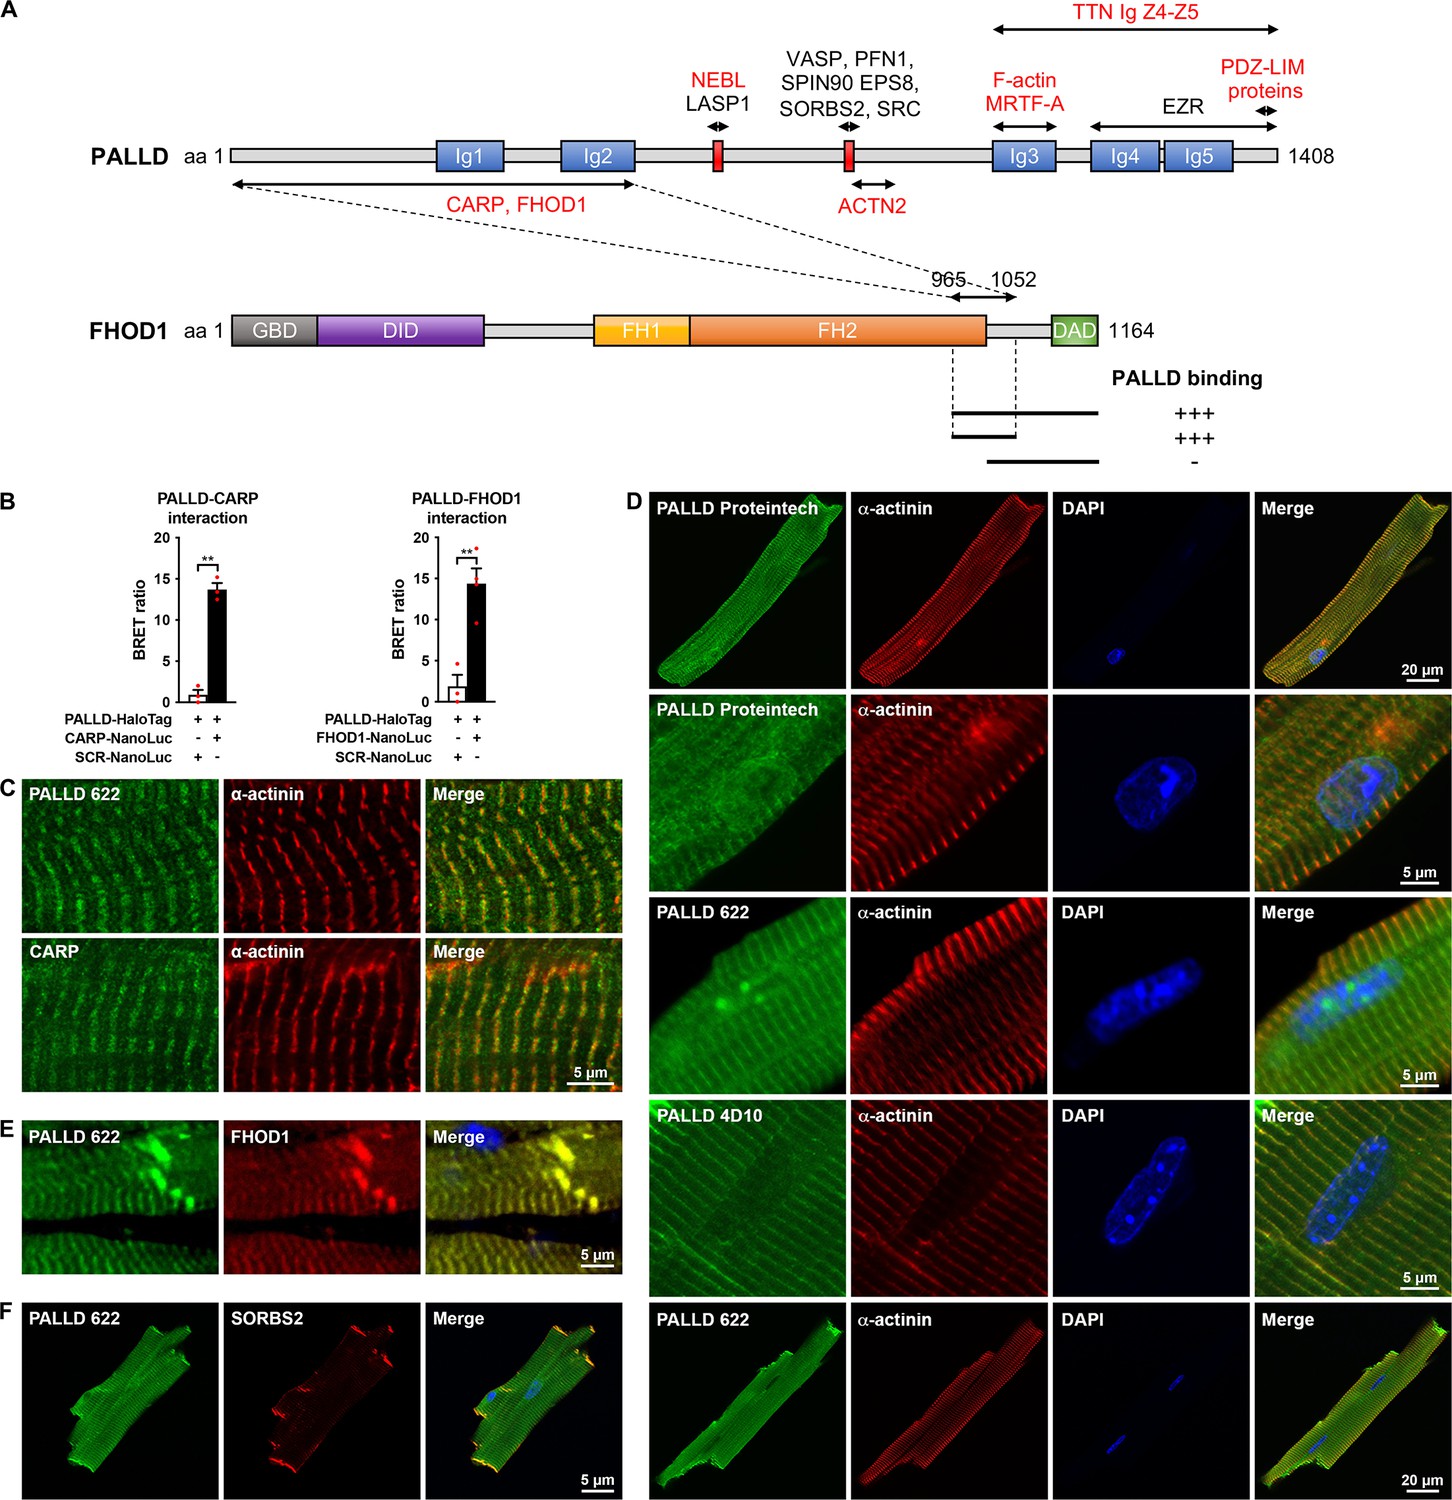
Palladin (PALLD) binds to cardiac ankyrin repeat protein (CARP/Ankrd1) and formin homology 2 domain containing 1 (FHOD1) and is localized in the Z-line, I-band, intercalated disc (ICD), and nucleus in cardiomyocytes (CMCs).
(A) Schematic representation of the domain structure of PALLD. Immunoglobulin (Ig) domains are shown in blue and proline-rich regions are indicated in red. Binding sites for known and novel interaction partners are shown with the ones in common with myopalladin (MYPN) in red. In a yeast two-hybrid screening, the N-terminal region of PALLD, comprising two Ig domains, was found to bind to CARP and FHOD1, as illustrated. The interacting region in FHOD1 was narrowed down to a region within the C-terminal region of FHOD1 (residue 965–1052), as indicated. GBD, GTPase-binding domain; DID, diaphanous inhibitory domain; FH1, formin homology 1 domain; FH2, formin homology 2 domain; DAD, diaphanous autoregulatory domain. (B) Confirmation of PALLD-CARP and PALLD-FHOD1 interactions in NanoBRET protein interaction assays with CARP-NanoLuc or FHOD1-NanoLuc as donor and fluorescently labeled PALLD-HaloTag as acceptor. Data are represented as mean ± standard error of the mean (SEM) (n = 3–4). **p<0.01; Student’s t-test. (C) Immunofluorescence analysis of sectioned heart by STED microscopy, showing localization of both PALLD and CARP in the sarcomeric I-band. (D) Confocal fluorescence microscopy showing the presence of PALLD in the nucleus of CMCs. Both the PALLD 622 antibody and the PALLD Proteintech antibody showed nuclear localization of PALLD in most CMCs (an example of a CMC without nuclear staining for PALLD is shown on the bottom), while the PALLD 4D10 antibody did not stain the nucleus. Nuclei are visualized by DAPI (blue). (E) Confocal fluorescence microscopy of sectioned heart, showing colocalization of PALLD and FHOD1 at the ICD and the Z-line. (F) Confocal fluorescence microscopy showing colocalization of PALLD and Sorbin and SH3 domain-containing 2 (SORBS2) at the ICD in CMCs.
-
Figure 1—source data 1
Confirmation of PALLD-CARP and PALLD-FHOD1 interactions in NanoBRET protein interaction assays.
- https://cdn.elifesciences.org/articles/78629/elife-78629-fig1-data1-v2.xlsx
Figure 1—figure supplement 1
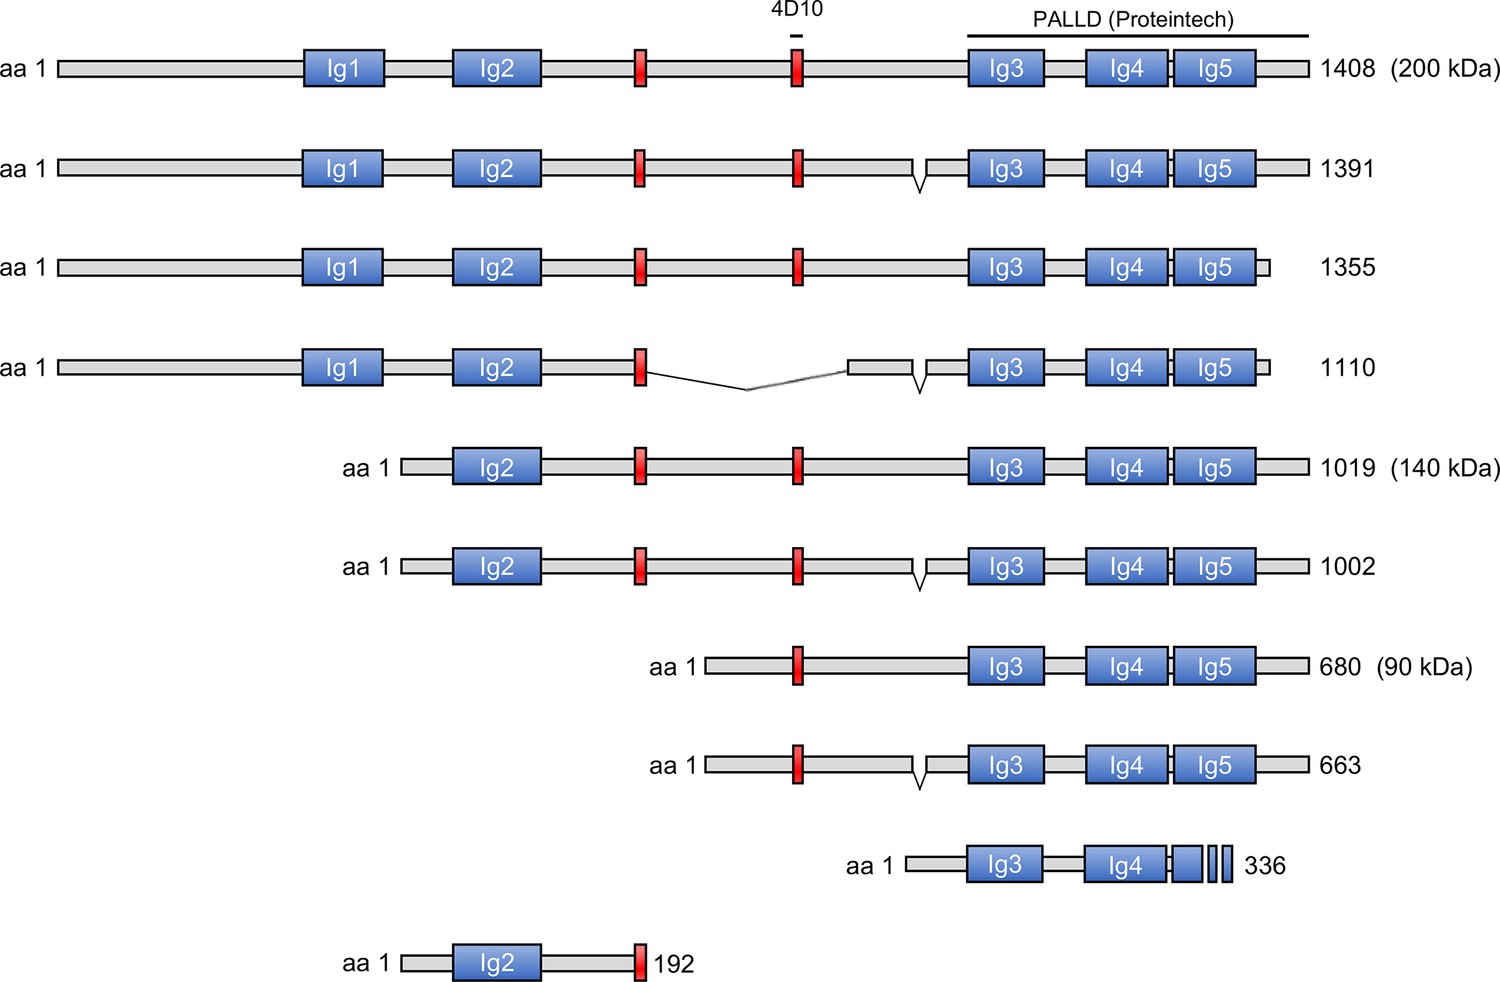
Schematic representation of known murine PALLD protein isoforms and their domain organization.
Blue boxes indicate immunoglobulin (Ig) domains, while red boxes indicate proline-rich regions. The regions against which the PALLD antibodies were raised are indicated above. Known molecular weights of isoforms are indicated.
Figure 1—figure supplement 2
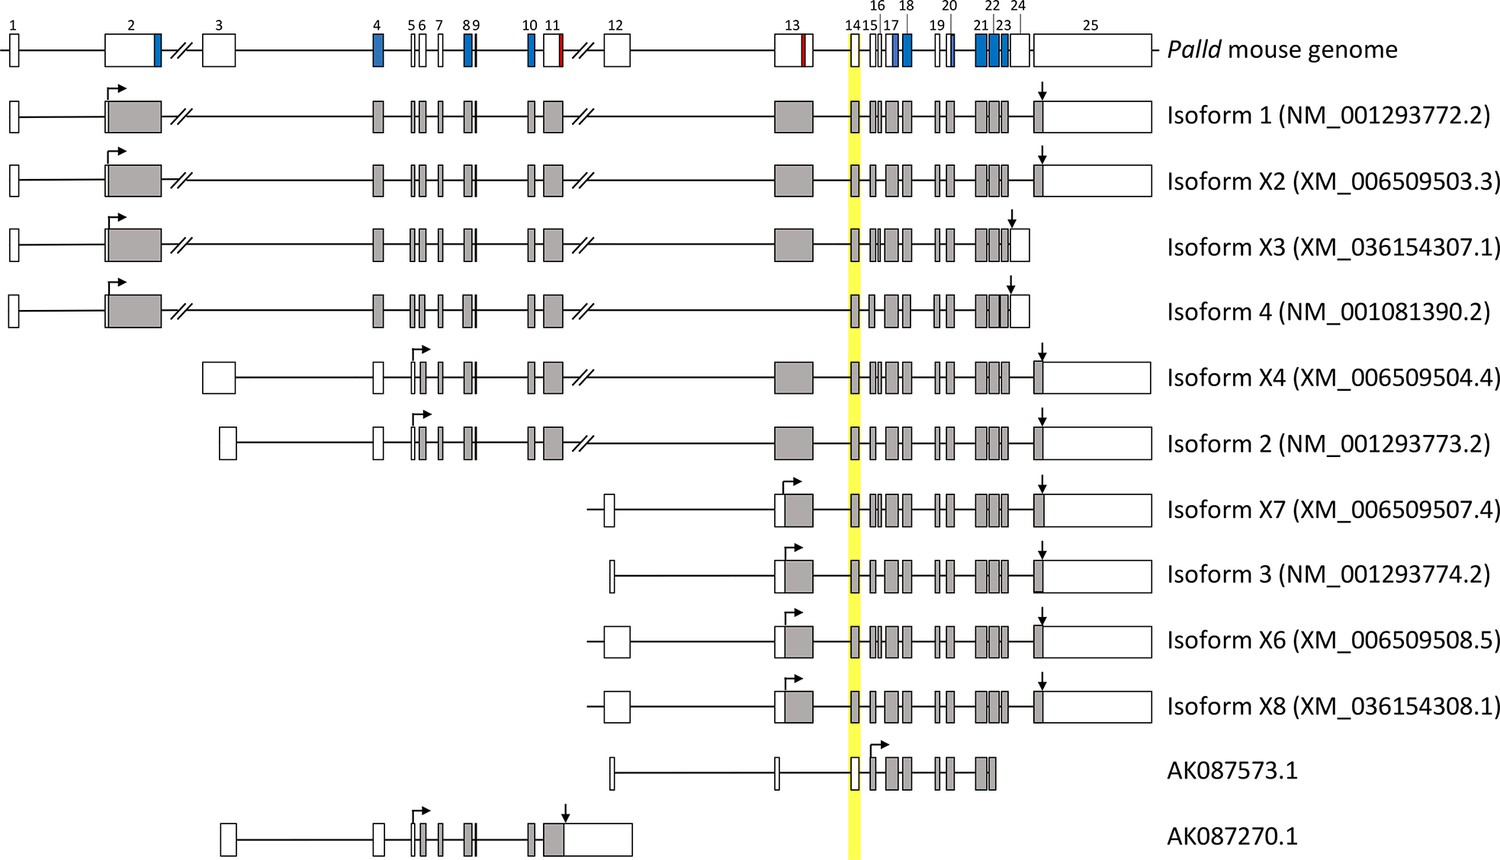
Schematic representation of the murine Palld gene structure with known transcripts indicated below.
Exon numbers are indicated above the exons. Exon 14 was floxed. Regions marked in blue encode immunoglobulin domains, whereas regions marked in red encode proline-rich regions. Arrows above the different splice variants indicate the start and end of translated regions, which are marked in gray.
Figure 1—figure supplement 3
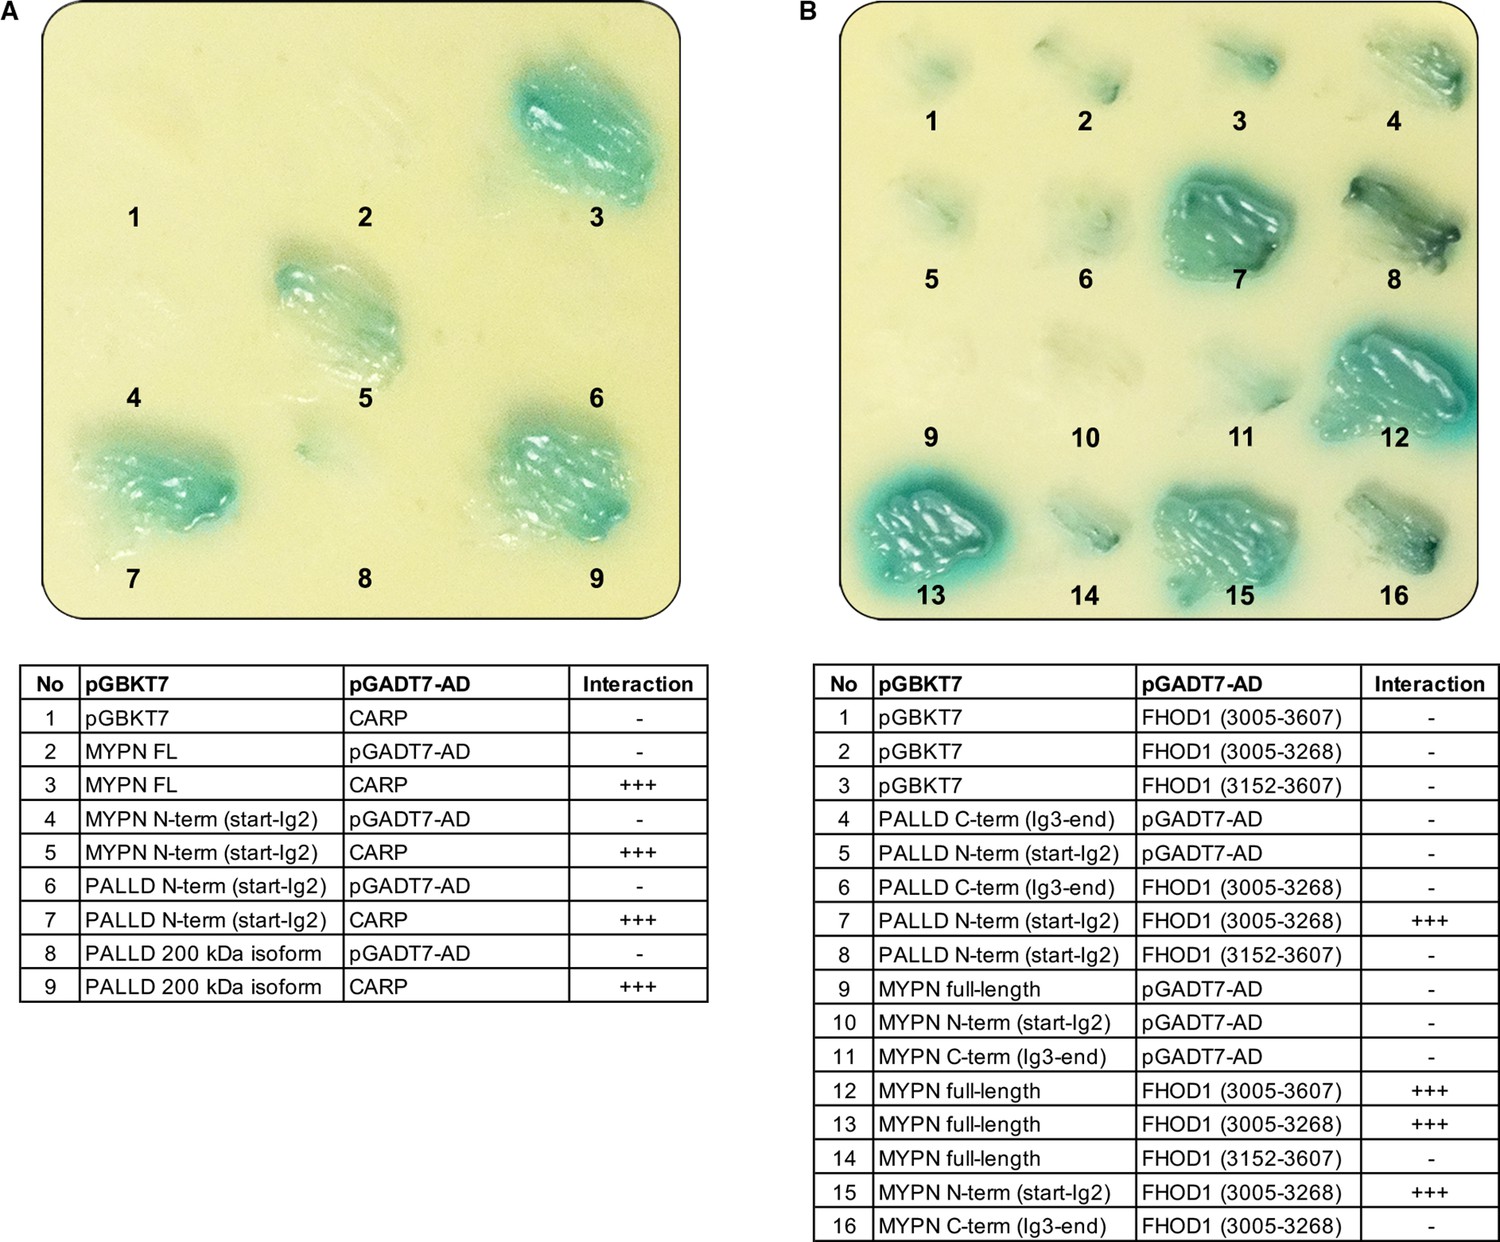
Yeast-two hybrid (Y2H) assays showing the interaction of the N-terminal region of palladin (PALLD) with cardiac ankyrin-repeat protein (CARP/Ankrd1) and formin homology 2 domain containing 1 (FHOD1).
(A) Culture plate with different combinations of Y2H cotransformations to narrow down the interaction size between PALLD and CARP as indicated in the table. PALLD’s N-terminal region binds to CARP. (B) Culture plate with different combinations of Y2H cotransformations to narrow down the interaction size between PALLD and FHOD1 as indicated in the table. FHOD1 residue 965–1052 is sufficient for binding to the N-terminal region of both PALLD and its homologue myopalladin (MYPN).
Figure 1—figure supplement 4
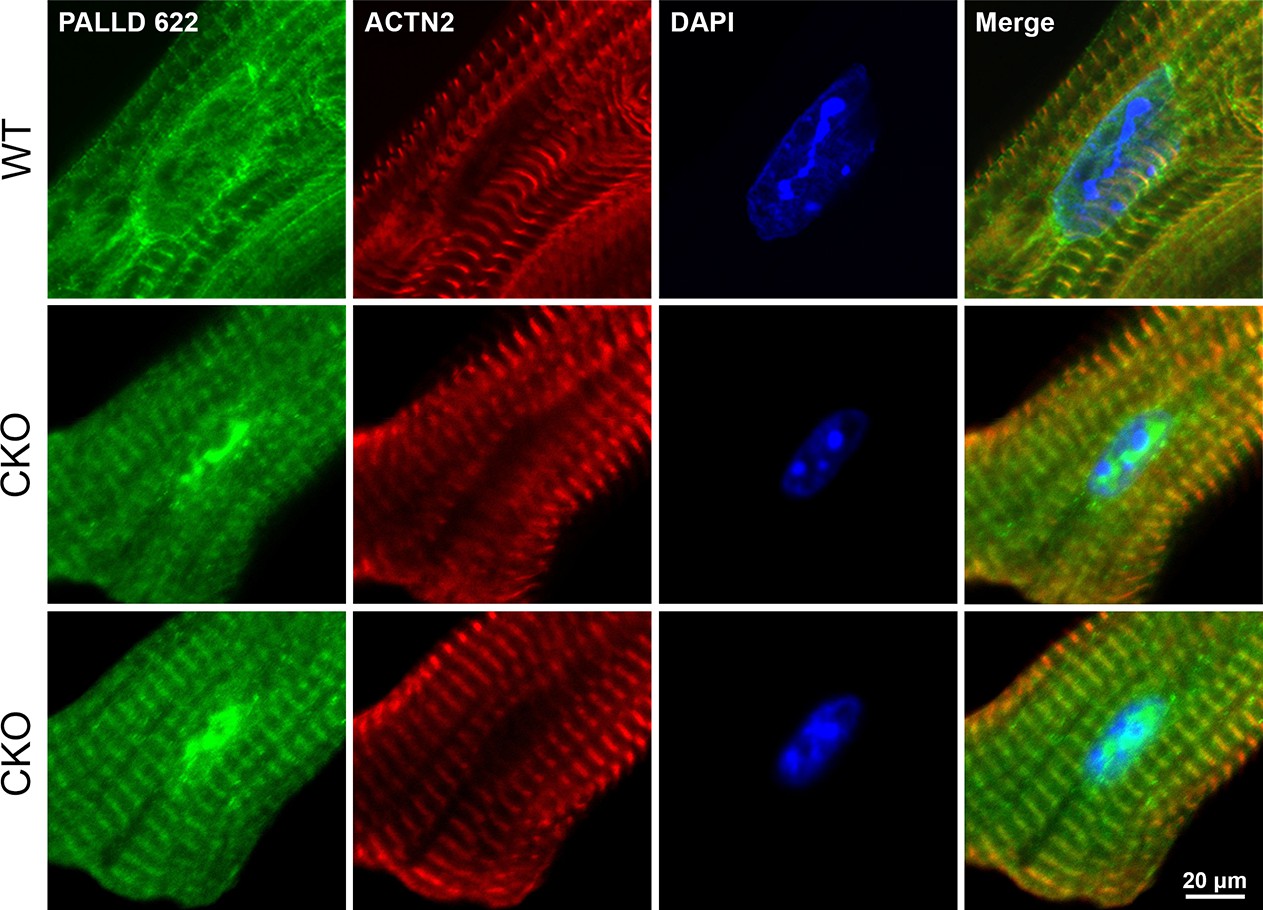
Confocal fluorescence microscopy showing the presence of palladin (PALLD) in the nucleus of cardiomyocytes both from wild-type (WT) mice and cardiac ankyrin repeat protein (CARP/Ankrd1) knockout (CKO) mice.
Figure 2 with 2 supplements
Echocardiographic and histological analyses of cardiomyocyte-specific palladin (cPKO) mice as well as cPKO and myopalladin (MYPN) double knockout (cPKO/MKO dKO) mice.
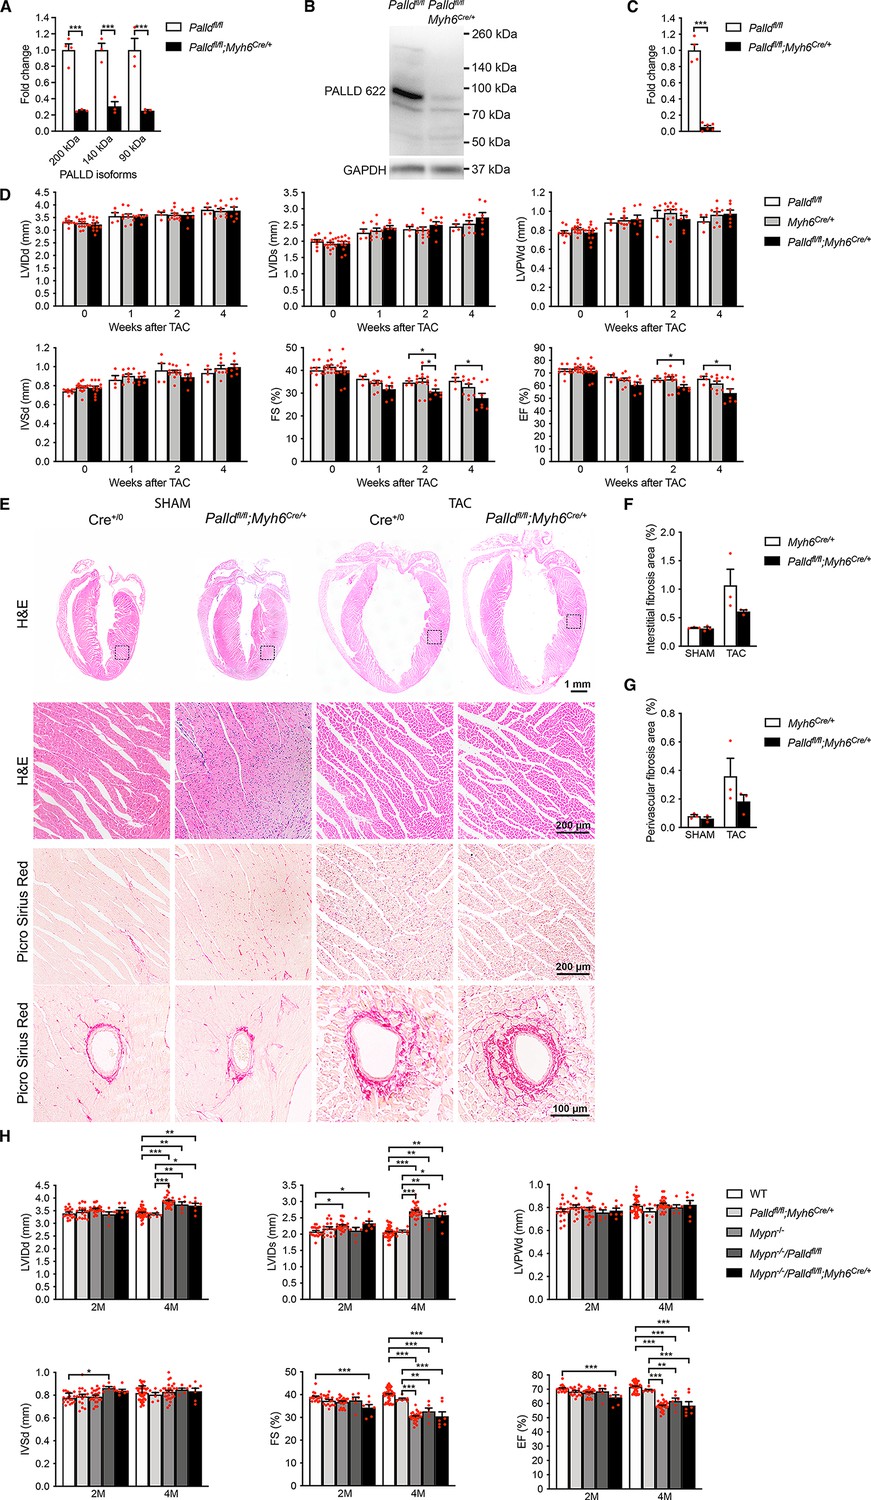
(A) Quantitative real-time PCR (qRT-PCR) for transcripts encoding the most common PALLD isoform on left ventricular (LV) RNA from 2-mo-old cPKO (Palldfl/fl;Myh6Cre/+) and control (Palldfl/fl) male mice (n = 3–4 biological replicates and three technical replicates per group). Data were normalized to Gapdh. ***p<0.001; two-way analysis of variance (ANOVA) with Šidák’s multiple comparison test. (B) Western blot analysis for PALLD (PALLD 622 antibody) on LV lysate from cPKO and control male mice. (C) Densitometric analysis for the 90 kDa PALLD isoform using GAPDH for normalization (n = 4–6 per group). ***p<0.001; Student’s t-test. (D) Echocardiography analyses of cPKO and control male mice under basal conditions and 1, 2, and 4 wk after transaortic constriction (TAC). Pressure gradient >70 mmHg. LVID, left ventricular inner diameter; LVPW, left ventricular posterior wall thickness; IVS, interventricular septum thickness; FS, fractional shortening; EF, ejection fraction; d, diastole; s, systole (n = 4–14 per group). *p<0.05; **p<0.01; linear mixed model with Tukey’s multiple comparisons test. (E) Hematoxylin and eosin (H&E) and Picro Sirius Red stainings of heart sections from cPKO and control male mice 4 wk after TAC or SHAM. The areas indicated with a box are shown at higher magnification below. Examples of vessels are shown on the bottom. (F, G) Percent area of interstitial fibrosis (F) and perivascular fibrosis (G) in the LV (n = 3 per group). No statistical difference by one-way ANOVA with Tukey’s multiple comparisons test. (H) Echocardiographic analysis of cPKO/MKO dKO vs. single KO and control male mice at 2 and 4 mo (M) of age. See (D) for abbreviations (n = 6–42 per group). *p<0.05; **p<0.01; ***p<0.001; linear mixed model with Tukey’s multiple comparisons test. All data are represented as mean ± standard error of the mean (SEM).
-
Figure 2—source data 1
Quantitative real-time PCR (qRT-PCR) and densitometry of western blots on cardiomyocyte-specific palladin (cPKO) and control male mice.
- https://cdn.elifesciences.org/articles/78629/elife-78629-fig2-data1-v2.xlsx
-
Figure 2—source data 2
Uncropped western blots for Figure 2B.
- https://cdn.elifesciences.org/articles/78629/elife-78629-fig2-data2-v2.pdf
-
Figure 2—source data 3
Echocardiographic parameters of 2-mo-old cardiomyocyte-specific palladin knockout (cPKO) male mice compared to controls before and 4 wk after mechanical pressure overload induced by transaortic constriction (TAC).
- https://cdn.elifesciences.org/articles/78629/elife-78629-fig2-data3-v2.docx
-
Figure 2—source data 4
Echocardiographic analysis on cardiomyocyte-specific palladin (cPKO) and control male mice subjected to transaortic constriction (TAC) or SHAM.
- https://cdn.elifesciences.org/articles/78629/elife-78629-fig2-data4-v2.xlsx
-
Figure 2—source data 5
Quantification of interstitial and vascular fibrosis in the left ventricle of cardiomyocyte-specific palladin (cPKO) and control male mice subjected to transaortic constriction (TAC) or SHAM.
- https://cdn.elifesciences.org/articles/78629/elife-78629-fig2-data5-v2.zip
-
Figure 2—source data 6
Echocardiographic parameters of 3- and 6-mo-old cardiomyocyte-specific palladin and myopalladin double knockout (cPKO/MKO dKO) mice subjected to transaortic constriction (TAC) or SHAM.
- https://cdn.elifesciences.org/articles/78629/elife-78629-fig2-data6-v2.docx
-
Figure 2—source data 7
Echocardiographic analysis on 2- and 4-mo-old cardiomyocyte-specific palladin (cPKO) and myopalladin (MYPN) double knockout and control male mice.
- https://cdn.elifesciences.org/articles/78629/elife-78629-fig2-data7-v2.xlsx
Figure 2—figure supplement 1
Generation of Palld floxed mice.
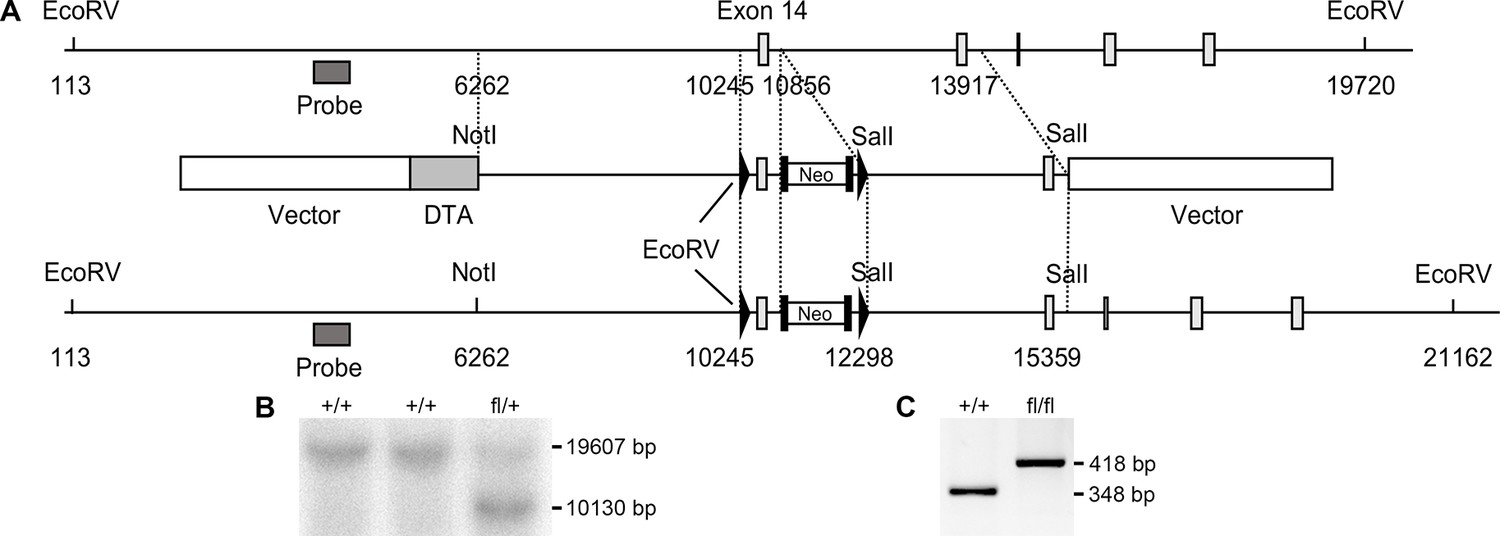
(A) Targeting strategy for the generation of Palld floxed mice containing LoxP sites flanking exon 14. A restriction map of the relevant genomic region of Palld is shown on the top, the targeting construct is shown in the middle, and the mutated locus after recombination is shown at the bottom. Arrowheads indicate loxP sites and black boxes indicate Flpase Recognition Target (FLP) sites. Neo, neomycin resistance gene; DTA, diptheria toxin A fragment gene. (B) Detection of wild-type (WT) and targeted alleles by Southern blot analysis following digestion with EcoRV using the probe shown in (A). (C) Genotyping of WT and Palld floxed mice after removal of the neo cassette using Palld-specific primers. All data are represented as mean ± standard error of the mean (SEM).
Figure 2—figure supplement 2

Echocardiographic and histological analyses of cardiomyocyte-specific palladin knockout (cPKO) male mice.
(A) Echocardiographic analysis of cPKO and control male mice at 3 and 6 mo (M) of age. LVID, left ventricular inner diameter; LVPW, left ventricular posterior wall thickness; IVS, interventricular septum thickness; FS, fractional shortening; EF, ejection fraction; d, diastole; s, systole (n = 7–17 per group). *p<0.05; linear mixed model with Tukey’s multiple comparisons test. (B) Hematoxylin and eosin (H&E) and Picro Sirius Red stainings of heart sections from 6-mo-old cPKO and control male mice. The areas indicated with a box are shown at higher magnification below. Examples of vessels are shown on the bottom. (C) Percent area of interstitial fibrosis (left) and perivascular fibrosis (right) in the left ventricle (n = 5–6 per group). No statistical differences by one-way analysis of variance (ANOVA) with Tukey' multiple comparisons test. All data are represented as mean ± standard error of the mean (SEM).
-
Figure 2—figure supplement 2—source data 1
Echocardiographic parameters of 3- and 6-mo-old cardiomyocyte-specific palladin knockout (cPKO) male mice compared to controls under basal conditions.
- https://cdn.elifesciences.org/articles/78629/elife-78629-fig2-figsupp2-data1-v2.docx
-
Figure 2—figure supplement 2—source data 2
Echocardiographic analysis on 3- and 6-mo-old cardiomyocyte-specific palladin (cPKO) and control male mice.
- https://cdn.elifesciences.org/articles/78629/elife-78629-fig2-figsupp2-data2-v2.xlsx
-
Figure 2—figure supplement 2—source data 3
Quantification of interstitial and vascular fibrosis in the left ventricle of 6-mo-old cardiomyocyte-specific palladin (cPKO) and control male mice.
- https://cdn.elifesciences.org/articles/78629/elife-78629-fig2-figsupp2-data3-v2.xlsx
Figure 3 with 2 supplements
Echocardiographic and functional analyses of inducible cardiomyocyte-specific palladin knockout (cPKOi) mice.
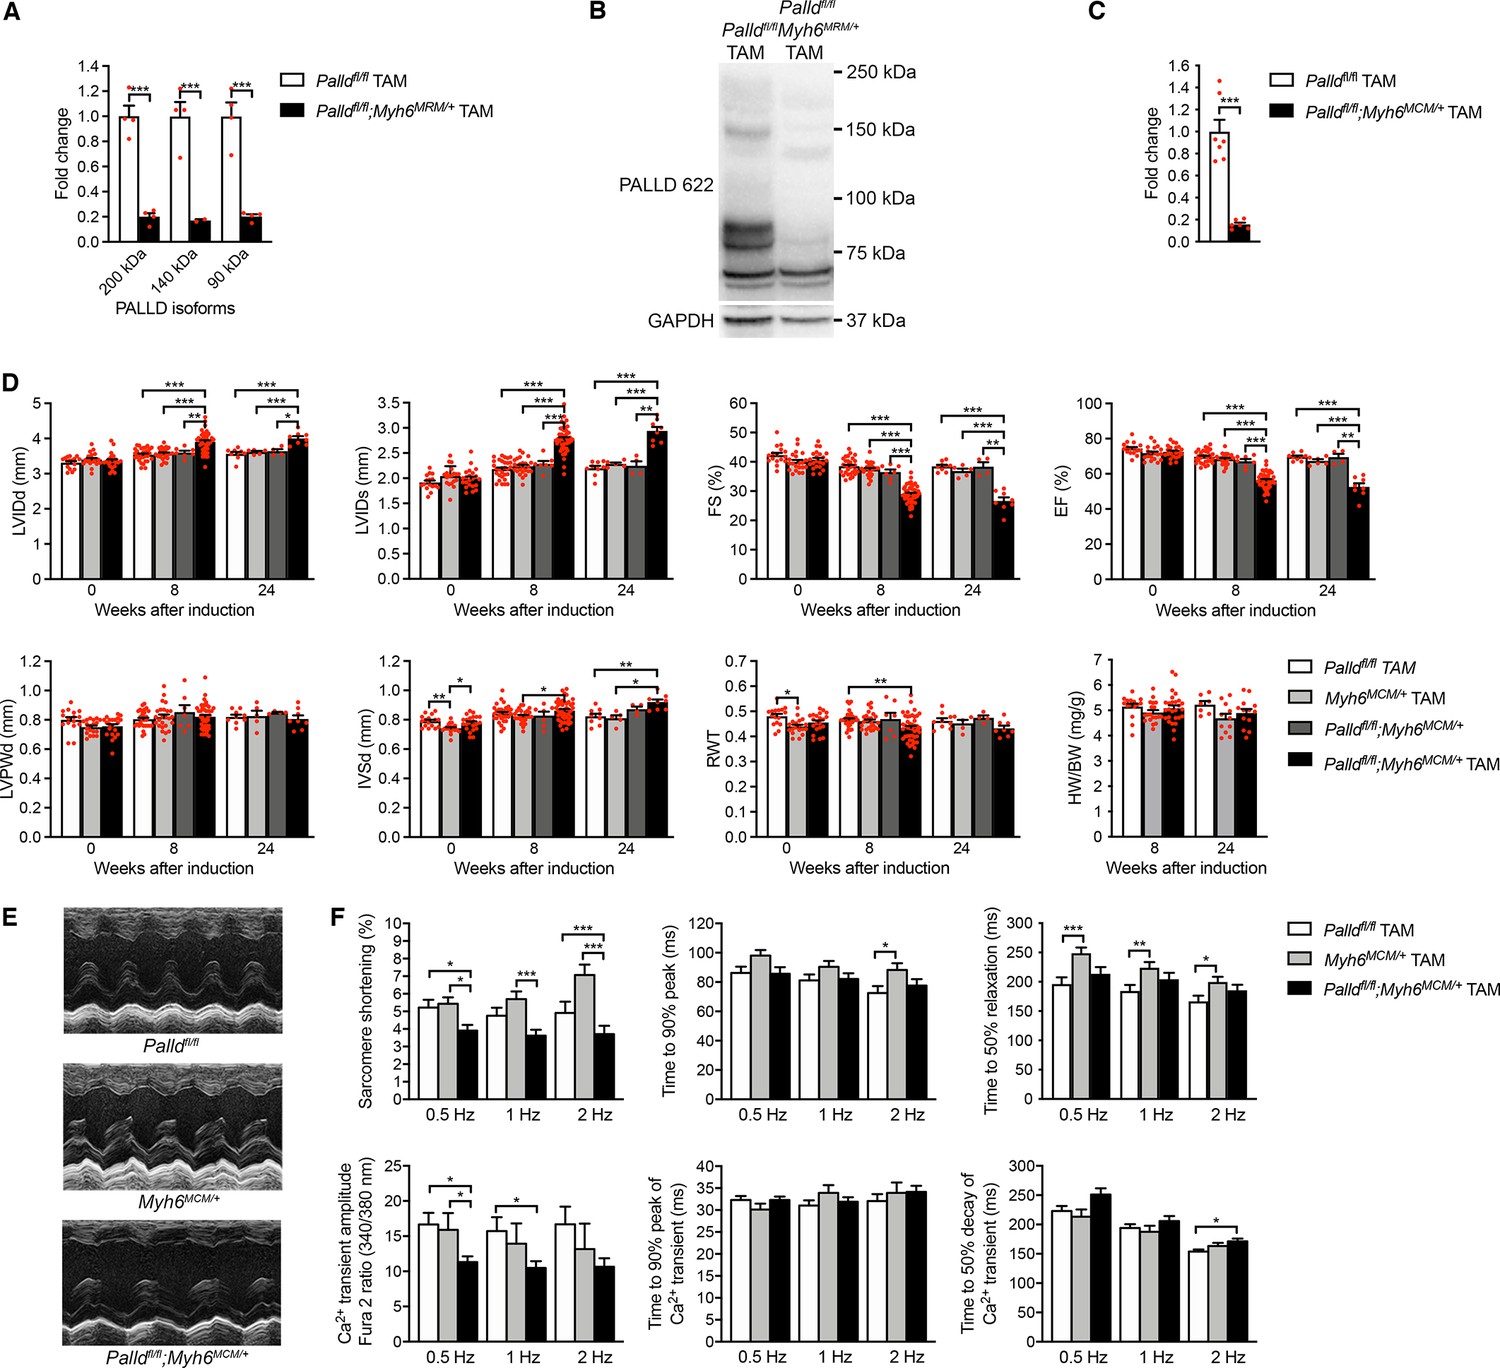
(A) Quantitative real-time PCR (qRT-PCR) for transcripts encoding the most common palladin (PALLD) isoforms on left ventricular (LV) RNA from cPKOi (Palldfl/fl;Myh6MCM/+ TAM) and control (Palldfl/fl TAM) mice 8 wk after tamoxifen (TAM) induction (n = 4 biological replicates and three technical replicates per group). Data were normalized to Gapdh. ***p<0.001; two-way analysis of variance (ANOVA) with Šidák’s multiple comparisons test. (B) Western blot analysis for PALLD (PALLD 622 antibody) on adult cardiomyocytes (CMCs) from cPKOi and control mice 8 wk after TAM induction. (C) Densitometric analysis for the 90 kDa PALLD isoform using GAPDH for normalization (n = 6–7). ***p<0.001; Student’s t-test. (D) Echocardiographic analysis of cPKOi and control male mice 0, 8, and 24 wk after TAM induction. See (D) for abbreviations. RWT, relative wall thickness ((LVPWd + IVSd)/LVIDd); HW, heart weight, BW, body weight (n = 4–44 per group). *p<0.05; **p<0.01; ***p<0.001; linear mixed model with Tukey’s multiple comparisons test. (E) Representative echocardiographic short-axis M-mode images of hearts from cPKOi and control mice 24 wk after TAM induction. (F) IonOptix analysis of ventricular CMC contractility and Ca2+ transients in cPKOi male mice vs. control mice 12 wk after TAM induction. Top, Sarcomere shortening, time to 90% peak, and time to 50% relaxation (n = 33 cells from 4 Palldfl/fl TAM mice, n = 34 cells from five MCM+/0 TAM mice, and n = 52 cells from six Palldfl/fl;Myh6MCM/+ TAM mice). Bottom, amplitude of Ca2+ transient, time to 90% peak of Ca2+ transient, and time to 50% decay of Ca2+ transient (n = 39 cells from four Palldfl/fl TAM mice, n = 18 cells from three MCM+/0 TAM mice, and n = 58 cells from six Palldfl/fl;Myh6MCM/+ TAM mice). *p<0.05; **p<0.01; ***p<0.001; two-level hierarchical testing with Bonferroni correction (Sikkel et al., 2017). All data are represented as mean ± standard error of the mean (SEM).
-
Figure 3—source data 1
Quantitative real-time PCR (qRT-PCR) and densitometry of western blots on inducible cardiomyocyte-specific palladin (cPKOi) and control male mice.
- https://cdn.elifesciences.org/articles/78629/elife-78629-fig3-data1-v2.xlsx
-
Figure 3—source data 2
Uncropped western blots for Figure 3B.
- https://cdn.elifesciences.org/articles/78629/elife-78629-fig3-data2-v2.pdf
-
Figure 3—source data 3
Echocardiographic parameters of inducible cardiomyocyte-specific palladin knockout (cPKOi) male mice compared to controls 8 and 24 wk after tamoxifen (TAM) induction.
- https://cdn.elifesciences.org/articles/78629/elife-78629-fig3-data3-v2.docx
-
Figure 3—source data 4
Echocardiographic analysis on inducible cardiomyocyte-specific palladin (cPKOi) and control male mice 8 and 24 wk after tamoxifen (TAM) induction.
- https://cdn.elifesciences.org/articles/78629/elife-78629-fig3-data4-v2.xlsx
-
Figure 3—source data 5
Heart weight to body weight ratio (HW/BW) measurements on inducible cardiomyocyte-specific palladin (cPKOi) and control male mice 8 and 24 wk after tamoxifen (TAM) induction.
- https://cdn.elifesciences.org/articles/78629/elife-78629-fig3-data5-v2.xlsx
-
Figure 3—source data 6
Analysis of sarcomere shortening and Ca2+ transients in cardiomyocytes from inducible cardiomyocyte-specific palladin (cPKOi) and control male mice 12 wk after tamoxifen (TAM) induction.
- https://cdn.elifesciences.org/articles/78629/elife-78629-fig3-data6-v2.xlsx
Figure 3—figure supplement 1
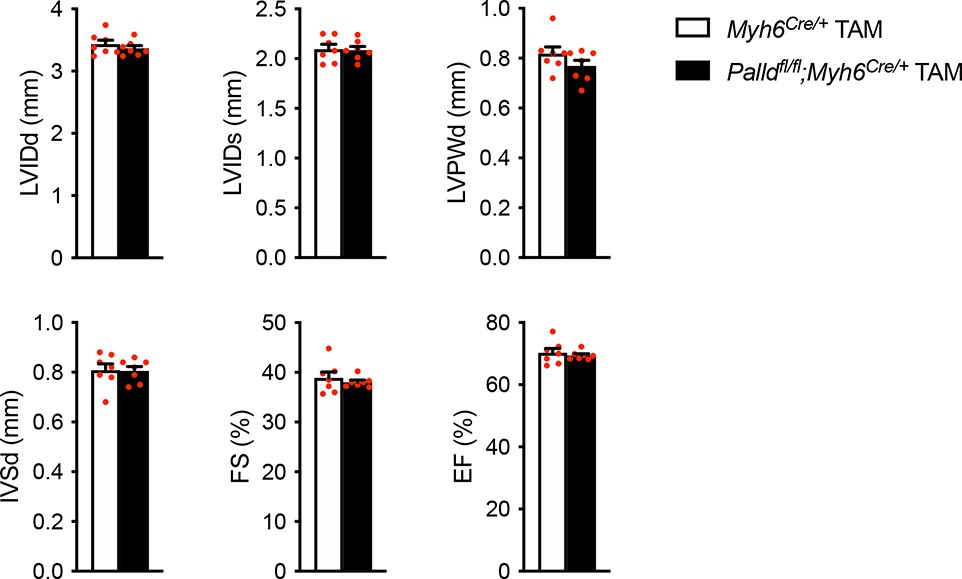
Echocardiographic analysis of cardiomyocyte-specific palladin (cPKO) and control male mice 8 wk after tamoxifen (TAM) injection.
LVID, left ventricular inner diameter; LVPW, left ventricular posterior wall thickness; IVS, interventricular septum thickness; FS, fractional shortening; EF, ejection fraction; d, diastole; s, systole (n = 7 per group). No differences using linear mixed model with Tukey’s multiple comparisons test.
-
Figure 3—figure supplement 1—source data 1
Echocardiographic parameters of cardiomyocyte-specific palladin knockout (cPKO) male mice compared to controls 8 weeks after tamoxifen (TAM) injection.
- https://cdn.elifesciences.org/articles/78629/elife-78629-fig3-figsupp1-data1-v2.docx
-
Figure 3—figure supplement 1—source data 2
Echocardiographic analysis on cardiomyocyte-specific palladin knockout (cPKO) and control male mice 8 wk after tamoxifen (TAM) injection.
- https://cdn.elifesciences.org/articles/78629/elife-78629-fig3-figsupp1-data2-v2.xlsx
Figure 3—figure supplement 2
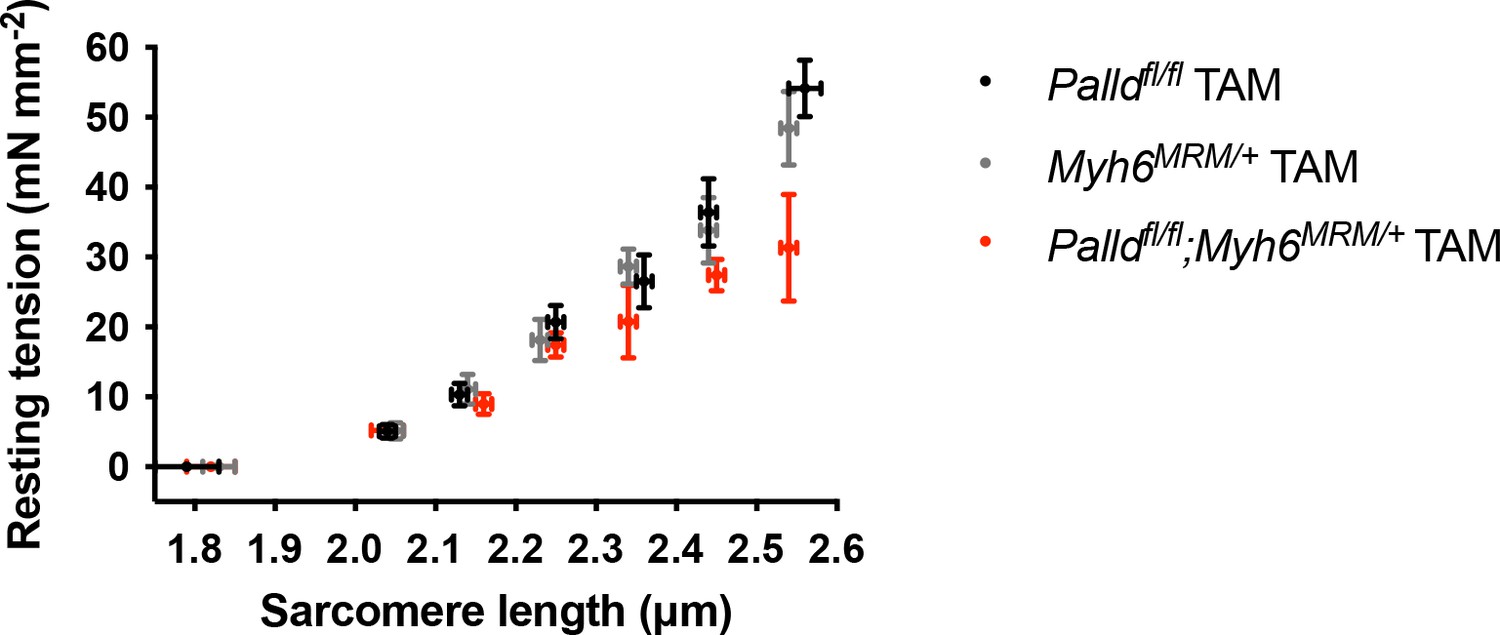
Sarcomere-length tension relationship in cardiac myofibrils from the left ventricle of inducible cardiomyocyte-specific palladin knockout (cPKOi) and control male mice 8 wk after tamoxifen (TAM) induction.
Each data point is represented as mean ± standard error of the mean (SEM) from 4 to 12 myofibrils from three Palldfl/fl TAM mice, from 11 to 19 myofibrils from three Myh6MCM/+ TAM mice, and from 5 to 15 myofibrils from three Palldfl/fl;Myh6MCM/+ TAM mice. The figure is related to the data displayed in Table 1.
-
Figure 3—figure supplement 2—source data 1
Data for sarcomere-length tension relationship in cardiac myofibrils from the left ventricle of inducible cardiomyocyte-specific palladin knockout (cPKOi) and control male mice 8 wk after tamoxifen (TAM) induction.
- https://cdn.elifesciences.org/articles/78629/elife-78629-fig3-figsupp2-data1-v2.xlsx
Figure 4
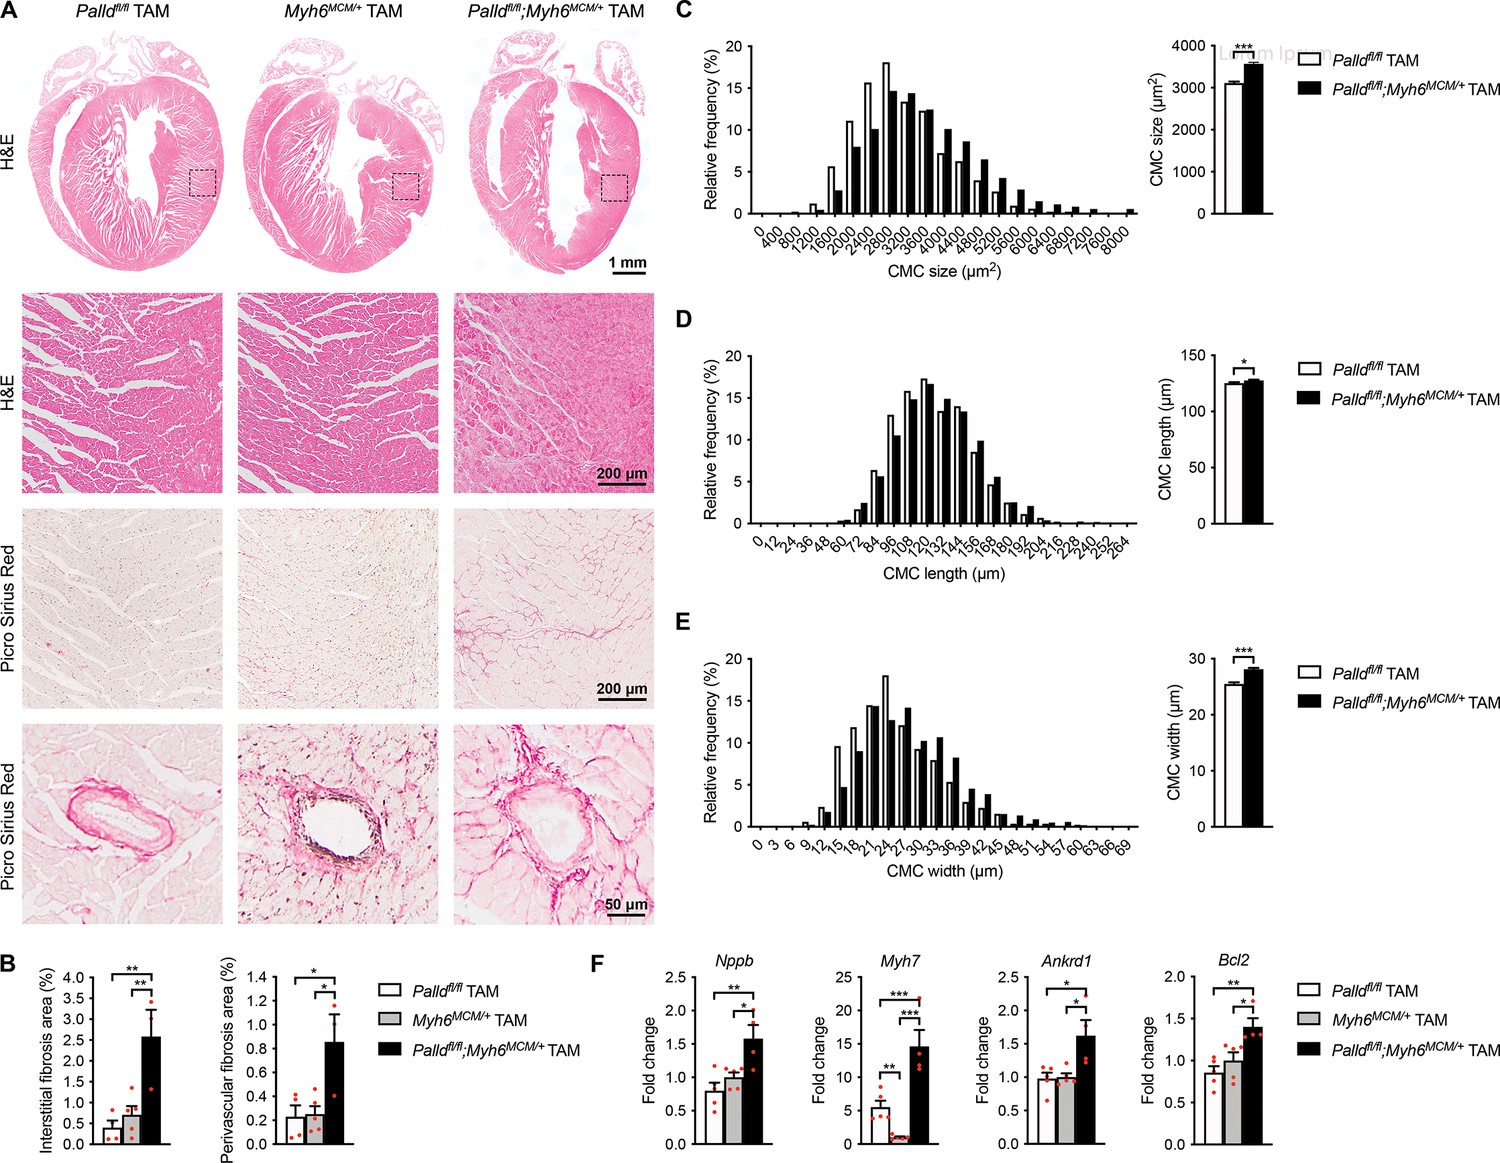
Histological and molecular analyses of cardiomyocyte-specific palladin knockout (cPKOi) mice.
(A) Hematoxylin and eosin (H&E) and Picro Sirius Red stainings of heart sections from cPKOi and control male mice 24 wk after tamoxifen (TAM) induction. The areas indicated with a box are shown at higher magnification. Examples of vessels are shown on the bottom. (B) Percent area of interstitial fibrosis (left) and perivascular fibrosis (right) in the left ventricle (LV) (n = 3–5 per group). **p<0.01; one-way analysis of variance (ANOVA) with Tukey’s multiple comparisons test. (C−E) Left, frequency distributions of cardiomyocyte (CMC) size (n = 830 CMCs from three Palldfl/fl mice and 1079 CMCs from three Palldfl/fl;Myh6MCM/+ TAM mice) (C), length (n = 877 CMCs from three Palldfl/fl mice and 1576 CMCs from three Palldfl/fl;Myh6MCM/+ TAM mice) (D), and width (n = 842 CMCs from three Palldfl/fl mice and 1565 CMCs from three Palldfl/fl;Myh6MCM/+ TAM mice) (E) in cPKOi and control male mice 12 wk after TAM induction. Right, average CMC size (C), length (D), and width (E) in the same mice. *p<0.05; ***p<0.001; Student’s t-test. (F) Quantitative real-time PCR (qRT-PCR) analysis on LV RNA from cPKOi and control mice 24 wk after TAM induction (n = 4–5 biological replicates and three technical replicates per group). Data were normalized to Gapdh. *p<0.05; **p<0.01; ***p<0.001; one-way ANOVA with Tukey’s multiple comparisons test. All data are represented as mean ± standard error of the mean (SEM).
-
Figure 4—source data 1
Cardiomyocyte (CMC) size, length, and width measurements in inducible cardiomyocyte-specific palladin (cPKOi) and control male mice 12 wk after tamoxifen (TAM) induction.
- https://cdn.elifesciences.org/articles/78629/elife-78629-fig4-data1-v2.xlsx
-
Figure 4—source data 2
Quantification of interstitial and perivascular fibrosis in the left ventricle of inducible cardiomyocyte-specific palladin (cPKOi) and control male mice 24 wk after tamoxifen (TAM) induction.
- https://cdn.elifesciences.org/articles/78629/elife-78629-fig4-data2-v2.xlsx
-
Figure 4—source data 3
Raw data for quantitative real-time PCR (qRT-PCR) on inducible cardiomyocyte-specific palladin (cPKOi) and control male mice 24 wk after tamoxifen (TAM) induction.
- https://cdn.elifesciences.org/articles/78629/elife-78629-fig4-data3-v2.xlsx
-
Figure 4—source data 4
Quantitative real-time PCR (qRT-PCR) analysis on left ventricle from inducible cardiomyocyte-specific palladin knockout (cPKOi) male mice compared to controls 24 wk after tamoxifen (TAM) induction.
- https://cdn.elifesciences.org/articles/78629/elife-78629-fig4-data4-v2.docx
Figure 5
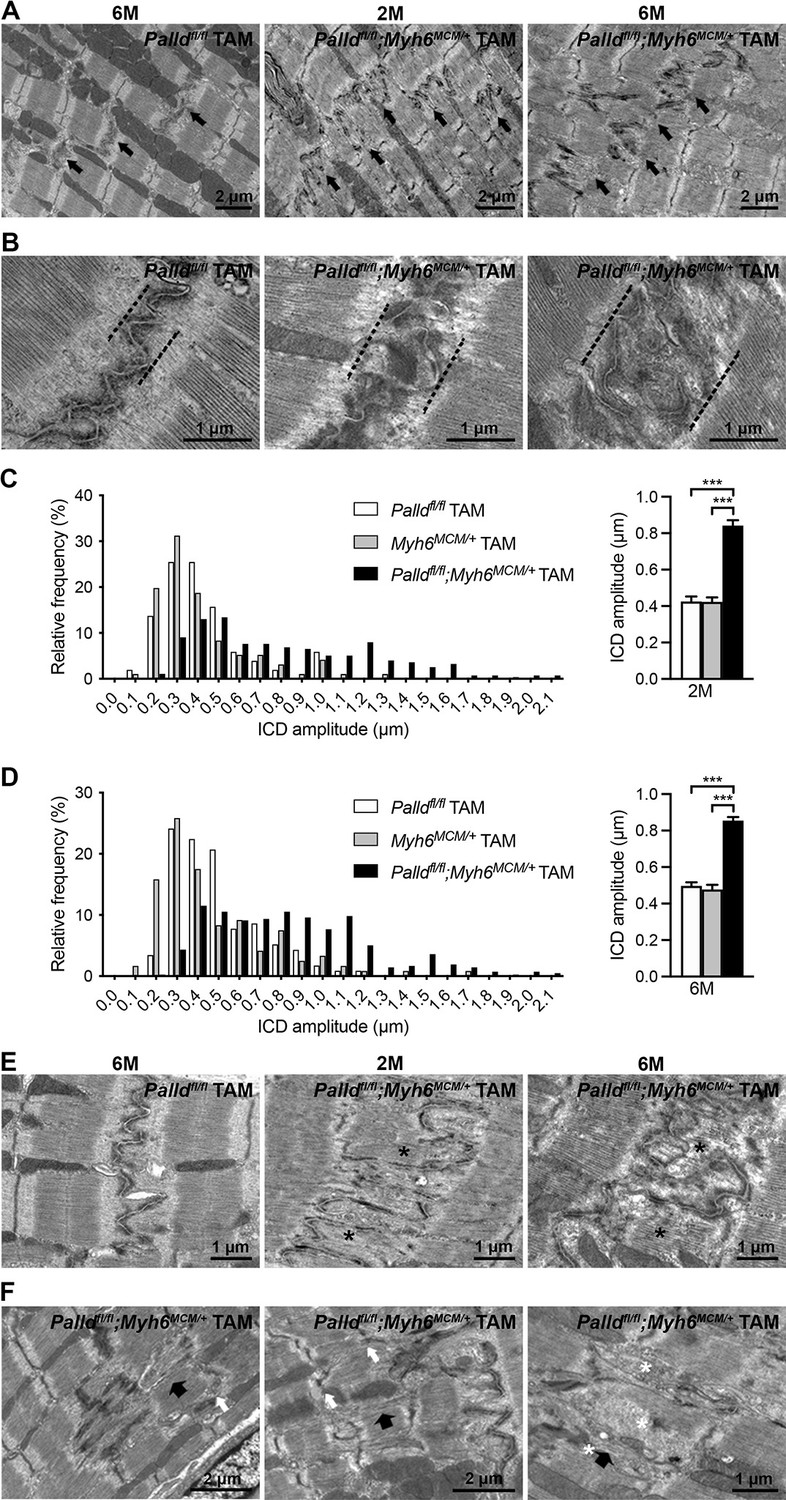
Transmission electron microscopy (TEM) analysis of papillary muscles from inducible cardiomyocyte-specific palladin knockout (cPKOi) and control mice.
(A) Representative electron micrographs of papillary muscles from control (Palldfl/fl TAM) and cPKOi (Palldfl/fl;Myh6MCM/+ TAM) male mice 8 and 24 wk after tamoxifen (TAM) induction. Black arrows indicate intercalated discs (ICDs). (B) Representative electron micrographs of ICD ultrastructure from 6-mo-old control and cPKOi mice. Dashed black lines indicate ICD regions. (C, D) ICD fold amplitude frequency distribution (left) and average (right) in control (Palldfl/fl TAM, Myh6MCM/+ TAM) and cPKOi samples 2 mo (n = 96 measurements on 13 ICDs from 1 Palldfl/fl mouse, n = 51 measurements on 7 ICDs from one Myh6MCM/+ TAM mouse, and 279 measurements on 33 ICDs from 2 Palldfl/fl;Myh6MCM/+ TAM mice) (C) and 6 mo (n = 96 measurements on 15 ICDs from 1 Palldfl/fl mice, n = 116 measurements on 15 ICDs from 1 MCM+/0 TAM mouse, and 420 measurements on 48 ICDs from 2 Palldfl/fl;Myh6MCM/+ TAM mice) (D) after TAM induction. Data are represented as mean ± standard error of the mean (SEM). ***p<0.001; Brown–Forsythe and Welch’s ANOVA with Games–Howell’s multiple comparisons test. (E) Representative electron micrographs of ICDs from control and cPKOi mice 8 and 24 wk after TAM induction. Asterisks show thick filaments in abnormal fold regions. (F) Electron micrographs showing altered sarcomeric regions (large black arrows) in the proximity of high-amplitude ICDs in papillary muscles from 6-mo-old cPKOi mice. White arrows point to jagged Z-lines. Asterisks highlight groups of vesicles.
-
Figure 5—source data 1
Intercalated disc (ICD) fold amplitude measurements in inducible cardiomyocyte-specific palladin (cPKOi) and control male mice 8 and 24 wk after tamoxifen (TAM) induction.
- https://cdn.elifesciences.org/articles/78629/elife-78629-fig5-data1-v2.xlsx
Figure 6 with 4 supplements
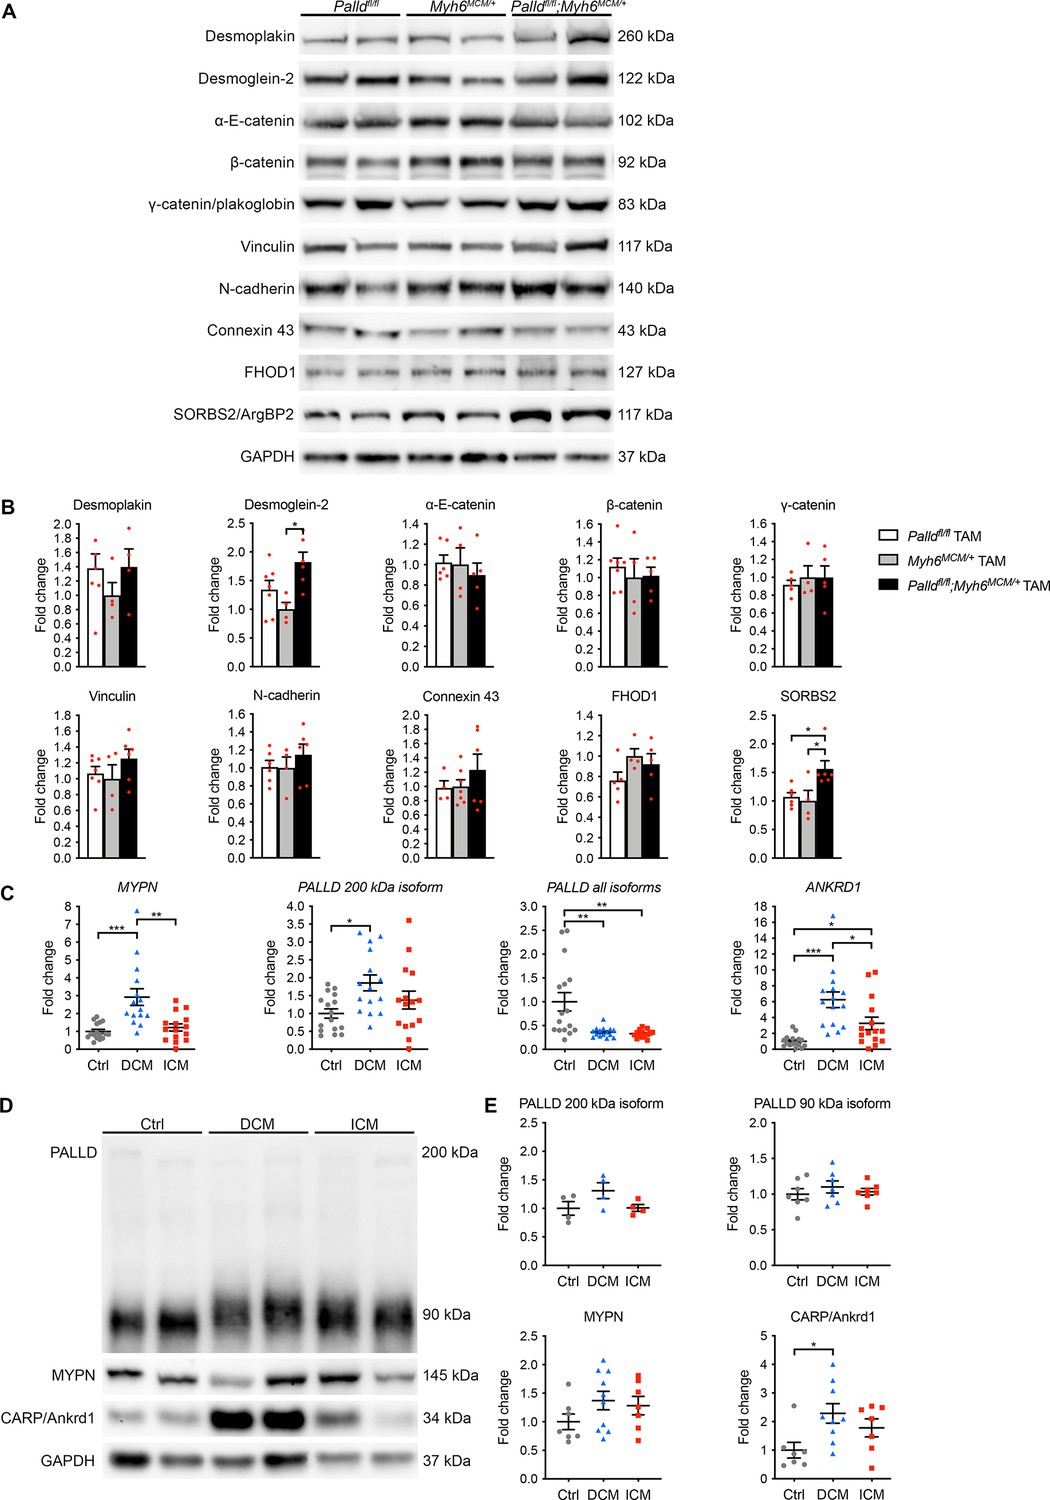
Molecular analyses on inducible cardiomyocyte-specific palladin knockout (cPKOi) mice and human cardiomyopathy patients.
(A) Western blot analyses for intercalated disc (ICD) proteins on left ventricular (LV) lysate from cPKOi mice compared to control male mice 8 wk after TAM induction. Representative blots are shown. GAPDH was used as loading control. (B) Densitometric analysis of blots in (A) using GAPDH for normalization (n = 3–4 per group). *p<0.05, one-way analysis of variance (ANOVA) with Tukey’s multiple comparisons test. (C) Quantitative real-time PCR (qRT-PCR) analysis for MYPN, PALLD, and ANKRD1 on LV biopsies from dilated cardiomyopathy (DCM) (n = 15) and ischemic cardiomyopathy (ICM) (n = 15) male patients vs. healthy control (Ctrl) hearts (n = 16). Data were normalized to PGK1. *p<0.05, **p<0.01; Brown–Forsythe and Welch’s ANOVA with Dunnett’s T3 multiple comparisons test. (D) Western blot analysis for PALLD (PALLD 622 antibody), MYPN, and CARP/Ankrd1 on lysate from LV biopsies of DCM and DCM male patients vs. healthy Ctrl hearts. (E) Densitometric analyses using total protein content as assessed on TGX Stain-Free gels (Bio-Rad Laboratories) for normalization (n = 4–10 per group). *p<0.05; Brown–Forsythe and Welch’s ANOVA with Dunnett’s T3 multiple comparisons test. All data are represented as mean ± standard error of the mean (SEM).
-
Figure 6—source data 1
Uncropped western blots for Figure 6A.
- https://cdn.elifesciences.org/articles/78629/elife-78629-fig6-data1-v2.pdf
-
Figure 6—source data 2
Densitometry of western blots on inducible cardiomyocyte-specific palladin (cPKOi) and control male mice 8 wk after tamoxifen (TAM) induction.
- https://cdn.elifesciences.org/articles/78629/elife-78629-fig6-data2-v2.xlsx
-
Figure 6—source data 3
Quantitative real-time PCR (qRT-PCR) analysis on left ventricular biopsies from patients with dilated (DCM) and ischemic (ICM) cardiomyopathy vs. healthy control (Ctrl) hearts.
- https://cdn.elifesciences.org/articles/78629/elife-78629-fig6-data3-v2.xlsx
-
Figure 6—source data 4
Uncropped western blots for Figure 6D.
- https://cdn.elifesciences.org/articles/78629/elife-78629-fig6-data4-v2.pdf
-
Figure 6—source data 5
Densitometry of western blots on left ventricular biopsies from patients with dilated (DCM) and ischemic (ICM) cardiomyopathy vs. healthy control (Ctrl) hearts.
- https://cdn.elifesciences.org/articles/78629/elife-78629-fig6-data5-v2.xlsx
-
Figure 6—source data 6
Patient characteristics.
- https://cdn.elifesciences.org/articles/78629/elife-78629-fig6-data6-v2.docx
Figure 6—figure supplement 1
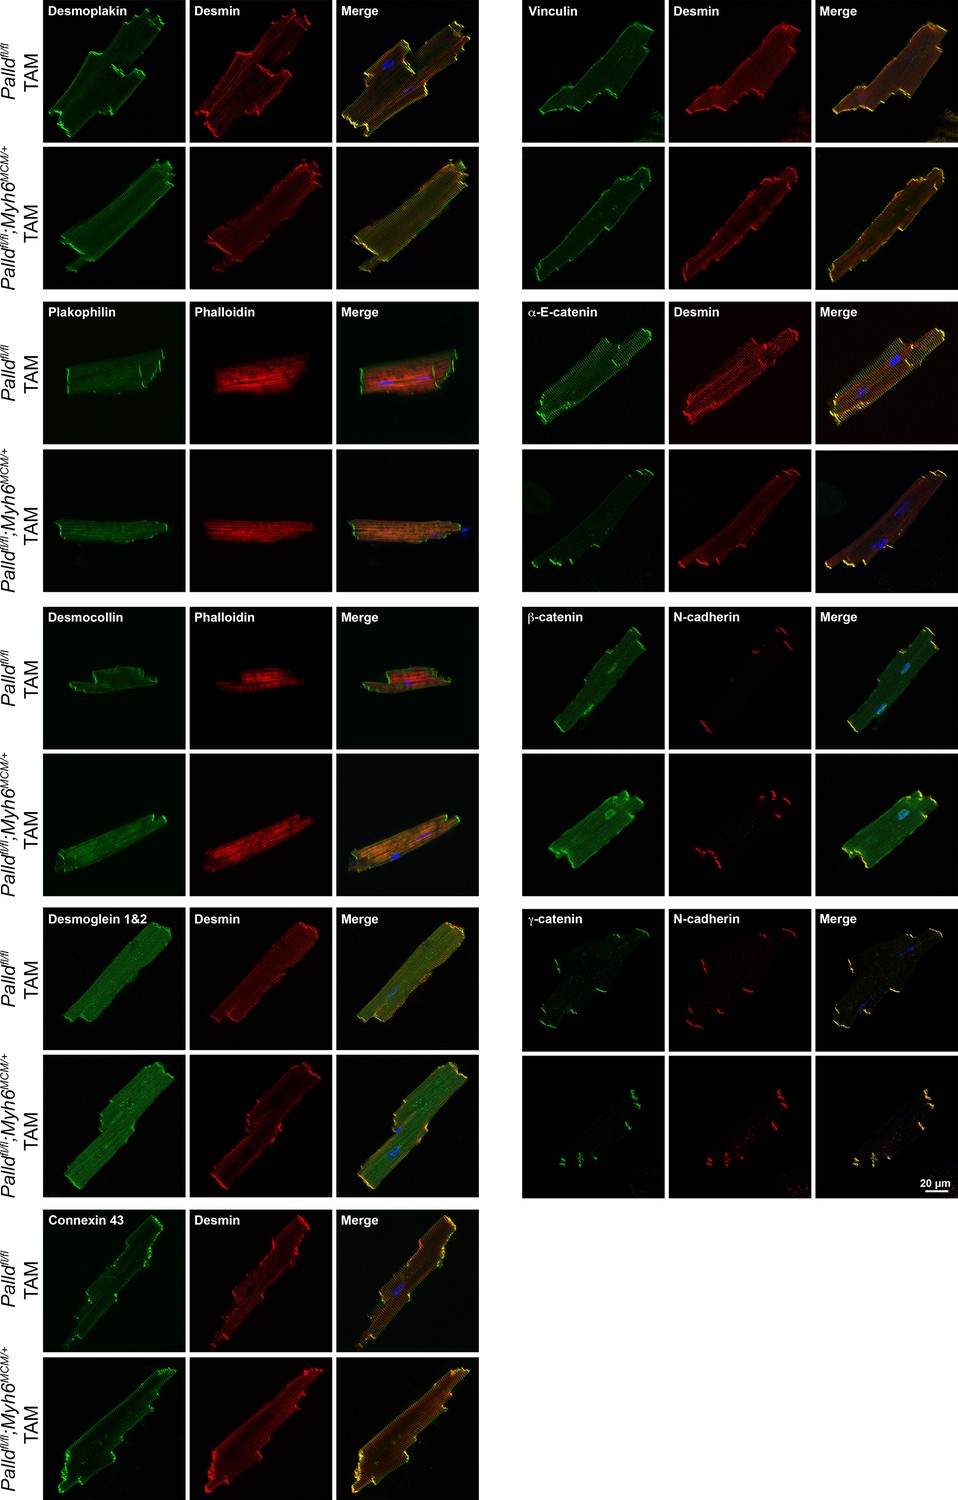
Immunofluorescence stainings for intercalated disc proteins of cardiomyocytes from inducible cardiomyocyte-specific palladin knockout (cPKOi) and control male mice 16 wk after tamoxifen (TAM) induction.
Nuclei are visualized by DAPI (blue).
Figure 6—figure supplement 2

Immunofluorescence stainings of cardiomyocytes for palladin (PALLD) interacting proteins from inducible cardiomyocyte-specific palladin knockout (cPKOi) and control male mice 16 wk after tamoxifen (TAM) induction.
Nuclei are visualized by DAPI (blue).
Figure 6—figure supplement 3
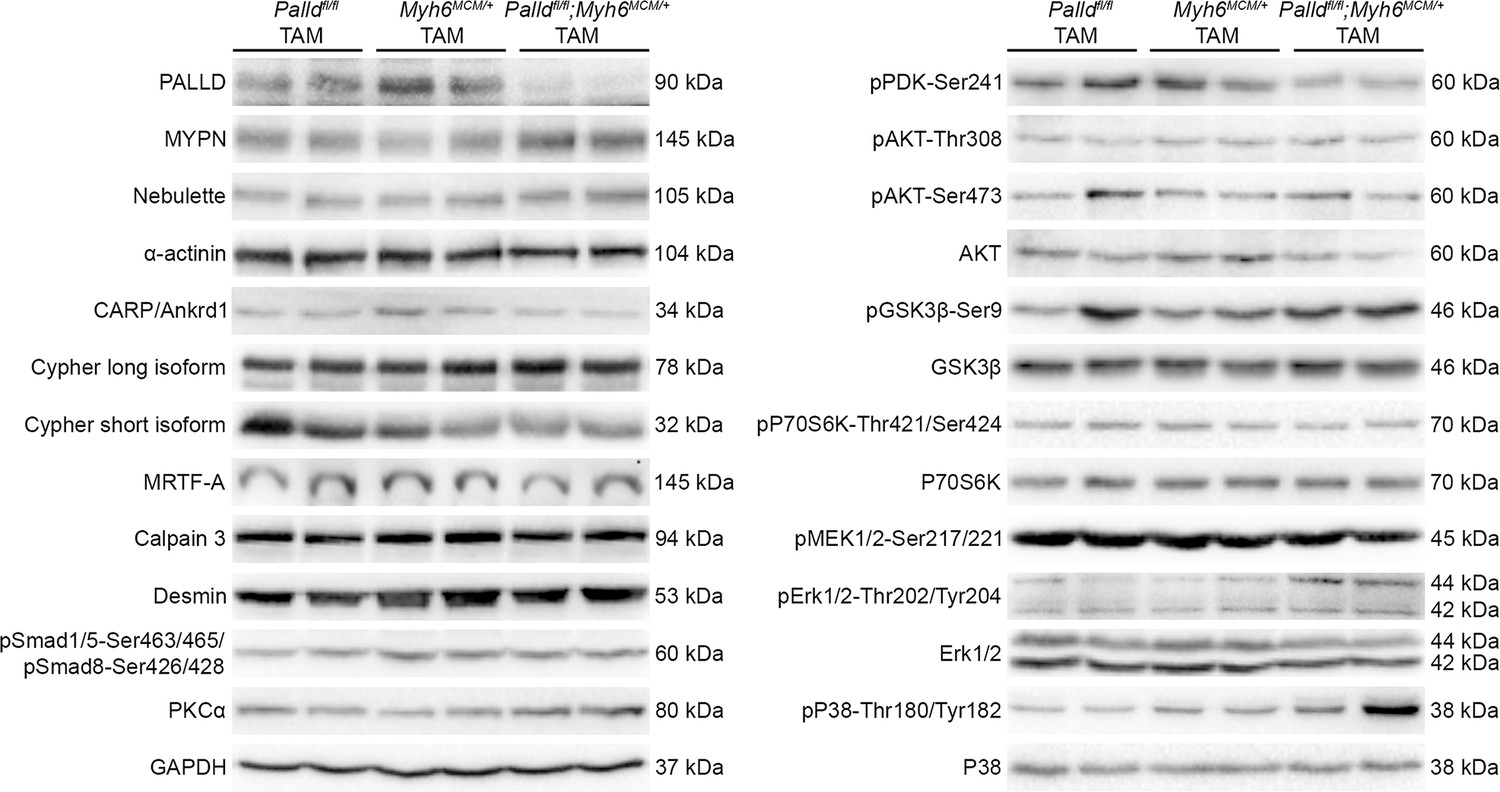
Western blot analysis for palladin (PALLD) interacting proteins and proteins involved in cardiac signaling pathways on left ventricular lysate from inducible cardiomyocyte-specific palladin knockout (cPKOi) and control male mice 8 wk after tamoxifen (TAM) induction.
GAPDH was used as loading control. No differences were found.
-
Figure 6—figure supplement 3—source data 1
Uncropped western blots.
- https://cdn.elifesciences.org/articles/78629/elife-78629-fig6-figsupp3-data1-v2.pdf
Figure 6—figure supplement 4
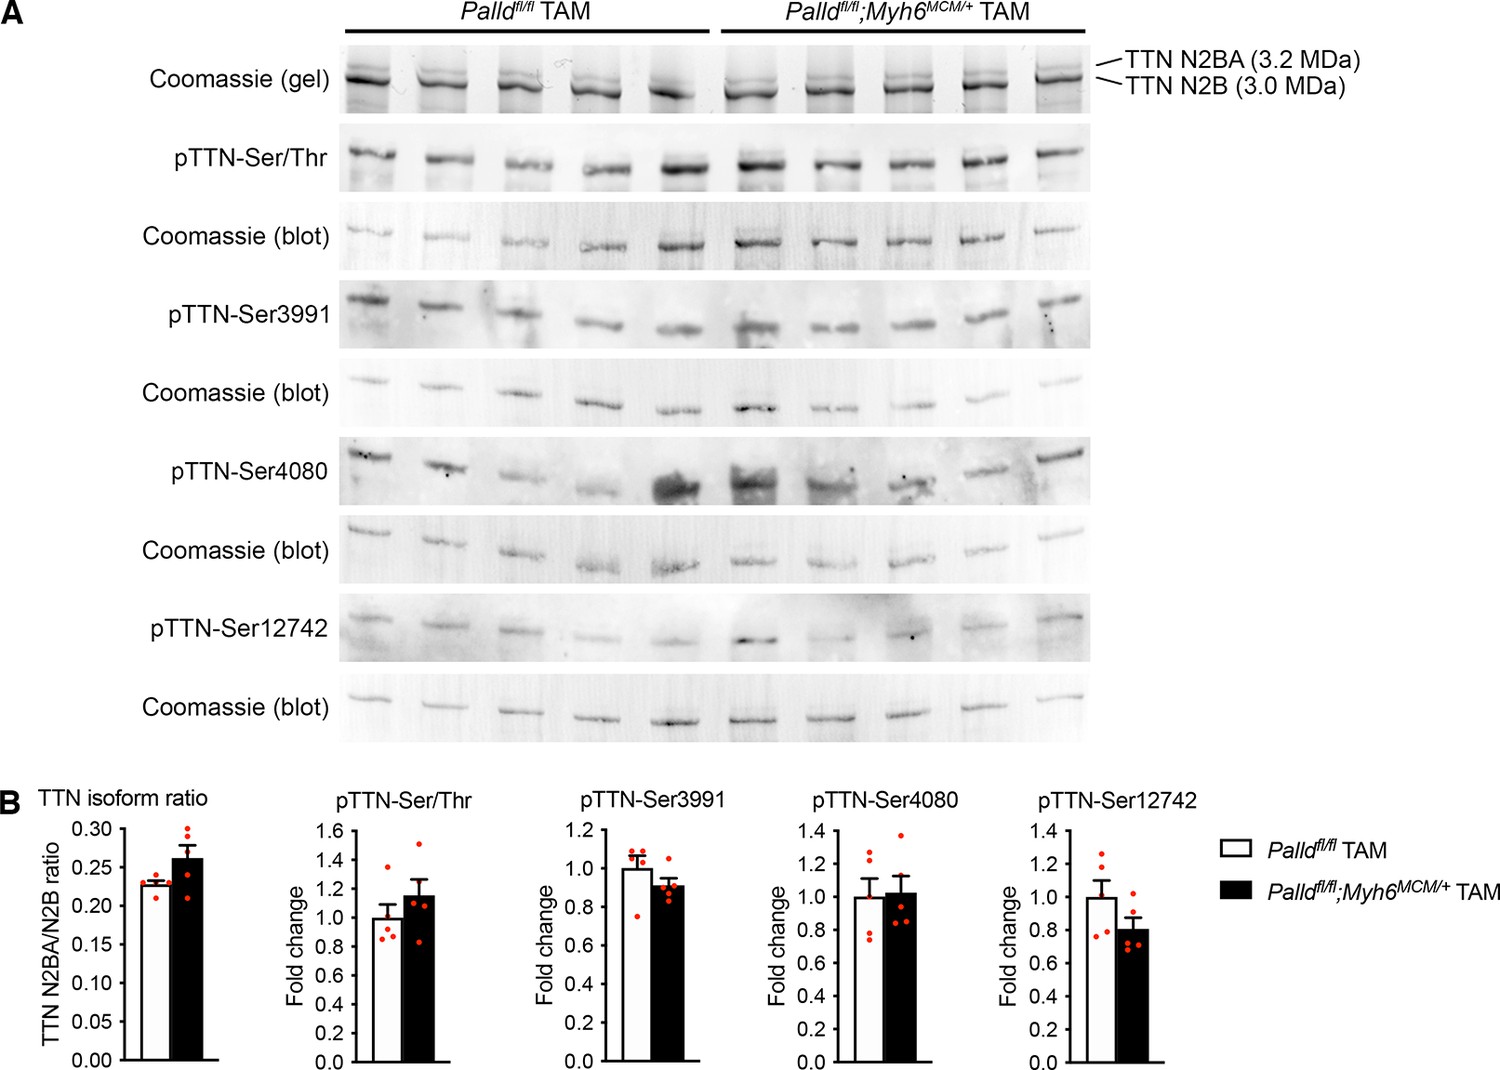
Titin isoform expression and phosphorylation in the left ventricular of inducible cardiomyocyte-specific palladin knockout (cPKOi) and control male mice 8 weeks after tamoxifen (TAM) induction.
(A) SDS-PAGE and Coomassie blue staining for titin (TTN) N2BA and N2B isoforms as well as western blot analyses using anti-phosphoserine/threonine antibody (pTTN-Ser/Thr) and titin phosphosite-specific antibodies against pTTN-Ser3991 (corresponding to human pTTN-Ser4010 in the N2Bus region), pTTN-Ser4080 (corresponding to human pTTN-Ser4099 in the N2Bus region), and pTTN-Ser12742 (corresponding to human pTTN-Ser11878 in the PEVK region). (B) Densitometric analysis of blots in (A) for titin (TTN) N2BA/N2B isoform ratio as well as titin serine/threonine phosphorylation and site-specific titin phosphorylation. Normalization was performed to total protein content as determined by Coomassie blue staining of each blot (n = 3 per group). No statistical differences by unpaired Student’s t-test. All data are represented as mean ± SEM.
-
Figure 6—figure supplement 4—source data 1
Uncropped western blots.
- https://cdn.elifesciences.org/articles/78629/elife-78629-fig6-figsupp4-data1-v2.pdf
Author response image 1
Tables
Table 1
Tension generation and relaxation in ventricular myofibrils from inducible cardiomyocyte-specific palladin knockout (cPKOi) mice and control male mice 8 wk after tamoxifen (TAM) induction.
| Myofibril batch | Resting conditions | Tension generation | Relaxation | ||||
|---|---|---|---|---|---|---|---|
| Slow phase | Fast phase | ||||||
| SL(µm) | RT(mN mm–2) | P0(mN mm–2) | kACT(s–1) | Duration(ms) | kREL(s–1) | kREL(s–1) | |
| Palldfl/fl TAM | 2.13 ± 0.02 (30) | 8.65 ± 1.03 (30) | 138 ± 7 (30) | 4.98 ± 0.30 (30) | 78.2 ± 3.9 (25) | 2.02 ± 0.22 (25) | 20.8 ± 2.2 (29) |
| Myh6MCM/+ TAM | 2.13 ± 0.02 (33) | 9.01 ± 1.02 (33) | 129 ± 9 (33) | 4.91 ± 0.28 (31) | 74.7 ± 3.5 (27) | 1.54 ± 0.19 (27) | 28.4 ± 2.8 (27) |
| Palldfl/fl;Myh6MCM/+ TAM | 2.14 ± 0.02 (23) | 9.67 ± 1.81 (23) | 111 ± 8 (23) | 4.83 ± 0.43 (23) | 86.5 ±4.8 (22) | 1.86 ± 0.19 (22) | 21.5 ± 1.2 (22) |
-
All data are represented as mean ± standard error of the mean (SEM). Numbers in parentheses are number of myofibrils. SL, sarcomere length, RT, resting tension, P0, maximum isometric tension; kACT, rate constant of tension rise following step-wise pCa decrease (8.0→4.5) by fast solution switching. Full tension relaxation kinetics were characterized by the duration and rate constant of tension decay of the isometric slow relaxation phase (slow kREL) and the rate constant of the fast relaxation phase (fast kREL).; one-way analysis of variance (ANOVA) with Šídák's multiple comparisons test. *p<0.05 vs. Palldfl/fl TAM.
Appendix 1—key resources table
| Reagent type (species) or resource | Designation | Source or reference | Identifiers | Additional information |
|---|---|---|---|---|
| Strain, strain background (male Mus musculus) | MYPN knockout (MKO) mice (C57BL/6J background) | Filomena et al., 2020 | N/A | |
| Strain, strain background (male M. musculus) | PALLD floxed mice (C57BL/6J background) | This paper | N/A | |
| Strain, strain background (male M. musculus) | Myh6-nuclear-Cre mice (C57BL/6J background) | Abel et al., 1999 | N/A | |
| Strain, strain background (male M. musculus) | Myh6-MerCreMer transgenic mice (C57BL/6J background) | The Jackson Laboratories | Cat# 005657 RRID:IMSR_JAX:005657 | |
| Strain, strain background (M. musculus) | C57BL/6J | The Jackson Laboratories | Cat# 000664; RRID:IMSR_JAX:000664 | |
| Strain, strain background (Escherichia coli) | DH5α electrocompetent cells | New England BioLabs | Cat# C2989K | |
| Strain, strain background (Saccharomyces cerevisiae) | Y2H Gold yeast strain | Takara Bio | Cat# 630498 | |
| Strain, strain background (S. cerevisiae) | L40 yeast strain | Takara Bio | N/A | |
| Strain, strain background (Homo sapiens) | HEK293 | ATCC | Cat# CRL-1573 | |
| Antibody | Anti-PALLD 622 (rabbit polyclonal) | Pogue-Geile et al., 2006; Goicoechea et al., 2010 | Kindly provided by Prof. Carol Otey, University of North Carolina, Chapel Hill, NC, USA | WB (1:500) IF (1:30) |
| Antibody | Anti-PALLD Proteintech (rabbit polyclonal) | Proteintech Group | Cat# 10853-1-AP | WB (1:1000) IF (1:30) |
| Antibody | Anti-PALLD 1E6 (mouse monoclonal) | Parast and Otey, 2000 Novus Biochemicals | Cat# NBP1-25959 | WB (1:1000) IF (1:20) |
| Antibody | Anti-PALLD 4D10 (mouse monoclonal) | Parast and Otey, 2000 | N/A | IF (1:10) |
| Antibody | Anti-MYPN (rabbit polyclonal) | Yamamoto et al., 2013 | N/A | WB (1:1000) |
| Antibody | Anti-nebulette (rabbit polyclonal) | Mastrototaro et al., 2015 | N/A | WB (1:200) IF (1:20) |
| Antibody | Anti-α-actinin (mouse monoclonal) | Merck Life Science | Cat# A7811; RRID:AB_476766 | WB (1:50000) IF (1:250) |
| Antibody | Anti-ANKRD1/CARP (rabbit polyclonal) | Miller et al., 2003 | N/A | WB (1:200) IF (1:20) |
| Antibody | Anti-Cypher (rabbit polyclonal) | Zhou et al., 1999 | Kindly provided by Prof. Ju Chen, University of California San Diego, La Jolla, CA, USA | WB (1:500) IF (1:20) |
| Antibody | Anti-MKL1/MRTF-A (rabbit polyclonal) | Santa Cruz Biotechnology | Cat# sc-21558 | WB (1:500) IF (1:20) |
| Antibody | Anti-MKL1/MRTF-A (rabbit polyclonal) | Immunological Sciences | Cat# AB-84312; RRID:AB_2892156 | WB (1:500) |
| Antibody | Calpain 3 (rabbit polyclonal) | König et al., 2003 | Kindly provided by Prof. Ahmed Ouali, QuaPA, INRA de Clermont Ferrand-Theix, St Genès Champanelle, France | WB (1:500) |
| Antibody | Anti-desmin (rabbit polyclonal) | Abcam | Cat# Ab8592; RRID:AB_306653 | IF (1:80) |
| Antibody | Anti-SORBS2 (mouse monoclonal) | Merck Life Science | Cat# SAB4200183; RRID:AB_10638778 | WB (1:750) IF (1:30) |
| Antibody | Anti-FHOD1 (goat polyclonal) | Santa Cruz Biotechnology | Cat# sc-46965; RRID:AB_2247011 | WB (1:500) IF (1:30) |
| Antibody | Anti-desmoplakin 1/2 (mouse monoclonal) | Bio-Rad Laboratories | Cat# 2722-5204; RRID:AB_619950 | WB (1:750) IF (1:20) |
| Antibody | Anti-N-cadherin (mouse monoclonal) | Cell Signaling Technology | Cat# 4061; RRID:AB_10694647 | WB (1:1000) IF (1:80) |
| Antibody | Anti-α-E-catenin (mouse monoclonal) | Santa Cruz Biotechnology | Cat# sc-9988; RRID:AB_626805 | WB (1:1000) IF (1:20) |
| Antibody | Anti-β-catenin (rabbit monoclonal) | Cell Signaling Technology | Cat# 8480; RRID:AB_11127855 | WB (1:1000) IF (1:25) |
| Antibody | Anti-γ-catenin/ plakoglobin (rabbit polyclonal) | Immunological Sciences | AB-90215; RRID:AB_2892157 | WB (1:1000) IF (1:20) |
| Antibody | Anti-vinculin (mouse monoclonal) | Merck Life Science | Cat# V9264; RRID:AB_10603627 | WB (1:2000) IF (1:80) |
| Antibody | Anti-desmocollin 2 (rabbit monoclonal) | Fitzgerald | Cat# 20R; RRID: DR004AB_1284102 | IF (1:50) |
| Antibody | Anti-desmoglein 1+2 (mouse monoclonal) | Fitzgerald | Cat# 10R-D105A; RRID:AB_1284107 | WB (1:500) IF (1:30) |
| Antibody | Anti-plakophilin 2 (mouse monoclonal) | Fitzgerald | Cat# 10R-P130B; RRID: AB_1288393 | IF (1:50) |
| Antibody | Anti-connexin 43 (mouse monoclonal) | Thermo Fisher Scientific | Cat# 35-5000; RRID:AB_87322 | WB (1:400) IF (1:50) |
| Antibody | Anti-Smad1/5-Ser463/465/Smad8-Ser426/428 (rabbit polyclonal) | Cell Signaling Technology | Cat# 9511; RRID:AB_331671 | WB (1:1000) |
| Antibody | Anti-PKCα (rabbit polyclonal) | Cell Signaling Technology | Cat# 2056; RRID:AB_2284227 | WB (1:1000) |
| Antibody | Anti-pPDK-Ser241 (rabbit polyclonal) | Cell Signaling Technology | Cat# 3438; RRID:AB_2161134 | WB (1:1000) |
| Antibody | Anti-Akt (rabbit polyclonal) | Cell Signaling Technology | Cat# 9272; RRID:AB_329827 | WB (1:1000) |
| Antibody | Anti-pAkt-Thr308 (rabbit polyclonal) | Cell Signaling Technology | Cat# 2965; RRID:AB_2255933 | WB (1:500) |
| Antibody | Anti-pAkt-Ser473 (rabbit polyclonal) | Cell Signaling Technology | Cat# 4060; RRID:AB_2315049 | WB (1:500) |
| Antibody | Anti-pGSK3β-Ser9 (rabbit polyclonal) | Cell Signaling Technology | Cat# 5558; RRID:AB_10013750 | WB (1:500) |
| Antibody | Anti-GSK3β (rabbit polyclonal) | Cell Signaling Technology | Cat# 9315; RRID:AB_490890 | WB (1:1000) |
| Antibody | Anti-pP70-Ser6K-Thr421/Ser424 (rabbit polyclonal) | Cell Signaling Technology | Cat# 9204; RRID:AB_2265913 | WB (1:500) |
| Antibody | Anti-P70-Ser6K (rabbit polyclonal) | Cell Signaling Technology | Cat# 2708; RRID:AB_390722 | WB (1:500) |
| Antibody | Anti-pMEK1/2-Ser217/221 (rabbit polyclonal) | Cell Signaling Technology | Cat# 9154; RRID:AB_2138017 | WB (1:500) |
| Antibody | Anti-pErk1/2-Thr202/Tyr204 (rabbit polyclonal) | Cell Signaling Technology | Cat# 4370; RRID:AB_2315112 | WB (1:500) |
| Antibody | Anti-Erk1/2 (mouse monoclonal) | Santa Cruz Biotechnology | Cat# sc-514302; RRID:AB_2571739 | WB (1:1000) |
| Antibody | Anti-pP38-Thr180/Tyr182 (rabbit polyclonal) | Cell Signaling Technology | Cat# 4631; RRID:AB_331765 | WB (1:500) |
| Antibody | Anti-P38α/β (mouse monoclonal) | Santa Cruz Biotechnology | Cat# sc-7972; RRID:AB_628079 | WB (1:500) |
| Antibody | Anti-phosphoserine/threonine (rabbit polyclonal) | ECM Biosciences | Cat# PP2551; RRID:AB 1184778 | WB (1:500) |
| Antibody | Anti-phosphoserine/ threonine (rabbit polyclonal) | ECM Biosciences | Cat# PP2551; RRID:AB_1184778 | WB (1:500) |
| Antibody | Anti-pTTN-Ser3991 (rabbit polyclonal) | Kötter et al., 2013 | N/A | WB (1:500) |
| Antibody | Anti-pTTN-Ser4080 (rabbit polyclonal) | Kötter et al., 2013 | N/A | WB (1:500) |
| Antibody | Anti-pTTN-Ser12742 (rabbit polyclonal) | Kötter et al., 2013 | N/A | WB (1:500) |
| Antibody | Anti-GAPDH (rabbit polyclonal) | Proteintech | Cat# 10494-1-AP; RRID:AB_2263076 | WB (1:15000) |
| Antibody | Goat anti-mouse IgG (H+L) Highly-cross Adsorbed Secondary antibody, Alexa Fluor 488-conjugated IgG (goat polyclonal) | Thermo Fisher Scientific | Cat# A11029; RRID:AB_138404 | IF (1:500) |
| Antibody | Goat anti-rabbit IgG (H+L) Highly-cross Adsorbed Secondary antibody, Alexa Fluor 488 (goat polyclonal) | Thermo Fisher Scientific | Cat# A11034; RRID:AB_2576217 | IF (1:500) |
| Antibody | Goat anti-mouse IgG (H+L) Highly-cross Adsorbed Secondary antibody, Alexa Fluor 568 (goat polyclonal) | Thermo Fisher Scientific | Cat# A11031; RRID:AB_144696 | IF (1:500) |
| Antibody | Goat anti-rabbit IgG (H+L) Highly-cross Adsorbed Secondary antibody, Alexa Fluor 568 (goat polyclonal) | Thermo Fisher Scientific | Cat# A11036; RRID:AB_10563566 | IF (1:500) |
| Antibody | Goat anti-mouse IgG (H+L) Highly-cross Adsorbed Secondary antibody, Alexa Fluor 647 (goat polyclonal) | Thermo Fisher Scientific | Cat# A21236; RRID:AB_2535805 | IF (1:500) |
| Antibody | Goat anti-rabbit IgG (H+L) Highly-cross Adsorbed Secondary antibody, Alexa Fluor 647 (goat polyclonal) | Thermo Fisher Scientific | Cat# A21245; RRID:AB_2535813 | IF (1:500) |
| Antibody | Goat anti-rabbit IgG Horseradish Peroxidase (HRP) (goat polyclonal) | Thermo Fisher Scientific | Cat# 31460; RRID:AB_228341 | WB (1:5000) |
| Antibody | Goat anti-mouse IgG-HRP (goat polyclonal) | Thermo Fisher Scientific | Cat# 31430; RRID:AB_228307 | WB (1:5000) |
| Antibody | Donkey anti-goat IgG-HRP (donkey polyclonal) | Santa Cruz Biotechnology | Cat# sc-2020; RRID:AB_631728 | WB (1:2000) |
| Recombinant DNA reagent | pGBKT7 DNA-BD vector | Takara Bio | Cat# 630443 | |
| Recombinant DNA reagent | pGADT7 AD vector | Takara Bio | Cat# 630442 | |
| Recombinant DNA reagent | Mate & Plate Human Heart library | Takara Bio | Cat# 630471 | |
| Recombinant DNA reagent | pGBKT7 human MYPN N-term start-Ig2 (bp 233–1798; aa. 1–522; NM_032578.3) | This paper | N/A | Cloning primers in Supplementary file 1 |
| Recombinant DNA reagent | pGBKT7 human MYPN C-term Ig3-end (bp 3044–4195; aa. 938–1320; NM_032578.3) | This paper | N/A | Cloning primers in Supplementary file 1 |
| Recombinant DNA reagent | pGBKT7 human MYPN full-length | This paper | N/A | Cloning primers in Supplementary file 1 |
| Recombinant DNA reagent | pGBKT7 human PALLD full-length | This paper | N/A | Cloning primers in Supplementary file 1 |
| Recombinant DNA reagent | pGBKT7 human PALLD N-term start-Ig2 (bp 212–1795; aa. 1–528; NM_001166108) | This paper | N/A | Cloning primers in Supplementary file 1 |
| Recombinant DNA reagent | pGBKT7 mouse PALLD C-term Ig3-end (bp 1146–2309; aa 267–680; BC127081) | This paper | N/A | Cloning primers in Supplementary file 1 |
| Recombinant DNA reagent | pGADT7-AD human CARP full-length | This paper | N/A | Cloning primers in Supplementary file 1 |
| Recombinant DNA reagent | pGADT7-AD human FHOD1 (bp 3005–3607, aa. 965–1164; NM_013241.2) | This paper | N/A | Cloning primers in Supplementary file 1 |
| Recombinant DNA reagent | pGADT7-AD human FHOD1 (bp3005-3268, aa. 965–1052; NM_013241.2) | This paper | N/A | Cloning primers in Supplementary file 1 |
| Recombinant DNA reagent | pGADT7-AD human FHOD1 (bp 3152–3607, aa. 1014–1164; NM_013241.2) | This paper | N/A | Cloning primers in Supplementary file 1 |
| Recombinant DNA reagent | pFN21A HaloTag CMV Flexi vector human PALLD full-length | This paper | N/A | Cloning primers in Supplementary file 1 |
| Recombinant DNA reagent | pNLF1-N [CMV Hygro] mouse FHOD1 Y2H clone (bp3106-3711, aa. 997–1197); NM_013468.3 | This paper | N/A | Cloning primers in Supplementary file 1 |
| Recombinant DNA reagent | pNLF1-C [CMV Hygro] mouse CARP (bp 64–1023; aa. 1–319; NM_013468.3) | This paper | N/A | Cloning primers in Supplementary file 1 |
| Sequence-based reagent | qRT-PCR primers | This paper | N/A | Supplementary file 1 |
| Commercial assay or kit | In-Fusion HD Cloning kit | Takara Bio | Cat# 639650 | |
| Commercial assay or kit | DC Protein Assay Kit II | Bio-Rad Laboratories | Cat# 5000112 | |
| Commercial assay or kit | Frozen-EZ Yeast Transformation II kit | Zymo Research | Cat# T2001 | |
| Commercial assay or kit | HaloTag NanoBRET 618 Ligand | Promega | Cat# G9801 | |
| Chemical compound, drug | Aureobasidin A | Takara Bio | Cat# 630499 | |
| Chemical compound, drug | X-α-Gal | Takara Bio | Cat# 630463 | |
| Chemical compound, drug | PureZOL RNA isolation reagent | Bio-Rad Laboratories | Cat# 7326890 | |
| Chemical compound, drug | High Capacity cDNA Reverse Transcription kit | Thermo Fisher Scientific | Cat# 4368814 | |
| Chemical compound, drug | SYBR Select Master Mix | Thermo Fisher Scientific | Cat# 4472903 | |
| Chemical compound, drug | Roche cOmplete Protease Inhibitor Cocktail | Thermo Fisher Scientific | Cat# 11697498001 | |
| Chemical compound, drug | Pierce Phosphatase Inhibitor Mini Tablets | Thermo Fisher Scientific | Cat# A32957 | |
| Chemical compound, drug | Immobilon Western Chemiluminescent HRP Substrate | Merck Life Science | Cat# WBKLS0500 | |
| Chemical compound, drug | Rhodamine phalloidin | Thermo Fisher Scientific | Cat# R415 | IF (1:100) |
| Chemical compound, drug | Wheat Germ Agglutinin, Alexa Fluor 594 Conjugate | Thermo Fisher Scientific | Cat# W11262 | IF (1:500) |
| Chemical compound, drug | VECTASHIELD Vibrance Antifade Mounting Medium with DAPI | D.B.A Italia Srl. | Cat# H-1800-10 | |
| Chemical compound, drug | Liberase Blendzyme | Roche Diagnostics | Cat# 11988468001 | |
| Chemical compound, drug | Fura-2, AM, cell permeant | Thermo Fisher Scientific | Cat# F1201 | |
| Software, algorithm | Prism, version 7.0 | GraphPad Software Inc. | https://www.graphpad.com/scientific-software/prism/ RRID:SCR_002798 | |
| Software, algorithm | Fiji (ImageJ) analysis software, version 2.0.0-rc-69/1.52p | National Institute of Health (NIH) | https://fiji.sc/ RRID:SCR_002285 | SparkMaster plugin used for Ca2+ spark analysis |
| Software, algorithm | NT Affinity Analysis software, version 2.0.1334 | NanoTemper Technologies | N/A | |
| Software, algorithm | Ion Wizard, software, version 6.6.11 | IonOptix B.V. | N/A |
Additional files
-
Supplementary file 1
Oligos used for quantitative real-time PCR (qRT-PCR) and clonings.
- https://cdn.elifesciences.org/articles/78629/elife-78629-supp1-v2.docx
-
MDAR checklist
- https://cdn.elifesciences.org/articles/78629/elife-78629-mdarchecklist1-v2.docx
Download links
A two-part list of links to download the article, or parts of the article, in various formats.
Downloads (link to download the article as PDF)
Open citations (links to open the citations from this article in various online reference manager services)
Cite this article (links to download the citations from this article in formats compatible with various reference manager tools)
Ablation of palladin in adult heart causes dilated cardiomyopathy associated with intercalated disc abnormalities
eLife 12:e78629.
https://doi.org/10.7554/eLife.78629


