CXCR4high megakaryocytes regulate host-defense immunity against bacterial pathogens
- Department of Endocrinology & Metabolism, The Third Affiliated Hospital, Sun Yat-sen University, China
- RNA Biomedical Institute, Sun Yat-sen Memorial Hospital, Sun Yat-sen University, China
- Key Laboratory of Stem Cells and Tissue Engineering, Zhongshan School of Medicine, Sun Yat-sen University, Ministry of Education, China
Figures
Figure 1 with 6 supplements
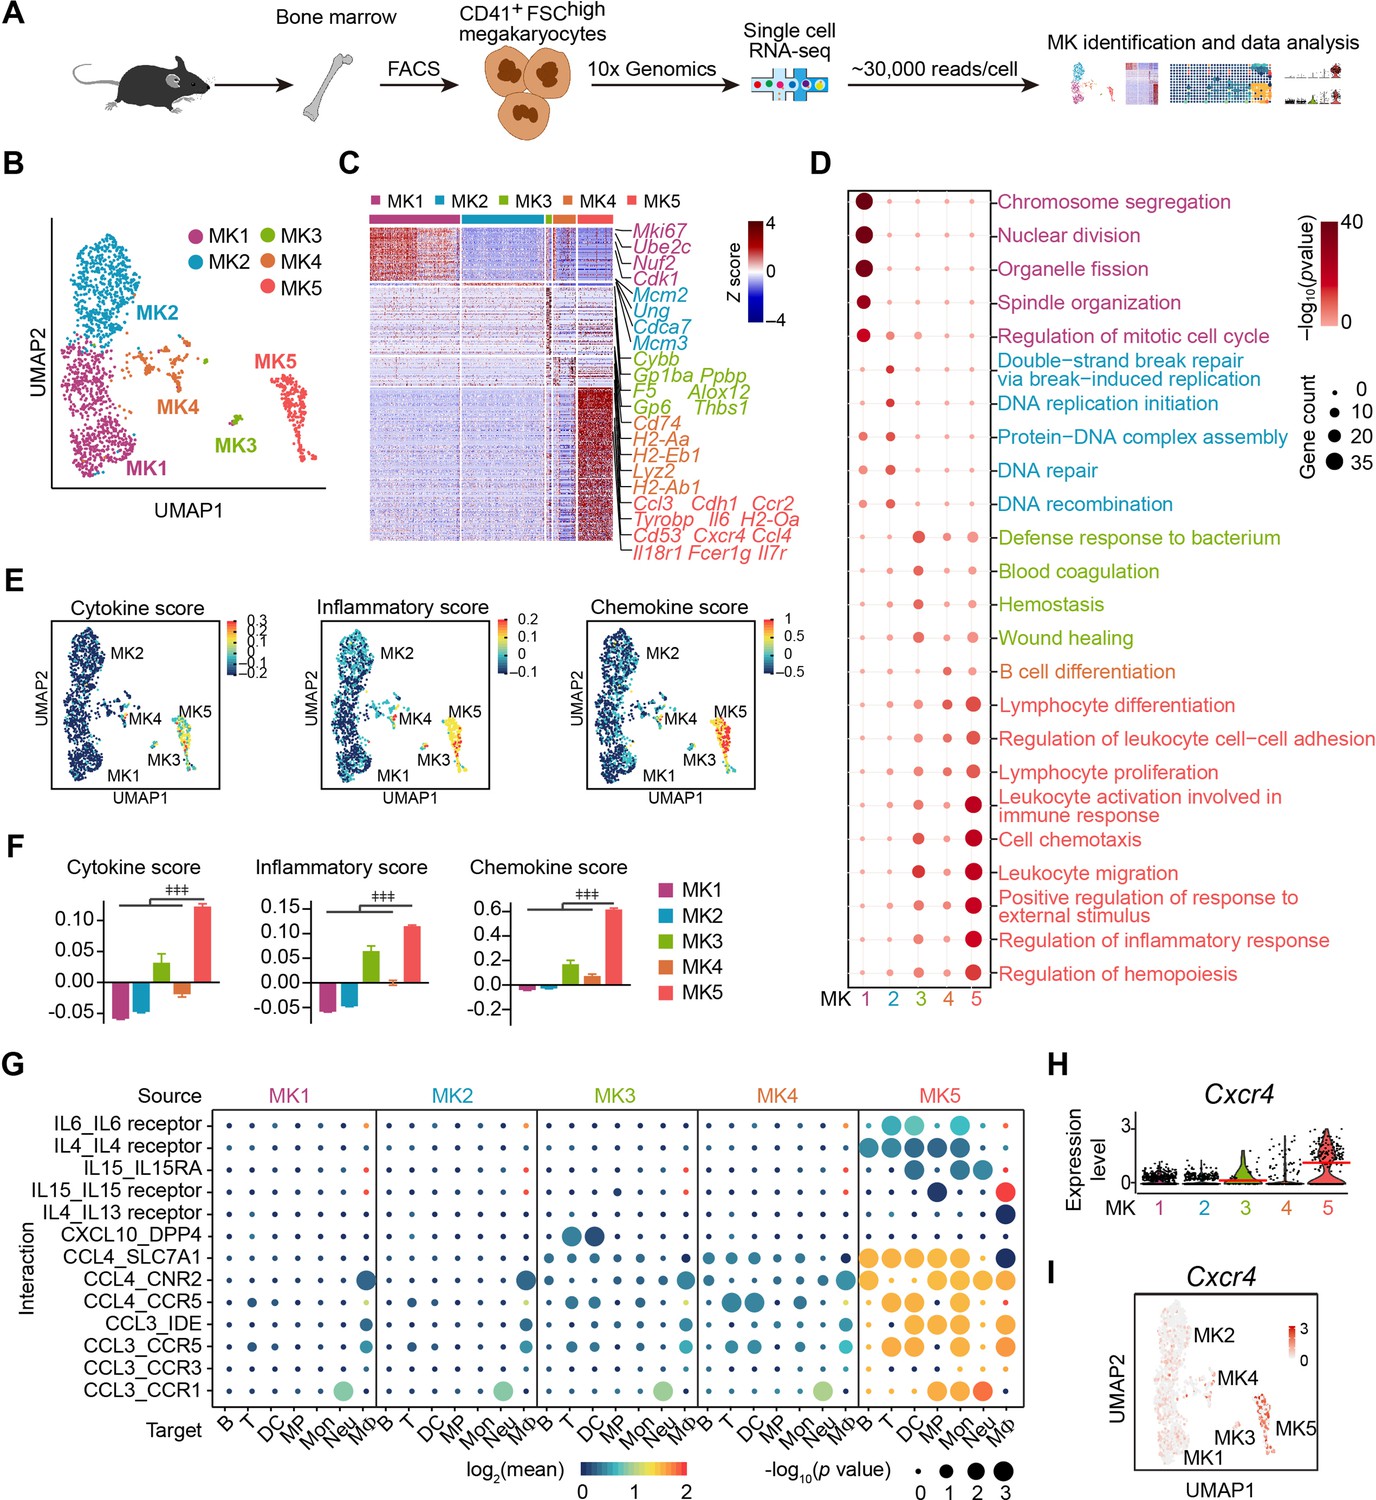
Single-cell atlas identifies an immune-modulatory subpopulation of MKs.
(A) Schematic strategy for MK preparation, scRNA-seq and data analysis. (B) Clustering of 1712 bone marrow MKs. (C) Heatmap of signature gene expression in MK subpopulations (fold-change >1.5, p value <0.05) with exemplar genes listed on the right (top, color-coded by subpopulations). Columns denote cells; rows denote genes. Z score, row-scaled expression of the signature genes in each subpopulation. (D) Gene Ontology (GO) analysis of signature genes (fold-change >1.5, p value <0.05) for each MK subpopulations. GO terms selected with Benjamini–Hochberg-corrected p values <0.05 and colored by –log10(p value). Bubble size indicates the enriched gene number of each term. (E–F) UMAP visualization (E) and statistical analysis (F) of cytokine score (left), inflammatory score (middle) and chemokine score (right) in MK1 to 5. (G) Dotplots of significant cytokine ligand (source) -receptor (target) interactions between MKs and immune cells discovered. The color indicates the means of the receptor-ligand pairs between two cell types and bubble size indicates p values. Mon, monocytes; MΦ, macrophages (Dong et al., 2020); DC, dendritic cells; Neu, neutrophils; MP, myeloid progenitors; T, T cells; B, B cells. (H–I) Violin plot (H) and feature plot (I) of selected signature genes of MK5. Red lines in (H) indicate the median gene expression. Repeated-measures one-way ANOVA followed by Dunnett’s test for multiple comparisons in (F), ǂǂ <0.01, ǂǂǂ p<0.001.
-
Figure 1—source data 1
Signature genes of MK1 to MK5.
- https://cdn.elifesciences.org/articles/78662/elife-78662-fig1-data1-v2.xlsx
-
Figure 1—source data 2
The means and p value of the average expression level of interacting molecule 1 in cluster 1 and interacting molecule 2 in cluster 2 by CellPhoneDB.
- https://cdn.elifesciences.org/articles/78662/elife-78662-fig1-data2-v2.xlsx
Figure 1—figure supplement 1
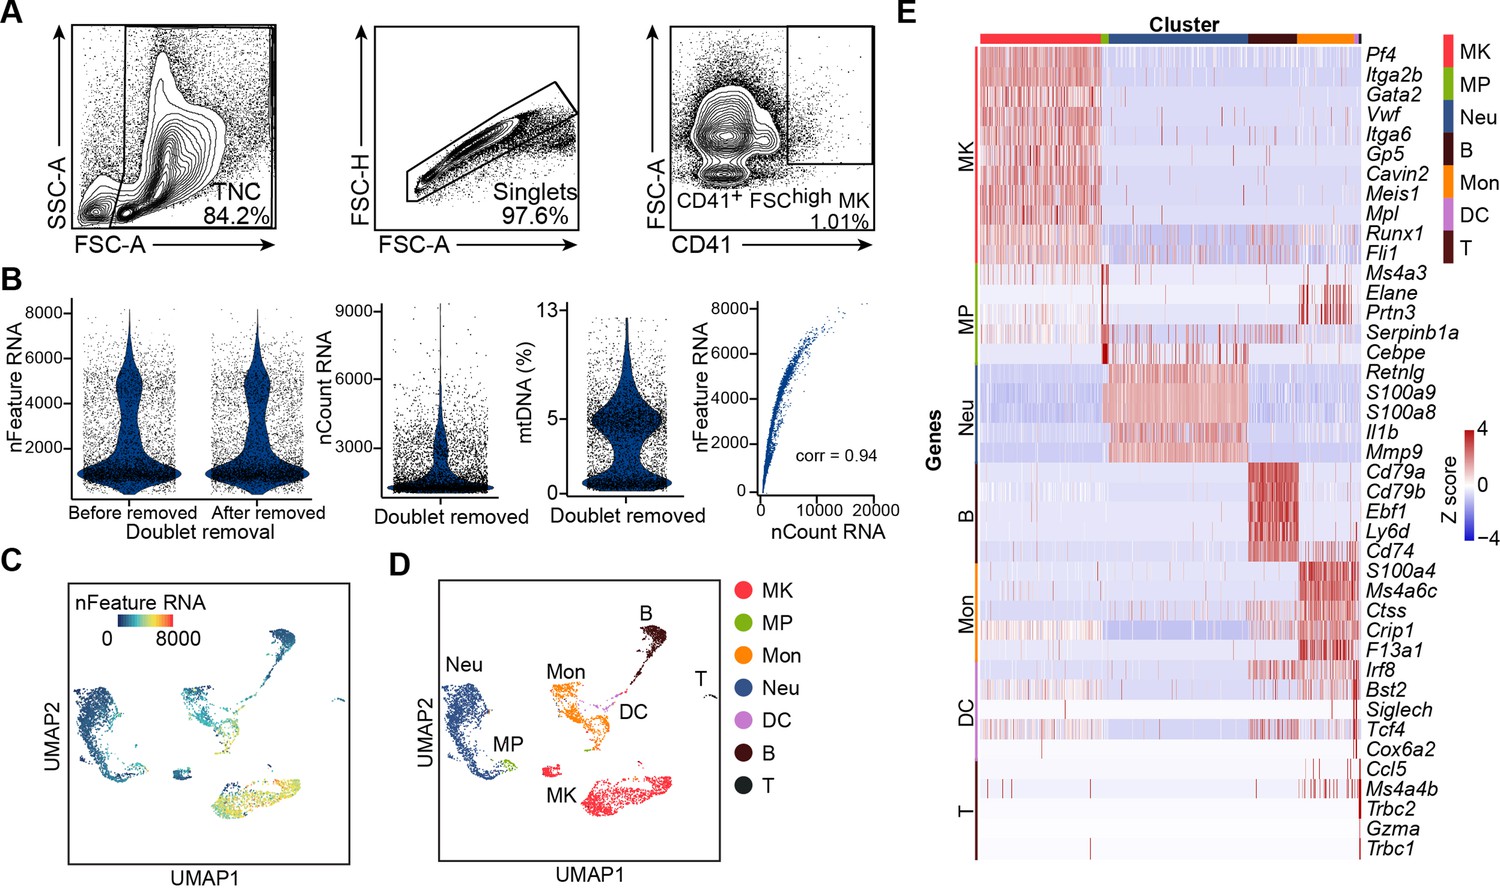
Cell isolation, quality control and annotation of scRNA-seq data.
(A) Flow cytometry gating for isolation of MKs (CD41+ FSChigh) in bone marrow for scRNA-seq. (B) Quality control of scRNA-seq data. Violin plots showing the number of unique genes (gene number) before and after removing doublets, number of total unique molecular identifiers (UMI counts) and percentage of mitochondrial transcripts in single cells after removing doublets. Scatter plot showing the correlation between UMI counts and gene numbers. corr indicates Pearson correlation coefficient. (C–D) UMAP of 5368 bone marrow cells, colored by gene numbers (C) and by cluster identity indicated on the right (D). MK, megakaryocytes; Neu, neutrophils; MΦ, macrophages; MP, myeloid progenitors; DC, dendritic cells; Mon, monocytes; B, B cells; T, T cells. (E) Heatmap of row-scaled signature gene expression in each cell type (top, color-coded by subpopulations). Columns denote cells; rows denote genes. Z score, row-scaled expression of the signature genes in each subpopulation. (F) Feature plots showing selected gene expression. (G) Violin plots showing the number of unique genes (gene number) of 1712 MKs.
Figure 1—figure supplement 2

Cell type identification by alignment with published scRNA-seq data.
(A) Radar charts showing cell similarities of our single cell dataset with the published bone marrow MK single cells (Pariser et al., 2021; Yeung et al., 2020), bone marrow immune cells and myeloid progenitor single cells (Almanzar et al., 2020; Hamey et al., 2021; Xie et al., 2020) using MetaNeighbor R package. (B) Comparison of our bone marrow scRNA-seq data with published bone marrow MK (Pariser et al., 2021; Yeung et al., 2020) and immune cell (Almanzar et al., 2020; Hamey et al., 2021; Xie et al., 2020) datasets. All cells were integrated by iMAP.py and projected on UMAP. (C) Column-scaled Euclidean distances between the centroid of each cluster. Z score, column-scaled Euclidean distance. MK, megakaryocytes; Neu, neutrophils; MΦ, macrophages; MP, myeloid progenitors; DC, dendritic cells; Mon, monocytes; B, B cells; T, T cells.
Figure 1—figure supplement 3
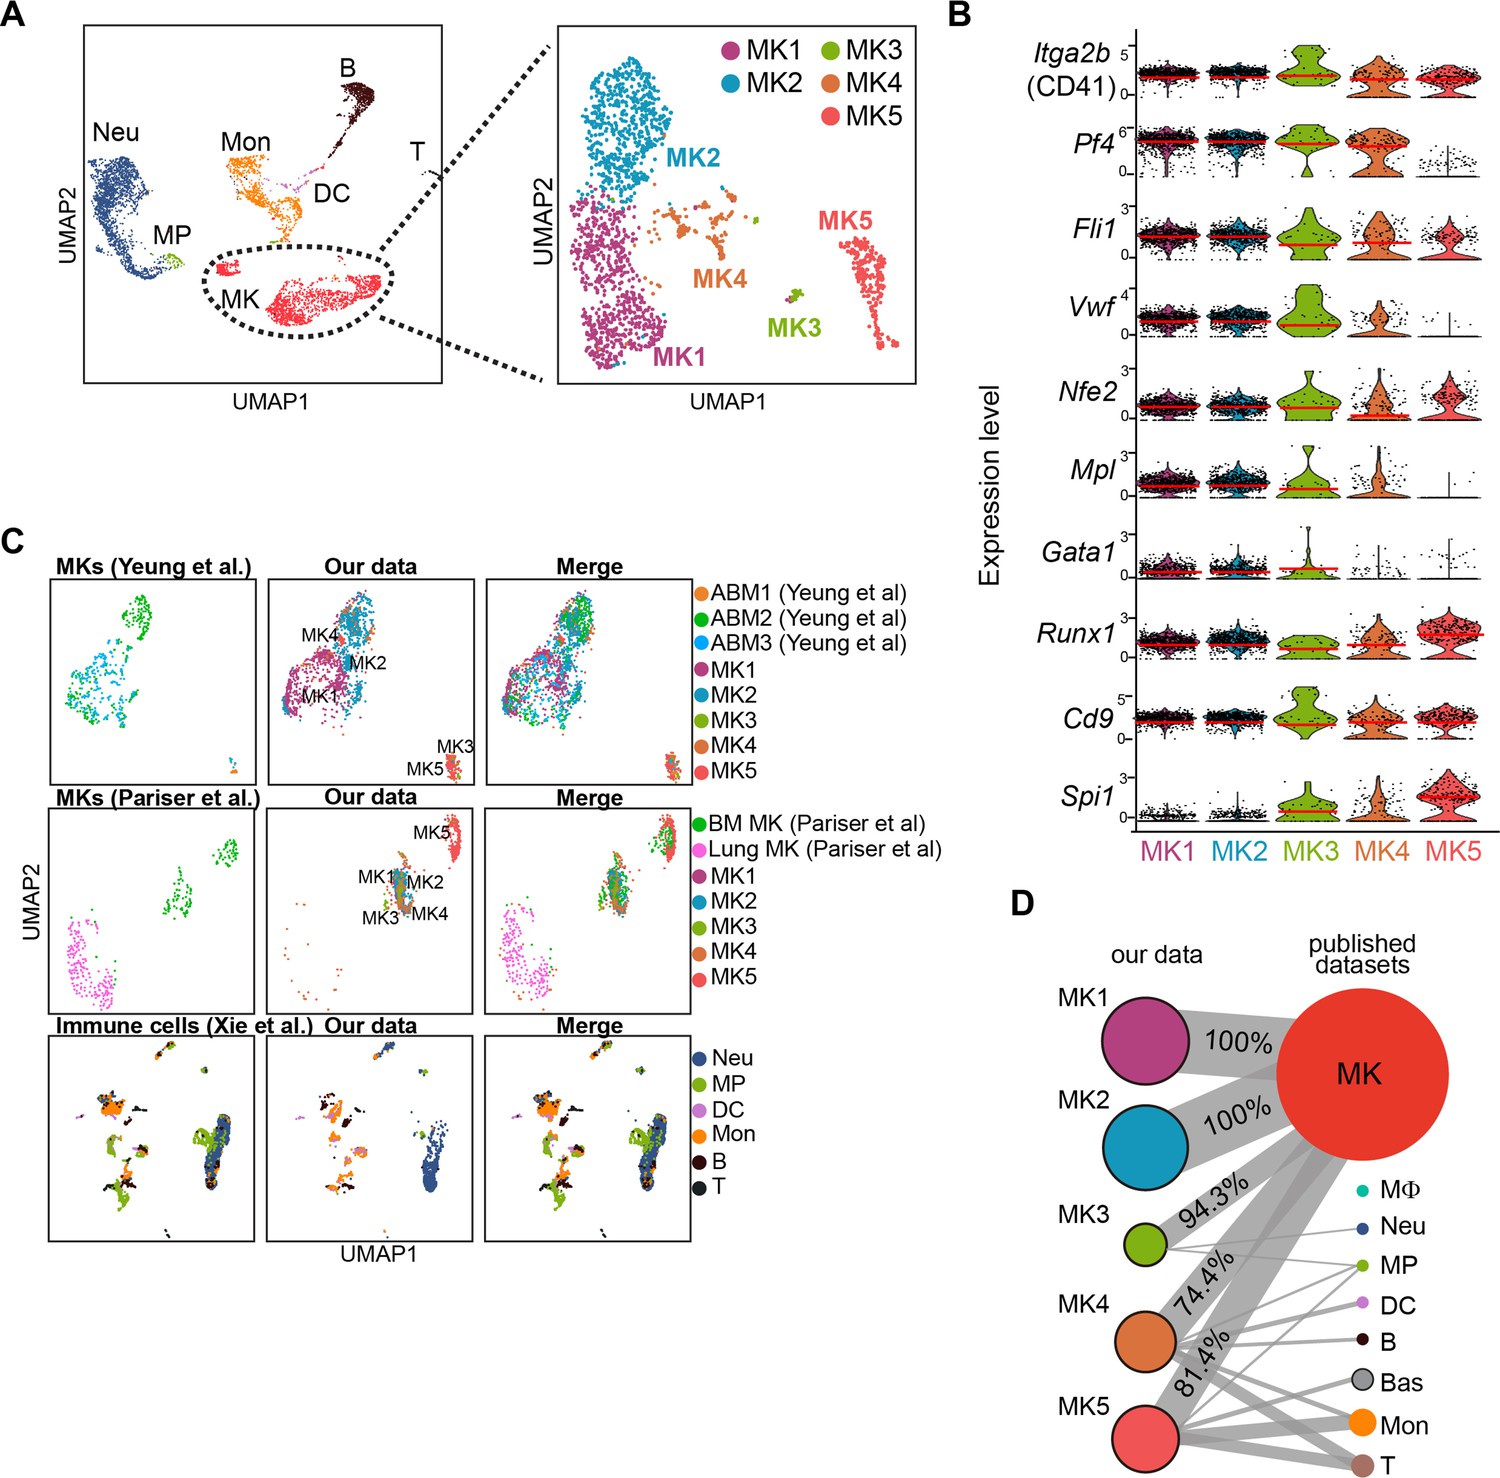
Identification of MK subpopulations.
(A) Re-clustering of 1712 MKs from 5368 cells. (B) Violin plots showing MK marker gene expression (Aburima et al., 2021; Bernardes et al., 2020; Kanaji et al., 2005; Liu et al., 2021; Couldwell and Machlus, 2019; Ozaki et al., 2005; Sun et al., 2021; Yeung et al., 2020) of MK1 to 5. Red lines indicate the median gene expression. (C) Projection of our datasets on reported MK (Pariser et al., 2021; Yeung et al., 2020) and immune cell (Hamey et al., 2021; Xie et al., 2020) scRNA-seq datasets by Symphony R package. MK, megakaryocytes; Neu, neutrophils; MΦ, macrophages; MP, myeloid progenitors; DC, dendritic cells; Mon, monocytes; Bas, basophils; B, B cells; T, T cells; ABM, adult bone marrow. (D) MKs (MK1 to 5) and cell types projection based on similarities of our single-cell transcriptional profiles and published MK (Pariser et al., 2021; Yeung et al., 2020) and immune cell datasets (Hamey et al., 2021; Xie et al., 2020) by scmap R package.
Figure 1—figure supplement 4

Enriched genes in MK1 to 4 and MK5.
(A) Volcano plot showing MK5 and MK1 to 4 enriched genes (|fold change|>1.4, p value <0.05). (B–C) Gene Ontology (GO) analysis showing MK5 enriched immune pathway genes and MK1 to 4 mainly enriched hemopoiesis and RNA processing pathway genes. (D–F) Gene set enrichment analysis (GSEA) evaluated enrichment of selected pathways in MK5 cells compared to other MK subpopulations (MK1 to 4).
Figure 1—figure supplement 5
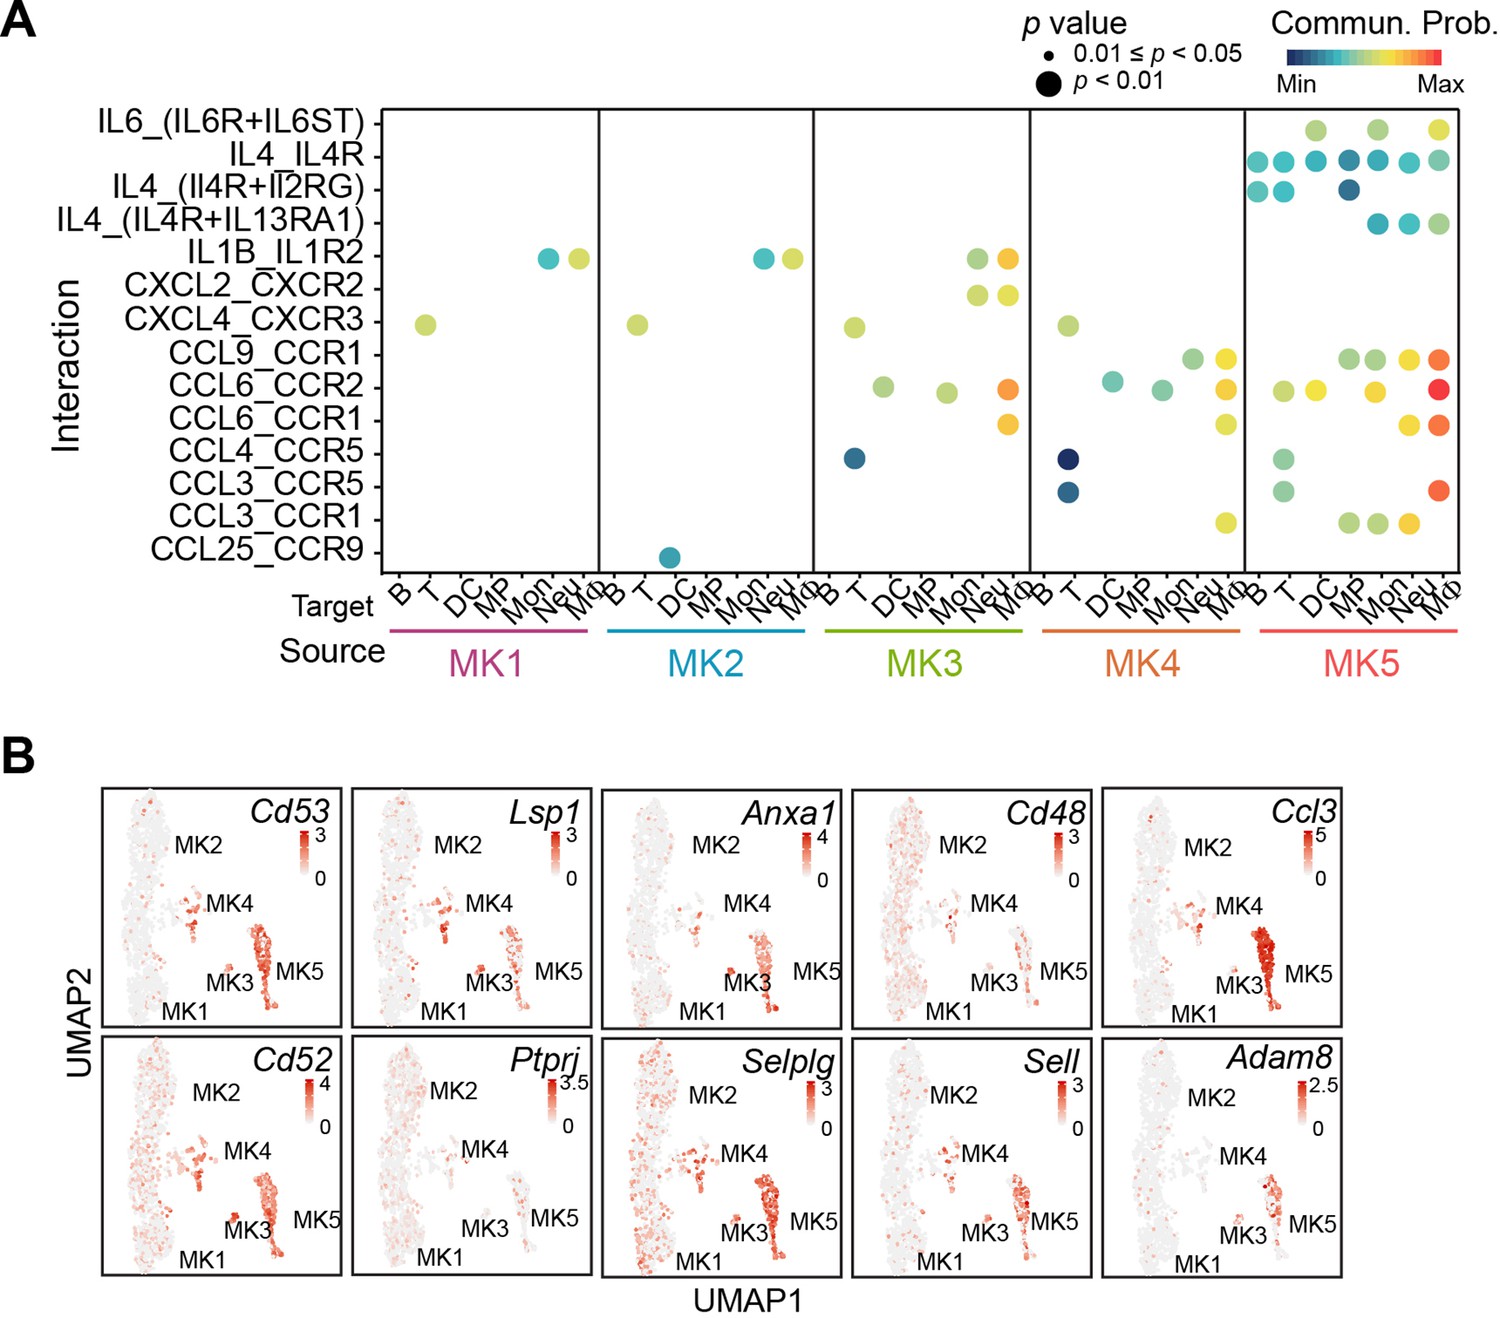
MK5 interacts with immune cells and express signature genes of immune MKs.
(A) Dotplots of significant cytokine ligand (source) -receptor (target) interactions between MKs and immune cells discovered using CellChat. Color indicates communication probabilities, and bubble size indicates p value of the ligand-receptor pairs between MK subpopulations (source) and immune cells (target). (B) Selected signature gene expression in MK subpopulations.
Figure 1—figure supplement 6
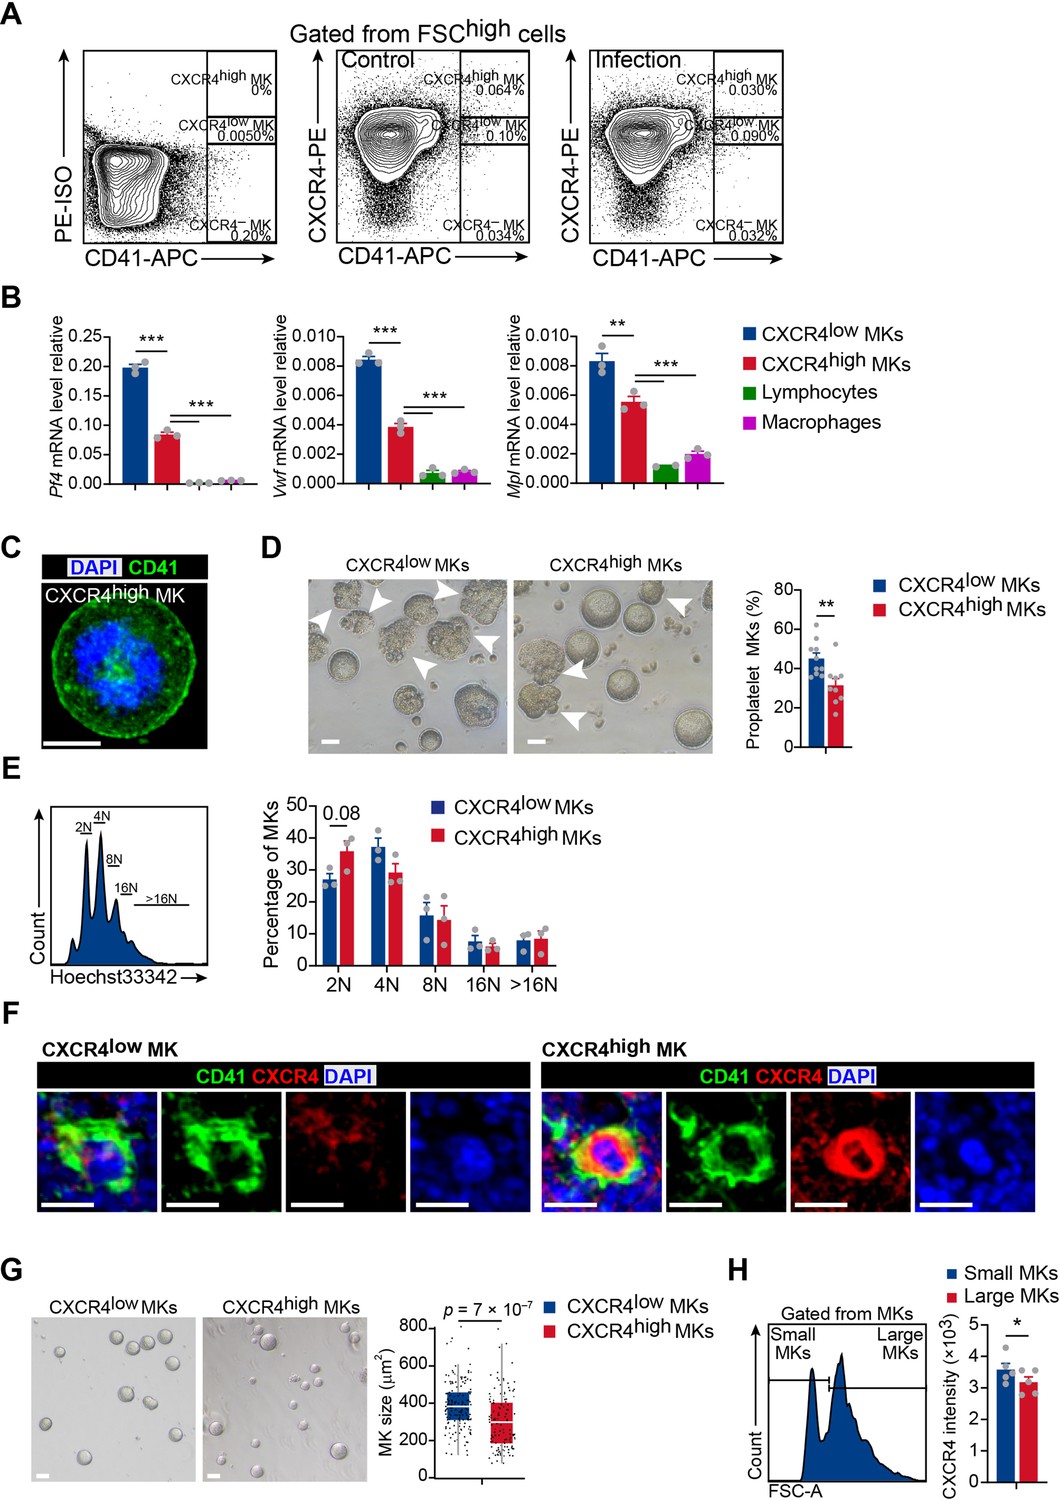
Polyploidy, platelet generation ability and cell size of CXCR4low and CXCR4high MKs.
(A) Representative flow cytometry plots of gating strategy of CD41 and CXCR4 in the bone marrow of control mice and mice 3 days after L. monocytogenes infection. (B) Relative expression of Pf4, Vwf and Mpl in CXCR4high and CXCR4low MKs by RT-qPCR. (C) Representative immunofluorescent staining image showing membranous CD41 staining typical of sorted bone marrow CXCR4high MKs. (D) Sorted CXCR4low and CXCR4high MKs produced proplatelets in vitro on day five post cultured under 100 ng ml–1 TPO. White arrowheads indicate proplatelet formation. (E) Polyploidy distribution of CXCR4low MKs and CXCR4high MKs (right). (F) Representative immunofluorescent staining images showing CD41 and CXCR4 expression of CXCR4low and CXCR4high MKs in the bone marrow. CD41, green; CXCR4, red; DAPI, blue. (G) Comparison of cell size between CXCR4low MKs and CXCR4high MKs on day three post cultured under 100 ng ml–1 Thrombopoietin (TPO). (H) Median fluorescence intensity of CXCR4 in small and large sizes of MKs by flow cytometry. Scale bars, 20µm. Data represent mean ± s.e.m in (B, D, E, H) or mean ±first and third quartiles in (G). Two-sample KS test was performed to assess statistical significance in (G). Two-tailed Student’s t-test was performed to assess statistical significance in (B, D, E, H). * p<0.05, ** p<0.01, *** p<0.001.
Figure 2 with 2 supplements
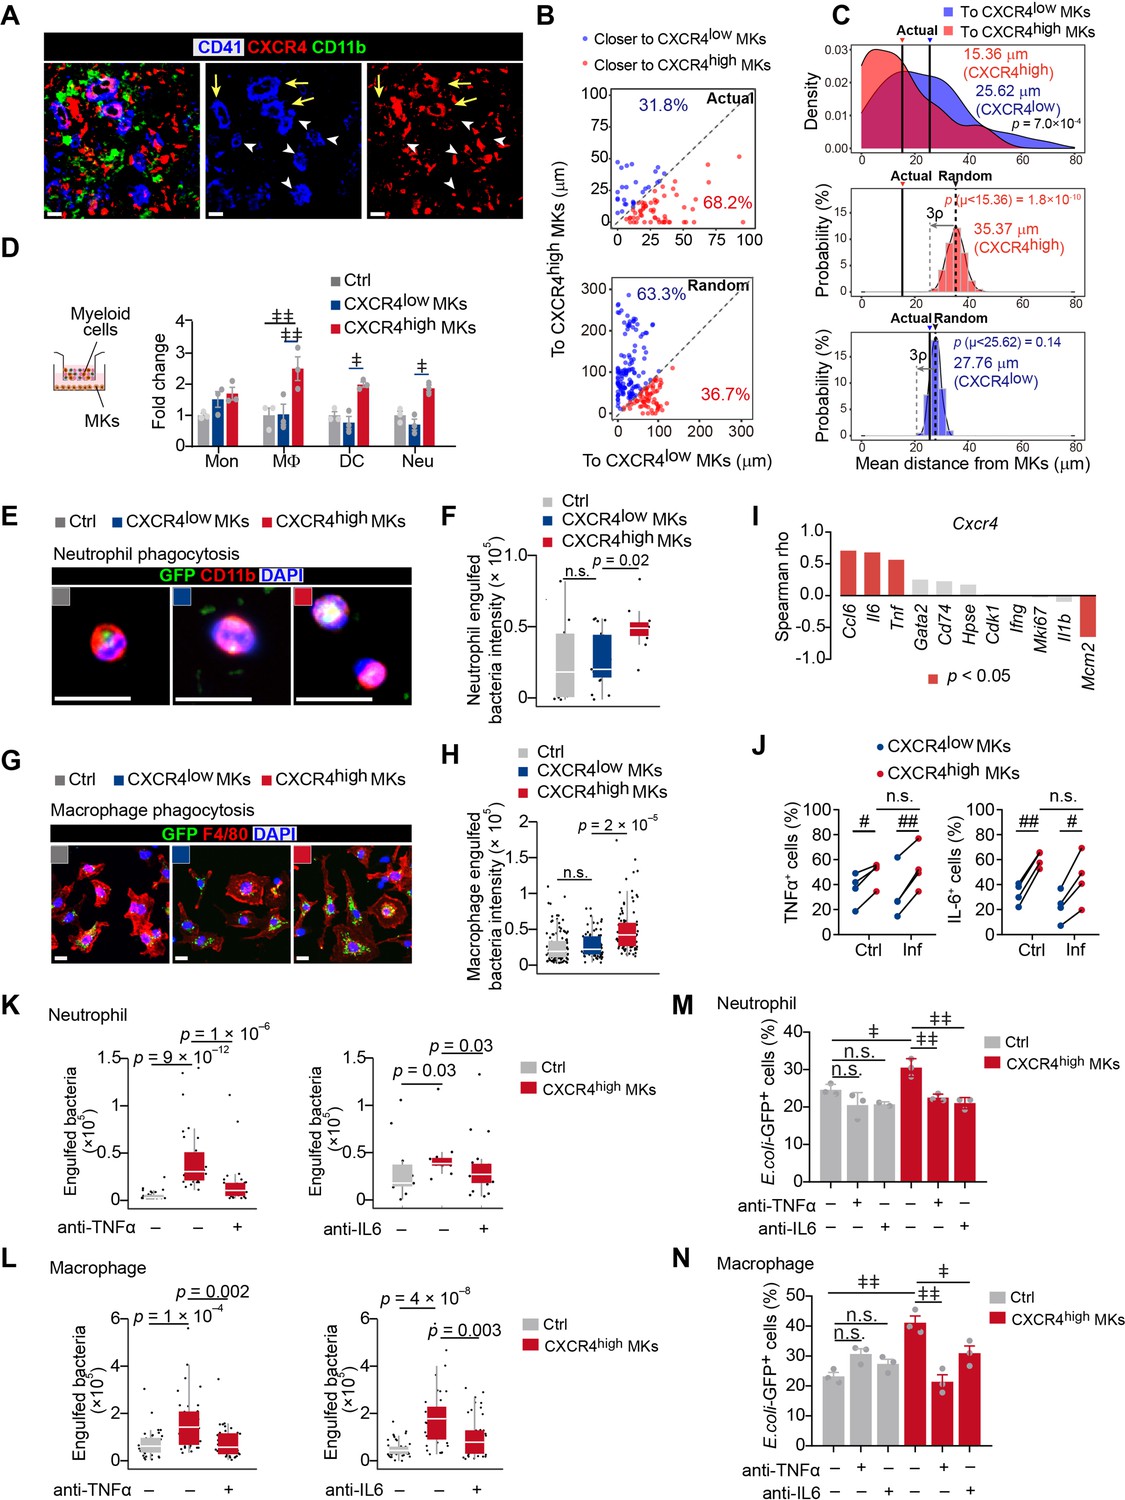
CXCR4high MKs enhance myeloid cell mobility and bacteria phagocytosis.
(A) Distribution of myeloid cells to CXCR4low or CXCR4high MKs 3 days after L. monocytogenes infection. Representative images of MKs (blue), CXCR4 (red), and myeloid cells (green) in mouse bone marrow. Yellow arrows indicate CXCR4high MKs and white arrowheads indicate CXCR4low MKs. (B–C) Distance (B) and mean distance (C) of actual or randomly positioned myeloid cells to the closest CXCR4low and CXR4high MKs 3 days after L. monocytogenes infection. (D) Numbers of transmigrated myeloid cells normalized to Ctrl (without MKs in the lower chambers) as indicated by transwell assays. Mon, monocytes; MΦ, macrophages; DC, dendritic cells; Neu, neutrophils. (E–F) Representative images (E) and quantification (F) of neutrophil phagocytosis capacity with or without MK co-culture as indicated. CD11b, red; E. coli, green; DAPI, blue. Ctrl, neutrophil without MK co-culture. (G–H) Representative images (G) and quantification (H) of macrophage phagocytosis capacity with or without MK co-culture as indicated. F4/80, red; E. coli, green; DAPI, blue. Ctrl, macrophage without MK co-culture. (I) Spearman correlation analysis between expression profiles of Cxcr4 and feature genes in MK subpopulations. (J) Quantification of TNFα+ and IL-6+ cells in CXCR4low MKs and CXCR4high MKs from control mice or mice 3 days after L. monocytogenes infection. (K–L) Quantification of neutrophil (K) and macrophage (L) phagocytosis with or without CXCR4high MK co-culture in the absence or presence of anti-TNFα or anti-IL-6 neutralizing antibodies. (M–N) Quantification of the phagocytosis abilities by neutrophils (M) and macrophages (N) with or without CXCR4low MK or CXCR4high MK co-culture in the absence or presence of anti-TNFα or anti-IL-6 neutralizing antibodies by flow cytometry. Ctrl, neutrophils (M) or macrophages (N) without MKs co-culture. Scale bars, 20 μm (A, E, G). Data represent mean ± s.e.m (D) and boxplots show medians, first and third quartiles (F, H, K–L). Repeated-measures one-way ANOVA followed by Dunnett’s test for multiple comparisons in (D, M, N), ǂ p<0.05, ǂǂ p<0.01, n.s., not significant. A two-sample KS test was performed to assess statistically significant (C, F, H, K, L), n.s., not significant. Paired Student’s t-test was performed to assess statistical significance (J), # p<0.05, ## p<0.01, n.s., not significant.
-
Figure 2—source data 1
Distance of actual myeloid cells to the closest CXCR4low and CXR4high MKs 3 days after L. monocytogenes infection.
- https://cdn.elifesciences.org/articles/78662/elife-78662-fig2-data1-v2.xlsx
-
Figure 2—source data 2
Distance of randomly positioned myeloid cells to the closest CXCR4low and CXR4high MKs 3 days after L. monocytogenes infection.
- https://cdn.elifesciences.org/articles/78662/elife-78662-fig2-data2-v2.xlsx
-
Figure 2—source data 3
Mean distance of randomly positioned myeloid cells to the closest CXCR4low and CXR4high MKs 3 days after L. monocytogenes infection from 500 times simulations.
- https://cdn.elifesciences.org/articles/78662/elife-78662-fig2-data3-v2.xlsx
Figure 2—figure supplement 1
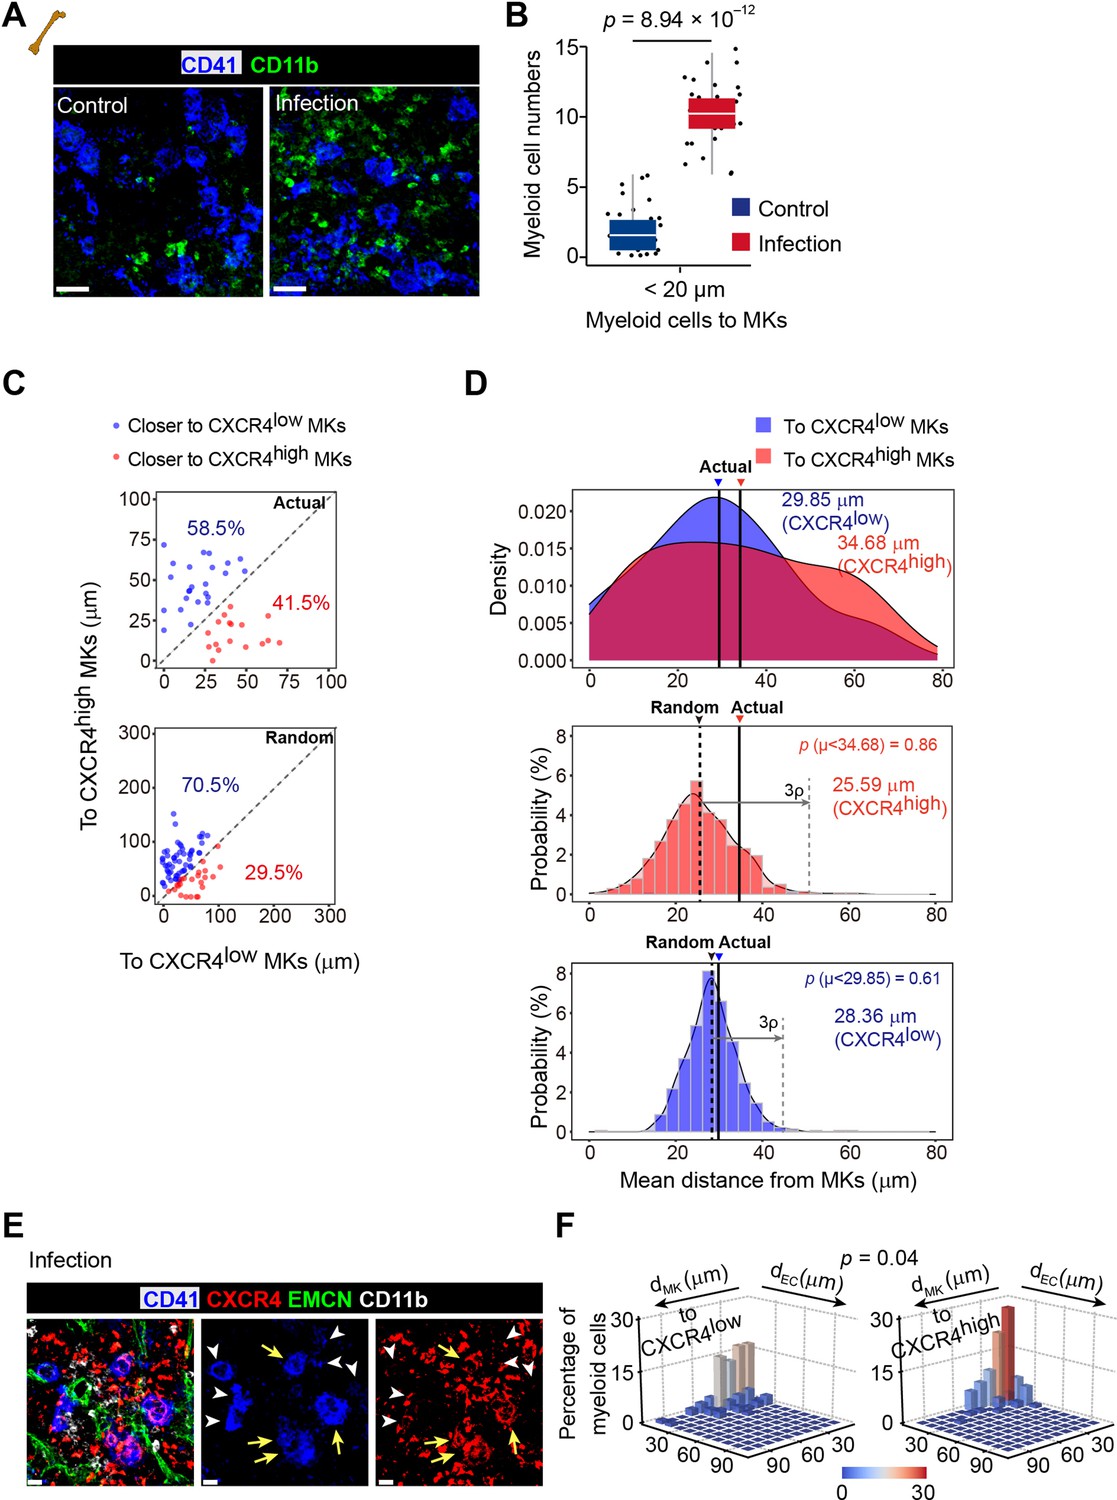
L. monocytogenes promote myelopoiesis and the association of myeloid cells and the CXCR4high MK-blood vessel intersection.
(A–B) Representative immunofluorescent staining image (A) and statistical analysis (B) showing association of MKs (blue) and myeloid cells (green) in the bone marrow of control mice and mice 3 days after L. monocytogenes infection (n=30 control and infected MKs). CD41, blue; CD11b, green. (C–D) Distance (C) and mean distance (D) of actual or randomly positioned myeloid cells to the closest CXCR4low Mks and CXR4high MKs from mice without infection. (E–F) Representative images of MKs (blue), CXCR4 (red), vascular endothelial cells (green) and myeloid cells (white) (E), and statistical analysis (F) in bone marrow showing the distribution of myeloid cells to CXCR4low or CXCR4high MKs and vascular cells 3 days after L. monocytogenes infection. CD41, blue; CXCR4, red; EMCN, green; CD11b, white. Yellow arrows indicate CXCR4high MKs and white arrowheads indicate CXCR4low MKs (left) and two-dimensional probability distribution of distances from myeloid cells to CXCR4low or CXCR4high MKs and vascular cells (n=104 CD11b+ cells; p=0.04 by 2D KS test). Scale bars, 20µm. Boxplots show medians, first and third quartiles in (B). Two-sample KS test was performed to assess statistical significance in (B, D). Two-dimensional-two-sample KS test was performed to assess statistical significance in (F).
Figure 2—figure supplement 2
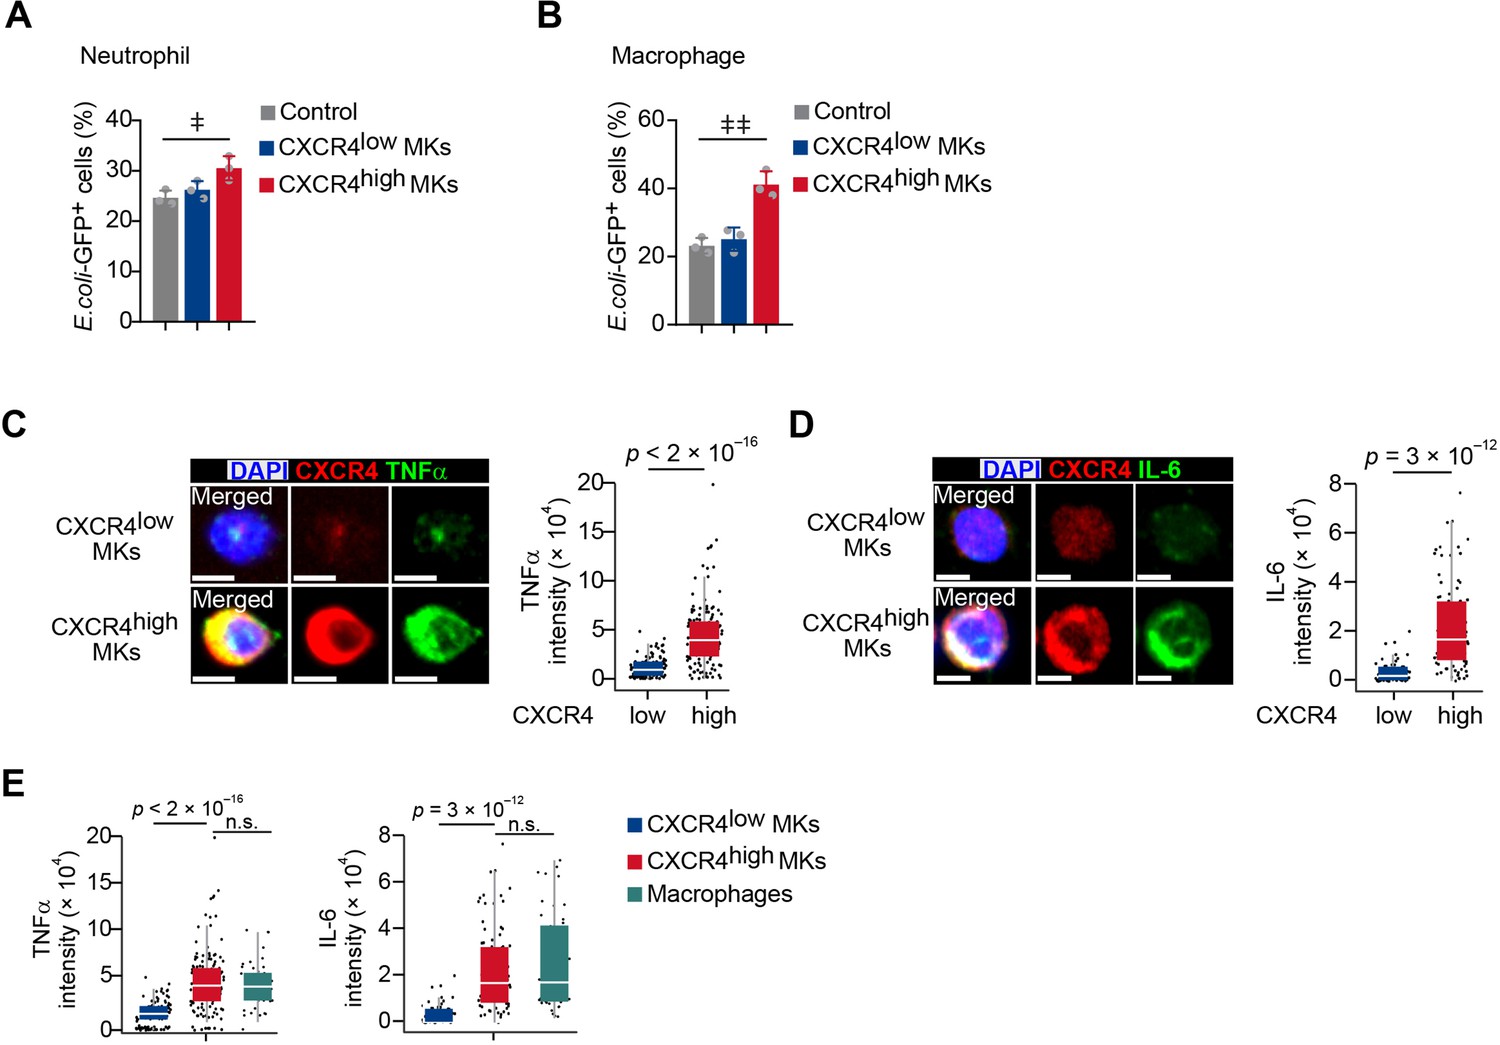
CXCR4high MKs promote myeloid cell phagocytosis and produce TNFα and IL-6.
(A–B) Quantification of phagocytosis abilities in neutrophils (A) and macrophages (B) without or with CXCR4low MKs or CXCR4high MKs as indicated. (C–E) TNFα and IL-6 protein levels in CXCR4low and CXCR4high MKs were shown by immunofluorescent staining (C–D) using sorted MKs, compared to their levels in sorted macrophages upon L. monocytogenes infection (E).Scale bars, 5μm. Data represent mean ± s.e.m in (A, B) and boxplots show medians, first and third quartiles in (C–E). Repeated-measures one-way ANOVA followed by Dunnett’s test for multiple comparisons in (A, B), ǂ p<0.05, ǂǂ p<0.01. Two-sample KS test was performed to assess statistical significance in (C–E).
Figure 3 with 2 supplements

CXCR4high MKs stimulate host-defense immunity against bacterial pathogens.
(A) Schema for diphtheria toxin (DT) and L. monocytogenes administration used for the experiments shown in (B–E). (B) Representative images of MKs (blue, indicated by arrows) and vascular endothelial cells (green) in the bone marrow of mice after four daily DT treatments. (C) Bacterial burdens in the liver and spleen of Pf4Cre; Rosa26fs-iDTR mice 3 days after L. monocytogenes (L.m.) infection with four-time DT injections. (D–E) Myeloid cells in the liver (D) and spleen (E) of Pf4Cre; Rosa26fs-iDTR mice 3 days after L. monocytogenes (L.m.) infection with four-time DT injections. (F) Quantification of bacterial phagocytosis capacities of neutrophils, CXCR4low MKs and CXCR4high MKs. (G) Quantification of MHCI-OVA levels on CXCR4low MKs, CXCR4high MKs and bone-marrow-derived dendritic cells (DCs) upon a pulse of 24 hr with or without OVA. (H) Quantification of activated OT-I CD8+ T cells after co-culture with bone-marrow-derived DCs, OVA-pulsed bone-marrow-derived DCs, CXCR4low MKs, or CXCR4high MKs. (I) Schema for antigen-specific T cell activation assay shown in (J). (J) Splenocytes from control or MK ablated mice 7 days after L. monocytogenes-OVA257-264 infection and seven DT injections were stimulated with OVA peptide in vitro for 4 hr, and antigen-specific activated T cells were quantified (n=4 mice). L.m.-OVA, L. monocytogenes-OVA257-264. (K) Schema for DT, L. monocytogenes administration, MK transfusing and bacterial burden determination shown in (L). (L) Bacterial burdens in the liver and spleen of Pf4Cre; Rosa26fs-iDTR mice without or with CXCR4low or CXCR4high MK transfused. Scale bars, 20μm. Data represent mean ± s.e.m. Repeated-measures one-way ANOVA followed by Dunnett’s test for multiple comparisons in (F), ǂǂǂ p<0.001. Paired Student’s t-test was performed to assess statistical significance (G), # p<0.05, n.s., not significant. Two-tailed Student’s t-test was performed to assess statistical significance except (F), * p<0.05, ** p<0.01, *** p<0.001, n.s., not significant.
Figure 3—figure supplement 1

MK ablation influenced HSC and myeloid cell numbers.
(A) Schema for diphtheria toxin (DT) and L. monocytogenes administration used for the experiments shown in (B–D). (B) Number of bone marrow hematopoietic stem and progenitor cells in Pf4Cre+; Rosa26fs-iDTR+/- mice compared to Pf4Cre-; Rosa26fs-iDTR+/- mice after L. monocytogenes infection and DT injection. (C–D) Gating strategies (C) and numbers (D) of myeloid cells in the bone marrow of Pf4Cre; Rosa26fs-iDTR+/- mice after L. monocytogenes infection and DT injection. (D–E) Gating strategies of myeloid cells in the liver (D) and spleen (E) of Pf4Cre; Rosa26fs-iDTR+/- mice at 3 days after L. monocytogenes infection. Neu, neutrophil; MF, macrophage; Mono, monocyte; DC, dendritic cell. Two-tailed Student’s t-test was performed to assess statistical significance. * p<0.05, ** p<0.01, *** p<0.001.
Figure 3—figure supplement 2

CXCR4high MKs induced B3Z T cell activation.
The LacZ activity in B3Z T cells with or without co-culture as indicated. Ctrl indicates B3Z cells without MKs co-culture; bone-marrow-derived DCs, CXCR4low MKs and CXCR4high MKs were pulsed with OVA for 24 hr. Two-tailed Student’s t-test was performed to assess statistical significance, * p<0.05.
Figure 4 with 7 supplements
Bacterial infection stimulates the migration of CXCR4high MKs.
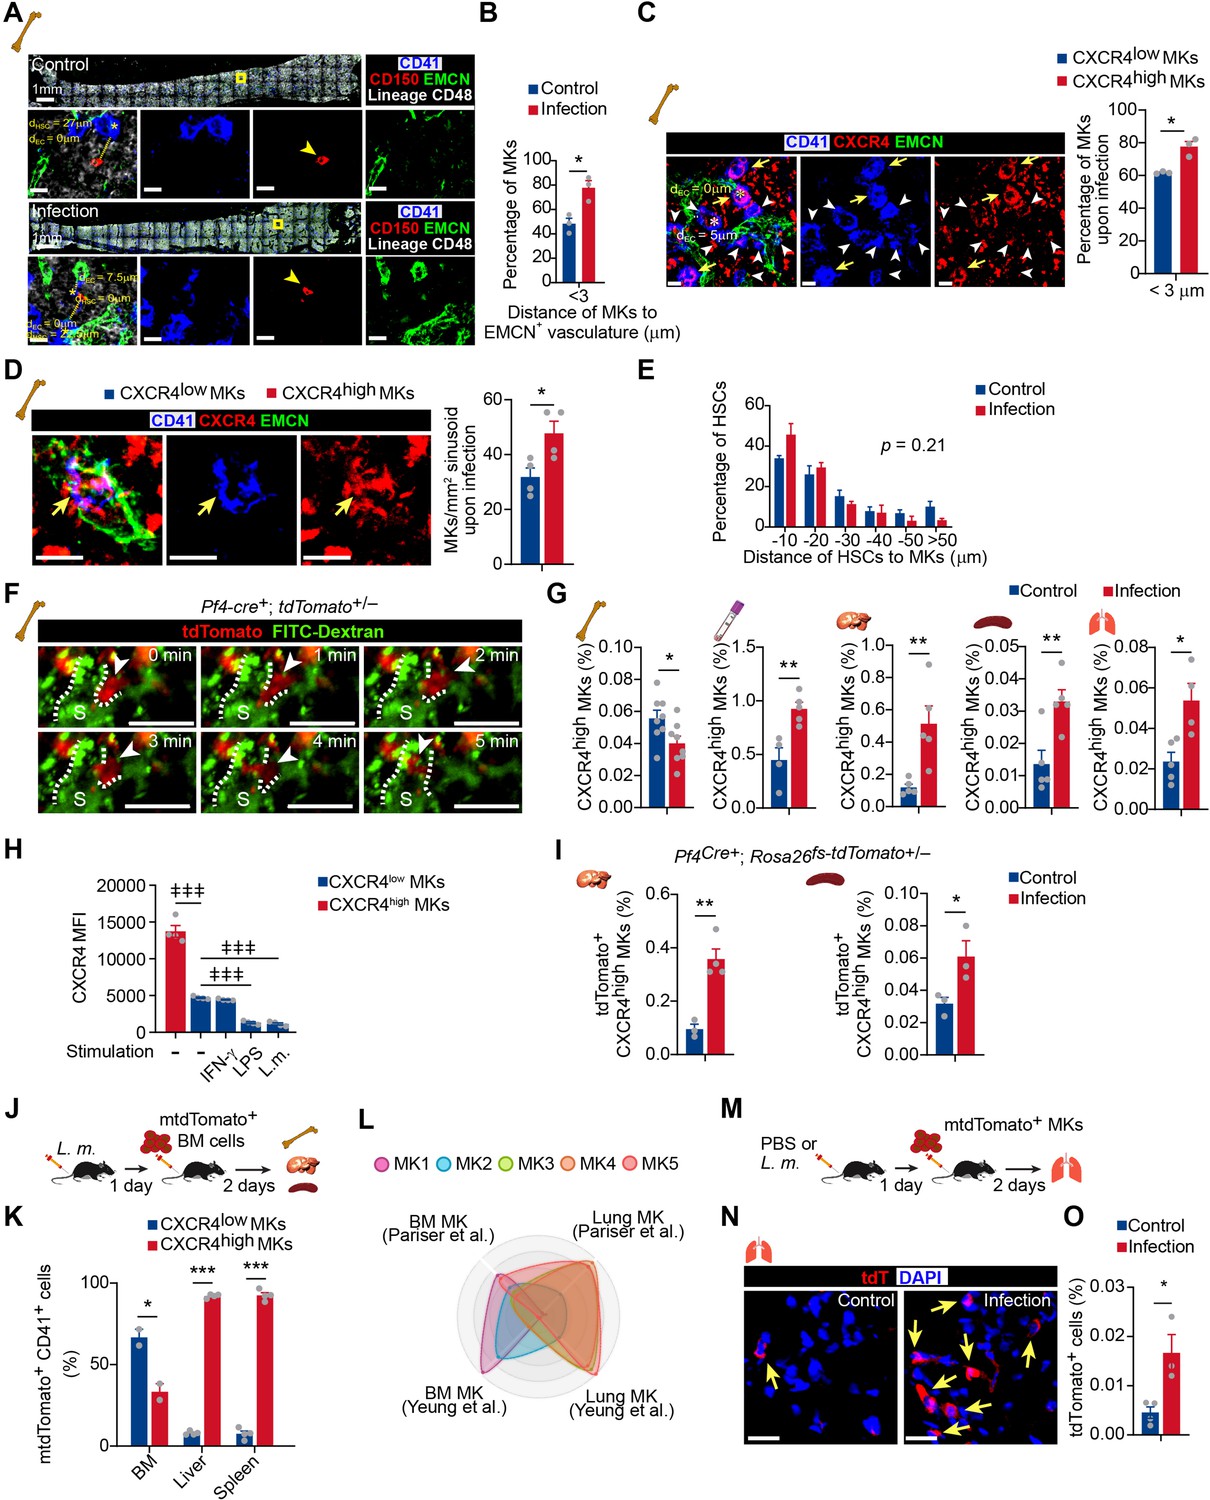
(A) Representative image of CD41 (blue), CD150 (red), EMCN (green), and lineage cells (white) in bone marrow from control mice or mice at 3 days after L. monocytogenes infection. dHSC and dEC indicate the distance between the MK (blue, marked with an asterisk) and the closest HSC (red), endothelial cell (green), respectively. Yellow boxes indicate the locations of the magnified images. Arrowheads indicate HSCs. EMCN, endomucin; EC, endothelial cell. (B) Comparison of the distance between MKs to Ecs (n=119 control and 103 infected MKs) in the bone marrow of control mice or mice at 3 days after L. monocytogenes infection. (C) Comparison of the distance between CXCR4low or CXCR4high MKs and endothelial cells (Ecs) in the bone marrow of mice 3 days after L. monocytogenes infection (n=68 CXCR4low and 78 CXCR4high MKs). CD41 (blue), CXCR4 (red), and EMCN (green). Yellow arrows indicate CXCR4high MKs, while white arrowheads indicate CXCR4low MKs. (D) Representative immunofluorescent staining images (left) and quantification (right) of CXCR4 (red) labeled MKs (blue) egressed into sinusoids (green) upon infection (n=46 CXCR4low MKs and 69 CXCR4high MKs in 4 biological replicates). Yellow arrows indicate CXCR4high MKs. (E) Comparison of the distance between HSCs to MKs (n=96 control and 127 infected HSCs, p=0.21 by two-sample KS test) in the bone marrow of control mice or mice at 3 days after L. monocytogenes infection. (F) Visualization of MK migration (red, arrowhead) into sinusoids (green) by live imaging in the bone marrow of Pf4Cre+; Rosa26fs-tdTomato+/- mice 24 hr after L. monocytogenes infection (Movie S1). ‘S’ indicates sinusoid and dashed lines demarcate the border of sinusoids. (G) Quantification of CXCR4high MKs in bone marrow, peripheral blood, liver, spleen, and lung of control mice and mice 3 days after L. monocytogenes infection. (H) Quantification of CXCR4 levels on CXCR4low MKs treated with IFN-γ, LPS or L. monocytogenes for 4 hr compared to CXCR4high MKs. (I) Quantification of tdTomato+ CXCR4high MKs in the liver and spleen from control mice or mice 3 days after L. monocytogenes infection by flow cytometry. (J) Schema of mtdTomato+ bone marrow (from R26RmTmG mice) cell perfusion in control and L. monocytogenes infected recipients. (K) The percentage of CXCR4high mtdTomato+ MKs and CXCR4low mtdTomato+ MKs in bone marrow, liver, and spleen of control or infected recipients were analyzed 2 days after mtdTomato+ bone marrow cells were perfused. (L) Radar chart showing transcriptomic similarities of bone marrow MK subpopulations with reported BM and lung MK datasets (Pariser et al., 2021; Yeung et al., 2020). (M) Schema for transfer experiments using tdTomato+ MKs from Pf4Cre+; Rosa26fs-tdTomato+/- mice into control recipients or recipients 1 day following L. monocytogenes infection. (N–O) Representative images (N) and quantification by flow cytometry (O) of tdTomato+ MKs in the lung of control or infected recipients 2 days after cell perfusion (n=3 mice). Arrows indicate tdTomato+ MKs in the lung. Scale bars without indicated, 20 μm. Data represent mean ± s.e.m. A two-sample KS test was performed to assess statistical significance in (E). Repeated-measures one-way ANOVA followed by Dunnett’s test for multiple comparisons in (H), ǂǂ p<0.01, ǂǂǂ p<0.001. Two-tailed Student’s t-test was performed to assess statistical significance except (E, H), * p<0.05, ** p<0.01, *** p<0.001, n.s., not significant.
-
Figure 4—source data 1
Distance of HSCs to MKs in the bone marrow from control mice or mice 3 days after L. monocytogenes infection.
- https://cdn.elifesciences.org/articles/78662/elife-78662-fig4-data1-v2.xlsx
Figure 4—figure supplement 1
The effects of association of MKs and blood vessels, HSC activation, and MK numbers in bone marrow upon bacterial infection.
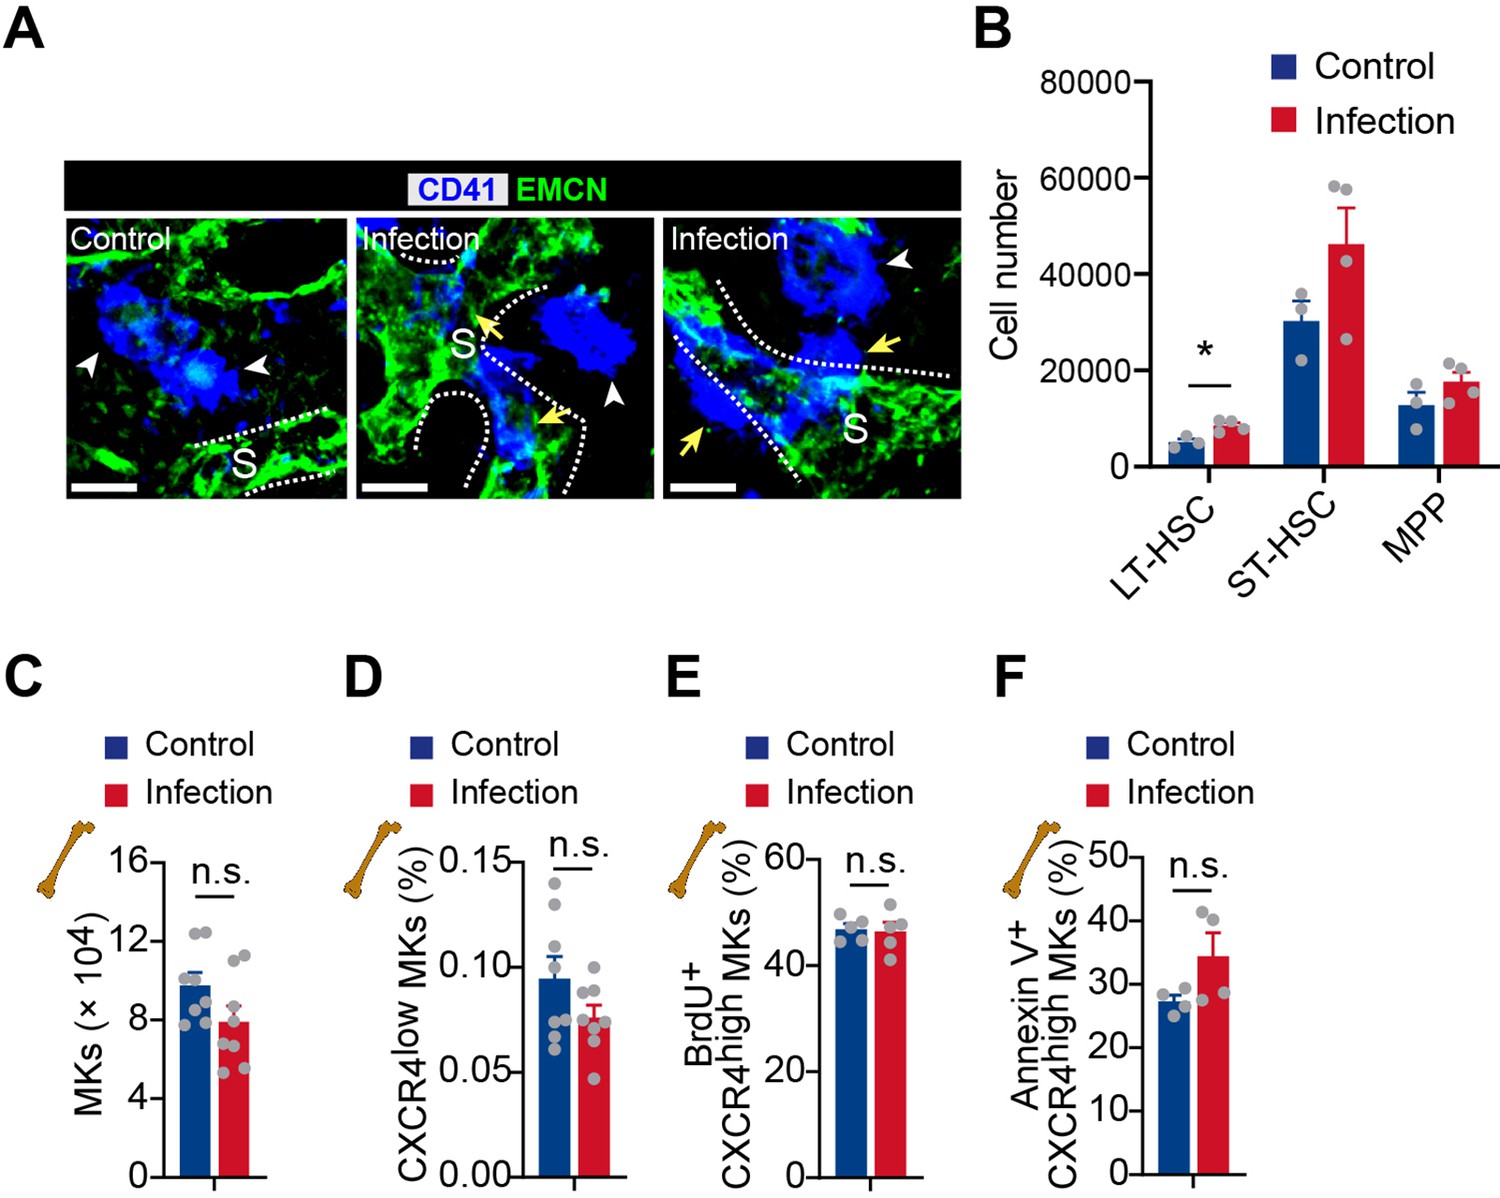
(A) Bone marrow MKs (blue) and sinusoids (green) in control mice and mice 3 days after L. monocytogenes infection. CD41, blue; EMCN, green. Yellow arrows indicate MKs egressed into sinusoids. ‘S’ indicates sinusoid and dashed lines demarcate the border of sinusoids. (B) HSC and progenitor cell number in the bone marrow of control mice and mice 3 days after L. monocytogenes infection. LT, long term; ST, short term; MPP, multipotential progenitor. (C–D) MK numbers (C) and CXCR4low MK frequency (D) in the bone marrow of control mice and mice 3 days after L. monocytogenes infection (n=8 mice). (E–F) Frequency of BrdU+ (E) and Annexin V+ (F) cells in CXCR4high MKs from bone marrow of control mice or mice 3 days after L. monocytogenes infection (n=5 mice). Scale bars, 20µm. Data represent mean ± s.e.m. Two-tailed Student’s t-test was performed to assess statistical significance. * p<0.05, n.s., not significant.
Figure 4—figure supplement 2
scRNA-seq of MKs from mice upon bacterial infection.
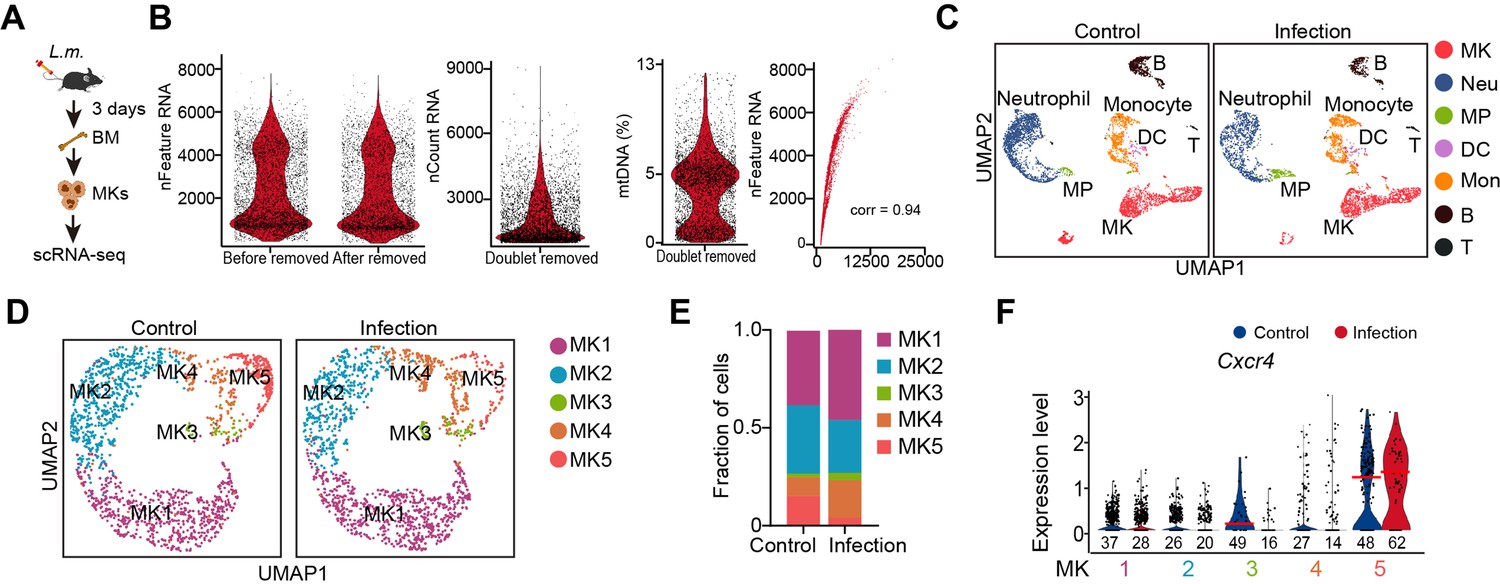
(A) Schematic depicting the strategy of scRNA-seq using bone marrow MKs from mice 3 days after L. monocytogenes infection. (B) Violin plots showing the number of unique genes (gene number) before and after removing doublets, number of total unique molecular identifiers (UMI counts) and percentage of mitochondrial transcripts in single cells after removing doublets. Scatter plot showing the correlation between UMI counts and gene numbers. corr indicates Pearson correlation coefficient. (C) UMAP of the combined 5368 cells from control bone marrow and 4276 cells from L. monocytogenes infection bone marrow, colored by cell types. Neu, neutrophil; MP, myeloid progenitor; Mon, monocytes; B, B cells; T, T cells. (D) UMAP of the combined 1712 control MKs and 1560 infection MKs in the bone marrow, colored by clusters. (E) Fraction of each MK subpopulation from control MKs or L. monocytogenes infection MKs. (F) Violin plot showing Cxcr4 expression in each MK subpopulation of control and infection MKs.
Figure 4—figure supplement 3

CXCL12 expression upon bacterial infection.
(A–H) Relative expression of Cxcl12 (A–D) and frequency of CXCL12DsRed cells (E–H) in the bone marrow (A), lung (B), liver (C), and spleen (D) from control mice and mice 3 days after L. monocytogenes infection by RT-qPCR (A–D) and flow cytometry (E–H), respectively. Two-tailed Student’s t-test was performed to assess statistical significance. * p<0.05, ** p<0.01, *** p<0.001.
Figure 4—figure supplement 4
Cell cycle and apoptosis of CXCR4high MKs, and CXCR4low MK numbers in different organs upon bacterial infection.
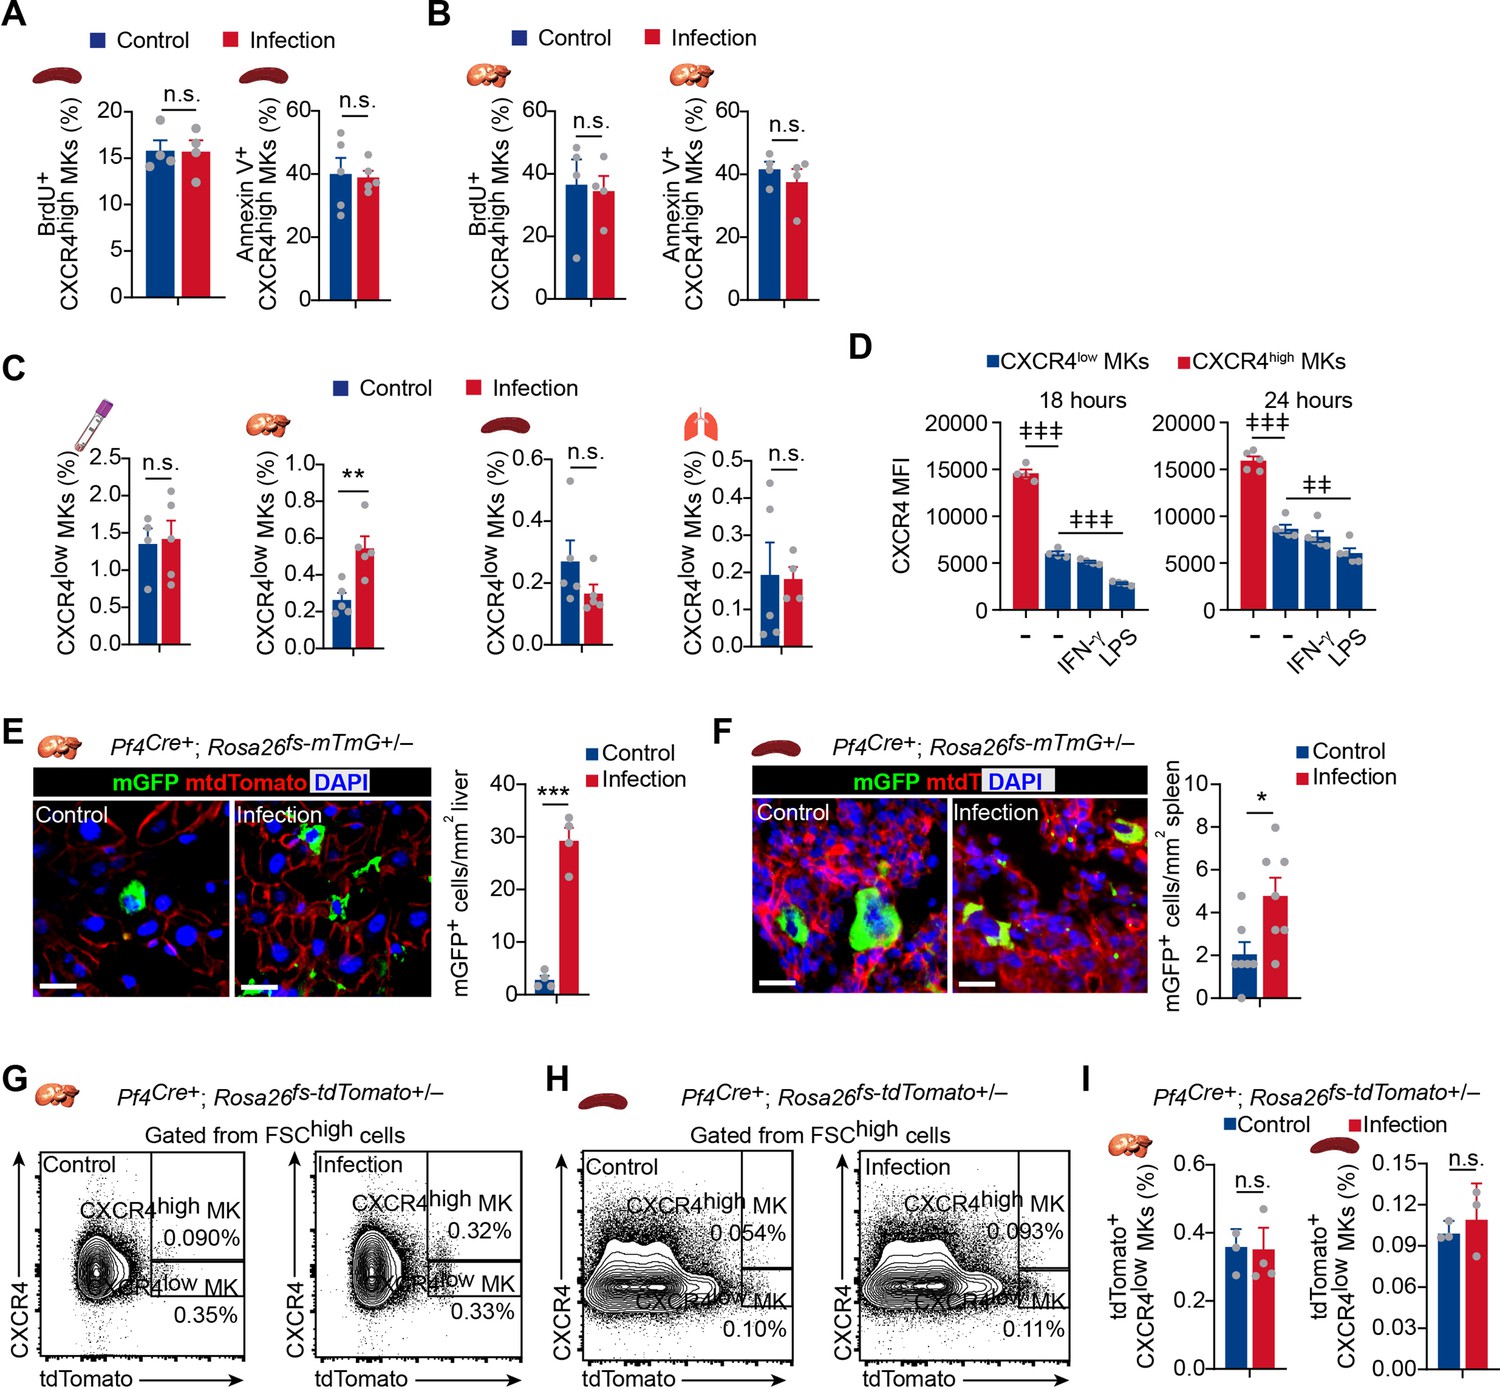
(A–B) Fraction of BrdU+ and Annexin V+ MKs in CXCR4high MKs in the liver (A) and spleen (B) from control mice or mice 3 days after L. monocytogenes infection. (C) Quantification of CXCR4low MKs in peripheral blood, liver, spleen, and lung of control mice and mice at 3 days after L. monocytogenes infection. (D) Quantification of CXCR4 levels on CXCR4high MKs and CXCR4low MKs treated with LPS or IFN-γ for 18 or 24 hr. (E–F) Representative images and quantification of mGFP+ MKs (green) in the liver (E) and spleen (F) from control mice or mice 3 days after L. monocytogenes infection (n=4 and 7 mice, respectively). (G–H) Gating strategies for CXCR4high MKs in the liver (G) and spleen (H). (I) Quantification of tdTomato+CXCR4low MKs in the liver and spleen from control mice or mice 3 days after L. monocytogenes infection by flow cytometry. Scale bars, 20μm. Data represent mean ± s.e.m. Two-tailed Student’s t-test was performed to assess statistical significance except (D). * p<0.05, ** p<0.01, *** p<0.001, n.s., not significant. Repeated-measures one-way ANOVA followed by Dunnett’s test for multiple comparisons in (D), ǂǂ p<0.01, ǂǂǂ p<0.01.
Figure 4—figure supplement 5
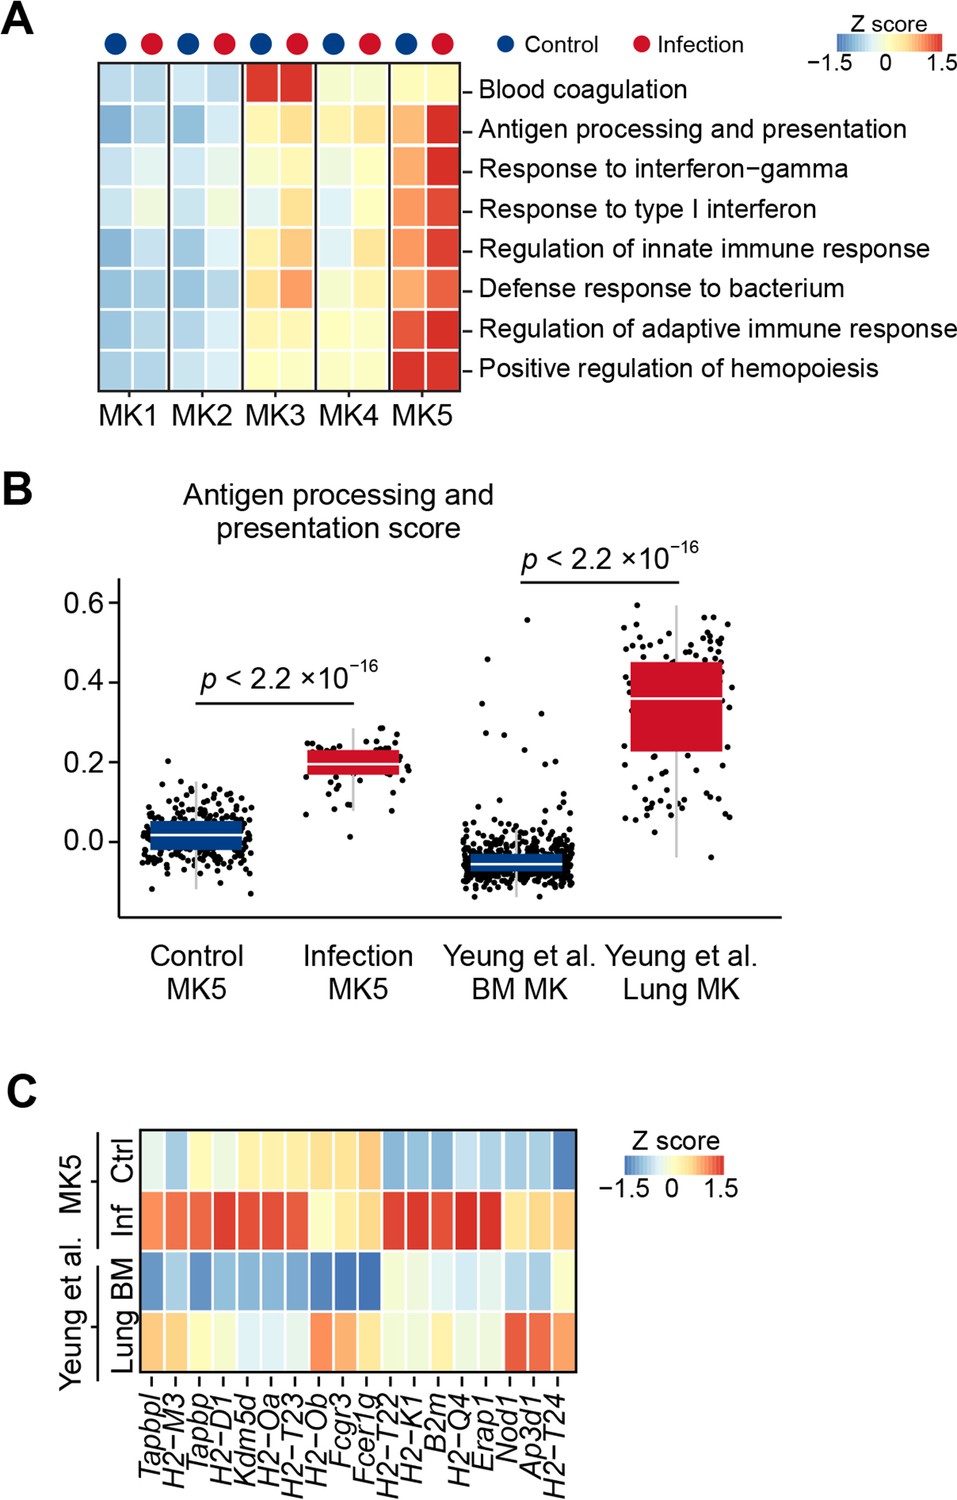
Comparison of immune gene expression in MK5 and lung MKs from control mice or mice upon bacterial infection.
(A) Gene set variation analysis (GSVA) of each MK subpopulation under control or L. monocytogenes infection, colored by row-scaled GSVA enrichment scores. (B) Antigen processing and presentation score of control MK5, infection MK5, and bone marrow and lung MKs from Yeung et al., 2020. (C) Heatmap showing the row-scaled antigen processing and presentation gene expression of control and infection MK5 cells, comparing with bone marrow MK and lung MK from Yeung et al., 2020. Data represent mean ±first and third quartiles in (B). Two-sample KS test was performed to assess statistical significance in (B).
Figure 4—figure supplement 6

Intravascular and extravascular tdTomato+ MKs in the lung after MK perfusion.
(A) Schema for transfer experiments using tdTomato+ MKs from Pf4Cre+; Rosa26fs-tdTomato+/- mice into recipients 1 day following L. monocytogenes infection. (B) Transfused MKs (red) and sinusoids (green) in the lung of mice after L. monocytogenes infection as indicated in Figure 4M. DAPI, blue; EMCN, green; tdTomato, red. (C) Quantification of transfused intravascular and extravascular MKs in the lung. Scale bar, 20μm. Data represent mean ± s.e.m. Two-tailed Student’s t-test was performed to assess statistical significance. *** p<0.001.
Figure 4—video 1
MK migration traced by ex vivo live imaging.
MK (red, arrowhead) migrating into the bone marrow sinusoids (green, labeled by Dextran-FITC) by live imaging in the bone marrow of Pf4Cre+; Rosa26fs-tdTomato+/-mice 24 hr after L. monocytogenes infection. Scale bar, 10μm.
Figure 5
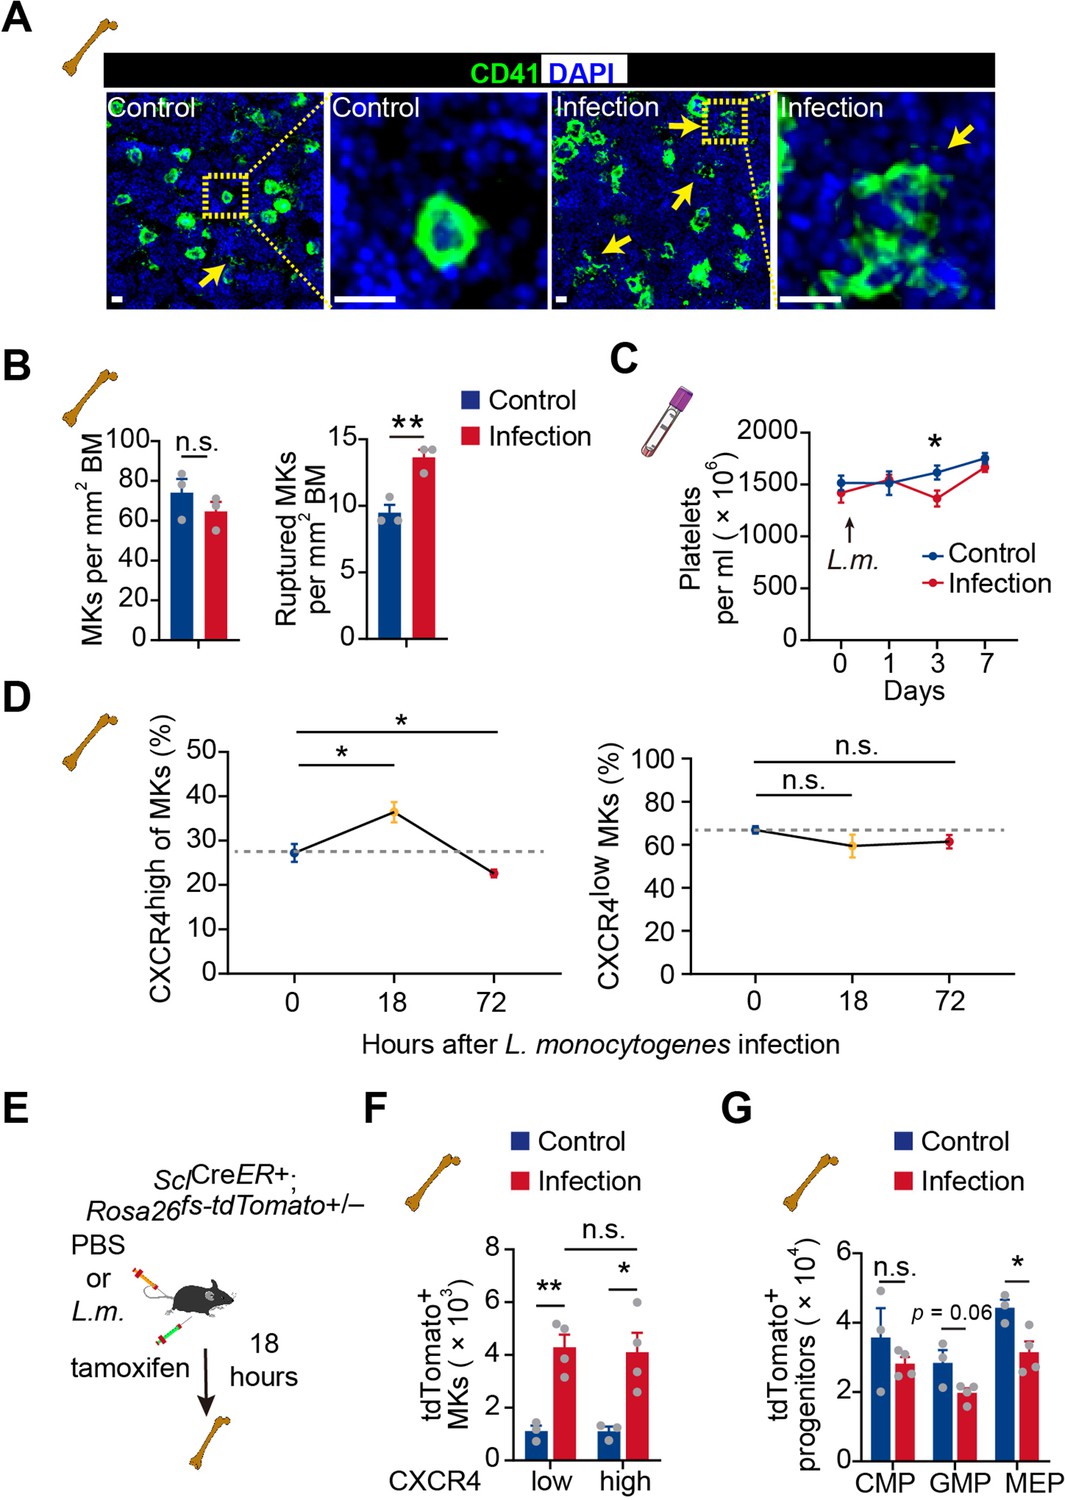
Acute inflammation induces emergency megakaryopoiesis of CXCR4high MKs.
(A–B) Representative images (A) and statistical analysis (B) of CD41 (green) and DAPI (blue) in bone marrow from control mice or mice 3 days after L. monocytogenes infection. Arrows indicate ruptured MKs, yellow boxes indicate the locations of the magnified images. (C) Platelets in peripheral blood in control mice or mice after L. monocytogenes infection on indicated days. (D) The dynamics percentage of CXCR4high MKs (left) or CXCR4low MKs (right) in the bone marrow of L. monocytogenes-challenged mice within 72 hr of infection. (E) Schema for HSC lineage tracing upon L. monocytogenes infection using SclCreER+; Rosa26fs-tdTomato+/- mice. (F–G) Cell numbers of tdTomato+ CXCR4low MKs and tdTomato+ CXCR4high MKs (F), and tdTomato+ progenitors (G) in the bone marrow of control and L. monocytogenes infected SclCreER+; Rosa26fs-tdTomato+/- recipients 18 hr after L. monocytogenes infection and tamoxifen administration. CMP, common myeloid progenitor; GMP, granulocyte-monocyte progenitor; MEP, megakaryocyte-erythroid progenitor. Scale bars, 20 μm. Data represent mean ± s.e.m. Two-tailed Student’s t-test was performed to assess statistical significance, * p<0.05, ** p<0.01, n.s., not significant.
Tables
Key resources table
| Reagent type (species) or resource | Designation | Source or reference | Identifiers | Additional information |
|---|---|---|---|---|
| Antibody | Anti-CD41a (mouse monoclonal) | eBioscience | Cat#17-0411-82 RRID:AB_1603237 | FACS (1 μl per test) |
| Antibody | Anti-CXCR4 (mouse monoclonal) | eBioscience | Cat#53-9991-80 RRID:AB_953573 | FACS (1 μl per test) |
| Antibody | Anti-CD11b (mouse monoclonal) | eBioscience | Cat#12-0112-82 RRID:AB_2734869 | FACS (1 μl per test) |
| Antibody | Anti-F4/80 (mouse monoclonal) | eBioscience | Cat#17-4801-80 RRID:AB_2784647 | FACS (1 μl per test) |
| Antibody | Anti-Gr-1 (mouse monoclonal) | Biolegend | Cat#108424 RRID:AB_2137485 | FACS (1 μl per test) |
| Antibody | Anti-Ly-6C (mouse monoclonal) | Biolegend | Cat#128022 RRID:AB_10639728 | FACS (1 μl per test) |
| Antibody | Anti-CD11c (mouse monoclonal) | eBioscience | Cat#12-0114-82 RRID:AB_465552 | FACS (1 μl per test) |
| Antibody | Anti-CD45.1 (mouse monoclonal) | eBioscience | Cat#15-0453-82 RRID:AB_468759 | FACS (1 μl per test) |
| Antibody | Anti-CD45.2 (mouse monoclonal) | Biolegend | Cat#109831 RRID:AB_10900256 | FACS (1 μl per test) |
| Antibody | Anti-CD4 (mouse monoclonal) | eBioscience | Cat#12-0041-82 RRID:AB_465506 | FACS (1 μl per test) |
| Antibody | Anti-CD8a (mouse monoclonal) | Biolegend | Cat#100707 RRID:AB_312746 | FACS (1 μl per test) |
| Antibody | Anti-IFN-γ (mouse monoclonal) | Biolegend | Cat#505813 RRID:AB_493312 | FACS (1 μl per test) |
| Antibody | Anti-IL-4 (mouse monoclonal) | Biolegend | Cat#504118 RRID:AB_10898116 | FACS (1 μl per test) |
| Antibody | Anti-CD34 (mouse monoclonal) | eBioscience | Cat#11-0341-82 RRID:AB_465021 | FACS (1 μl per test) |
| Antibody | Anti-Sca-1 (mouse monoclonal) | Biolegend | Cat#108114 RRID:AB_493596 | FACS (1 μl per test) |
| Antibody | Anti-c-Kit (mouse monoclonal) | Biolegend | Cat#105812 RRID:AB_313221 | FACS (1 μl per test) |
| Antibody | Anti-CD135 (mouse monoclonal) | Biolegend | Cat#135314 RRID:AB_2562339 | FACS (1 μl per test) |
| Antibody | Anti-CD3ε (mouse monoclonal) | Biolegend | Cat#100310 RRID:AB_312675 | FACS (1 μl per test) |
| Antibody | Anti-B220 (mouse monoclonal) | Biolegend | Cat#103210 RRID:AB_312995 | FACS (1 μl per test) |
| Antibody | Anti-TER-119 (mouse monoclonal) | Biolegend | Cat#116210 RRID:AB_313711 | FACS (1 μl per test) |
| Antibody | Anti-IgM (mouse monoclonal) | eBioscience | Cat#15-5790-82 RRID:AB_494222 | FACS (1 μl per test) |
| Antibody | Anti-CD16/32 (mouse monoclonal) | Biolegend | Cat#101333 RRID:AB_2563692 | FACS (1 μl per test) |
| Antibody | Anti-CD127 (mouse monoclonal) | Biolegend | Cat#135021 RRID:AB_1937274 | FACS (1 μl per test) |
| Antibody | Anti-TNFα (mouse monoclonal) | Invitrogen | Cat#17-7321-81 RRID:AB_469507 | FACS (1 μl per test) IF (1:100) |
| Antibody | Anti-IL-6 (mouse monoclonal) | Biolegend | Cat#504507 RRID:AB_10694868 | FACS (1 μl per test) IF (1:100) |
| Antibody | Anti-BrdU (mouse monoclonal) | eBioscience | Cat#11-5071-42 RRID:AB_11042627 | FACS (1 μl per test) |
| Antibody | Anti-Endomucin (mouse polyclonal) | R&D | Cat#AF4666 | IF (1:100) |
| Antibody | Anti-CD150 (mouse monoclonal) | Biolegend | Cat#115908 RRID:AB_345278 | IF (1:100) |
| Antibody | Anti-Lineage Panel (mouse monoclonal) | Biolegend | Cat#133307 RRID:AB_11124348 | IF (1:100) |
| Antibody | Anti-Goat AF488 (goat polyclonal) | Invitrogen | Cat#A32814 RRID:AB_2762838 | IF (1:1000) |
| Antibody | Anti-TNF-alpha (mouse monoclonal) | Sino Biological | Cat#50349-R023 | 2 μg ml–1 |
| Antibody | Anti-Rabbit AF488 (rabbit polyclonal) | Invitrogen | Cat#R37118 RRID:AB_2556546 | IF (1:1000) |
| Antibody | Anti-OVA257-264 (SIINFEKL) peptide bound to H-2Kb (mouse monoclonal) | Invitrogen | Cat#17-5743-82 RRID:AB_1311286 | FACS (1 μl per test) |
| Antibody | Anti-IL-2 (mouse monoclonal) | eBioscience | Cat#25-7021-80 RRID:AB_1235007 | FACS (1 μl per test) |
| Chemical compound, drug | Diphtheria toxin (DT) | Sigma-Aldrich | Cat#D0564-1MG | 40 μg kg–1 body mass |
| Chemical compound, drug | BrdU (5-Bromo-2´-Deoxyuridine) | Sigma-Aldrich | Cat#B5002-250mg | 125 mg kg–1 body mass |
| Chemical compound, drug | CFSE (5-Carboxyfluorescein, Succinimidyl Ester) | Invitrogen | Cat#C2210 | 2.5 μM |
| Chemical compound, drug | GM-CSF | Abbkine | Cat#PRP2116 | 10 ng ml–1 |
| Chemical compound, drug | IL-4 | novoprotein | Cat#CK15 | 10 ng ml–1 |
| Chemical compound, drug | Tamoxifen | Sigma-Aldrich | Cat#T5648 | 20 mg ml–1 corn oil |
| Commercial kit | Chromium Single Cell 3′ GEM, Library & Gel Bead Kit v3 | 10 x Genomics | PN-1000075 | |
| Commercial kit | Chromium Chip B Single Cell Kit | 10 x Genomics | PN-1000074 | |
| Cell line (Mus musculus) | NCTC clone 929 | ATCC | CCL-1 RRID:CVCL_0462 | |
| Cell line (Mus musculus) | B3Z hybridoma CD8 T cell | Dr. Nilabh Shastri | ||
| Other | scRNA sequencing data (raw and processed data) | This paper | GEO: GSE168224 | |
| Genetic reagent (Mus musculus) | C57BL/6 J | Shanghai Model Organisms | ||
| Genetic reagent (Mus musculus) | Tg(Pf4-icre)Q3Rsko/J (Pf4Cre) | Jackson Laboratory | Stock No: 008535 | |
| Genetic reagent (Mus musculus) | Gt(ROSA) 26Sortm1(HBEGF) Awai/J (Rosa26fs-iDTR) | Jackson Laboratory | Stock No: 007900 | |
| Genetic reagent (Mus musculus) | Gt(ROSA)26Sortm4(ACTB-tdTomato,-EGFP)Luo/J (Rosa26fs-mTmG) | Jackson Laboratory | Stock No: 007576 | |
| Genetic reagent (Mus musculus) | Gt(ROSA)26Sortm9(CAG-tdTomato)Hze/J (Rosa26fs-tdTomato) | Jackson Laboratory | Stock No: 007905 | |
| Genetic reagent (Mus musculus) | SclCreER mice | Göthert et al., 2005 | ||
| Genetic reagent (Mus musculus) | Cxcl12tm2.1Sjm/J (Cxcl12fs-DsRed) | Jackson Laboratory | Stock No: 022458 | |
| Genetic reagent (Mus musculus) | C57BL/6-Tg(TcraTcrb)1,100Mjb/J (OT-I) | Jackson Laboratory | Stock No: 003831 | |
| Strain, strain background (L. monocytogenes) | 10403 S | Bishop and Hinrichs, 1987 | ||
| Software, algorithm | Cell ranger_3.0.2 | 10 x Genomics | tenx RRID:SCR_01695 | |
| Software, algorithm | R_3.6.3 | https://cran.r-project.org/ | R 3.6.3 | |
| Software, algorithm | Seurat_3.0.2 | Butler et al., 2018 | Seurat RRID:SCR_016341 | |
| Software, algorithm | ggplot2_3.2.0 | https://cran.r-project.org/web/packages/ggplot2/index.html | ggplot2 RRID:SCR_014601 | |
| Software, algorithm | clusterProfiler_3.12.0 | Yu et al., 2012 | clusterProfiler RRID:SCR_016884 | |
| Software, algorithm | pheatmap_1.0.12 | https://cran.r-project.org/web/packages/pheatmap/ | pheatmap RRID:SCR_016418 | |
| Software, algorithm | CellPhoneDB_2.1.7 | Efremova et al., 2020 | CellPhoneDB RRID:SCR_017054 | |
| Software, algorithm | CellChat_1.1.3 | Jin et al., 2021 | CellChat 1.1.3 | |
| Software, algorithm | symphony_1.0 | Kang et al., 2021 | symphony 1.0 | |
| Software, algorithm | MetaNeighbor_1.10.0 | Crow et al., 2018 | MetaNeighbor RRID:SCR_016727 | |
| Software, algorithm | iMAP_1.0.0 | Wang et al., 2021b | iMAP 1.0.0 | |
| Software, algorithm | scmap_ 1.16.0 | Kiselev et al., 2018 | Scmap RRID:SCR_017338 | |
| Software, algorithm | enrichplot_1.4.0 | Yu, 2019 | enrichplot 1.4.0 | |
| Software, algorithm | Imaris_8.4 | Bitplane | Imaris RRID:SCR_007370 | |
| Software, algorithm | FlowJo_10 | BD Bioscience | FlowJo RRID:SCR_008520 | |
| Software, algorithm | ImageJ_ 1.8.0 | National Institutes of Health | ImageJ RRID:SCR_003070 | |
| Other | DAPI (4',6-Diamidino-2-Phenylindole, Dihydrochloride) | Thermo Fisher | Cat#D1306 | IF (0.5 µg/mL) |
| Other | Corn oil | Sigma-Aldrich | Cat#PHR2897 | Tamoxifen dissolution |
| Other | Lymphocyte Separation Medium | TBD Science | Cat#LTS1077 | Liver cell isolation |
Additional files
Download links
A two-part list of links to download the article, or parts of the article, in various formats.
Downloads (link to download the article as PDF)
Open citations (links to open the citations from this article in various online reference manager services)
Cite this article (links to download the citations from this article in formats compatible with various reference manager tools)
CXCR4high megakaryocytes regulate host-defense immunity against bacterial pathogens
eLife 11:e78662.
https://doi.org/10.7554/eLife.78662


