Information flows from hippocampus to auditory cortex during replay of verbal working memory items
- Klinik für Neurochirurgie, UniversitätsSpital Zürich, Universität Zürich, Switzerland
- Département des neurosciences fondamentales, Faculté de médecine, Université de Genève, Switzerland
- Service de neurologie, Hôpitaux Universitaires de Genève, Geneva, Switzerland, Switzerland
- Schweizerisches Epilepsie Zentrum, Klinik Lengg AG, Switzerland
- Neuroscience Center Zurich, ETH Zuric, Switzerland
Figures
Figure 1 with 1 supplement
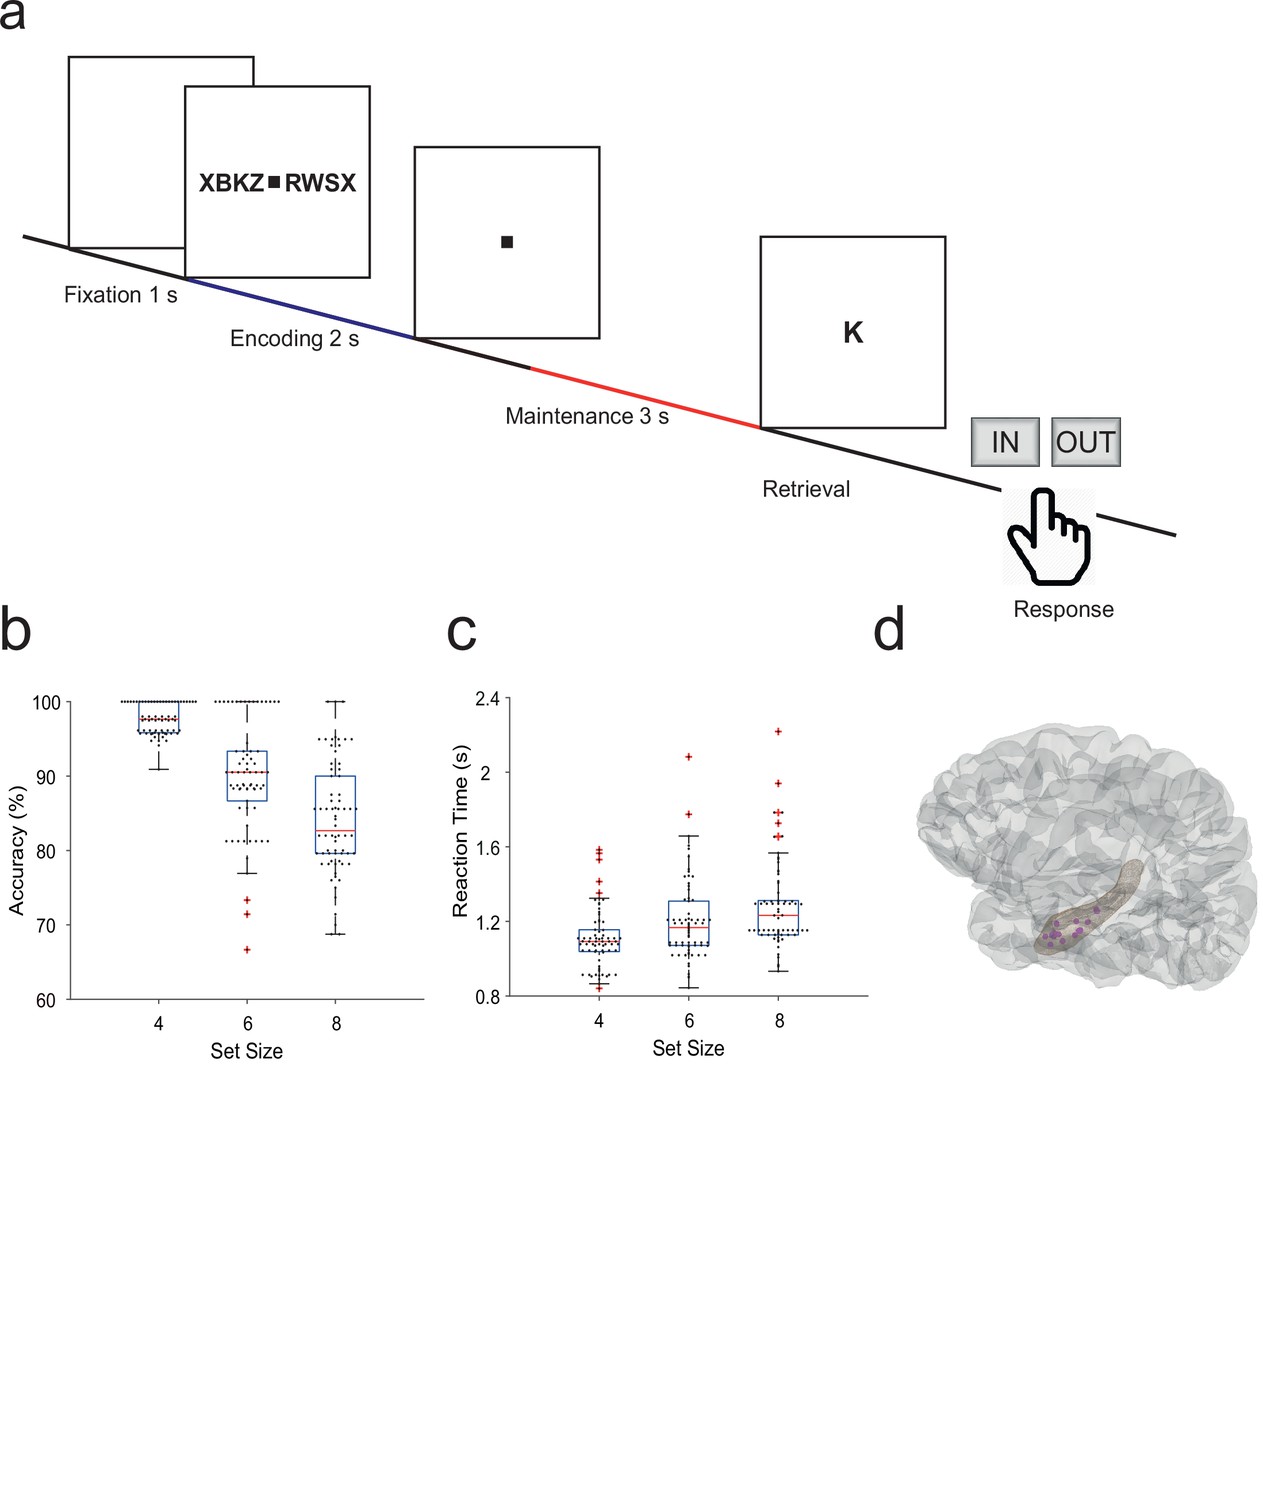
Task and recording sites.
(a) In the task, sets of consonants are presented and have to be memorized. The set size (4, 6, or 8 letters) determines working memory workload. In each trial, presentation of a letter string (encoding period, 2 s) is followed by a delay (maintenance period, 3 s). After the delay, a probe letter is presented. Participants indicate whether the probe was in the letter string or not. (b) Response accuracy decreases with set size (71 sessions). (c) Reaction time increases with set size (53 ms/item). (d) The tip locations of the hippocampal local field potentials electrodes for all participants (N=15) are projected in a hippocampal surface.
Figure 1—figure supplement 1
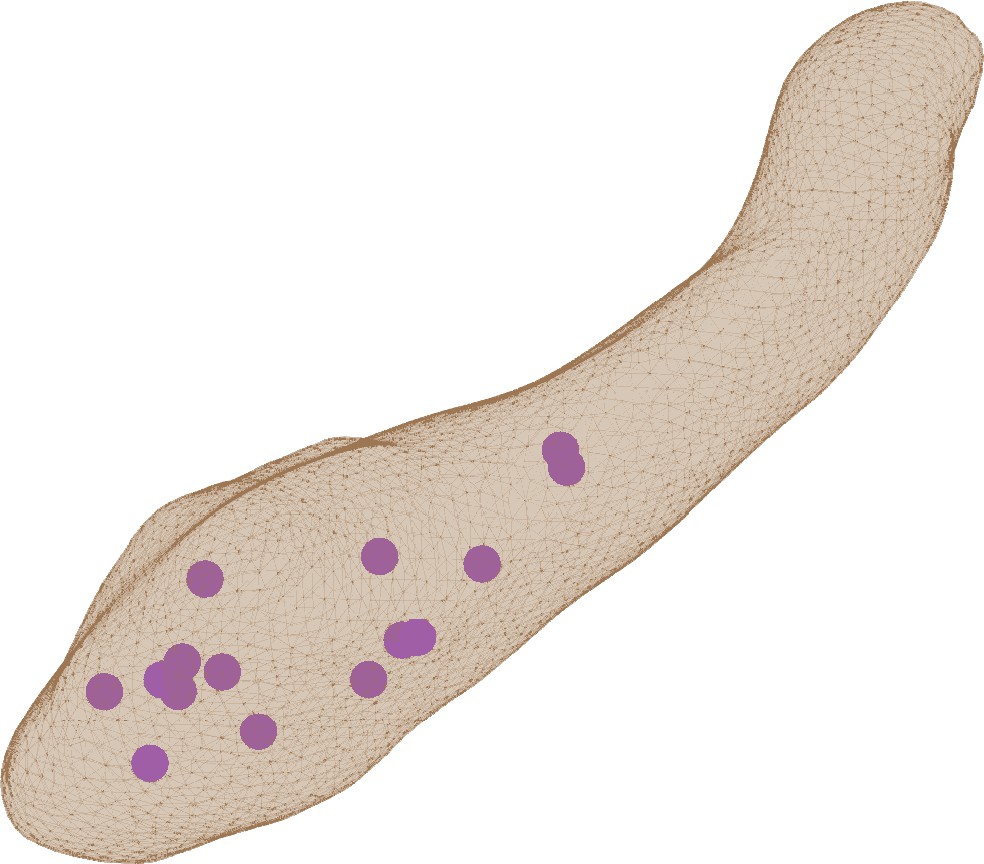
Hippocampal contact locations.
The recording location of the hippocampal local field potentials electrode of each participant is projected in a left hippocampal surface.
Figure 2
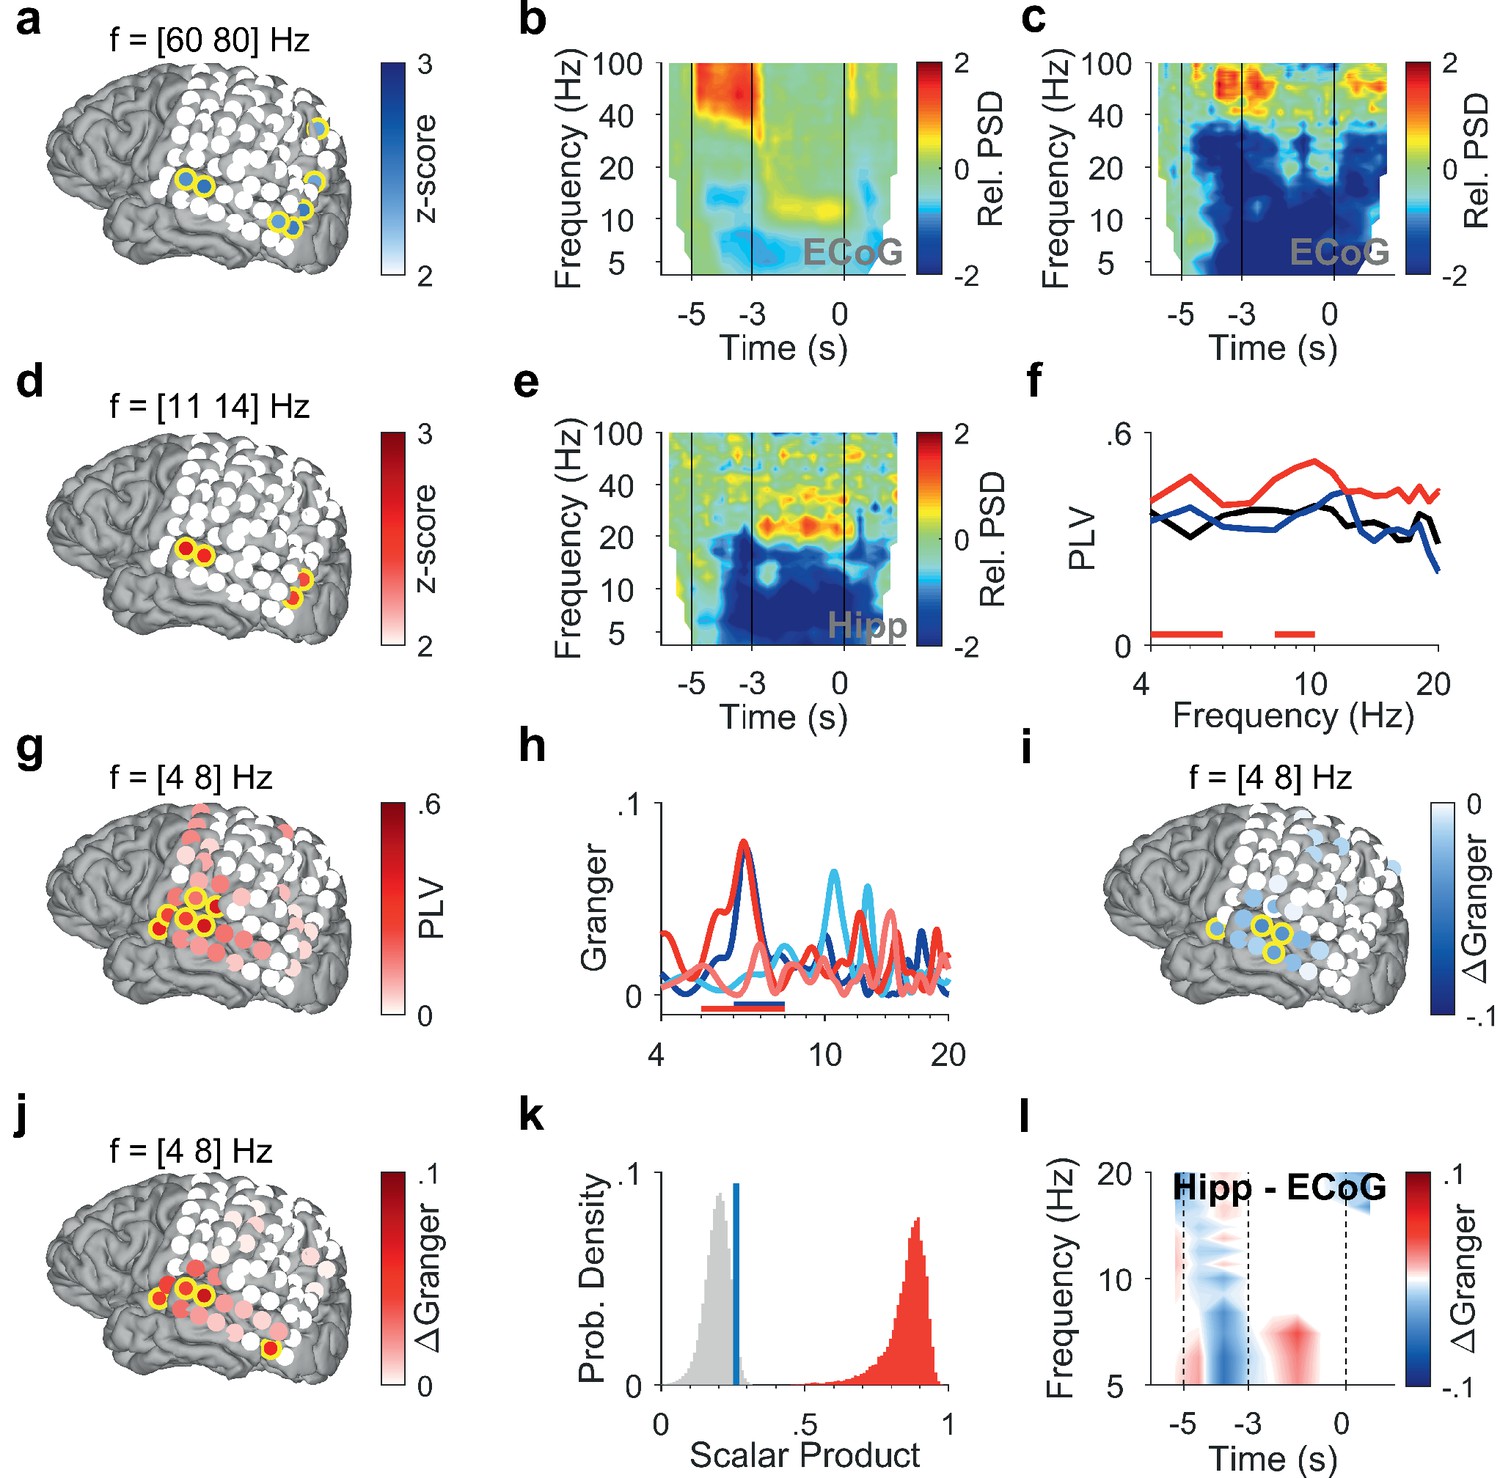
Encoding and replay of letters in Participant 1.
(a) Location of the ECoG contacts over temporal and parietal cortex for Participant 1.Relative gamma power spectral density (PSD; [60 80] Hz) during encoding ([−3.5 −3] s) is maximal for contacts over temporal and occipital-parietal cortex. (b) The relative PSD in the occipital contact (contact H3) over visual cortex shows gamma activity (>40 Hz) during encoding ([−5 −3] s) while the subject sees and hears the letters. Sustained low beta activity ([11 14] Hz) appears toward the end of the maintenance period ([–3 0] s). (c) The relative PSD in the temporal contact (contact C2) over auditory cortex shows gamma activity ([60 80] Hz) during the last second of encoding ([−4 −3] s) while the subject sees and hears the letters. (d) Relative beta PSD ([11 14] Hz) during maintenance ([−2 0] s) is maximal for contacts over temporal and occipital cortex. (e) Hippocampal PSD shows sustained beta activity toward the end of maintenance. (f) Phase-locking value (PLV) between hippocampus and auditory cortex (contact C3) during fixation (black), encoding (blue), and maintenance (red). The PLV spectra show a broad frequency distribution. The PLV during maintenance is higher than during fixation. Red bars: frequency ranges of significant PLV difference (p<0.05, cluster-based non-parametric permutation test against a null distribution with scrambled trials during fixation and maintenance). (g) PLV between hippocampus and cortex in theta ([4 8] Hz) during maintenance ([−2 0] s) is highest to contacts over auditory cortex. (h) Spectral Granger causality. During encoding ([−5 −3] s), auditory cortex (contact C2) predicts hippocampus ([6 8] Hz, dark blue curve exceeds light blue curve). During maintenance ([−2 0] s), hippocampus predicts auditory cortex ([5 8] Hz, dark red curve exceeds light red curve). Bars: frequency range of significant ΔGranger (p<0.05), cluster-based non-parametric permutation test against a null distribution with scrambled trials during encoding (blue) and maintenance (red). (i) Net information flow ΔGranger ([4 8] Hz) during encoding ([−5 −3] s). ECoG over auditory cortex predicts hippocampal local field potentials. (j) Net information flow ΔGranger ([4 8] Hz) during maintenance ([−2 0] s). Hippocampus is maximal in predicting auditory cortex (contact C2 and surrounding contacts). (k) Statistical significance of the spatial spread of contacts with high ΔGranger ([4 8] Hz) during maintenance ([−2 0] s). We calculated the scalar product between two spread vectors. We then tested the statistical significance of the scalar product. The true distribution (red) is clearly distinct from the null distribution (gray, blue bar marks 95th percentile). (l) The Granger time-frequency map illustrates the time course of the spectra of panel (h). During encoding, net information (ΔGranger) flows from auditory cortex to hippocampus (blue). During maintenance, the information flow is reversed from hippocampus to auditory cortex (red) indicating the replay of letters in memory. Grid contacts with significant increase are marked with a yellow rim (p<0.05, cluster-based non-parametric permutation test against a null distribution with scrambled trials). The time course in time-frequency maps is shown relative to the fixation period (b, c, e). Colors of Granger spectra indicate information flow: dark blue, cortex to hippocampus during encoding; light blue, hippocampus to cortex during encoding; dark red, hippocampus to cortex during maintenance; light red, cortex to hippocampus during maintenance. ΔGranger is the difference between spectra, where ΔGranger <0 denotes information flow cortex→hippocampus and ΔGranger >0 denotes information flow hippocampus→cortex. Grid contacts are identified by column (anterior A to posterior H) and row (inferior 1 to superior 8).
Figure 3
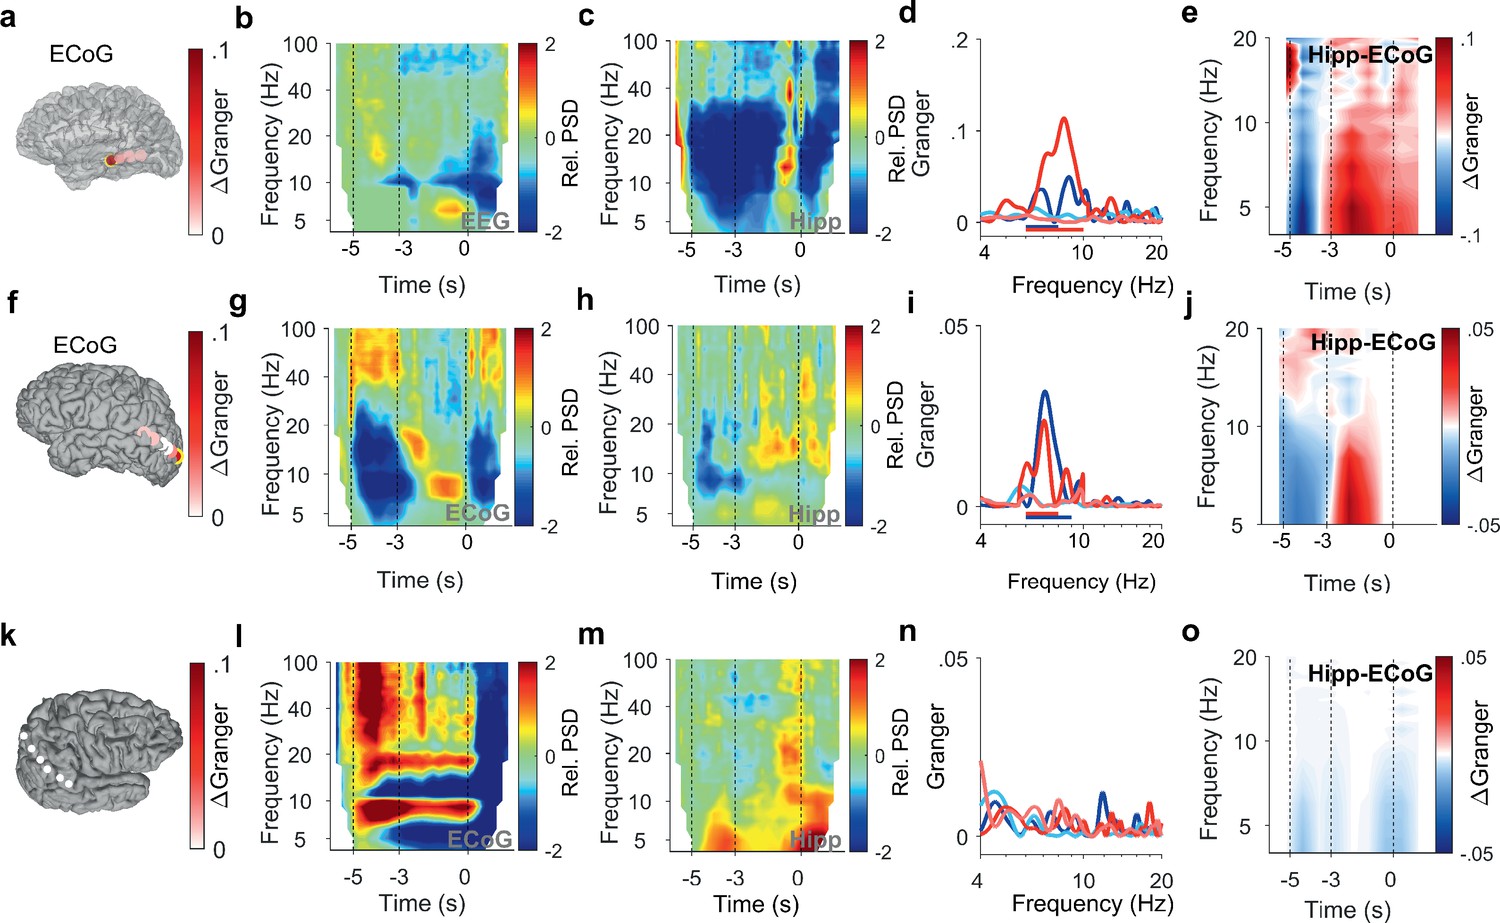
Encoding and replay of letters in three participants with ECoG.
(a) Location of the ECoG contacts in Participant 2. The most anterior strip contact records from auditory cortex. Color bar: ΔGranger during maintenance ([4 8] Hz). (b) The relative power spectral density (PSD) in the temporal scalp EEG electrode (T5) shows beta activity ([14 25] Hz) during encoding ([−5 −3] s) while the subject sees and hears the letters. Sustained theta activity ([6 9] Hz) appears toward the end of the maintenance period ([–3 0] s). (c) Hippocampal PSD shows alpha-beta activity (9–18 Hz) toward the end of maintenance. (d) Spectral Granger causality (GC). During encoding, the auditory cortex predicts hippocampus ([6 8] Hz, dark blue curve exceeds light blue curve). During maintenance, hippocampal local field potentials (LFP) predict auditory cortex ([6 10] Hz, dark red curve exceeds light red curve). (e) The time-frequency map illustrates the time course of ΔGranger in Participant 2. (f) Location of the ECoG contacts in Participant 3. The most posterior contact records from visual cortex (yellow rimmed disk). Color bar: ΔGranger during maintenance ([4 8] Hz). (g) The relative PSD in the most posterior contact (yellow rimmed disk, panel (f)) shows gamma during encoding while the subject sees the letters. Sustained alpha activity ([8 11] Hz) appears toward the end of the maintenance period. (h) Hippocampal PSD shows sustained beta activity ([13 21] Hz) toward the end of the maintenance. (i) Spectral GC. During encoding, the occipital ECoG predicts hippocampus (6–9 Hz, dark blue curve exceeds light blue curve). During maintenance, hippocampal LFP predicts ECoG ([6 8] Hz, dark red curve exceeds light red curve). (j) The time-frequency map illustrates the time course of ΔGranger in Participant 3. (k) Location of the ECoG contacts in Participant 4 on right parietal cortex. Color bar: ΔGranger during maintenance ([4 8] Hz). (l) The relative PSD in contact over the right parietal lobule shows gamma during encoding while the subject sees the letters. Sustained alpha activity ([8 11] Hz) appears during the maintenance period. (m) Hippocampal PSD shows sustained beta activity ([13 21] Hz) toward the end of the maintenance. (n) Spectral GC. Task performance does not elicit significant GC to the right parietal cortex in Participant 4. (o) The time-frequency map illustrates the time course of ΔGranger in Participant 4. Task performance does not elicit significant GC to the right parietal cortex in Participant 4. Color bar: ΔGranger during maintenance ([4 8] Hz). Grid contacts with significant increase in ΔGranger are marked with a yellow rim (permutation test p<0.05). The time course in time-frequency maps is shown relative to the fixation period (b, c, g, h, l,m). Colors of Granger spectra indicate information flow: dark blue, cortex to hippocampus during encoding; light blue, hippocampus to cortex during encoding; dark red, hippocampus to cortex during maintenance; light red, cortex to hippocampus during maintenance. ΔGranger is the difference between spectra where ΔGranger <0 denotes information flow cortex→hippocampus and ΔGranger >0 denotes information flow hippocampus→cortex. Bars: frequency range of significant ΔGranger (p<0.05), cluster-based non-parametric permutation test against a null distribution with scrambled trials during encoding and maintenance, respectively.
Figure 4 with 1 supplement
Granger causality (GC) between hippocampal local field potentials (LFP) and EEG sources.
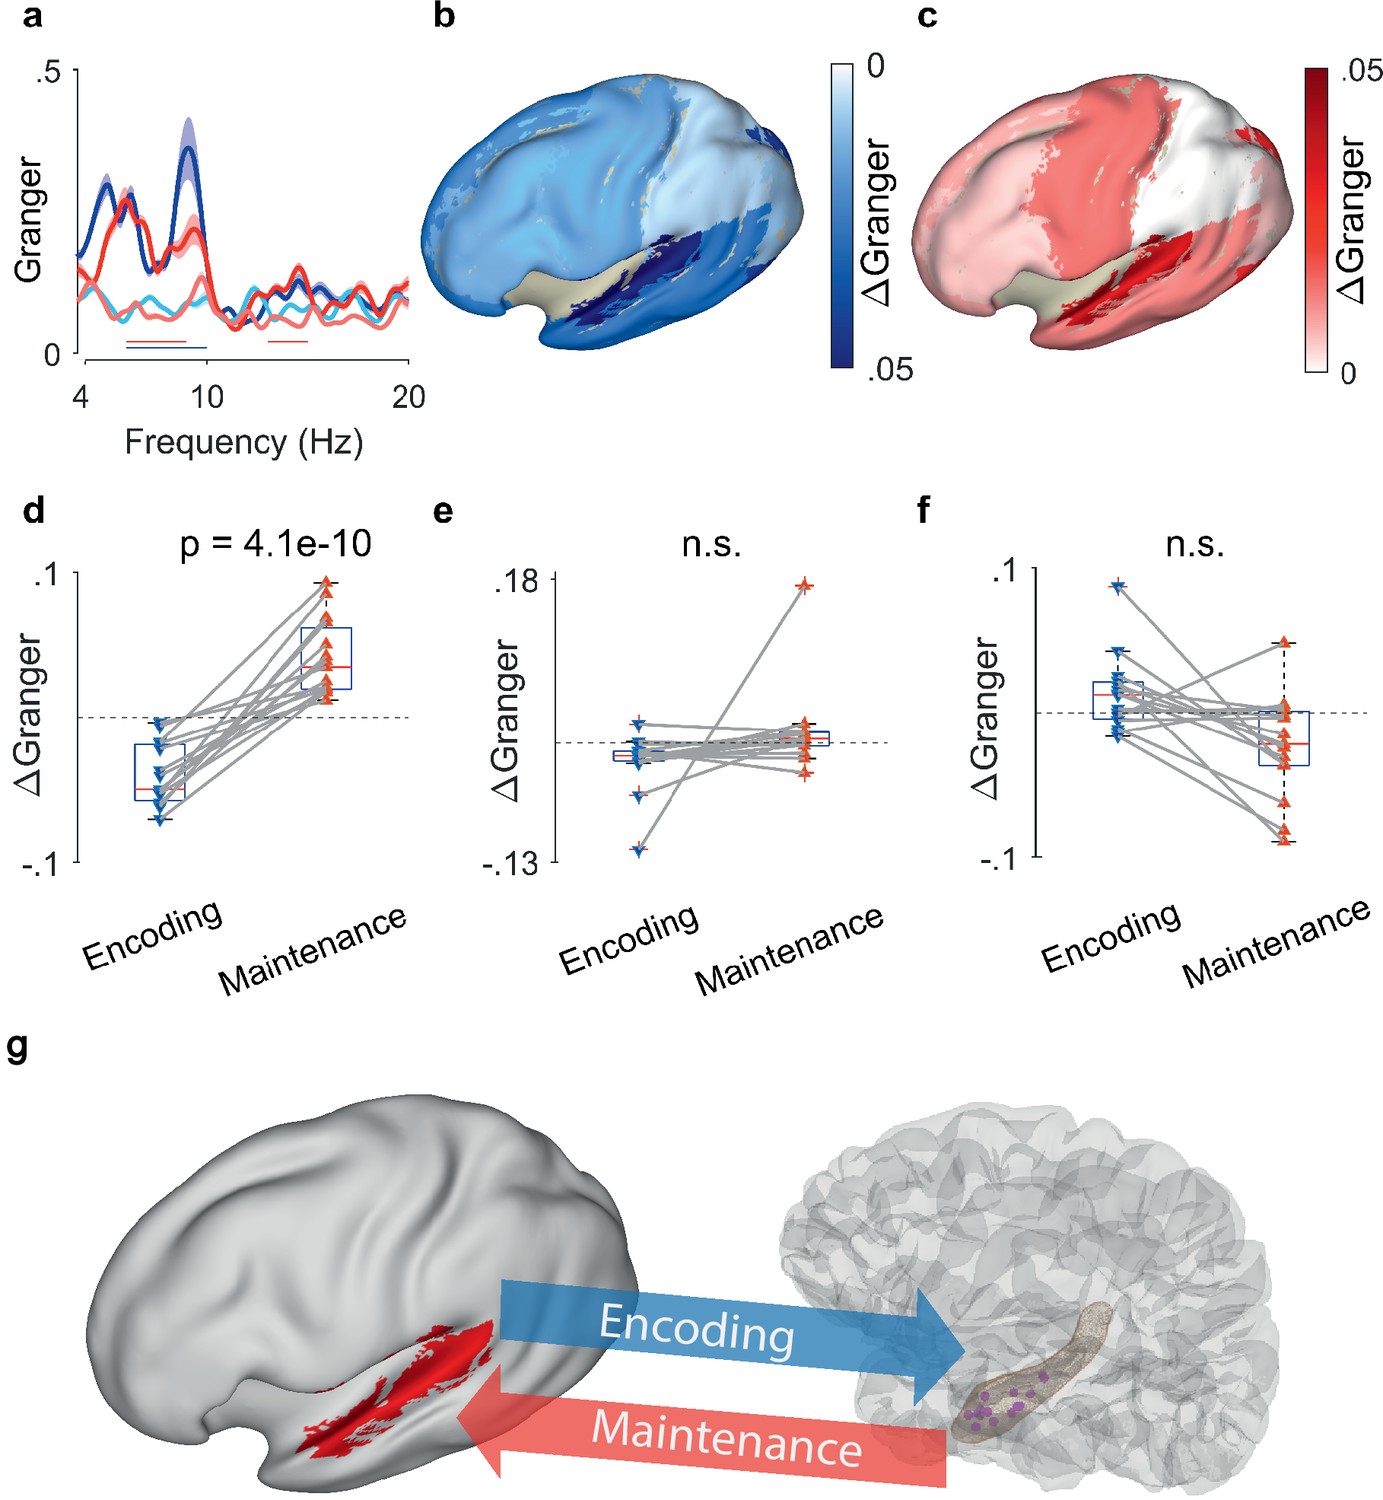
(a) Spectral GC between hippocampal LFP and auditory EEG sources, averaged over all N=15 participants. The shaded area indicates the variability across the population. During encoding, the net Granger (ΔGranger) indicates information flow from auditory cortex to hippocampus ([6 10] Hz, blue bar). During maintenance, ΔGranger indicates information flow from hippocampal LFP to auditory cortex (red bars, [6 9] Hz, [13 15] Hz). Bars: frequency range of significant ΔGranger (p<0.05), group cluster-based non-parametric permutation t-test against a null distribution with scrambled trials during encoding and maintenance. Colors of Granger spectra indicate information flow: dark blue, cortex to hippocampus during encoding; light blue, hippocampus to cortex during encoding; dark red, hippocampus to cortex during maintenance; light red, cortex to hippocampus during maintenance. (b) The median net information flow (ΔGranger) in the [4 8] Hz range during encoding is projected onto an inflated brain surface. The maximal ΔGranger appeared from temporal superior gyrus (median ΔGranger=–0.049) indicating information flow from auditory cortex to hippocampus. Negative values of median ΔGranger appeared also in other areas, albeit less intense (ΔGranger>–0.03). (c) The median net information flow (ΔGranger) in the [4 8] Hz range during maintenance is projected onto an inflated brain surface. The maximal ΔGranger appeared from temporal superior gyrus (median ΔGranger=0.034) indicating an information flow from hippocampus to auditory cortex. Positive values of median ΔGranger appeared also in other areas, albeit less intense (ΔGranger <0.02). (d) The maximal ΔGranger in the [4 8] Hz range was negative during encoding (blue, auditory cortex → hippocampus, median ΔGranger=–0.049) and positive during maintenance (red, hippocampus → auditory cortex, median ΔGranger=0.034) for each participant (red and blue connected marker, paired permutation test, correct trials only). The mean values and statistical significance derive only from 10% of the correct trials in order to balance the number of incorrect trials. (e) The net information flow between hippocampal LFP and lateral prefrontal cortex in the [4 8] Hz range has a lower median than to auditory cortex and higher variability (correct trials only, p=0.16, paired permutation test, not significant). (f) For incorrect trials, the maximal ΔGranger in the [4 8] Hz range is highly variable (p=0.37, paired permutation test, not significant). (g) Bidirectional information flow between cortical sites and hippocampus in the working memory network. The GC analysis suggests a surprisingly simple model of information flow during the task. During encoding, letter strings are verbalized as subvocal speech; the incoming information flows from auditory cortex to hippocampus. During maintenance, participants actively recall and rehearse the subvocal speech in the phonological loop; GC indicates an information flow from hippocampus to cortex as the physiological basis for the replay of the memory items.
Figure 4—figure supplement 1
Spatial activation pattern of EEG beamforming sources.
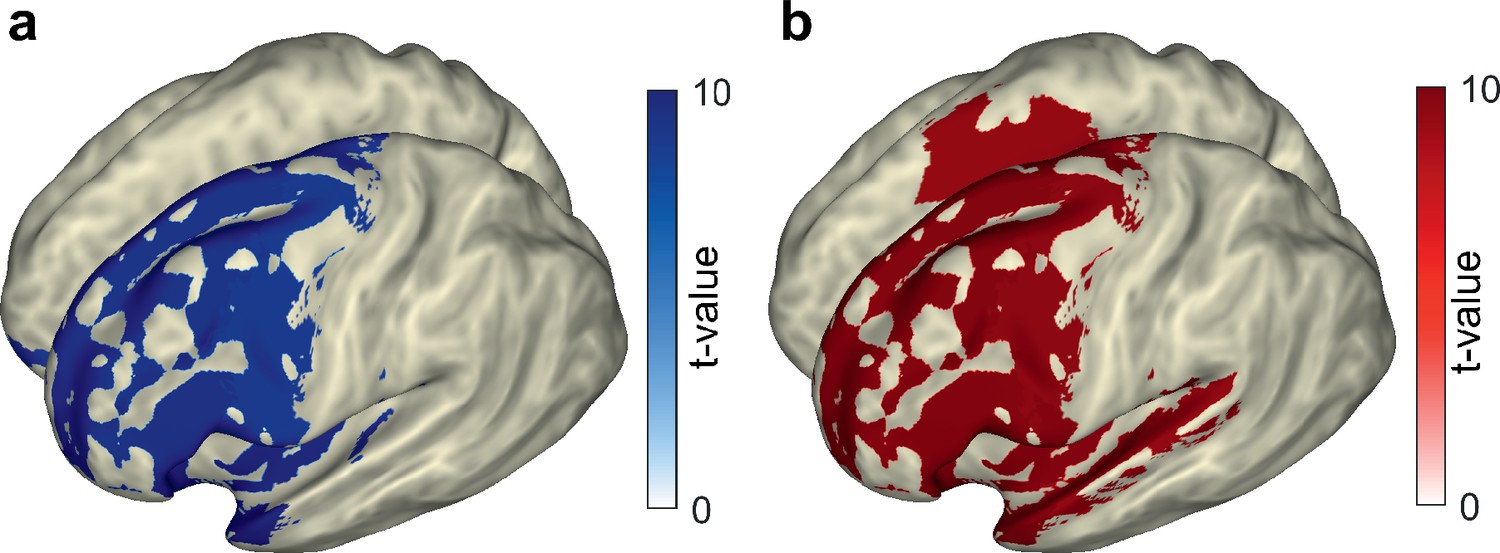
(a) The area of significant activation (t-value>8) during encoding compared to fixation is averaged for the group of participants and is projected onto an inflated brain surface. The most significant increase appears on sources over the left lateral prefrontal cortex. The spatial activation pattern at the cortical level spreads mostly over the left hemisphere (left frontal area, temporal pole, temporal superior gyrus, and Heschl gyrus). On the right hemisphere, there is only a small orbitofrontal activation. (b) The area of significant activation (t-value>8) during maintenance compared to fixation is projected onto an inflated brain surface. The most significant increase appears on sources over the left temporal superior gyrus (auditory cortex). The spatial activation pattern at the cortical level spreads mostly over the left hemisphere (left frontal area, temporal pole, temporal superior gyrus, and Heschl gyrus). On the right hemisphere, an activation appears on premotor/motor cortex. The spatial activation pattern derives from a non-parametric cluster-based permutation t-test (N=1000 permutations, significance established at t>1.96 and p<0.05). The activation map is thresholded at the 80% of the maximal t-value. Blue colorbar: encoding, red colorbar: maintenance.
Author response image 1
Tables
Table 1
Participant characteristics and results of Granger causality analysis.
For each participant, we report the atlas parcels that contained EEG sources with the maximal t-value and the t-value of sources in auditory cortex (Heschl gyrus) during encoding and maintenance (non-parametric cluster-based permutation test p<0.05). In each participant, the vast majority of the significant LCMV sources were in the left hemisphere, both during encoding (≥87%) and during maintenance (≥81%). We also report the net information flow (ΔGranger) for correct and incorrect trials in the direction auditory cortex → hippocampus during encoding and in the direction hippocampus → auditory cortex during maintenance.
| Participant | Pathology | Encoding | Maintenance | ||||||||||
|---|---|---|---|---|---|---|---|---|---|---|---|---|---|
| Maximal LCMV source | Significant LCMV sources in the left hemisphere (%) | max. t-value | Heschl t-value | Heschl ΔGranger correct trials | Heschl ΔGranger incorrect trials | Maximal LCMV source | Significant LCMV sources in the left hemisphere (%) | max. t-value | Heschl t-value | Heschl ΔGranger correct trials | Heschl ΔGranger incorrect trials | ||
| 1 | hippocampal sclerosis | Heschl / Temporal Inferior L | 100 | 17.8 | 17.8 | –0.036 | 0.087 | Frontal Mid Orb / Heschl L | 100 | 10.1 | 10.1 | 0.025 | –0.037 |
| 2 | non-lesional | Heschl L | 100 | 19.8 | 19.8 | –0.017 | 0.016 | Temporal Inferior L | 96 | 11.4 | 10 | 0.093 | 0.002 |
| 3 | focal cortical dysplasia | Temporal Superior L | 91 | 24.2 | 16.3 | –0.060 | –0.013 | Heschl L | 91 | 14.6 | 14.6 | 0.065 | 0.005 |
| 4 | unclear etiology | Frontal Inferior L | 100 | 18.3 | 16.6 | –0.006 | 0.003 | Heschl L | 100 | 13.4 | 13.4 | 0.035 | –0.002 |
| 5 | brain contusion | Temporal Superior L | 100 | 6.9 | 5.4 | –0.003 | –0.002 | Heschl L | 96 | 7.6 | 7.6 | 0.021 | 0.048 |
| 6 | hippocampal sclerosis | Supramarginal L | 98 | 11.1 | 9.7 | –0.049 | 0.025 | Temporal Pole Superior L | 93 | 19.8 | 17.9 | 0.039 | –0.024 |
| 7 | xanthoastrozytoma | Lingual R | 87 | 12.9 | 11.5 | –0.059 | 0.042 | Caudate L | 85 | 9.3 | 8.2 | 0.042 | –0.036 |
| 8 | focal cortical dysplasia | Caudate L | 100 | 18.8 | 16.2 | –0.040 | 0.013 | Parietal Superior L | 100 | 9.9 | 8.3 | 0.017 | –0.031 |
| 9 | gliosis | Cingulum Anterior L | 100 | 12.3 | 11.2 | –0.051 | 0.012 | Parietal Inferior L | 100 | 12.6 | 11.2 | 0.050 | –0.015 |
| 10 | hippocampal sclerosis | Heschl L | 100 | 7.9 | 7.9 | –0.070 | –0.016 | Cingulum Mid L | 100 | 2.7 | 2.3 | 0.018 | –0.081 |
| 11 | hippocampal sclerosis | Cingulum Anterior L | 100 | 10.8 | 6.3 | –0.052 | –0.011 | Cuneus L | 86 | 4.8 | 4.3 | 0.020 | –0.062 |
| 12 | hippocampal sclerosis | Temporal Superior L | 95 | 8.1 | 6.7 | –0.022 | 0.000 | Temporal Pole Mid L | 100 | 7.3 | 4.9 | 0.012 | 0.003 |
| 13 | hippocampal sclerosis | Temporal Superior R | 93 | 10.8 | 6.9 | –0.018 | 0.019 | Parietal Superior R | 81 | 5.6 | 4.9 | 0.020 | –0.022 |
| 14 | hippocampal sclerosis | Temporal Superior L | 100 | 16.8 | 13.3 | –0.053 | 0.022 | Heschl L | 100 | 11.8 | 11.8 | 0.085 | –0.089 |
| 15 | hippocampal sclerosis | Heschl L | 98 | 9.1 | 9.1 | –0.061 | –0.005 | Heschl L | 100 | 10.4 | 10.4 | 0.069 | –0.004 |
-
LCMV, linearly constrained minimum variance; ΔGranger, difference of GC spectra.
Additional files
-
MDAR checklist
- https://cdn.elifesciences.org/articles/78677/elife-78677-mdarchecklist1-v1.docx
-
Supplementary file 1
ECoG and LFP recording locations.
For each participant, we list the coordinates of the tip of the hippocampal electrode for LFP recording. In addition, in Participants 1–4, grid or strip electrodes were placed for ECoG recording. LFP: local field potential; ECoG: electrocorticography.
- https://cdn.elifesciences.org/articles/78677/elife-78677-supp1-v1.xlsx
Download links
A two-part list of links to download the article, or parts of the article, in various formats.
Downloads (link to download the article as PDF)
Open citations (links to open the citations from this article in various online reference manager services)
Cite this article (links to download the citations from this article in formats compatible with various reference manager tools)
Information flows from hippocampus to auditory cortex during replay of verbal working memory items
eLife 11:e78677.
https://doi.org/10.7554/eLife.78677


