Subfunctionalized expression drives evolutionary retention of ribosomal protein paralogs Rps27 and Rps27l in vertebrates
- Department of Genetics, Stanford University, United States
- Medical Scientist Training Program, Stanford School of Medicine, United States
- Department of Molecular, Cell, and Developmental Biology, University of California, Santa Cruz, United States
- Helen Diller Family Comprehensive Cancer Center, University of California, Los Angeles, United States
- Department of Cellular and Molecular Pharmacology, University of California, San Francisco, United States
- Department of Urology, University of California, San Francisco, United States
- Department of Chemical and Systems Biology, Stanford University, United States
- Department of Biology, Stanford University, United States
- Department of Comparative Medicine, Stanford School of Medicine, United States
Figures
Figure 1 with 2 supplements
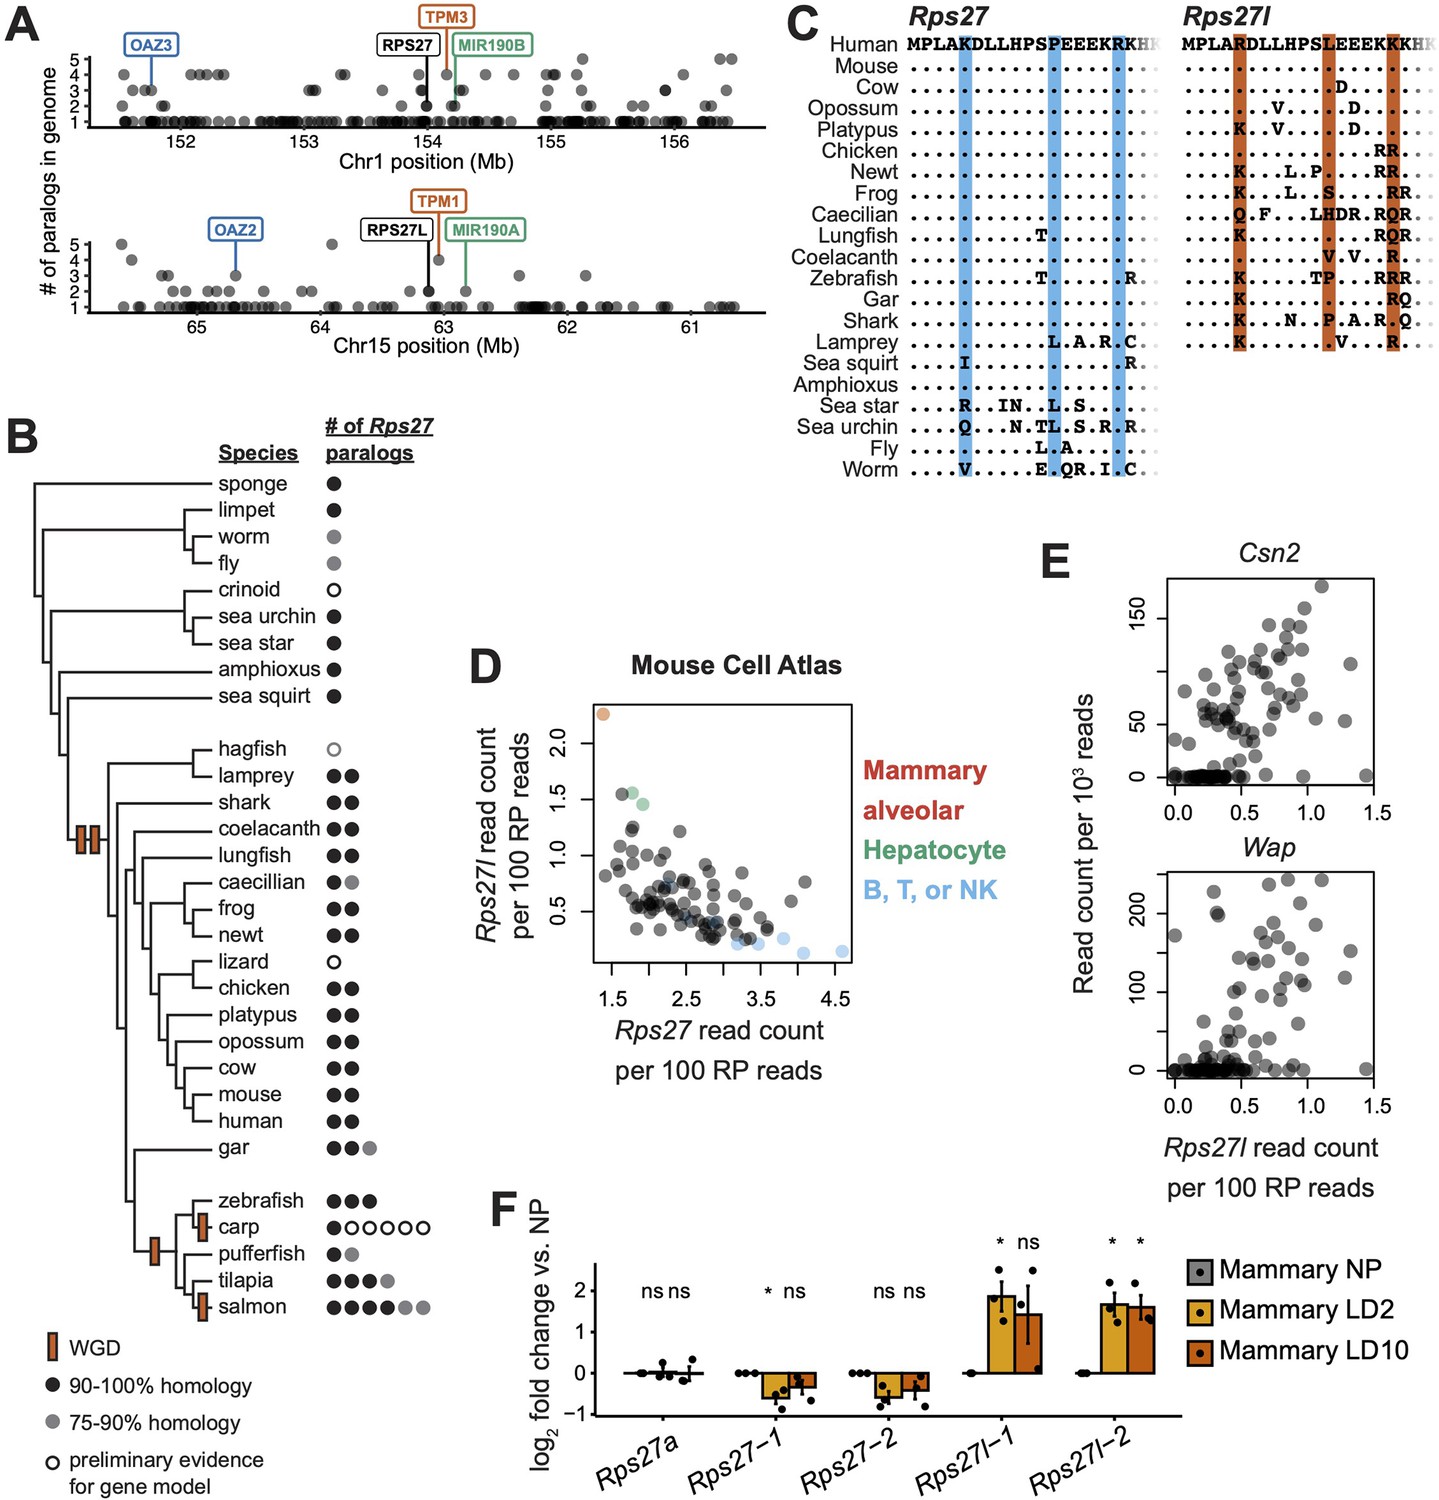
Rps27 and Rps27l evolutionary origin and cell type-specific mRNA abundance.
(A) 5 Mb windows centered on the Rps27 and Rps27l loci in human genome (GRCh38.p13). Points indicate individual Ensembl-annotated (version 109) genes. Y-axis indicates total number of Ensembl-annotated paralogs in the genome for each gene. Label colors indicate paralogous genes. (B) Phylogenetic tree of representative animal species showing putative timing of whole-genome duplications (WGD) and number of Rps27 paralogs per species. See details for included genes in Supplementary file 1. (C) Multi-species alignment of Rps27 and Rps27l N-terminal protein sequences. For species with >2 Rps27 paralogs, the protein sequences with the highest homology to human Rps27 and Rps27l are shown. The three residues that differ between Rps27 and Rps27l in human and mouse are shaded. (D) Rps27 and Rps27l scRNA-seq values across cell types from the Mouse Cell Atlas (Han et al., 2018; Pearson’s r = –0.58, p=4.4e-09). See also Figure 1—figure supplement 2. (E) Correlation between Rps27l and milk protein transcripts in scRNA-seq (Bach et al., 2017) from alveolar cells in lactating mammary glands (‘Avd-L’ cells as termed by Bach et al.). Csn2: Spearman’s ρ = 0.63, p=5.7e-13. Wap: Spearman’s ρ = 0.56, p=6.7e-10. (F) RT-qPCR of Rps27, Rps27l, and a control RP gene, Rps27a, in mammary glands of nulliparous and lactating female mice. Values are normalized to Rps6 and are shown as log fold differences over NP. For Rps27 and Rps27l, two independent primer sets (‘–1’ and ‘–2’) were used. n = 3 biological replicates. Significance compared to NP was assessed by t-test. Rps27-1 LD2: p=0.050; Rps27l-1 LD2: p=0.035; Rps27l-2 LD2: p=0.028; Rps27l-2 LD10: p=0.032. ‘ns’ indicates p>0.05. Error bars show standard error.
Figure 1—figure supplement 1
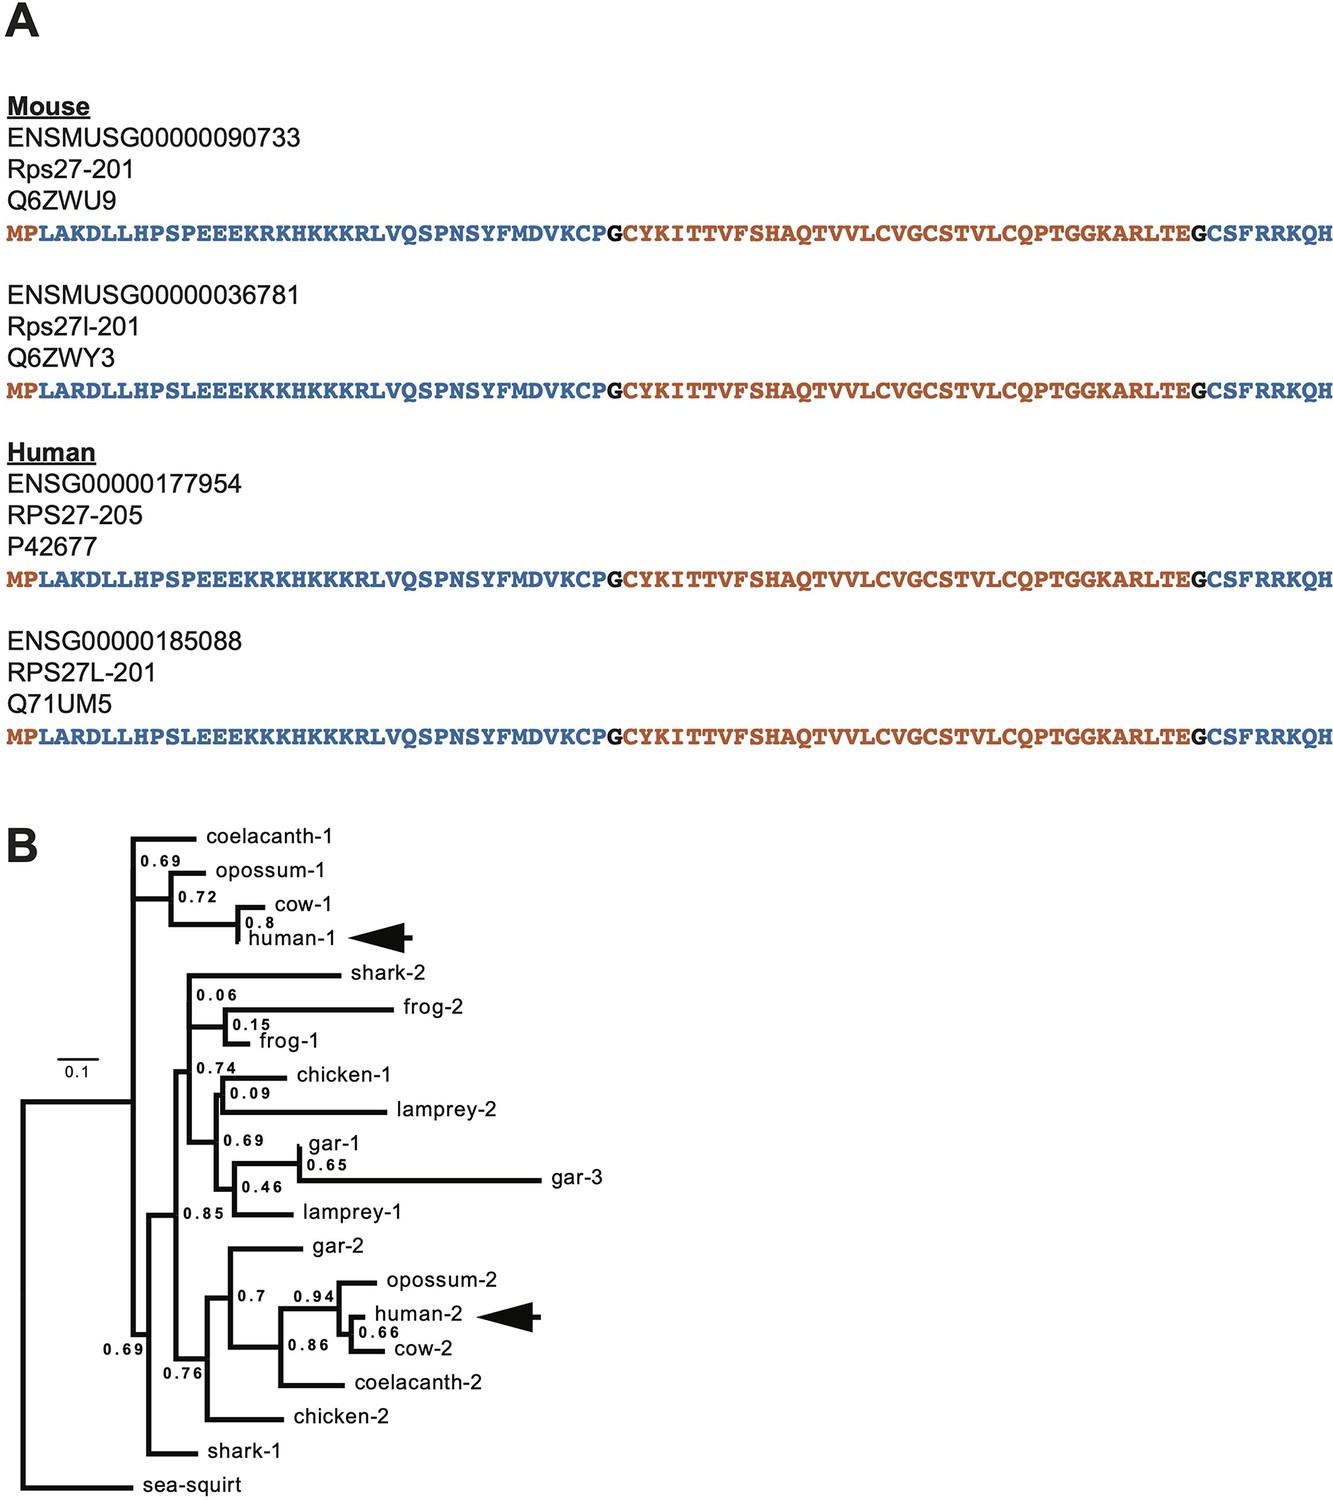
Supplementary cross-species comparison of Rps27 and Rps27l.
(A) Protein sequences of human and mouse Rps27 and Rps27l. Blue and orange denote segments encoded by alternating exons. Black residues denote positions split across an exon junction. (B) Phylogenetic tree constructed from Rps27/Rps27l ortholog coding sequences in representative vertebrate species, rooted by the outgroup sea squirt. Numbers are a shorthand identification for Rps27 paralogs within a species, with ‘1’ being the paralog with the greatest sequence homology to human RPS27 protein. Arrows denote the two human paralogs, human-1 (RPS27) and human-2 (RPS27L). For additional details of the sequences used, see Supplementary file 1.
Figure 1—figure supplement 2
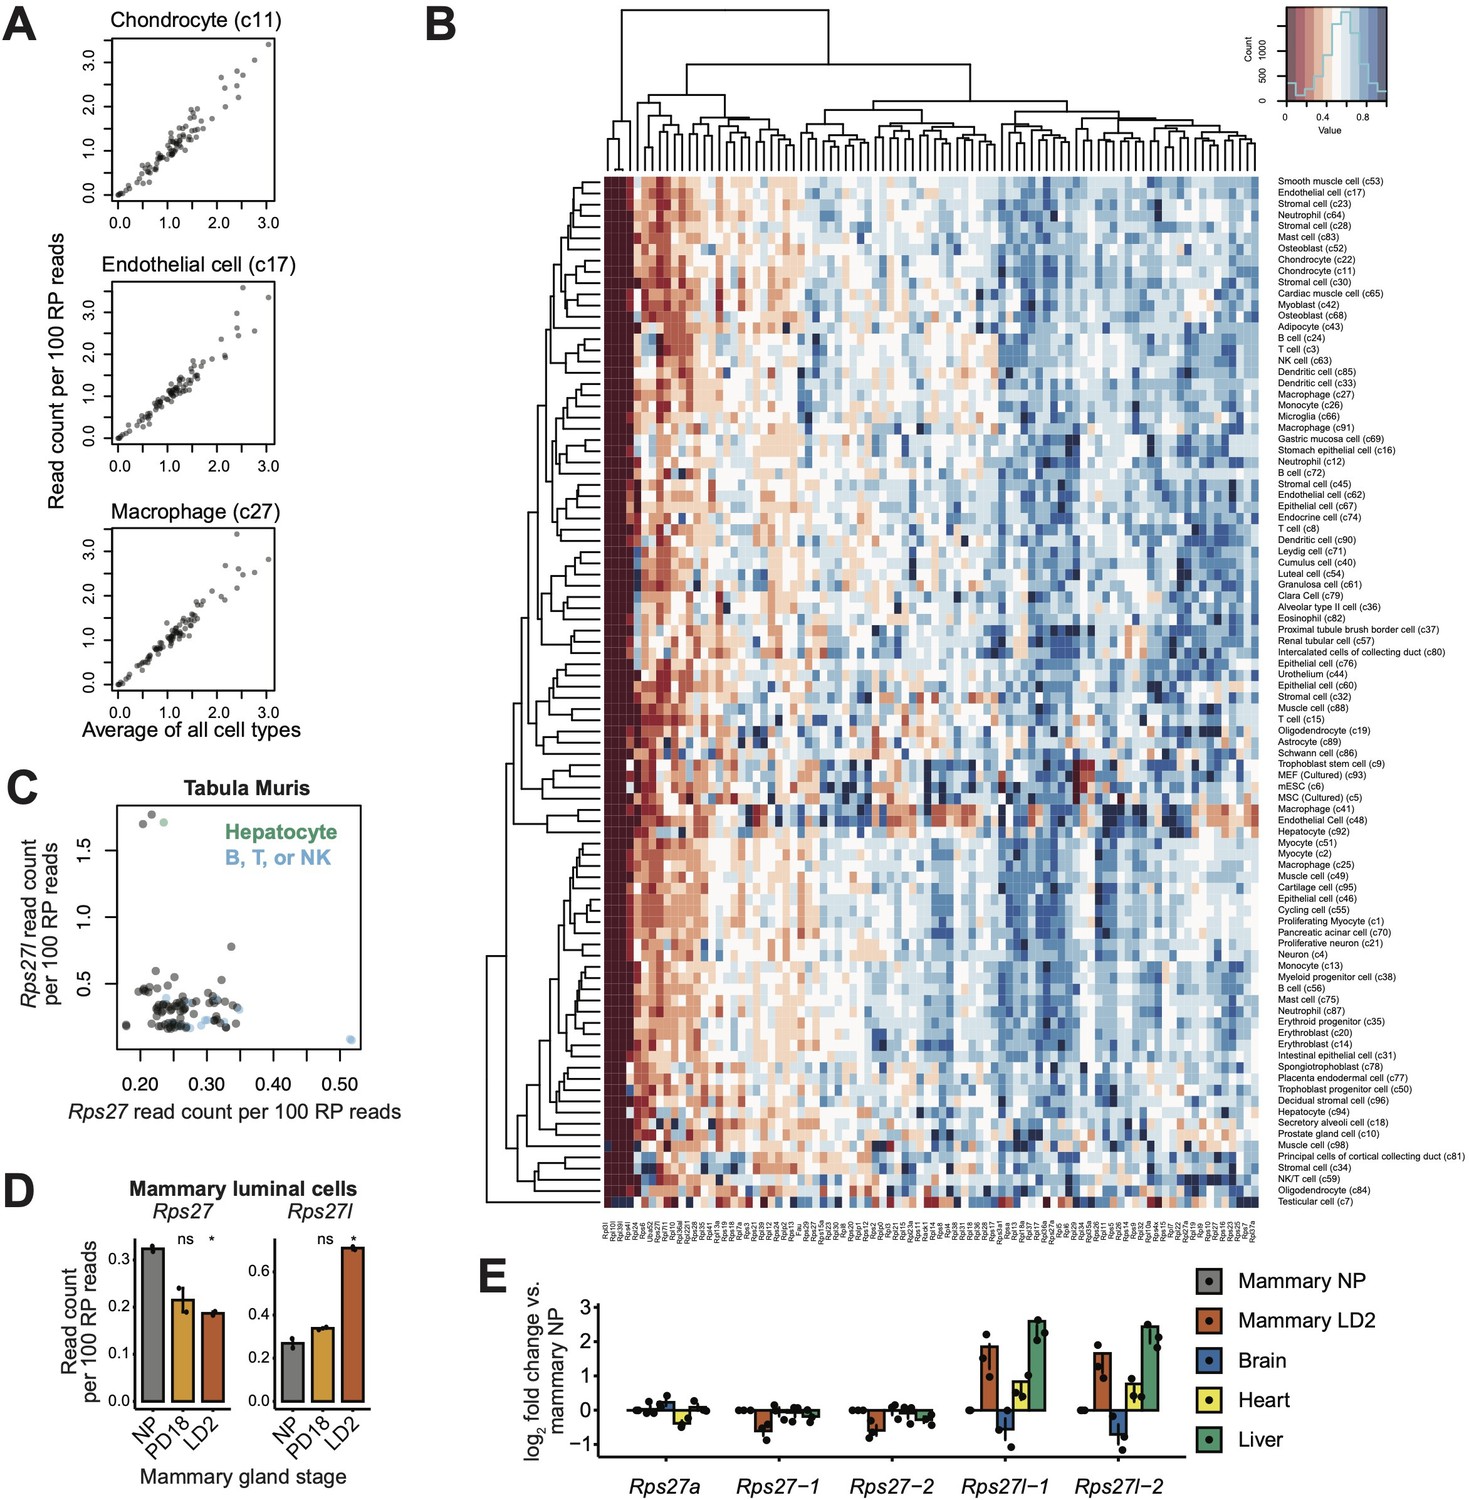
Supplementary cell type-dependent expression data for Rps27 and Rps27l.
(A) Using single-cell RNA-seq data from the Mouse Cell Atlas (Han et al., 2018), correlation of transcript abundance among RP genes is plotted for three example cell types (y-axis) against the average values across all cell types (x-axis). Each point represents an RP gene. Chondrocytes: Pearson’s r = 0.97, p-value <2.2e-16. Endothelial cells: Pearson’s r = 0.97, p-value<2.2e-16. Macrophages: Pearson’s r = 0.97, p-value<2.2e-16. ‘c11,’ ‘c17,’ and ‘c27’ refer to the cell--type cluster IDs as annotated by Han et al. (B) Expression patterns for RP genes across all cell types in the Mouse Cell Atlas. Read counts are normalized per 100 RP reads and scaled to the maximum value for each gene. (C) Rps27 and Rps27l scRNA-seq values across cell types from Tabula Muris (Tabula Muris Consortium, 2018; Pearson’s r = –0.23, p=0.024). (D) Rps27 and Rps27l RNA-seq values (Fu et al., 2015) in flow-sorted mammary luminal cells from nulliparous (NP), pregnancy day 18.5 (PD18), and lactation day 2 (LD2) mice. n = 2 biological replicates (individual animals). Significance compared to NP was assessed by t-test. Rps27 LD2: p=0.0049; Rps27l LD2: p=0.016. ‘ns’ indicates p>0.05. Error bars show standard error. (E) RT-qPCR of Rps27, Rps27l, and a control RP gene, Rps27a, in mammary glands, heart, liver, and brain of LD2 female mice. Values are normalized to Rps6 and are shown as log fold differences over NP mammary gland. n = 3 biological replicates. Error bars show standard error.
Figure 2
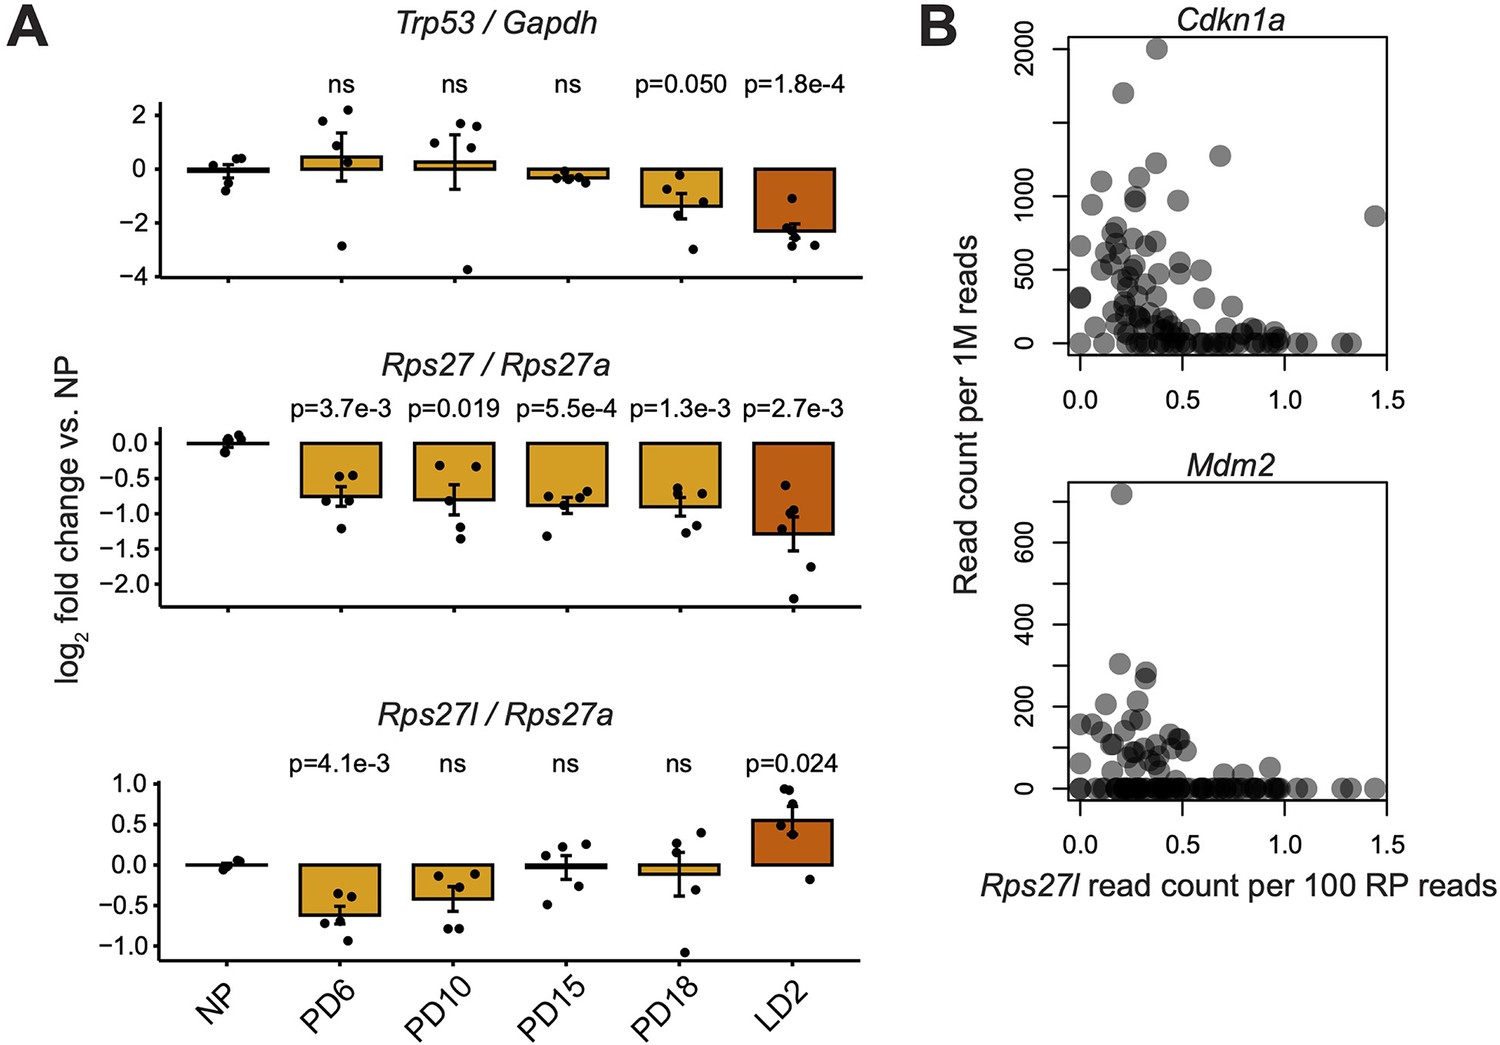
Comparison of Rps27 and Rps27l mRNA abundance versus Trp53 expression and activity.
(A) RT-qPCR of Rps27, Rps27l, and Trp53 in mammary glands at nulliparous (NP), pregnancy days 6–18 (PD6–18), and lactation day 2 (LD2) timepoints. Rps27 and Rps27l are normalized by ribosomal protein (RP) Rps27a. Trp53 is normalized by Gapdh. n = 5–6 biological replicates (individual animals) per timepoint. Significance versus NP was assessed by t-test. ‘ns’ indicates p>0.05. Error bars show standard error. (B) Correlation between Rps27l and other targets of Trp53 transcriptional activation in scRNA-seq of alveolar cells from lactating mammary glands (Bach et al., 2017). Cdkn1a: Spearman’s ρ = –0.51, p=3.7e-8. Mdm2: Spearman’s ρ = –0.37, p=1.2e-4.
Figure 3 with 1 supplement
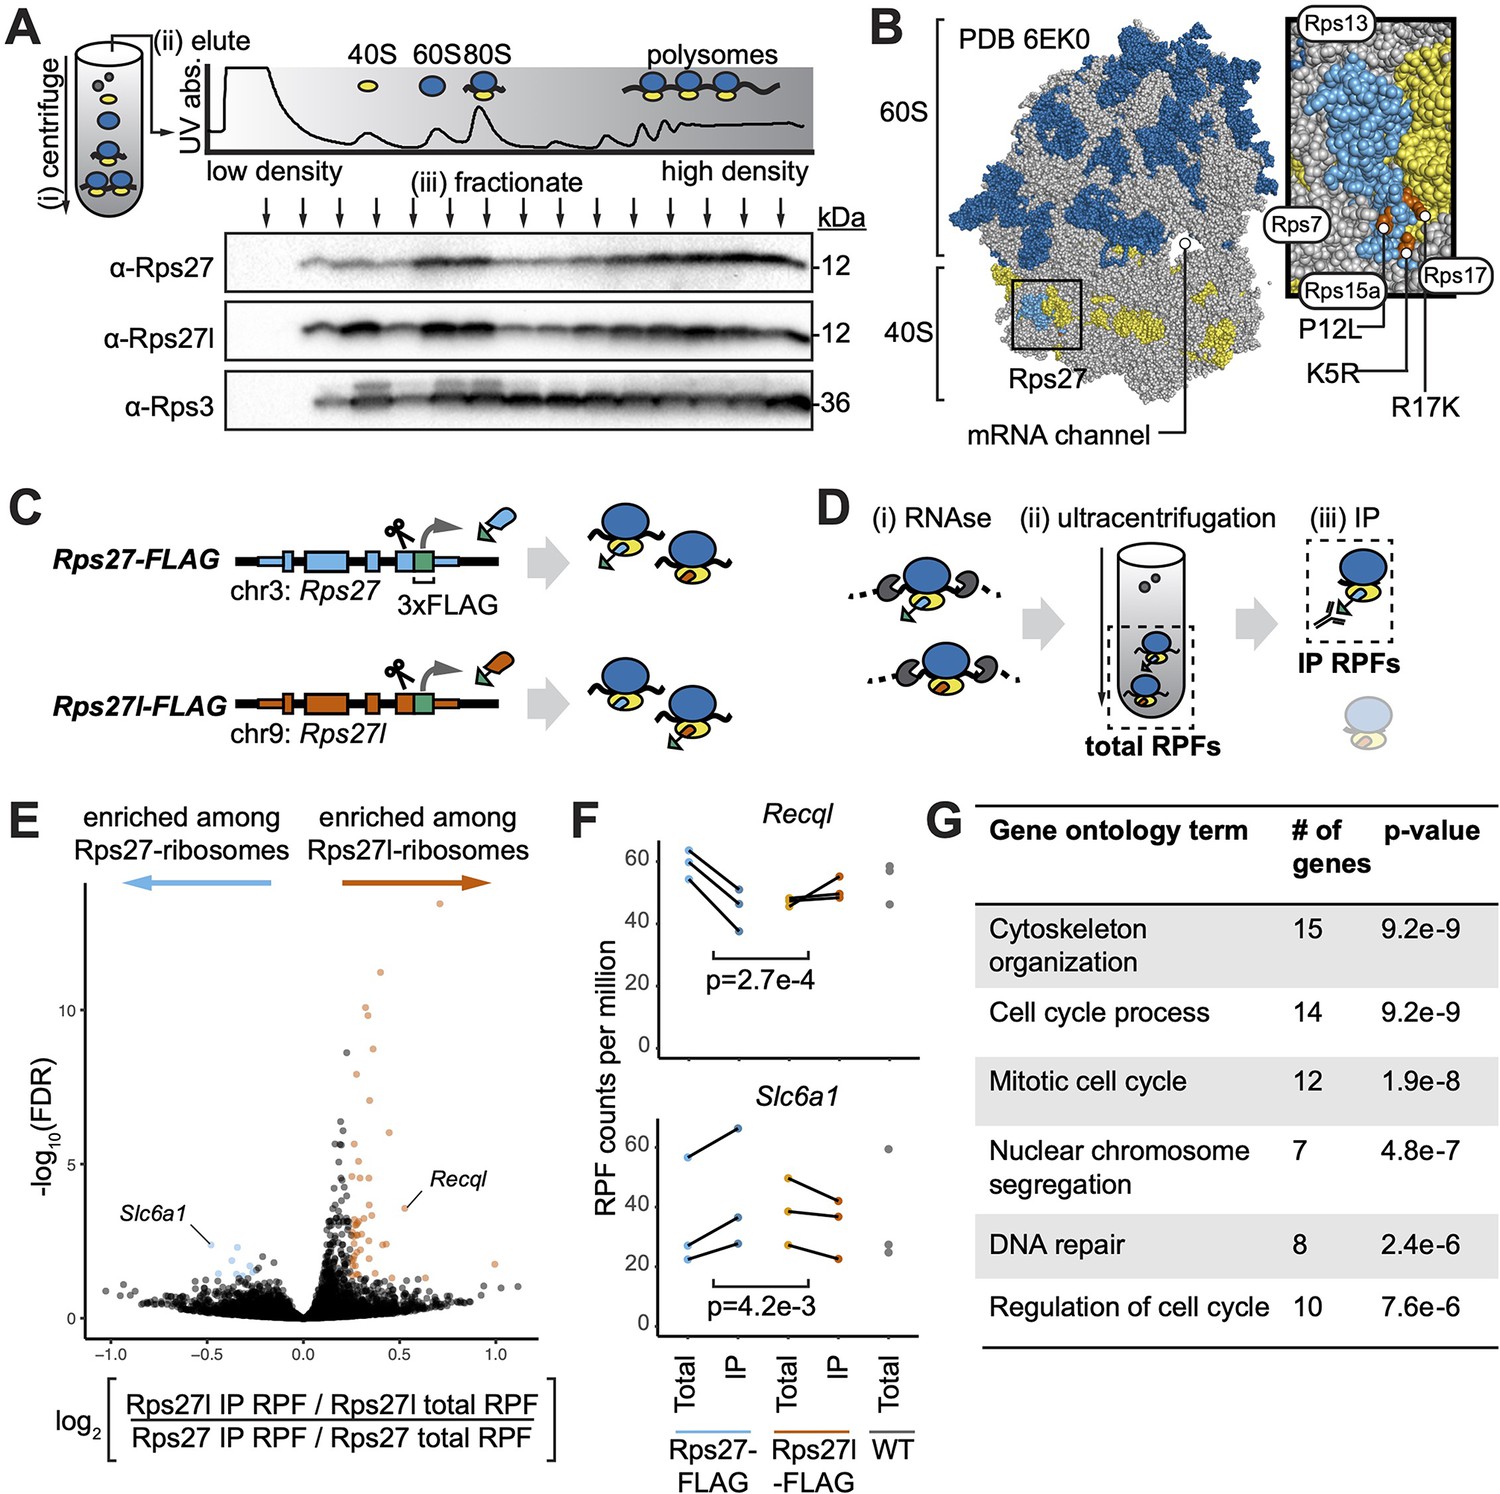
Paralog-specific ribosome profiling reveals preferential association of Rps27l-ribosomes with cell cycle-related mRNAs.
(A) Fractionation of mouse embryonic stem cell (mESC) lysate by density to separate non-ribosomal proteins, ribosome 40S and 60S subunits, mRNAs bound by one ribosome (80S), and mRNAs bound by multiple ribosomes (polysomes). See Figure 3—source data 1–3. (B) Ribosome structure showing the 60S subunit (with 28S rRNA in dark blue), 40S subunit (with 18S rRNA in yellow), and Rps27 protein (light blue) within the 40S. Orange denotes residues that differ between Rps27 and Rps27l. Gray denotes other RPs. Neighboring RPs are labeled. (C) CRISPR-mediated insertion of 3xFLAG epitope tag C-terminally at the endogenous Rps27 and Rps27l genomic loci in mESCs. (D) FLAG-IP ribosome profiling of paralog-containing ribosomes. (i) Cell lysate is treated with RNAse to digest mRNA sequences that are not protected by bound ribosomes. (ii) Ribosomes and associated ribosome-protected fragments (RPFs) are collected by ultracentrifugation. These are termed total RPFs. (iii) anti-FLAG immunoprecipitation (IP) is performed on total ribosomes. IP RPFs are eluted. (E) Comparison of RPFs enriched after IP in Rps27l-FLAG versus Rps27-FLAG mESCs. (F) Examples of genes differentially enriched upon Rps27-FLAG or Rps27l-FLAG pulldown. Significance was assessed using an empirical Bayes method for detecting differential expression, applied to a multilevel linear model to find genes whose RPF abundance is differentially affected by IP from Rps27- and Rps27l-FLAG mESCs. n = 3 biological replicates (independent mESC clones). Multiple-hypothesis-corrected false discovery rates (FDRs) are shown. (G) Top enriched gene ontology terms for RPFs that preferentially associate with Rps27l-ribosomes. See also Figure 3—figure supplement 1 and Appendix 1—figure 1.
-
Figure 3—source data 1
Rps27 density fractionation western blot.
- https://cdn.elifesciences.org/articles/78695/elife-78695-fig3-data1-v2.zip
-
Figure 3—source data 2
Rps27l density fractionation western blot.
- https://cdn.elifesciences.org/articles/78695/elife-78695-fig3-data2-v2.zip
-
Figure 3—source data 3
Rps3 density fractionation western blot.
- https://cdn.elifesciences.org/articles/78695/elife-78695-fig3-data3-v2.zip
-
Figure 3—source data 4
Editable data from Figure 3G.
- https://cdn.elifesciences.org/articles/78695/elife-78695-fig3-data4-v2.xlsx
Figure 3—figure supplement 1
Supplementary Rps27 and Rps27l epitope tagging, immunoprecipitation, and ribosome profiling data.
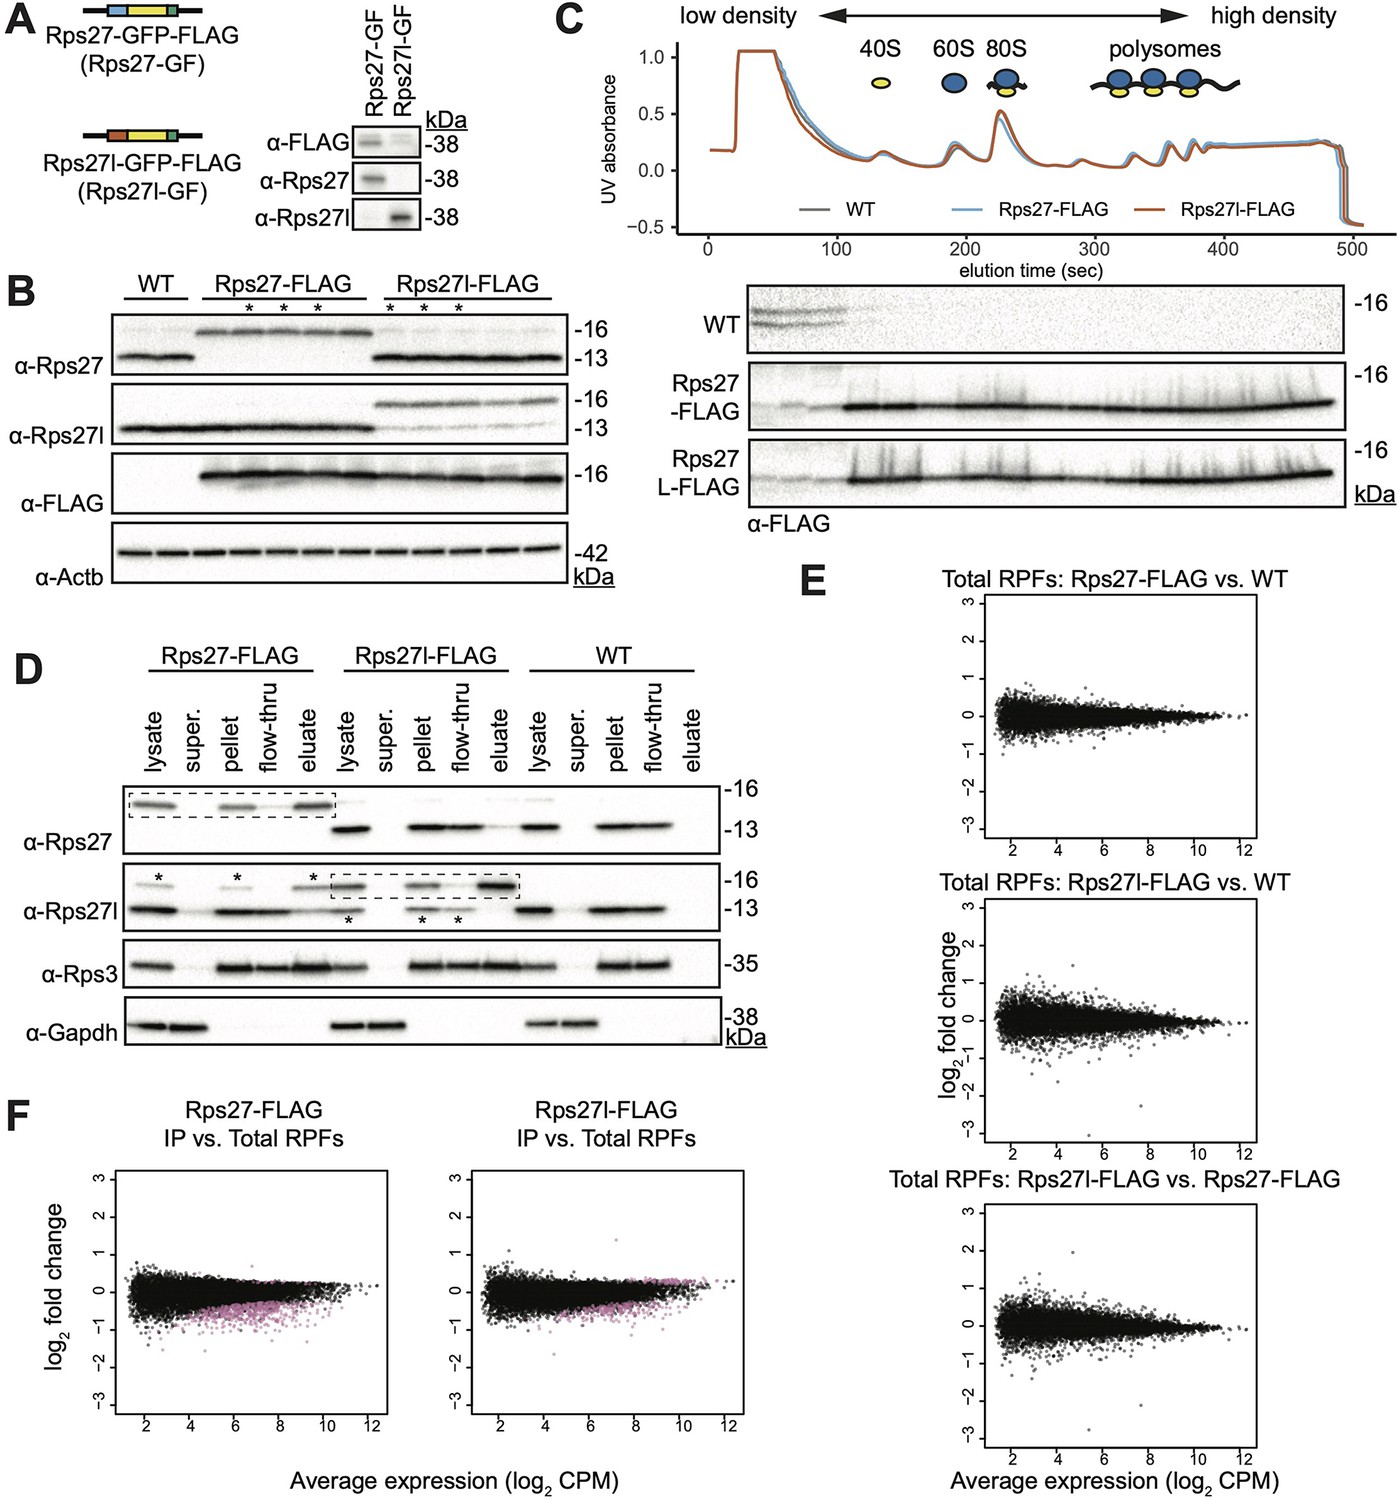
(A) Plasmids encoding Rps27- and Rps27l-GFP fusion proteins were transfected into mouse embryonic stem cells (mESCs). A western blot was performed on cell lysate using commercially available antibodies to assess whether they are paralog-specific. GFP fusion adds 27 kDa of molecular weight. The anti-Rps27l antibody has trace detection of Rps27. (B) Western blots of cell lysates from WT, Rps27-FLAG and Rps27l-FLAG mESCs. Each lane is an independently selected clone. Beta-actin is used as a loading control. Clones with an asterisk (*) were used as biological replicates in subsequent experiments. (C) Western blot of density-fractionated cell lysates from Rps27- and Rps27l-FLAG mESCs. A representative UV absorbance trace and blot from each mESC line is shown. (D) Western blot of cell lysates from one biological replicate each of Rps27-FLAG, Rps27l-FLAG, and WT mESCs; supernatant containing no ribosomes after ultracentrifugation; pellet containing total ribosomes after centrifugation, used as input for FLAG immunoprecipitation (IP); flow-through of FLAG IP, and eluate of FLAG-IP. Rps3 is shown as a typical ribosomal protein (RP) that is also in the 40S small subunit. Gapdh is shown as a typical protein that is not ribosome-associated. Dashed boxes indicate the Rps27-FLAG or Rps27l-FLAG protein targeted for IP in the respective cell lines. Asterisks in the anti-Rps27l blot indicate trace detection of Rps27 by the Rps27l antibody. (E) Comparison of total ribosome-protected fragments (RPFs) between Rps27-FLAG, Rps27l-FLAG and passage-matched wild-type (WT) control cell line. CPM, counts per million. (F) Comparison of IP RPFs versus total RPFs in Rps27-FLAG and Rps27l-FLAG mESCs. Purple indicates enriched or depleted transcripts at a multiple-hypothesis-corrected false discovery rate (FDR) < 0.05 using the same statistical test described in Figure 3. See also Supplementary file 3 and Figure 3—figure supplement 1—source data 1–14.
-
Figure 3—figure supplement 1—source data 1
Rps27-GFP-FLAG and Rps27l-GFP-FLAG, FLAG western blot.
- https://cdn.elifesciences.org/articles/78695/elife-78695-fig3-figsupp1-data1-v2.zip
-
Figure 3—figure supplement 1—source data 2
Rps27-GFP-FLAG and Rps27l-GFP-FLAG, Rps27 western blot.
- https://cdn.elifesciences.org/articles/78695/elife-78695-fig3-figsupp1-data2-v2.zip
-
Figure 3—figure supplement 1—source data 3
Rps27-GFP-FLAG and Rps27l-GFP-FLAG, Rps27l western blot.
- https://cdn.elifesciences.org/articles/78695/elife-78695-fig3-figsupp1-data3-v2.zip
-
Figure 3—figure supplement 1—source data 4
Rps27-FLAG and Rps27l-FLAG mouse embryonic stem cells (mESCs), Rps27 western blot.
- https://cdn.elifesciences.org/articles/78695/elife-78695-fig3-figsupp1-data4-v2.zip
-
Figure 3—figure supplement 1—source data 5
Rps27-FLAG and Rps27l-FLAG mouse embryonic stem cells (mESCs), Rps27l western blot.
- https://cdn.elifesciences.org/articles/78695/elife-78695-fig3-figsupp1-data5-v2.zip
-
Figure 3—figure supplement 1—source data 6
Rps27-FLAG and Rps27l-FLAG mouse embryonic stem cells (mESCs), FLAG western blot.
- https://cdn.elifesciences.org/articles/78695/elife-78695-fig3-figsupp1-data6-v2.zip
-
Figure 3—figure supplement 1—source data 7
Rps27-FLAG and Rps27l-FLAG mouse embryonic stem cells (mESCs), beta-actin western blot.
- https://cdn.elifesciences.org/articles/78695/elife-78695-fig3-figsupp1-data7-v2.zip
-
Figure 3—figure supplement 1—source data 8
WT mouse embryonic stem cell (mESC) density fractionation, FLAG western blot.
- https://cdn.elifesciences.org/articles/78695/elife-78695-fig3-figsupp1-data8-v2.zip
-
Figure 3—figure supplement 1—source data 9
Rps27-FLAG mouse embryonic stem cell (mESC) density fractionation, FLAG western blot.
- https://cdn.elifesciences.org/articles/78695/elife-78695-fig3-figsupp1-data9-v2.zip
-
Figure 3—figure supplement 1—source data 10
Rps27l-FLAG mouse embryonic stem cell (mESC) density fractionation, FLAG western blot.
- https://cdn.elifesciences.org/articles/78695/elife-78695-fig3-figsupp1-data10-v2.zip
-
Figure 3—figure supplement 1—source data 11
Rps27-FLAG and Rps27l-FLAG mouse embryonic stem cell (mESC) FLAG-IP, Rps27 western blot.
- https://cdn.elifesciences.org/articles/78695/elife-78695-fig3-figsupp1-data11-v2.zip
-
Figure 3—figure supplement 1—source data 12
Rps27-FLAG and Rps27l-FLAG mouse embryonic stem cell (mESC) FLAG-IP, Rps27l western blot.
- https://cdn.elifesciences.org/articles/78695/elife-78695-fig3-figsupp1-data12-v2.zip
-
Figure 3—figure supplement 1—source data 13
Rps27-FLAG and Rps27l-FLAG mouse embryonic stem cell (mESC) FLAG-IP, Rps3 western blot.
- https://cdn.elifesciences.org/articles/78695/elife-78695-fig3-figsupp1-data13-v2.zip
-
Figure 3—figure supplement 1—source data 14
Rps27-FLAG and Rps27l-FLAG mouse embryonic stem cell (mESC) FLAG-IP, Gapdh western blot.
- https://cdn.elifesciences.org/articles/78695/elife-78695-fig3-figsupp1-data14-v2.zip
Figure 4
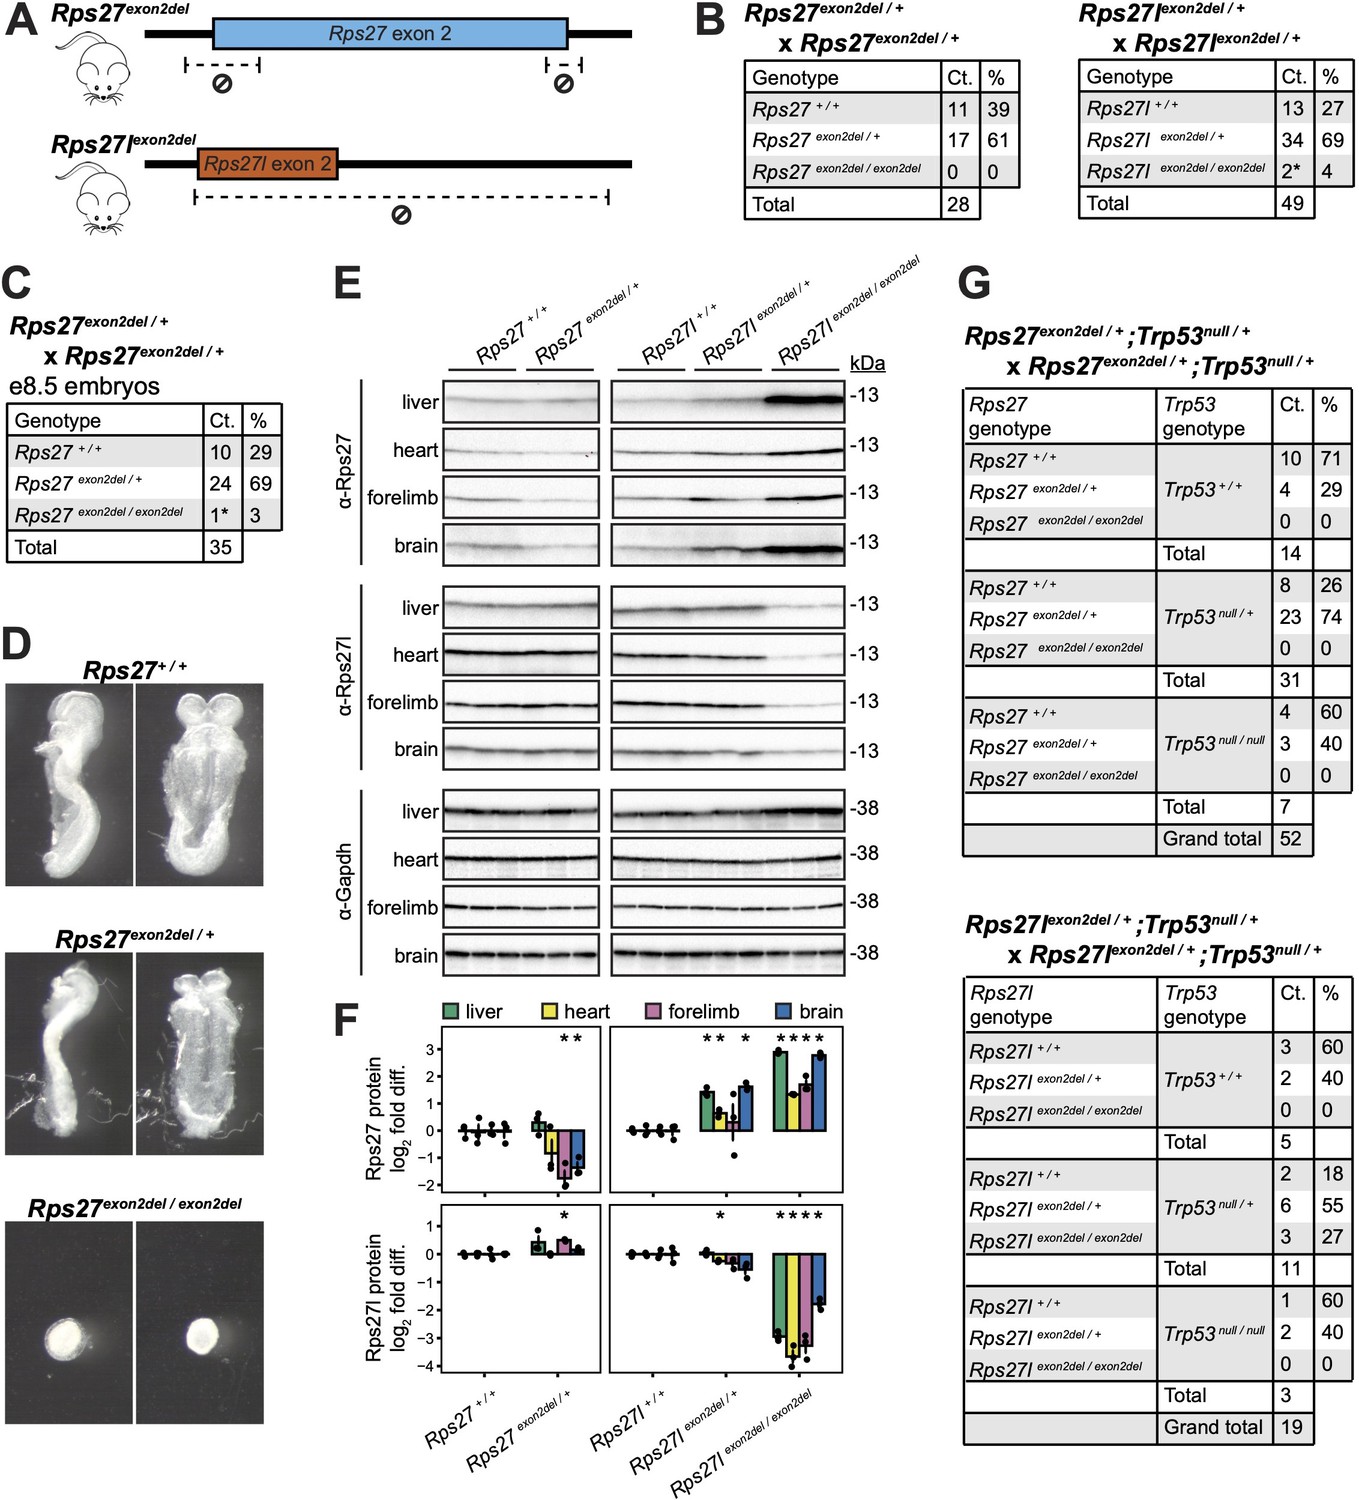
Rps27 and Rps27l truncation alleles are homozygous lethal at embryonic and early postnatal stages, respectively.
(A) CRISPR-mediated deletions in Rps27exon2del and Rps27lexon2del alleles. (B) Genotype ratios among live offspring of Rps27exon2del / + and Rps27lexon2del / + heterozygous crosses at postnatal day 13 (P13). * indicates animals that died or required euthanasia by postnatal days 13–17 (P13–17). (C) Genotype ratios and (D) photographs of embryonic day 8.5 (e8.5) embryos from Rps27exon2del / + heterozygous crosses. * indicates severely delayed development. (E) Western blots of postnatal day 0 (P0) tissues with Gapdh as loading control and n = 3 biological replicates (animals) per genotype. The early embryonic lethal Rps27exon2del / exon2del genotype was excluded due to lack of sufficient obtainable tissue. (F) Rps27 and Rps27l protein abundance in (E) quantified as Gapdh-normalized log2 fold difference relative to averaged +/+ samples for each tissue. Error bars show standard error. *p<0.05 by t-test; unmarked = not significant. (G) Genotype ratios among live offspring of Rps27exon2del / +;Trp53null / + double heterozygous crosses and Rps27lexon2del / +;Trp53null / + double heterozygous crosses at P13. See Figure 4—source data 1–15.
-
Figure 4—source data 1
Rps27exon2del P0 liver Rps27 western blot.
- https://cdn.elifesciences.org/articles/78695/elife-78695-fig4-data1-v2.zip
-
Figure 4—source data 2
Rps27lexon2del P0 liver Rps27 western blot.
- https://cdn.elifesciences.org/articles/78695/elife-78695-fig4-data2-v2.zip
-
Figure 4—source data 3
Rps27exon2del P0 heart Rps27 western blot.
- https://cdn.elifesciences.org/articles/78695/elife-78695-fig4-data3-v2.zip
-
Figure 4—source data 4
Rps27lexon2del P0 heart Rps27 western blot.
- https://cdn.elifesciences.org/articles/78695/elife-78695-fig4-data4-v2.zip
-
Figure 4—source data 5
Rps27exon2del, Rps27lexon2del P0 forelimb Rps27 western blot.
- https://cdn.elifesciences.org/articles/78695/elife-78695-fig4-data5-v2.zip
-
Figure 4—source data 6
Rps27exon2del, Rps27lexon2del P0 brain Rps27 western blot.
- https://cdn.elifesciences.org/articles/78695/elife-78695-fig4-data6-v2.zip
-
Figure 4—source data 7
Rps27exon2del, Rps27lexon2del P0 liver Rps27l western blot.
- https://cdn.elifesciences.org/articles/78695/elife-78695-fig4-data7-v2.zip
-
Figure 4—source data 8
Rps27exon2del, Rps27lexon2del P0 heart Rps27l western blot.
- https://cdn.elifesciences.org/articles/78695/elife-78695-fig4-data8-v2.zip
-
Figure 4—source data 9
Rps27exon2del, Rps27lexon2del P0 forelimb Rps27l western blot.
- https://cdn.elifesciences.org/articles/78695/elife-78695-fig4-data9-v2.zip
-
Figure 4—source data 10
Rps27exon2del, Rps27lexon2del P0 brain Rps27l western blot.
- https://cdn.elifesciences.org/articles/78695/elife-78695-fig4-data10-v2.zip
-
Figure 4—source data 11
Rps27exon2del, Rps27lexon2del P0 liver Gapdh western blot.
- https://cdn.elifesciences.org/articles/78695/elife-78695-fig4-data11-v2.zip
-
Figure 4—source data 12
Rps27exon2del, Rps27lexon2del P0 heart Gapdh western blot.
- https://cdn.elifesciences.org/articles/78695/elife-78695-fig4-data12-v2.zip
-
Figure 4—source data 13
Rps27exon2del, Rps27lexon2del P0 forelimb Gapdh western blot.
- https://cdn.elifesciences.org/articles/78695/elife-78695-fig4-data13-v2.zip
-
Figure 4—source data 14
Rps27exon2del, Rps27lexon2del P0 brain Gapdh western blot.
- https://cdn.elifesciences.org/articles/78695/elife-78695-fig4-data14-v2.zip
-
Figure 4—source data 15
Editable data from Figure 4B and G.
- https://cdn.elifesciences.org/articles/78695/elife-78695-fig4-data15-v2.xlsx
Figure 5 with 1 supplement
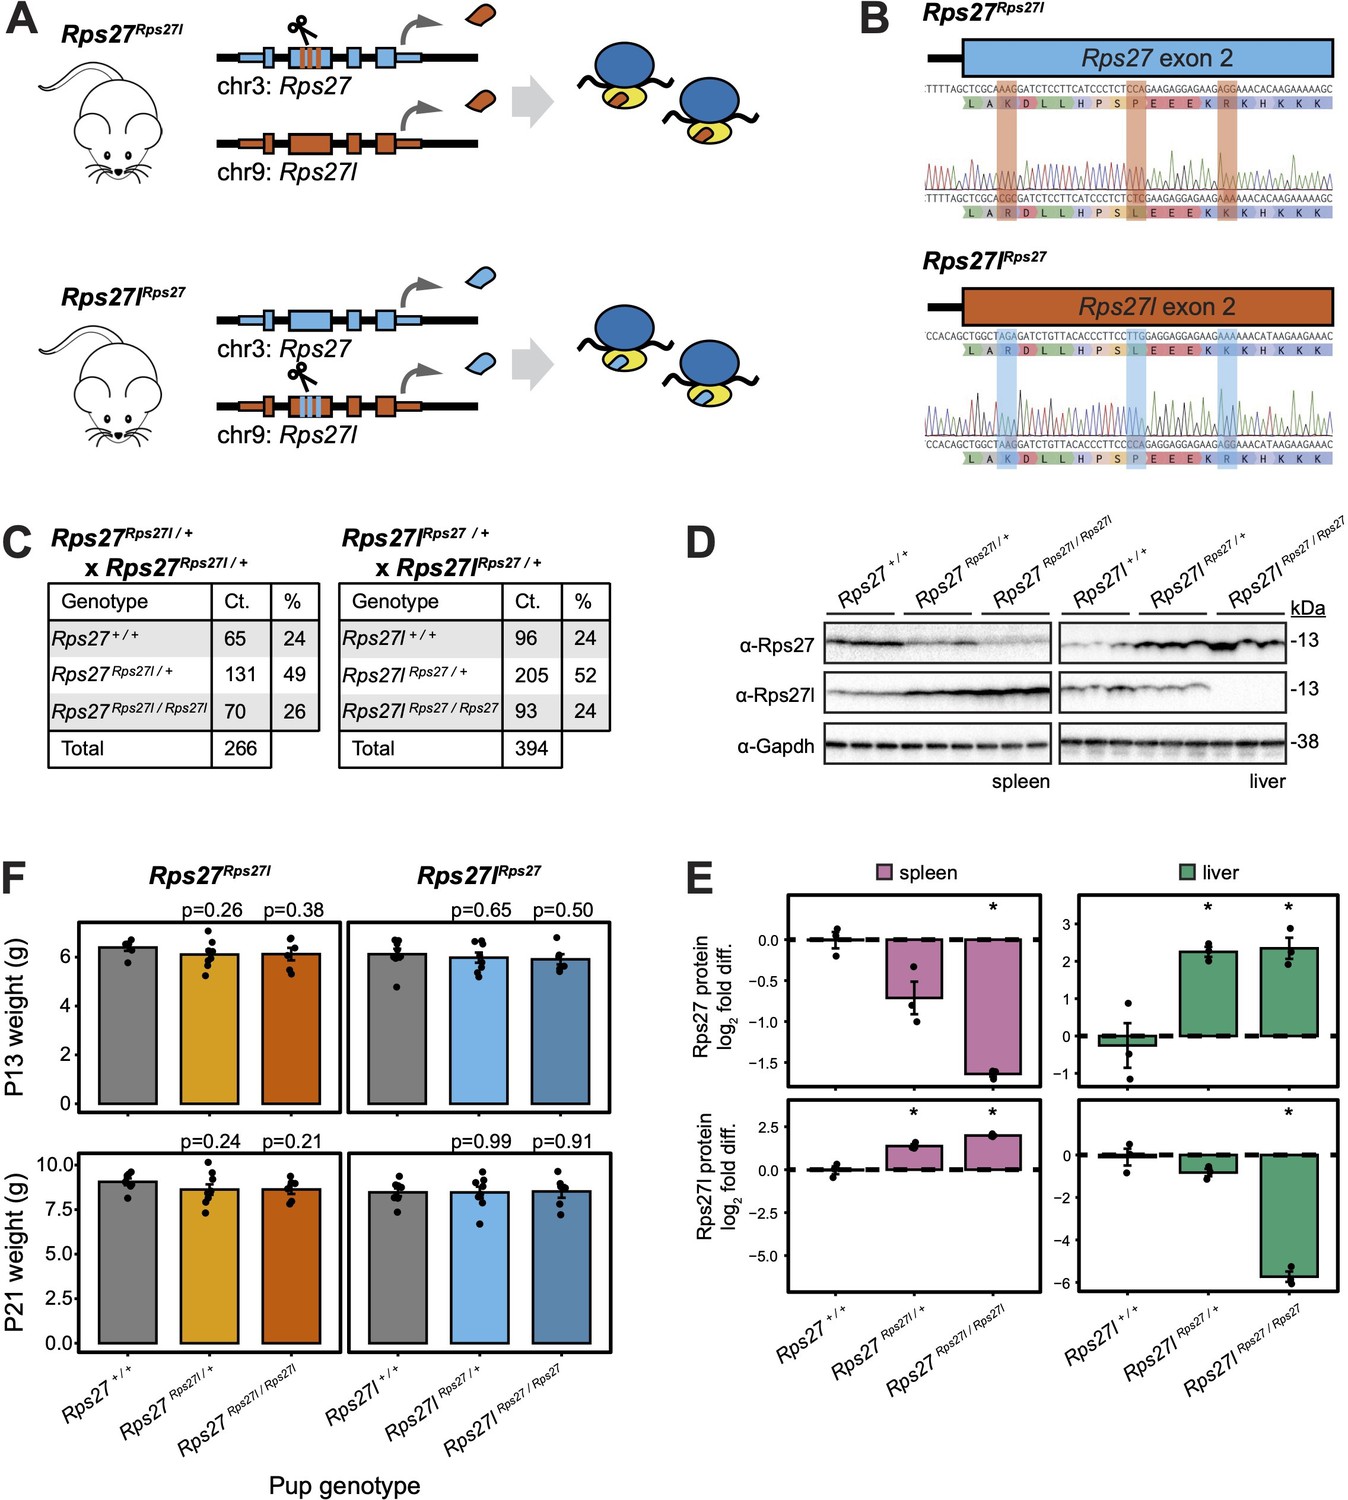
Homogenized Rps27 and Rps27l alleles in mice exhibit normal genotype ratios and early development.
(A) CRISPR editing to generate Rps27Rps27l and Rps27lRps27 homogenized mice. (B) Sanger sequencing of Rps27Rps27l and Rps27lRps27 homogenized mouse alleles. (C) Genotype ratios among live offspring of Rps27Rps27l / + and Rps27lRps27 / + heterozygous crosses at postnatal day 13 (P13). (D) Western blots of adult mouse (9–10 mo) tissues with Gapdh as loading control and n = 3 biological replicates (animals) per genotype. (E) Rps27 and Rps27l protein abundance in (D) quantified as Gapdh-normalized log2 fold difference relative to averaged +/+ samples for each tissue. Error bars show standard error. *p<0.05 by t-test; unmarked = not significant. (F) Pup weights at P13 and P21, grouped by pup genotype. Each data point represents the average weight among pups of the indicated genotype within a litter. Only pups from the first litters born to Rps27Rps27l / + and Rps27lRps27 / + dams are included. n = 6–9 litters per genotype. Significance versus Rps27 +/+ and Rps27l+/+, respectively, was assessed by t-test. Error bars show standard error. See Figure 5—source data 1–7; see also Figure 5—figure supplement 1.
-
Figure 5—source data 1
Rps27Rps27l adult spleen Rps27 western blot.
- https://cdn.elifesciences.org/articles/78695/elife-78695-fig5-data1-v2.zip
-
Figure 5—source data 2
Rps27Rps27l adult spleen Rps27l western blot.
- https://cdn.elifesciences.org/articles/78695/elife-78695-fig5-data2-v2.zip
-
Figure 5—source data 3
Rps27Rps27l adult spleen Gapdh western blot.
- https://cdn.elifesciences.org/articles/78695/elife-78695-fig5-data3-v2.zip
-
Figure 5—source data 4
Rps27lRps27l adult liver Rps27 western blot.
- https://cdn.elifesciences.org/articles/78695/elife-78695-fig5-data4-v2.zip
-
Figure 5—source data 5
Rps27lRps27l adult liver Rps27l western blot.
- https://cdn.elifesciences.org/articles/78695/elife-78695-fig5-data5-v2.zip
-
Figure 5—source data 6
Rps27lRps27l adult liver Gapdh western blot.
- https://cdn.elifesciences.org/articles/78695/elife-78695-fig5-data6-v2.zip
-
Figure 5—source data 7
Editable data from Figure 5C.
- https://cdn.elifesciences.org/articles/78695/elife-78695-fig5-data7-v2.xlsx
Figure 5—figure supplement 1
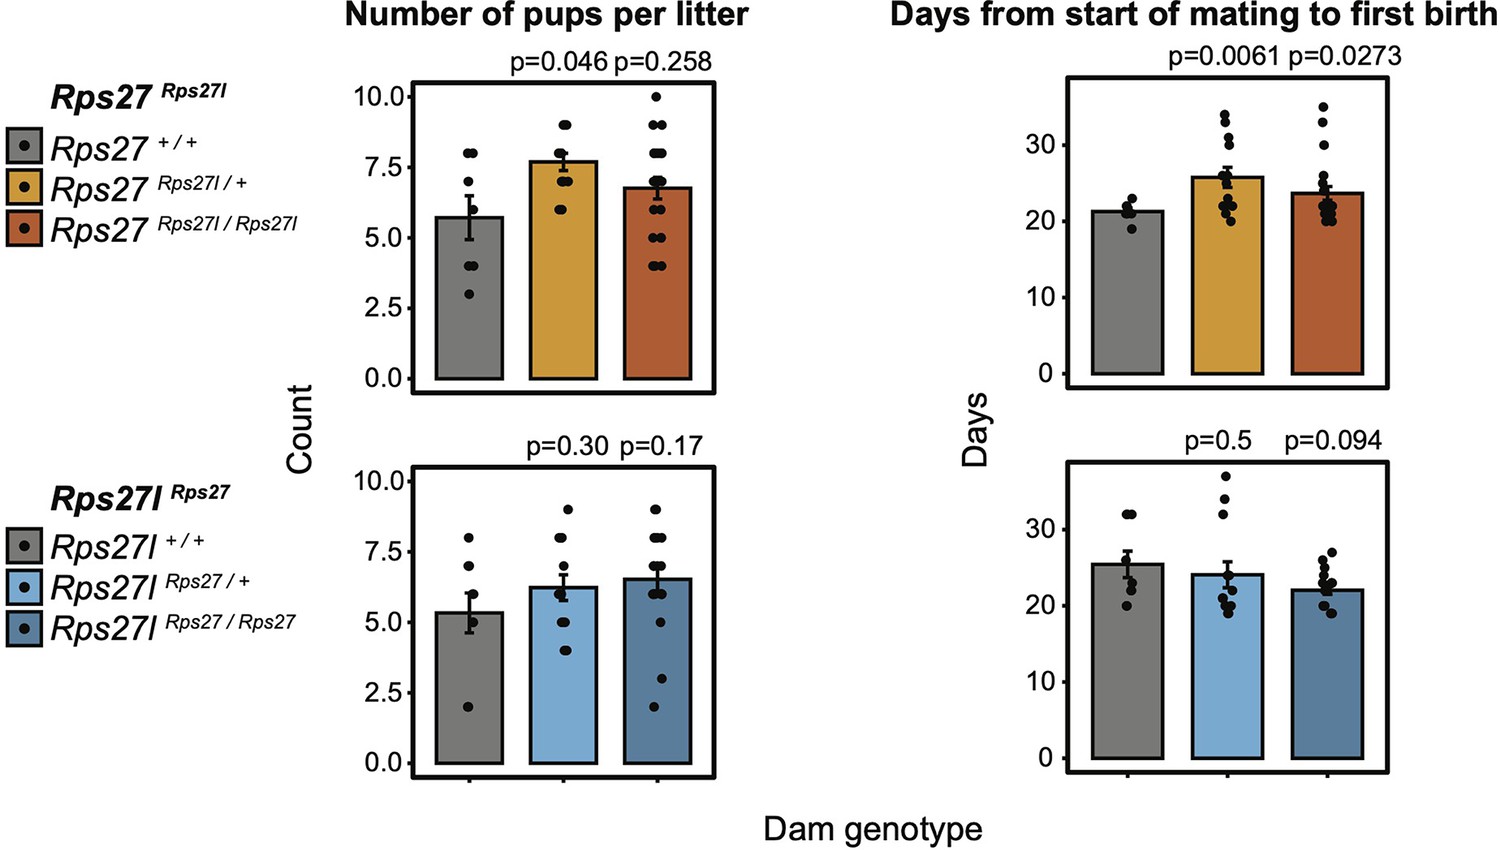
Comparison of litter size (number of pups) and days between start of mating and first birth for all dam genotypes of homogenized Rps27Rps27l and Rps27lRps27 lineages.
n = 5–19 litters per dam genotype and timepoint. Significance relative to WT was assessed by t-test. All females were housed with stud males beginning at 8 weeks of age. Only first litters are included. Statistically significant differences in litter size and mating-birth interval were observed in Rps27Rps27l / + dams relative to Rps27+/+ dams, and a statistically significant difference in mating-birth interval was observed in Rps27Rps27l / Rps27l dams relative to Rps27+/+ dams. However, considering the litter sizes and mating-birth intervals observed in Rps27l+/+ dams, we conclude that these variations are within the normal phenotypic range for wild-type animals. Error bars show standard error.
Figure 6
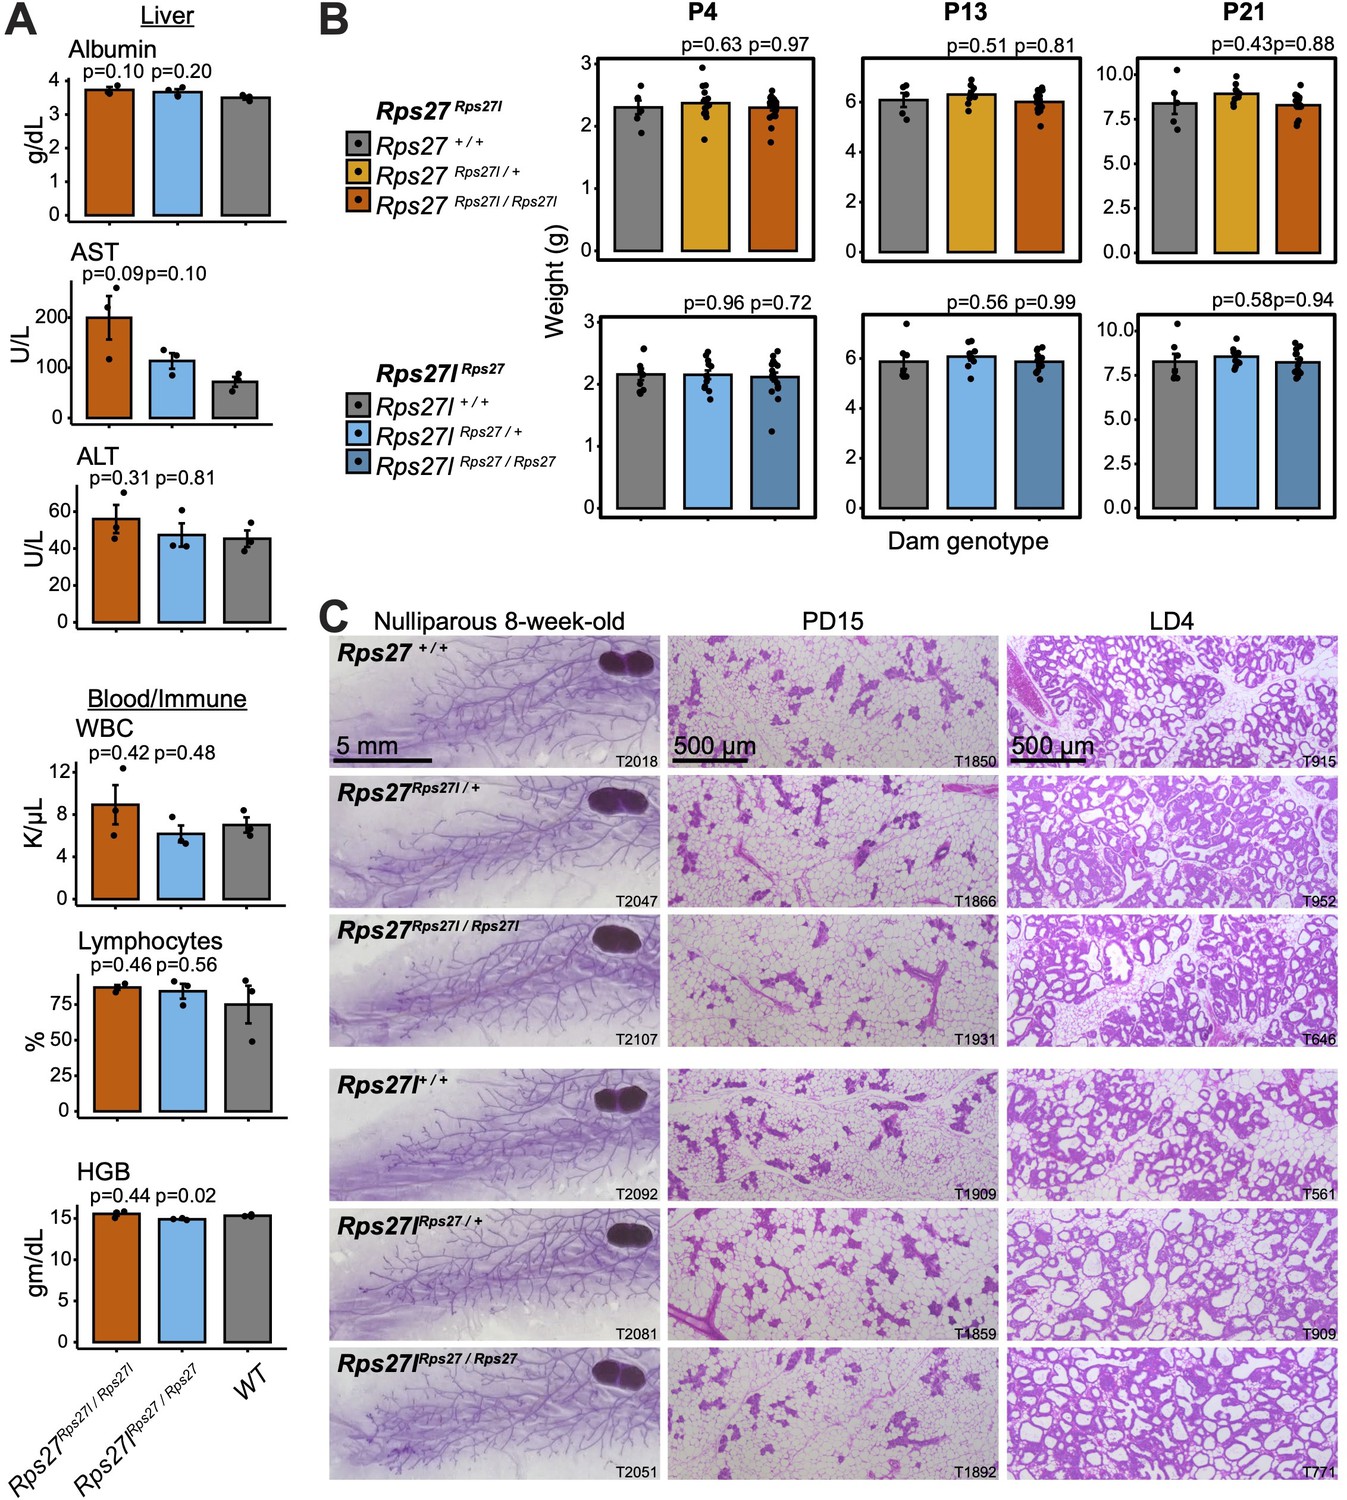
Homogenization of Rps27 and Rps27l does not impact tissues that preferentially express one paralog.
(A) Selected biomarkers from bloodwork performed on 10–16-week-old homozygous males and age-matched wild-type controls from the Rps27Rps27l and Rps27lRps27 mouse lines. See Supplementary file 5 for additional biomarkers. AST, aspartate aminotransferase; ALT, alanine aminotransferase; WBC, white blood cells; HGB, hemoglobin. n = 3 biological replicates (individual animals) per genotype. Significance relative to WT was assessed by t-test. Error bars show standard error. (B) Mean pup weight per litter at postnatal days (PDs) 4, 13, and 21, grouped by dam genotype. Only pups from a dam’s first litter are included. n = 5–19 litters per dam genotype and timepoint. Significance relative to WT was assessed by t-test. Error bars show standard error. (C) Representative images of carmine alum-stained or hematoxylin-eosin (H&E)-stained mammary glands at the indicated stages. T, animal ear tag number. See also Figure 6—source data 1–18.
-
Figure 6—source data 1
T2018; Rps27 +/+ nulliparous 8-week-old.
- https://cdn.elifesciences.org/articles/78695/elife-78695-fig6-data1-v2.zip
-
Figure 6—source data 2
T2047; Rps27Rps27l /+ nulliparous 8-week-old.
- https://cdn.elifesciences.org/articles/78695/elife-78695-fig6-data2-v2.zip
-
Figure 6—source data 3
T2107; Rps27Rps27l / Rps27l nulliparous 8-week-old.
- https://cdn.elifesciences.org/articles/78695/elife-78695-fig6-data3-v2.zip
-
Figure 6—source data 4
T2092; Rps27l+/+ nulliparous 8-week-old.
- https://cdn.elifesciences.org/articles/78695/elife-78695-fig6-data4-v2.zip
-
Figure 6—source data 5
T2081; Rps27lRps27 /+ nulliparous 8-week-old.
- https://cdn.elifesciences.org/articles/78695/elife-78695-fig6-data5-v2.zip
-
Figure 6—source data 6
T2051; Rps27lRps27Rps27 / Rps27 nulliparous 8-week-old.
- https://cdn.elifesciences.org/articles/78695/elife-78695-fig6-data6-v2.zip
-
Figure 6—source data 7
5x_t1850_1; Rps27 +/+ pregnancy day 15.
- https://cdn.elifesciences.org/articles/78695/elife-78695-fig6-data7-v2.zip
-
Figure 6—source data 8
5x_t1866_1; Rps27Rps27l /+ pregnancy day 15.
- https://cdn.elifesciences.org/articles/78695/elife-78695-fig6-data8-v2.zip
-
Figure 6—source data 9
5x_t1931_1; Rps27Rps27l / Rps27l pregnancy day 15.
- https://cdn.elifesciences.org/articles/78695/elife-78695-fig6-data9-v2.zip
-
Figure 6—source data 10
5x_t1909_; Rps27l+/+ pregnancy day 15.
- https://cdn.elifesciences.org/articles/78695/elife-78695-fig6-data10-v2.zip
-
Figure 6—source data 11
5x_t1859_1; Rps27lRps27 /+ pregnancy day 15.
- https://cdn.elifesciences.org/articles/78695/elife-78695-fig6-data11-v2.zip
-
Figure 6—source data 12
5x_t1892_1; Rps27lRps27Rps27 / Rps27 pregnancy day 15.
- https://cdn.elifesciences.org/articles/78695/elife-78695-fig6-data12-v2.zip
-
Figure 6—source data 13
5x_t915_02; Rps27 +/+ lactation day 4.
- https://cdn.elifesciences.org/articles/78695/elife-78695-fig6-data13-v2.zip
-
Figure 6—source data 14
5x_t952_2; Rps27Rps27l /+ lactation day 4.
- https://cdn.elifesciences.org/articles/78695/elife-78695-fig6-data14-v2.zip
-
Figure 6—source data 15
5x_t646_3; Rps27Rps27l / Rps27l lactation day 4.
- https://cdn.elifesciences.org/articles/78695/elife-78695-fig6-data15-v2.zip
-
Figure 6—source data 16
5x_t561_02; Rps27l+/+ lactation day 4.
- https://cdn.elifesciences.org/articles/78695/elife-78695-fig6-data16-v2.zip
-
Figure 6—source data 17
5x_t909_; Rps27lRps27 /+ lactation day 4.
- https://cdn.elifesciences.org/articles/78695/elife-78695-fig6-data17-v2.zip
-
Figure 6—source data 18
5x_t771_03; Rps27lRps27Rps27 / Rps27 lactation day 4.
- https://cdn.elifesciences.org/articles/78695/elife-78695-fig6-data18-v2.zip
Figure 7
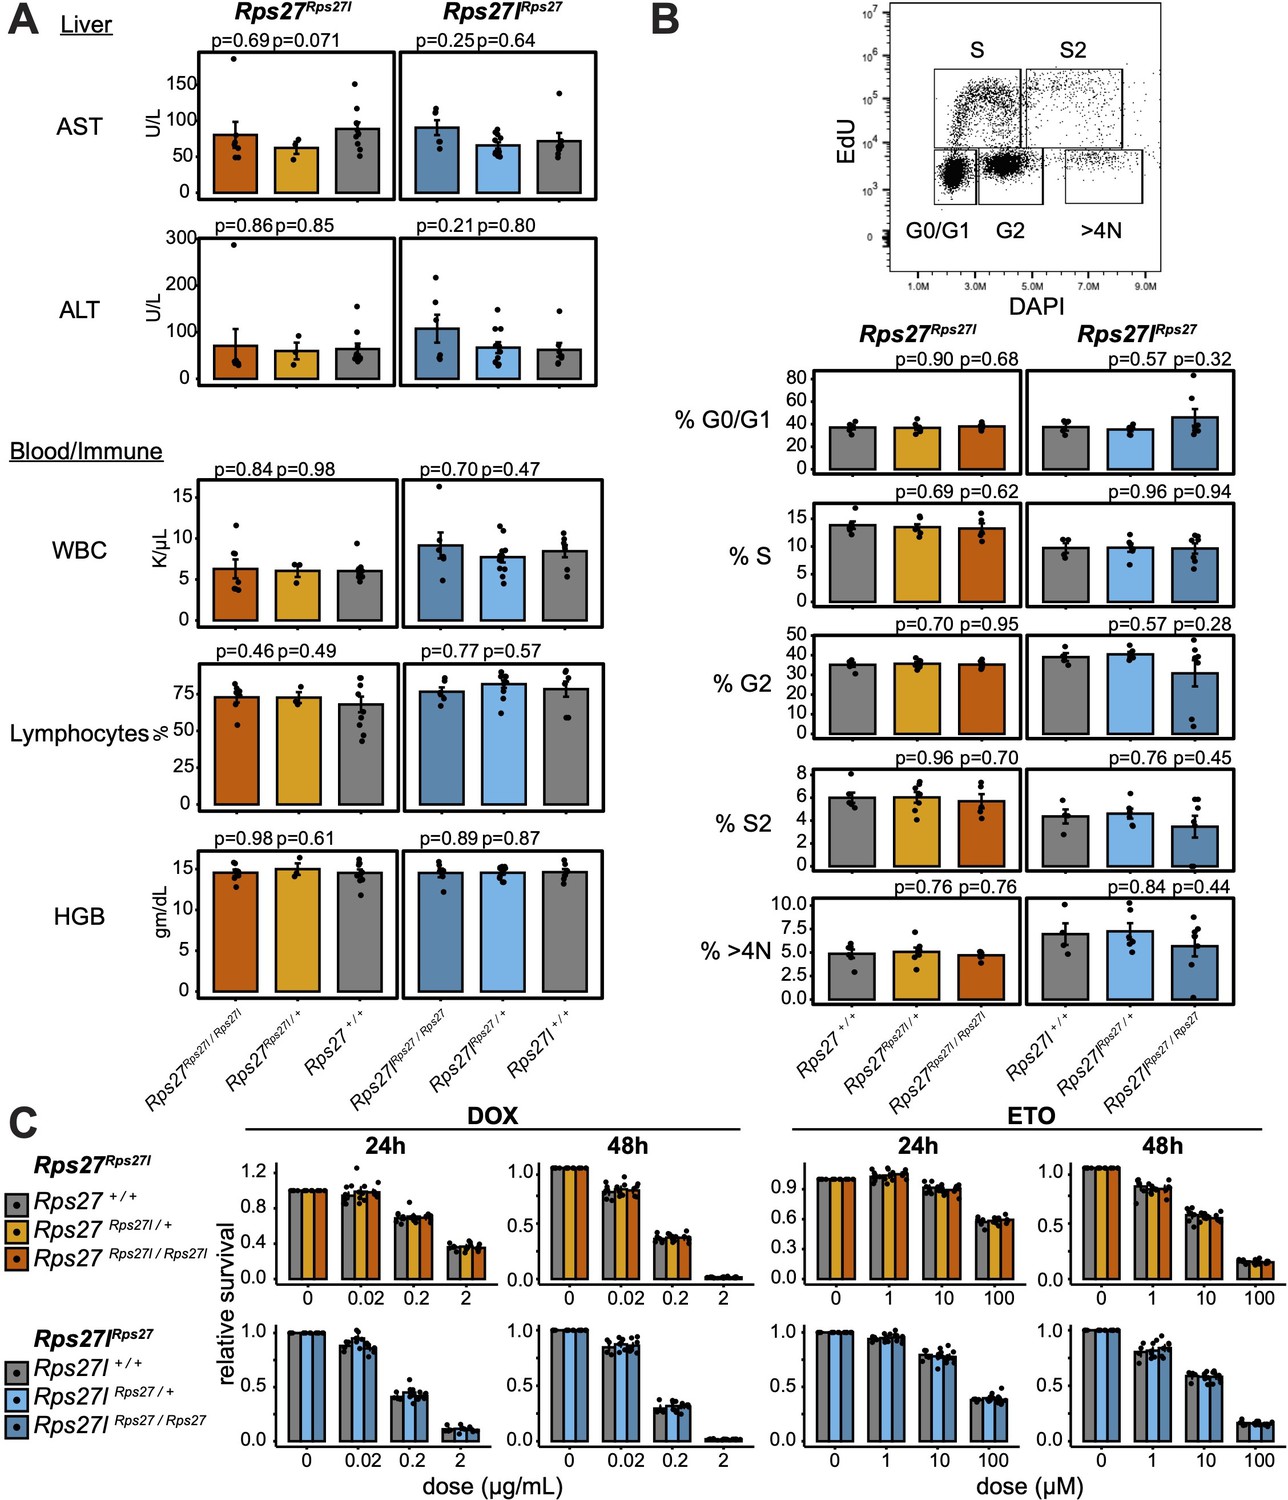
Rps27 and Rps27l homogenization does not affect physiology at later age or impact response to genotoxic stress.
(A) Biomarkers from 9- to 10-month-old Rps27Rps27l and Rps27lRps27 homozygous and heterozygous males and age-matched wild-type (WT) controls. n = 3–11 animals per genotype. See Supplementary file 6 for additional biomarkers. AST, aspartate aminotransferase; ALT, alanine aminotransferase; WBC, white blood cells; HGB, hemoglobin. (B) Percent of singlet mouse embryonic fibroblasts (MEFs) in each cell cycle phase as measured by EdU/DAPI flow cytometry. n = 4–7 biological replicates (MEF lines isolated from single embryos). (C) Fraction of viable MEFs relative to untreated controls after doxorubicin (DOX) or etoposide (ETO) treatment. n = 4–7 biological replicates; n = 2 technical replicates (separate wells) per biological replicate. For all panels, significance relative to WT was assessed by t-test and error bars show standard error. For (C), no comparisons were significant at p<0.05.
Figure 8
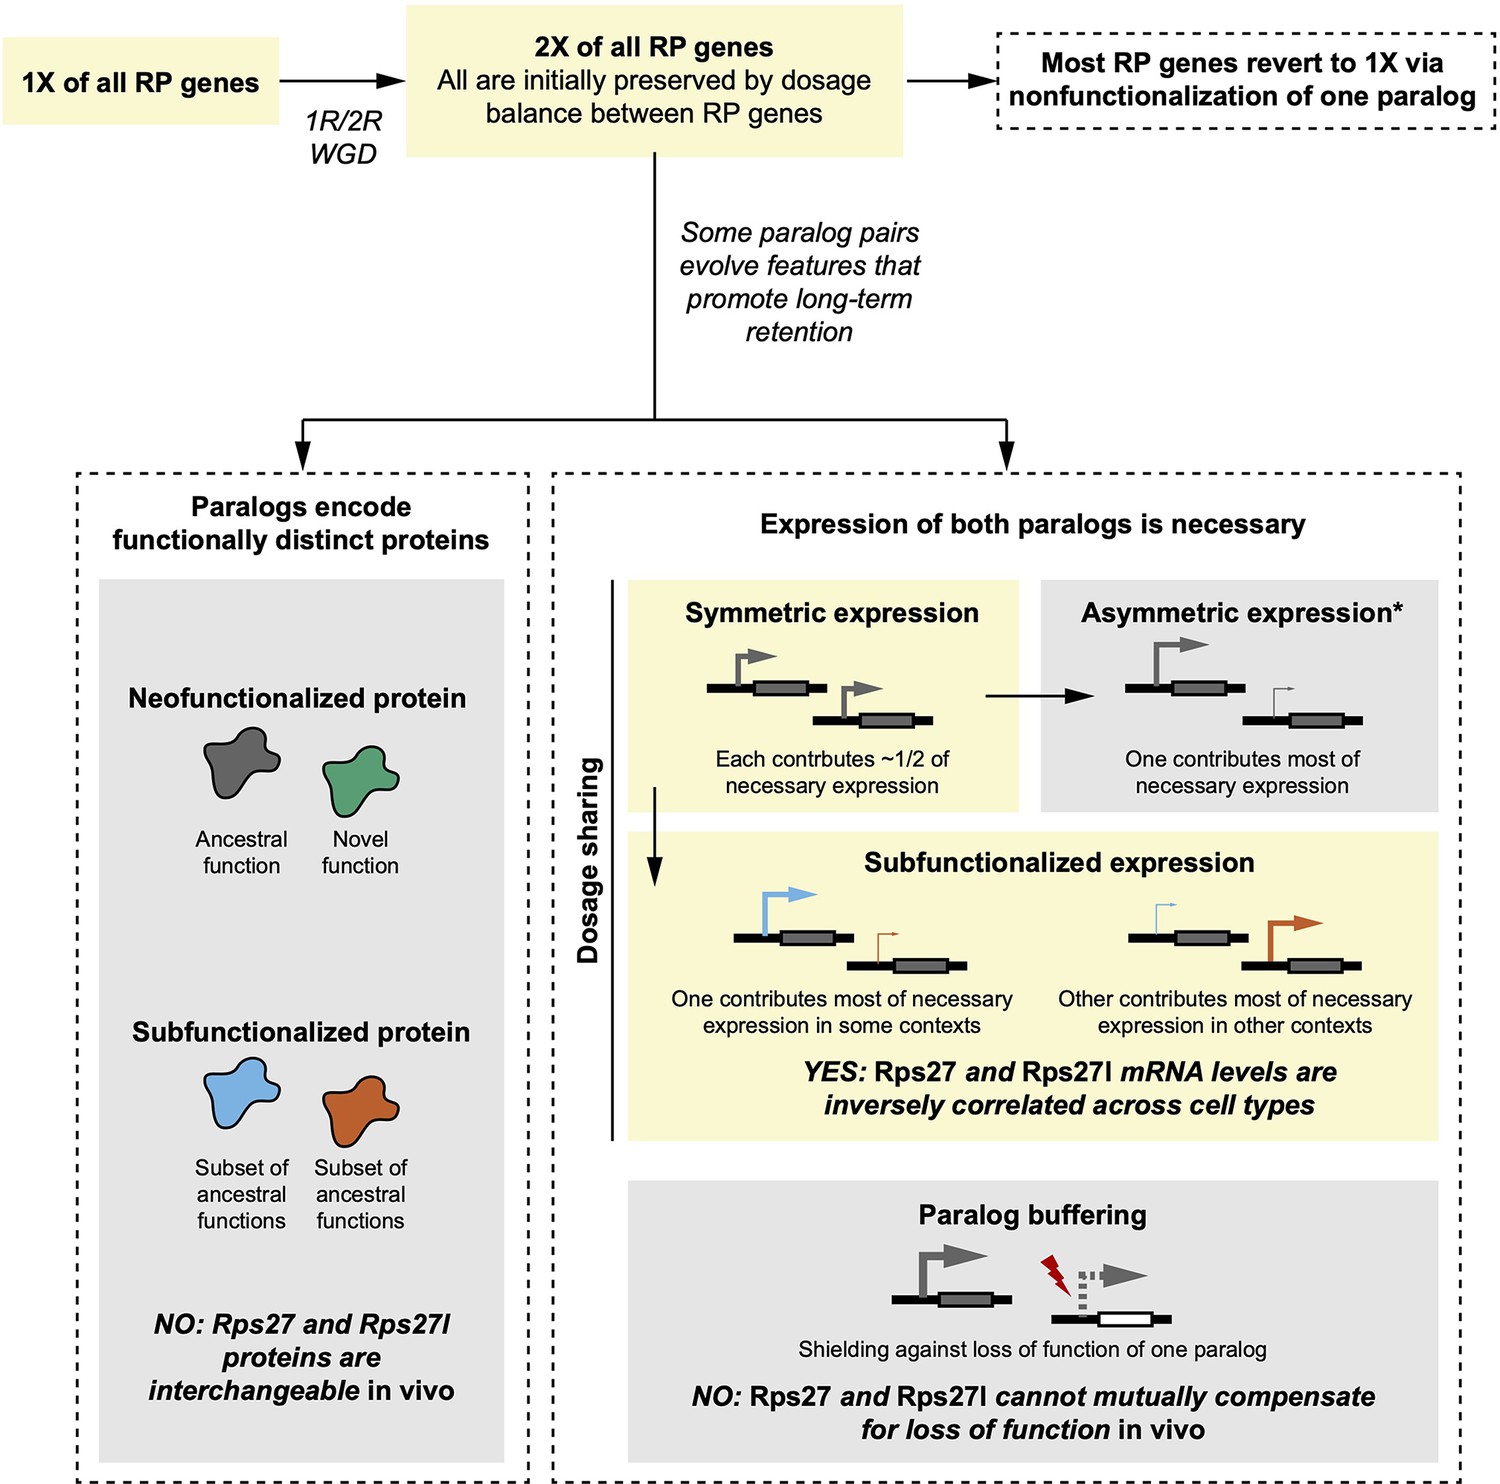
Comparison of empirical Rps27 and Rps27l characteristics with hypothesized evolutionary trajectories.
Yellow boxes indicate the most likely trajectory for Rps27 and Rps27l. In brief, a whole-genome duplication (WGD) during early vertebrate evolution duplicated all RP genes. This mechanism is probable because the maintained dosage balance between RPs would have promoted initial preservation of duplicates. While most RP genes then reverted to single genes via nonfunctionalization of one paralog, some paralog pairs evolved features that promoted retention. Immediately after duplication, Rps27 and Rps27l probably had similar regulatory elements and thus would have expressed symmetrically, but our findings suggest that Rps27 and Rps27l now exhibit subfunctionalized expression that renders both paralogs necessary to achieve the requisite total expression of this RP. We found no evidence of functional differences between Rps27 and Rps27l protein, nor successful compensation by either paralog for a loss-of-function of the other. Not pictured here are neofunctionalized expression and beneficial dosage increase; while these modes of paralog retention have been observed for other genes, they are less relevant for RP paralogs if it is assumed that excess dosage of an individual RP gene is not advantageous. *Symmetric expression frequently shifts towards asymmetric expression, which can be an intermediate state towards nonfunctionalization of the minor paralog.
Appendix 1—figure 1
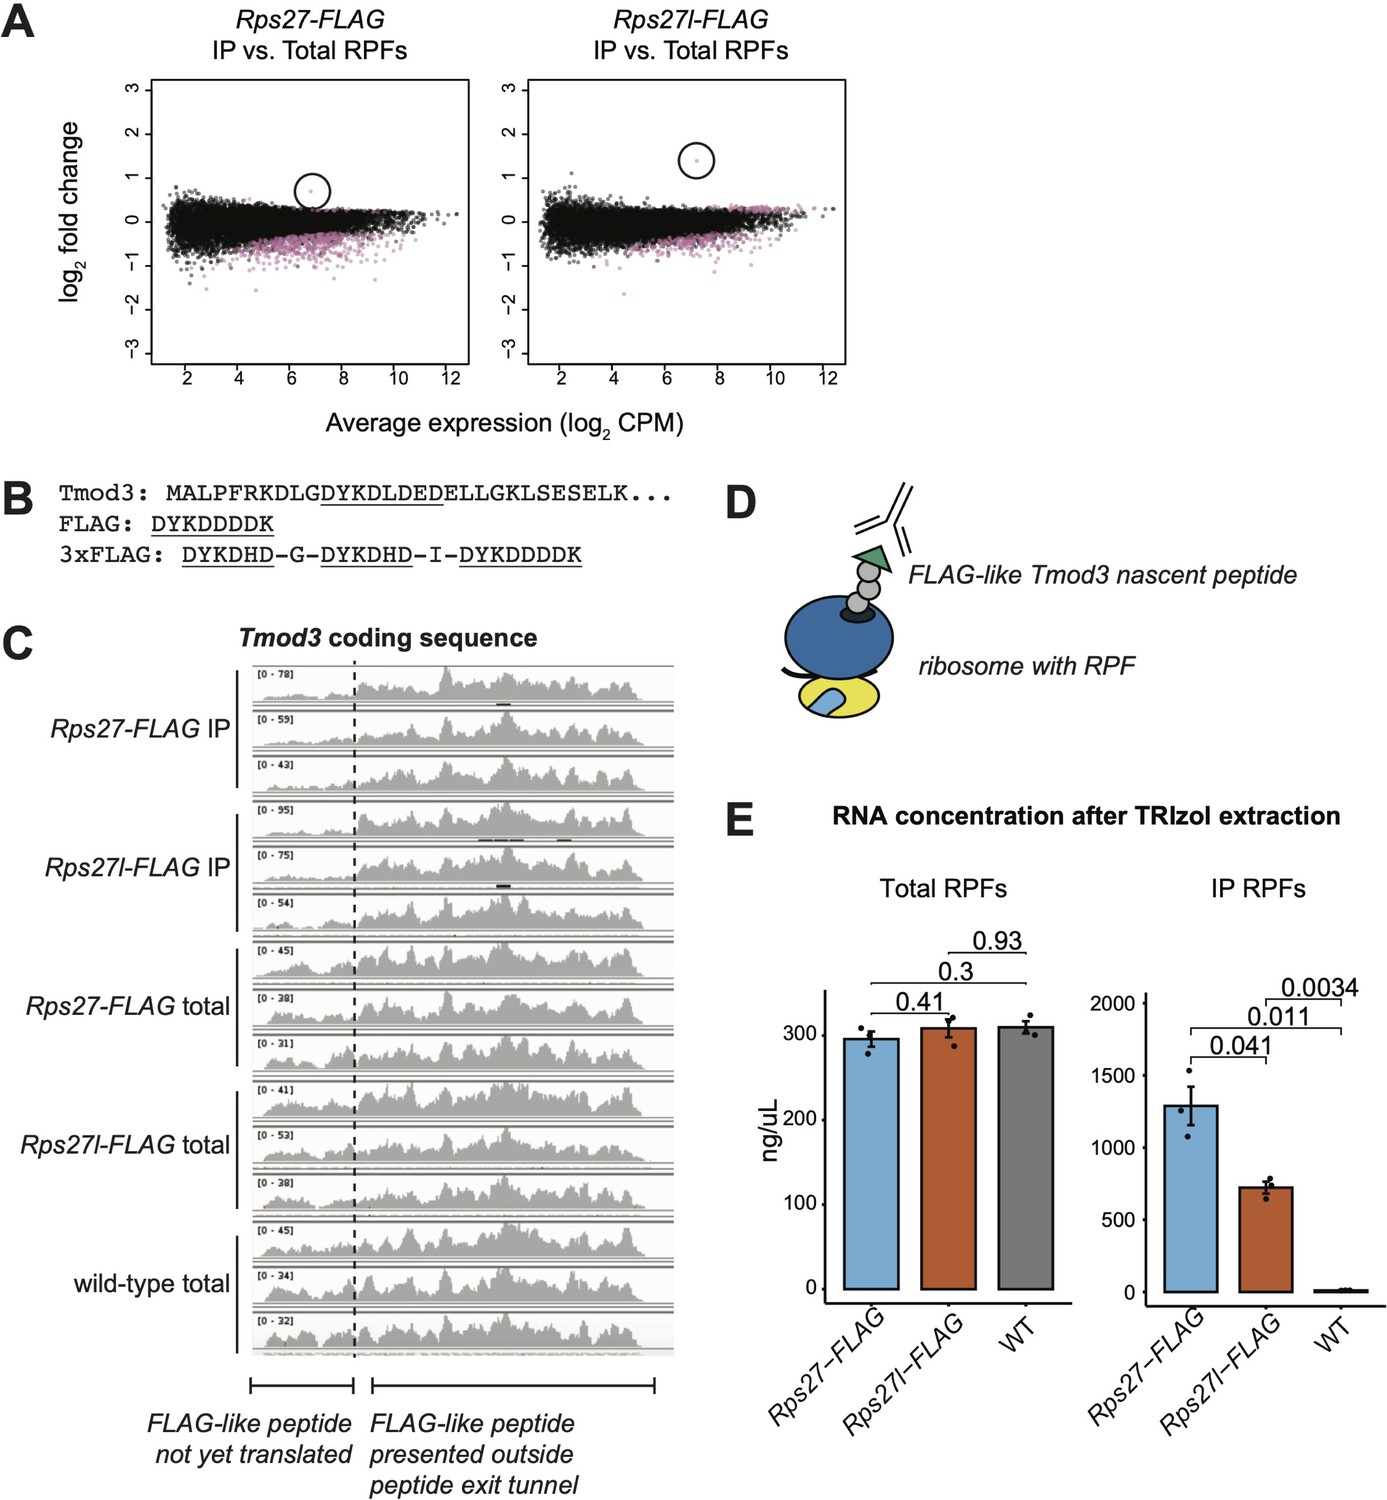
Enrichment of Tmod3 ribosome-protected fragments is an artifact of FLAG immunoprecipitation.
(A) Enrichment of Tmod3 mRNA (circled) among immunoprecipitated ribosome-protected fragments (IP RPFs) from both Rps27- and Rps27l-FLAG mouse embryonic stem cells (mESCs), relative to total RPFs. (B) N-terminal sequence of Tmod3 protein, with FLAG-like peptide sequence highlighted. (C) Distribution of IP RPFs and total RPFs along the coding sequence of Tmod3. Base positions encoding the FLAG-like peptide are denoted with an arrow. Note that the y-axis range differs for each sample. (D) Proposed binding of the anti-FLAG antibody to the FLAG-like Tmod3 nascent peptide. (E) RNA concentration as estimated by absorbance at 260 and 280 nm wavelength after TRIzol extraction of total RPF and IP RPF samples from Rps27-FLAG, Rps27l-FLAG, and WT mESCs, showing consistently lower IP yield of Rps27l-ribosomes compared to Rps27l-ribosomes. Significance was assessed by t-test. n = 3 biological replicates. Error bars show standard error.
Tables
Key resources table
| Reagent type (species) or resource | Designation | Source or reference | Identifiers | Additional information |
|---|---|---|---|---|
| Gene (Mus musculus) | Rps27 (eS27) | Ensembl version 109 | ENSMUSG00000090733 | |
| Gene (M. musculus) | Rps27l (eS27L) | Ensembl version 109 | ENSMUSG00000036781 | |
| Gene (Homo sapiens) | RPS27 (eS27) | Ensembl version 109 | ENSG00000177954 | |
| Gene (H. sapiens) | RPS27L (eS27L) | Ensembl version 109 | ENSG00000185088 | |
| Gene (multiple species) | Rps27 and Rps27l orthologs | Multiple | See Figure 1, Supplementary file 1 for full details | |
| Strain, strain background (M. musculus) | Rps27exon2del, C57BL/6J | This paper | See ‘Generation of genetically edited mouse lines,’ Figure 4, Supplementary file 7 | |
| Strain, strain background (M. musculus) | Rps27lexon2del, C57BL/6J | This paper | See ‘Generation of genetically edited mouse lines,’ Figure 4, Supplementary file 7 | |
| Strain, strain background (M. musculus) | Rps27Rps27l, C57BL/6J | This paper | See ‘Generation of genetically edited mouse lines,’ Figure 4, Supplementary file 7 | |
| Strain, strain background (M. musculus) | Rps27lRps27, C57BL/6J | This paper | See ‘Generation of genetically edited mouse lines,’ Figure 4, Supplementary file 7 | |
| Strain, strain background (M. musculus) | Trp53null, C57BL/6J | Jackson Laboratories https://doi.org/10.1016/s0960-9822(00)00002-6 | Strain #002101; RRID:IMSR_JAX:002101 | |
| Cell line (M. musculus) | Rps27-FLAG mESCs | This paper | See ‘Generation of CRISPR-edited mESCs,’ Figure 3, Supplementary file 7 | |
| Cell line (M. musculus) | Rps27l-FLAG mESCs | This paper | See ‘Generation of CRISPR-edited mESCs,’ Figure 3, Supplementary file 7 | |
| Antibody | Rps27 (goat polyclonal) | Thermo Fisher | PA5-18092; RRID:AB_10980328 | 1:10,000 |
| Antibody | Rps27l (rabbit polyclonal) | ProteinTech | 15871-1-AP; RRID:AB_2253903 | 1:1000 |
| Antibody | Actb (mouse monoclonal) | Cell Signaling | 3700S; RRID:AB_2242334 | 1:1000 |
| Antibody | Rps3 (mouse monoclonal) | Abcam | ab77330; RRID:AB_1566697 | 1:1000 |
| Antibody | FLAG (mouse monoclonal) | MilliporeSigma | F3165; RRID:AB_259529 | 1:1000 |
| Antibody | Gapdh (mouse monoclonal) | Thermo Fisher | AM4300; RRID:AB_2536381 | 1:5000 |
| Antibody | Trp53 (rabbit polyclonal) | Leica Biosystems | CM5; RRID:AB_563933 | 1:1000 |
| Sequence-based reagent | qPCR primers | This paper | See Supplementary file 7 | |
| Sequence-based reagent | Genotyping primers | This paper | See Supplementary file 7 | |
| Sequence-based reagent | Ribosome profiling primers | https://doi.org/10.1016/j.ymeth.2017.05.028 | See also Supplementary file 7 | |
| Commercial assay or kit | NucleoSpin RNA | Macherey-Nagel | 740955.50 | |
| Commercial assay or kit | PureLink RNA Mini | Thermo Fisher | 12183018A | |
| Commercial assay or kit | ProteoExtract protein precipitation | Calbiochem | 539180 | |
| Commercial assay or kit | Direct-Zol Microprep Kit | Zymo | R2060 | |
| Commercial assay or kit | Zymo Oligo Clean & Concentrator | Zymo | D4060 | |
| Commercial assay or kit | RiboZero Gold | Illumina | 20020598 | |
| Commercial assay or kit | Zymo DNA Clean & Concentrator | Zymo | D4003 | |
| Commercial assay or kit | EdU labelling kit | Click Chemistry Tools | 1381 | |
| Software, algorithm | MEGA11 | https://doi.org/10.1093/molbev/msab120 | ||
| Software, algorithm | RAxML-ng | https://doi.org/10.1093/bioinformatics/btz305 | ||
| Software, algorithm | Cutadapt version 2.4 | https://doi.org/10.14806/ej.17.1.200 | ||
| Software, algorithm | fastx_barcode_splitter.pl | http://hannonlab.cshl.edu/fastx_toolkit/ | ||
| Software, algorithm | umi_tools version 1.0.1 | https://doi.org/10.1101/gr.209601.116 | ||
| Software, algorithm | fastq_quality_filter | http://hannonlab.cshl.edu/fastx_toolkit/ | ||
| Software, algorithm | bowtie2 version 2.3.4.3 | https://doi.org/10.1038/nmeth.1923 | ||
| Software, algorithm | EdgeR | https://doi.org/10.1093/bioinformatics/btp616 | ||
| Software, algorithm | Voom | https://doi.org/10.1186/gb-2014-15-2-r29 |
Additional files
-
MDAR checklist
- https://cdn.elifesciences.org/articles/78695/elife-78695-mdarchecklist1-v2.docx
-
Supplementary file 1
Details of the Rps27 and Rps27l ortholog protein sequences used for multispecies alignment and molecular phylogenetic analysis in Figure 1 and Figure 1—figure supplement 1.
- https://cdn.elifesciences.org/articles/78695/elife-78695-supp1-v2.xlsx
-
Supplementary file 2
Correlation between Rps27l mRNA abundance (read count per 100 RP reads) and abundance of other transcripts (read count per million) in single-cell RNA-seq data Bach et al., 2017 from alveolar cells in lactating mammary glands (‘Avd-L’ cells as termed by Bach et al.).
- https://cdn.elifesciences.org/articles/78695/elife-78695-supp2-v2.xlsx
-
Supplementary file 3
Results of paralog-specific Rps27- and Rps27l-FLAG ribosome profiling.
- https://cdn.elifesciences.org/articles/78695/elife-78695-supp3-v2.xlsx
-
Supplementary file 4
Organ weights and necropsy findings for 10–16-week-old mice homozygous for homogenized Rps27Rps27l and Rps27lRps27 alleles.
WNL, within normal limits.
- https://cdn.elifesciences.org/articles/78695/elife-78695-supp4-v2.xlsx
-
Supplementary file 5
Biomarker values for complete blood count, liver panel, and serum chemistry panel performed on 10–16-week-old homozygous males and age-matched wild-type controls from the Rps27Rps27l and Rps27lRps27 mouse lines.
- https://cdn.elifesciences.org/articles/78695/elife-78695-supp5-v2.xlsx
-
Supplementary file 6
Biomarker values for complete blood count and liver panel performed on homozygous and heterozygous 9–10-month-old males and age-matched wild-type controls from the Rps27Rps27l and Rps27lRps27 mouse lines.
- https://cdn.elifesciences.org/articles/78695/elife-78695-supp6-v2.xlsx
-
Supplementary file 7
Primer, oligonucleotide, and construct sequences used in this study.
- https://cdn.elifesciences.org/articles/78695/elife-78695-supp7-v2.xlsx
Download links
A two-part list of links to download the article, or parts of the article, in various formats.
Downloads (link to download the article as PDF)
Open citations (links to open the citations from this article in various online reference manager services)
Cite this article (links to download the citations from this article in formats compatible with various reference manager tools)
Subfunctionalized expression drives evolutionary retention of ribosomal protein paralogs Rps27 and Rps27l in vertebrates
eLife 12:e78695.
https://doi.org/10.7554/eLife.78695


