Robust group- but limited individual-level (longitudinal) reliability and insights into cross-phases response prediction of conditioned fear
- Institute for Systems Neuroscience, University Medical Center Hamburg-Eppendorf, Germany
- Department of Psychiatry, Harvard Medical School, and Center for Depression, Anxiety and Stress Research, McLean Hospital, United States
Figures
Figure 1 with 8 supplements
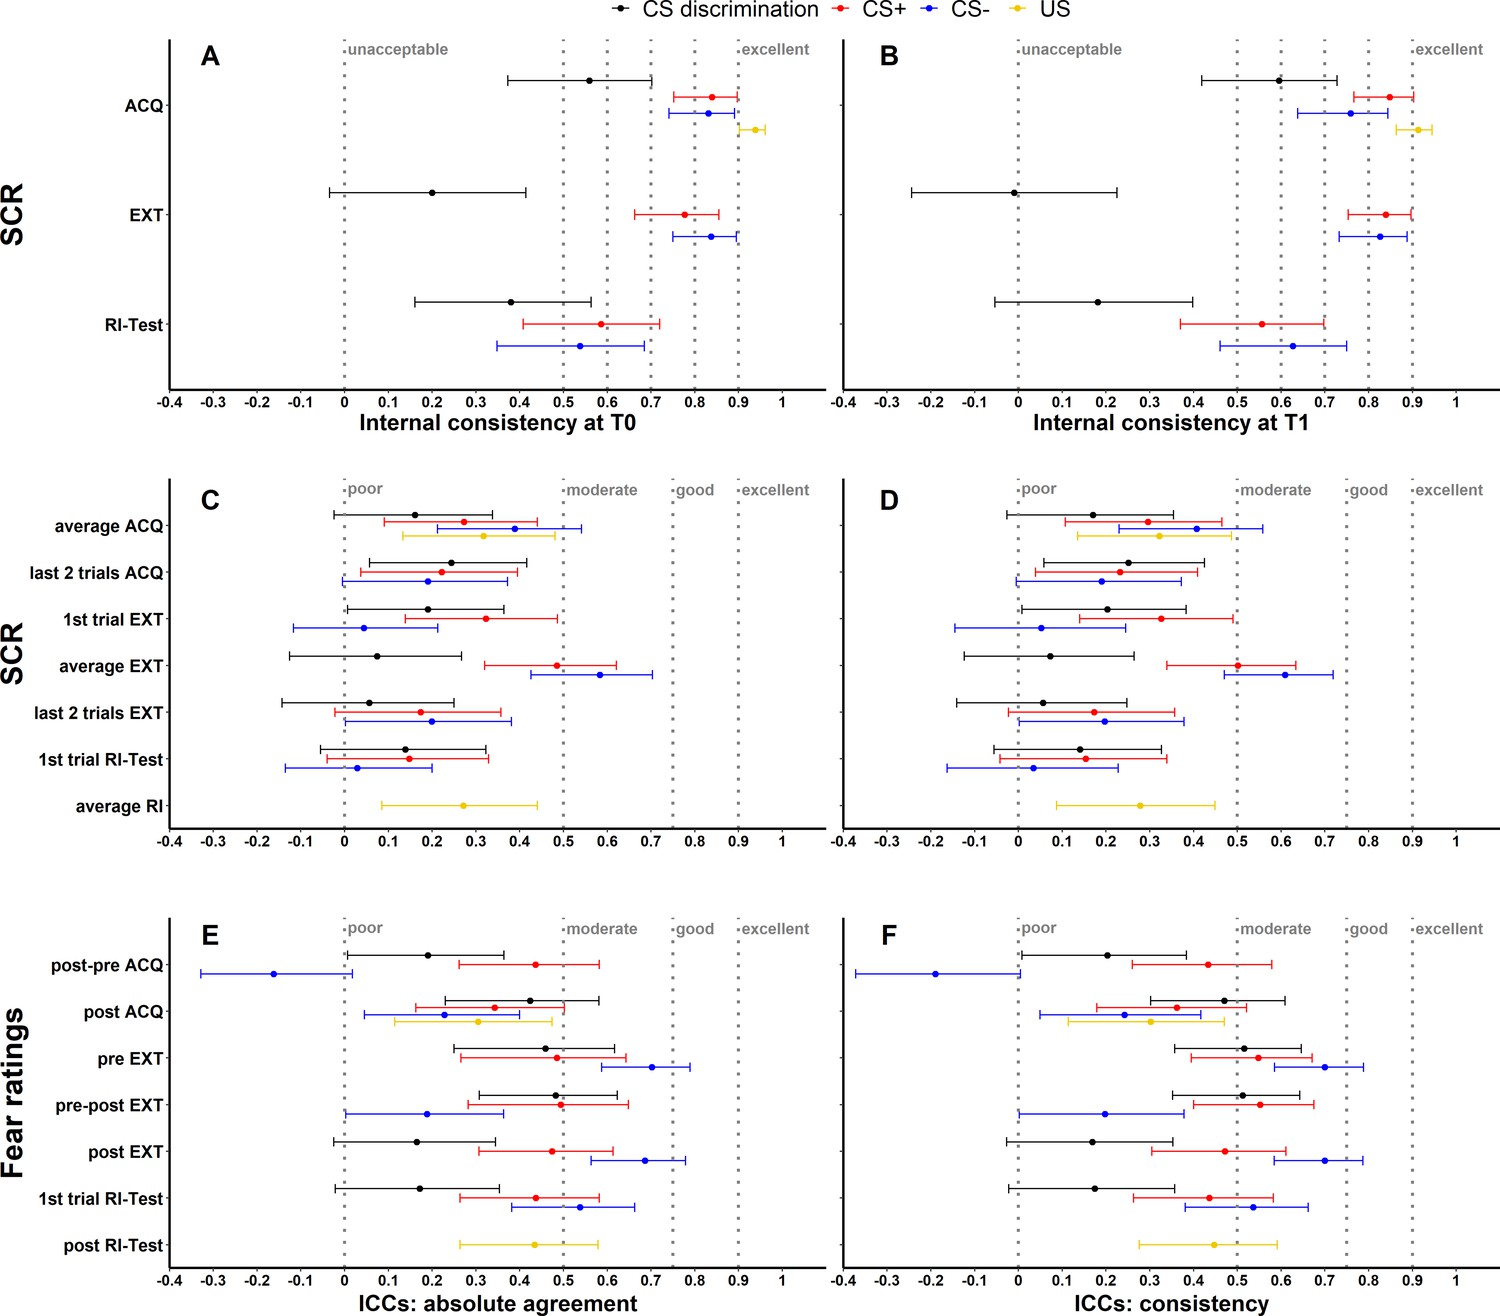
Illustration of internal consistency for skin conductance responses (SCRs) at T0 (A) and T1 (B) as well as ICCabs and ICCcon for SCRs (C, D) and fear ratings (E, F) color coded for stimulus type.
Internal consistency indicates the reliability of responses within each time point, while intraclass correlation coefficients (ICCs) indicate the reliability across both time points. Note that assessment of internal consistency was not possible for fear ratings as only two ratings (pre, post) were available. Error bars represent 95% confidence intervals and indicate significance, when zero is not included in the interval. The y-axis comprises the different phases or phase operationalizations. In the literature, internal consistency is often interpreted using benchmarks (Kline, 2013) for unacceptable (<0.5), poor (>0.5 but <0.6), questionable (>0.6 but <0.7), acceptable (>0.7 but <0.8), good (>0.8 but <0.9), and excellent (≥0.9). Common benchmarks in the literature for ICCs are poor (<0.5), moderate (>0.5 but <0.75), good (>0.75 but <0.9), and excellent (≥0.9) (Koo and Li, 2016). These benchmarks are included here to provide a frame of reference but we point out that these benchmarks are arbitrary and most importantly derived from psychometric work on trait self-report measures and should hence not be overinterpreted in the context of responding in experimental paradigms which bear more sources of noise (Parsons, 2020). ACQ = acquisition training, EXT = extinction training, RI = reinstatement, RI-Test = reinstatement-test, pre = prior to the experimental phase, post = subsequent to the experimental phase.
Figure 1—figure supplement 1
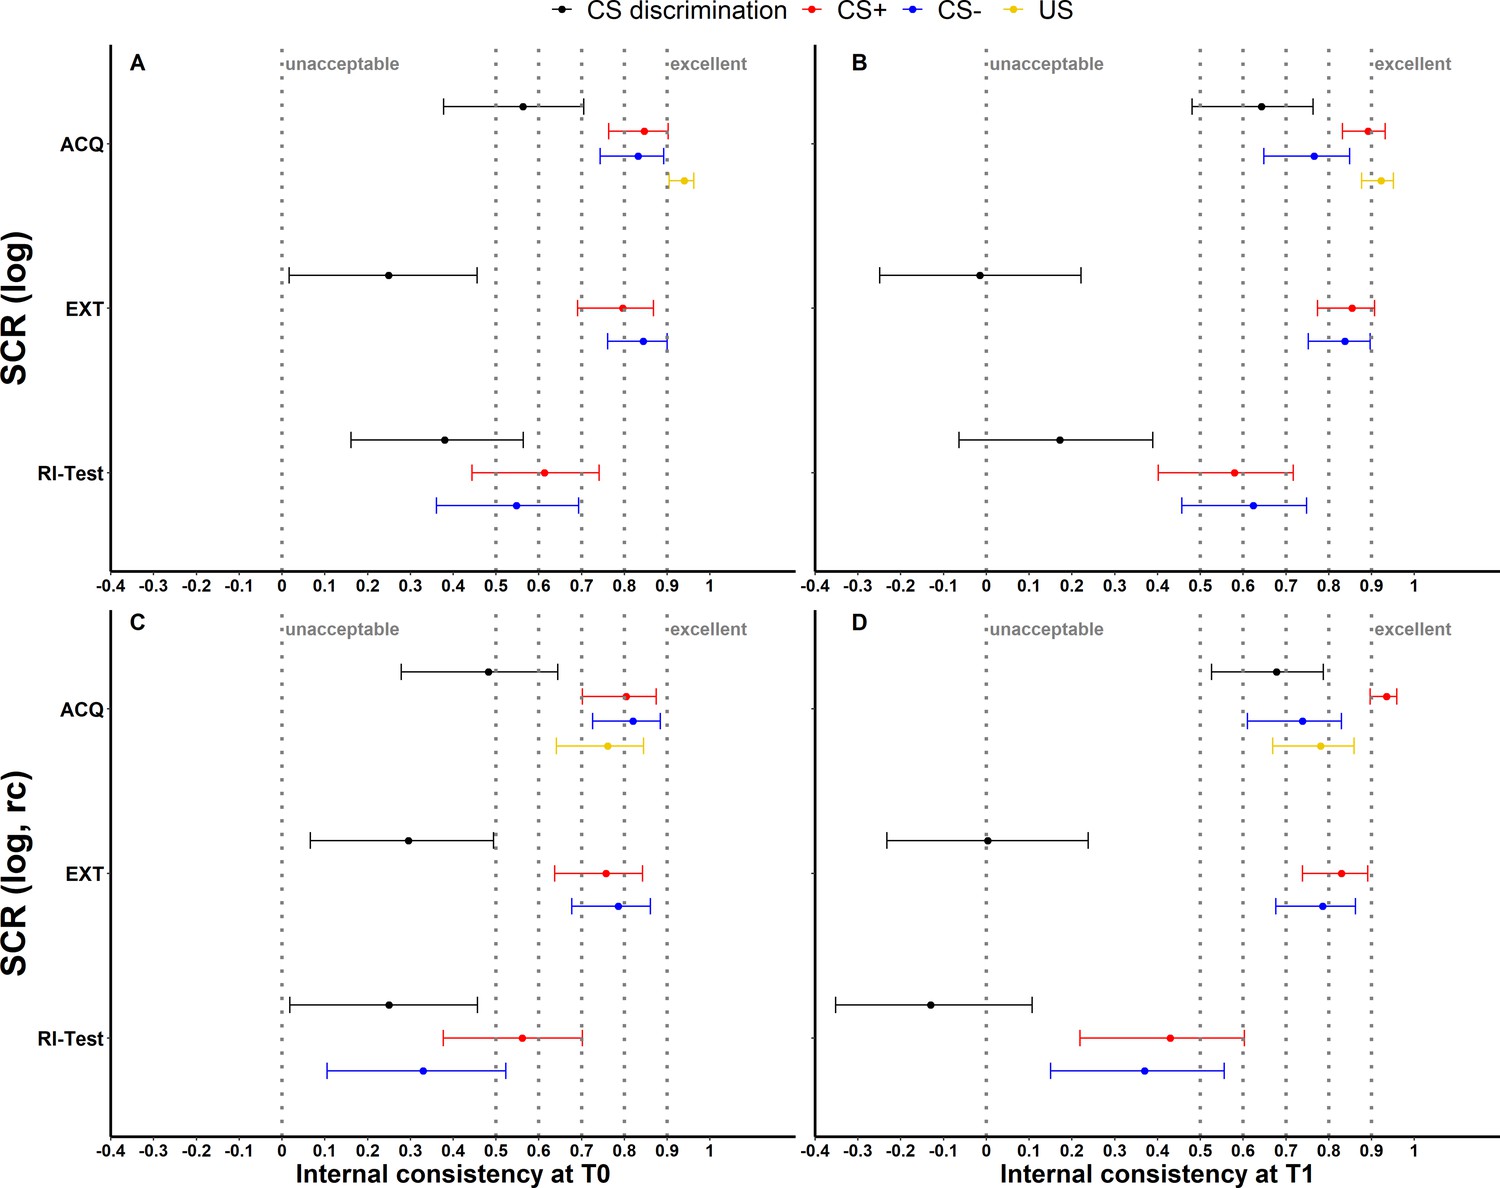
Illustration of (A, B) internal consistency for log-transformed (log) as well as (C, D) log-transformed and range corrected (log rc) skin conductance responses (SCRs) at T0 and T1 color coded for stimulus type.
Error bars represent 95% confidence intervals and indicate significance, when zero is not included in the interval. The y-axis comprises the different experimental phases. Internal consistency is interpreted using benchmarks (Kline, 2013) for unacceptable (<0.5), poor (>0.5 but <0.6), questionable (>0.6 but <0.7), acceptable (>0.7 but <0.8), good (>0.8 but <0.9), and excellent (≥0.9). ACQ = acquisition training, EXT = extinction training, RI-Test = reinstatement-test.
Figure 1—figure supplement 2

Illustration of (A, B) intraclass correlation coefficients (ICCs) of log-transformed (log) as well as (C, D) log-transformed and range corrected (log, rc) skin conductance responses (SCRs) color coded for stimulus type.
The y-axis comprises the different phase operationalizations. A and C display ICCabs, B and D display ICCcon. ICCs <0.5, <0.75, <0.9, and >0.9 were interpreted as poor, moderate, good, and excellent, respectively (Koo and Li, 2016). Error bars represent 95% confidence intervals and indicate significance of ICCs, when zero is not included in the interval. ACQ = acquisition training, EXT = extinction training, RI = reinstatement, RI-Test = reinstatement-test.
Figure 1—figure supplement 3
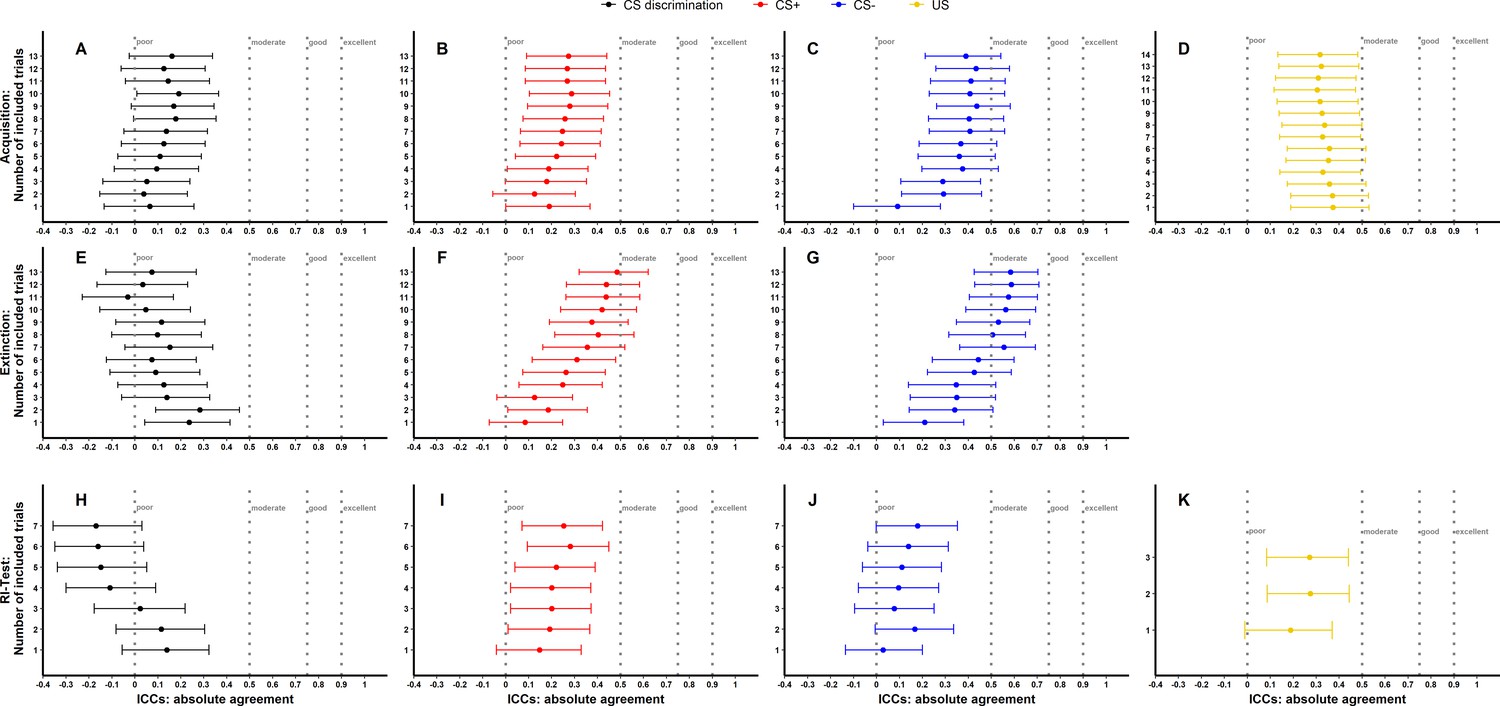
Illustration of ICCabs of trial-by-trial raw skin conductance responses (SCRs) for phases (A–D: Acquisition, E–G: Extinction, H–J: Reinstatement-Test, K: Reinstatement) and stimulus types separately.
Trials were averaged starting with the first (i.e., reinstatement-test and unconditioned stimulus [US] trials) or second trial (i.e., acquisition and extinction training). All preceding trials were added trial-by-trial and averaged. Intraclass correlation coefficients (ICCs) <0.5, <0.75, <0.9, and >0.9 (Koo and Li, 2016) were interpreted as poor, moderate, good, and excellent, respectively. Error bars represent 95% confidence intervals. Non-overlapping error bars indicate significant differences between ICCs within one figure. RI-Test = reinstatement-test.
Figure 1—figure supplement 4
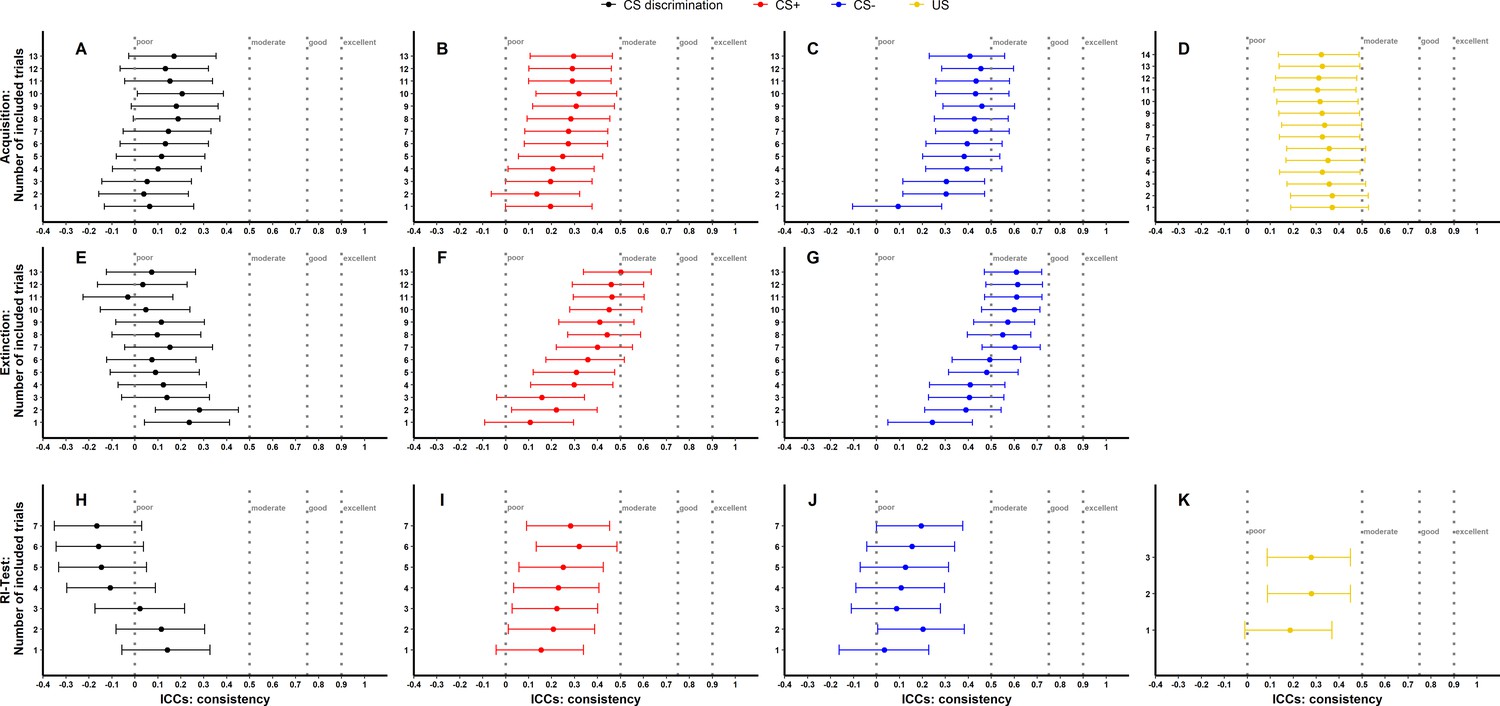
Illustration of ICCcon of trial-by-trial raw skin conductance responses (SCRs) for phases (A–D: Acquisition, E–G: Extinction, H–J: Reinstatement-Test, K: Reinstatement) and stimulus types separately.
Trials were averaged starting with the first (i.e., reinstatement-test and unconditioned stimulus [US] trials) or second trial (i.e., acquisition and extinction training). All preceding trials were added trial-by-trial and averaged. Intraclass correlation coefficients (ICCs) <0.5, <0.75, <0.9, and >0.9 (Koo and Li, 2016) were interpreted as poor, moderate, good, and excellent, respectively. Error bars represent 95% confidence intervals. Non-overlapping error bars indicate significant differences between ICCs within one figure. RI-Test = reinstatement-test.
Figure 1—figure supplement 5
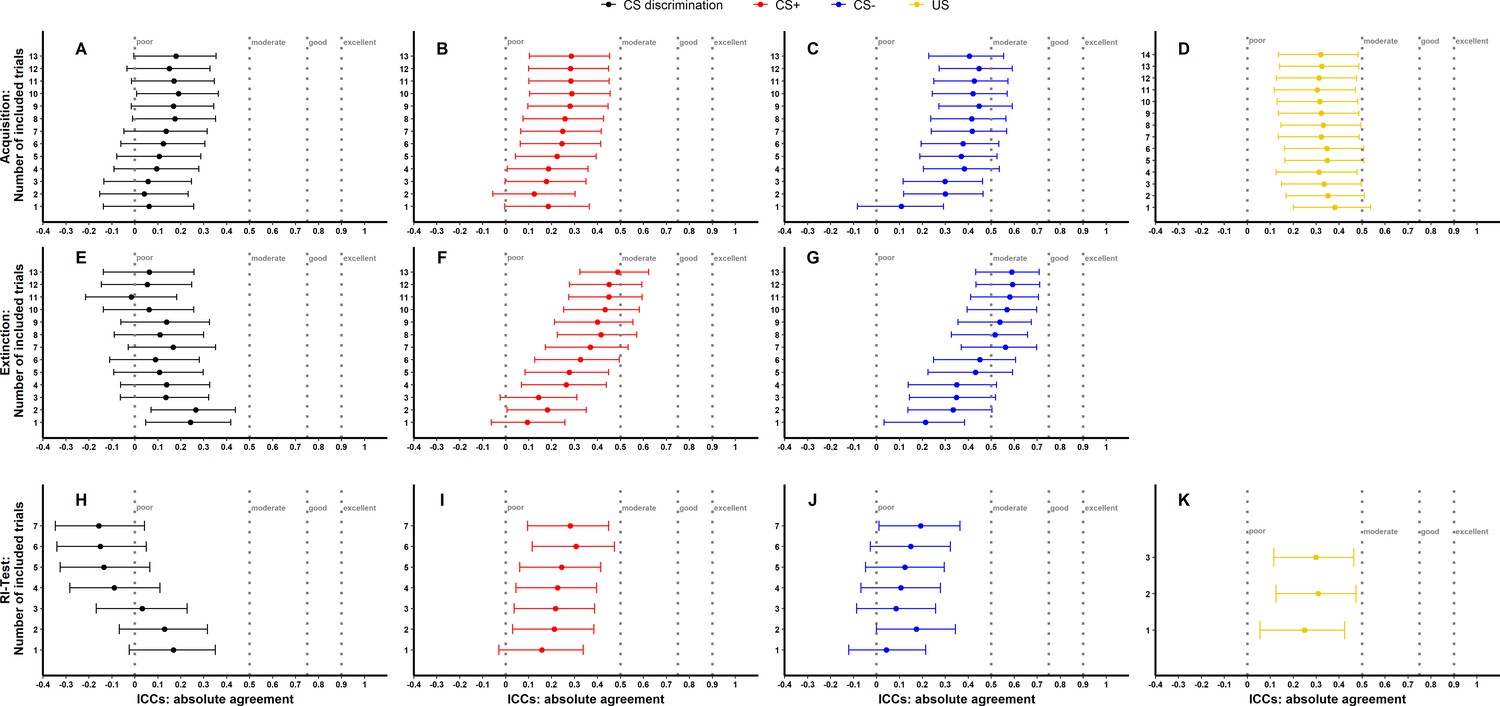
Illustration of ICCabs of trial-by-trial log-transformed skin conductance responses (SCRs) for phases (A–D: Acquisition, E–G: Extinction, H–J: Reinstatement-Test, K: Reinstatement) and stimulus types separately.
Trials were averaged starting with the first (i.e., reinstatement-test and unconditioned stimulus [US] trials) or second trial (i.e., acquisition and extinction training). All preceding trials were added trial-by-trial and averaged. Intraclass correlation coefficients (ICCs) <0.5, <0.75, <0.9, and >0.9 (Koo and Li, 2016) were interpreted as poor, moderate, good, and excellent, respectively. Error bars represent 95% confidence intervals. Non-overlapping error bars indicate significant differences between ICCs within one figure. RI-Test = reinstatement-test.
Figure 1—figure supplement 6

Illustration of ICCcon of trial-by-trial log-transformed skin conductance responses (SCRs) for phases (A–D: Acquisition, E–G: Extinction, H–J: Reinstatement-Test, K: Reinstatement) and stimulus types separately.
Trials were averaged starting with the first (i.e., reinstatement-test and unconditioned stimulus [US] trials) or second trial (i.e., acquisition and extinction training). All preceding trials were added trial-by-trial and averaged. Intraclass correlation coefficients (ICCs) <0.5, <0.75, <0.9, and >0.9 (Koo and Li, 2016) were interpreted as poor, moderate, good and excellent, respectively. Error bars represent 95% confidence intervals. Non-overlapping error bars indicate significant differences between ICCs within one figure. RI-Test = reinstatement-test.
Figure 1—figure supplement 7
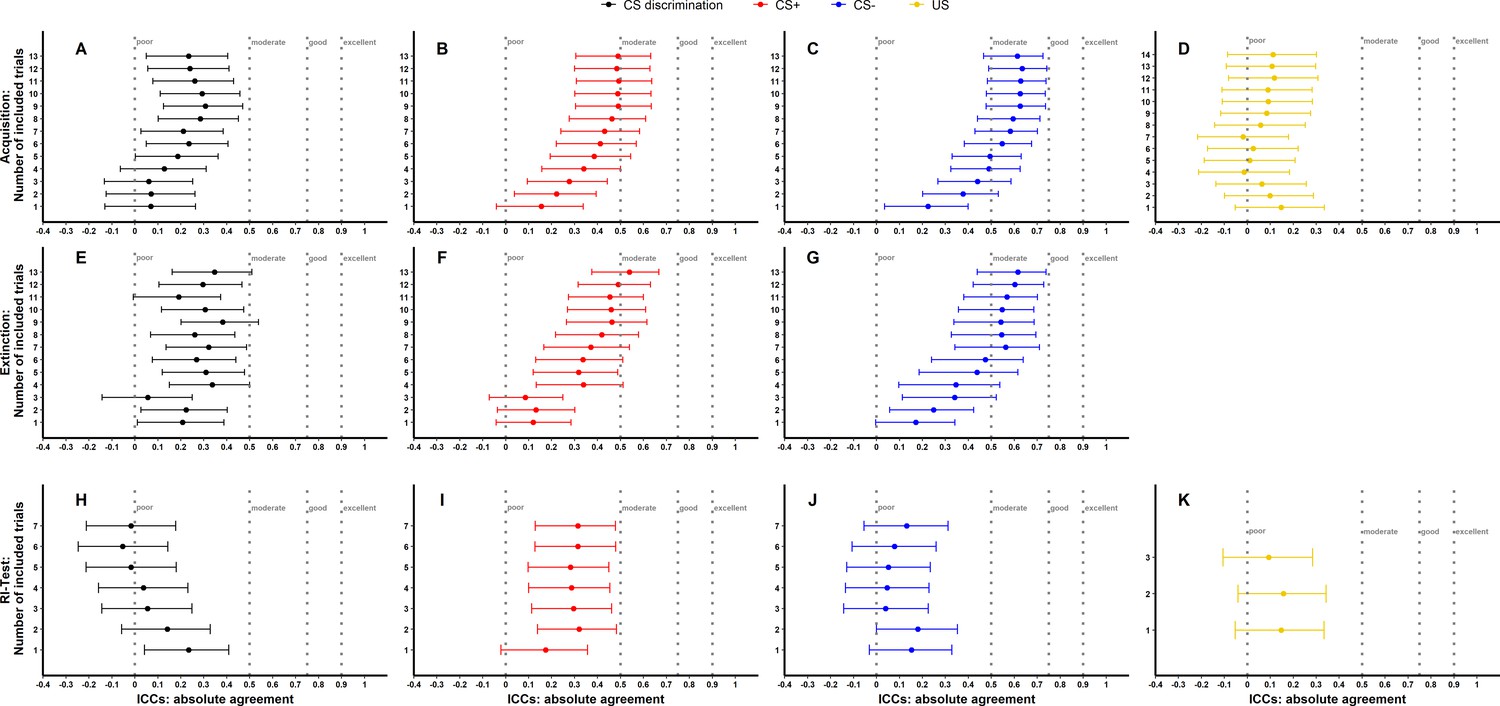
Illustration of ICCabs of trial-by-trial log-transformed and range corrected skin conductance responses (SCRs) for phases (A–D: Acquisition, E–G: Extinction, H–J: Reinstatement-Test, K: Reinstatement) and stimulus types separately.
Trials were averaged starting with the first (i.e., reinstatement-test and unconditioned stimulus [US] trials) or second trial (i.e., acquisition and extinction training). All preceding trials were added trial-by-trial and averaged. Intraclass correlation coefficients (ICCs) <0.5, <0.75, <0.9, and >0.9 (Koo and Li, 2016) were interpreted as poor, moderate, good, and excellent, respectively. Error bars represent 95% confidence intervals. Non-overlapping error bars indicate significant differences between ICCs within one figure. RI-Test = reinstatement-test.
Figure 1—figure supplement 8

Illustration of ICCcon of trial-by-trial log-transformed and range corrected skin conductance responses (SCRs) for phases (A–D: Acquisition, E–G: Extinction, H–J: Reinstatement-Test, K: Reinstatement) and stimulus types separately.
Trials were averaged starting with the first (i.e., reinstatement-test and unconditioned stimulus [US] trials) or second trial (i.e., acquisition and extinction training). All preceding trials were added trial-by-trial and averaged. Intraclass correlation coefficients (ICCs) <0.5, <0.75, <0.9, and >0.9 (Koo and Li, 2016) were interpreted as poor, moderate, good, and excellent, respectively. Error bars represent 95% confidence intervals. Non-overlapping error bars indicate significant differences between ICCs within one figure. RI-Test = reinstatement-test.
Figure 2
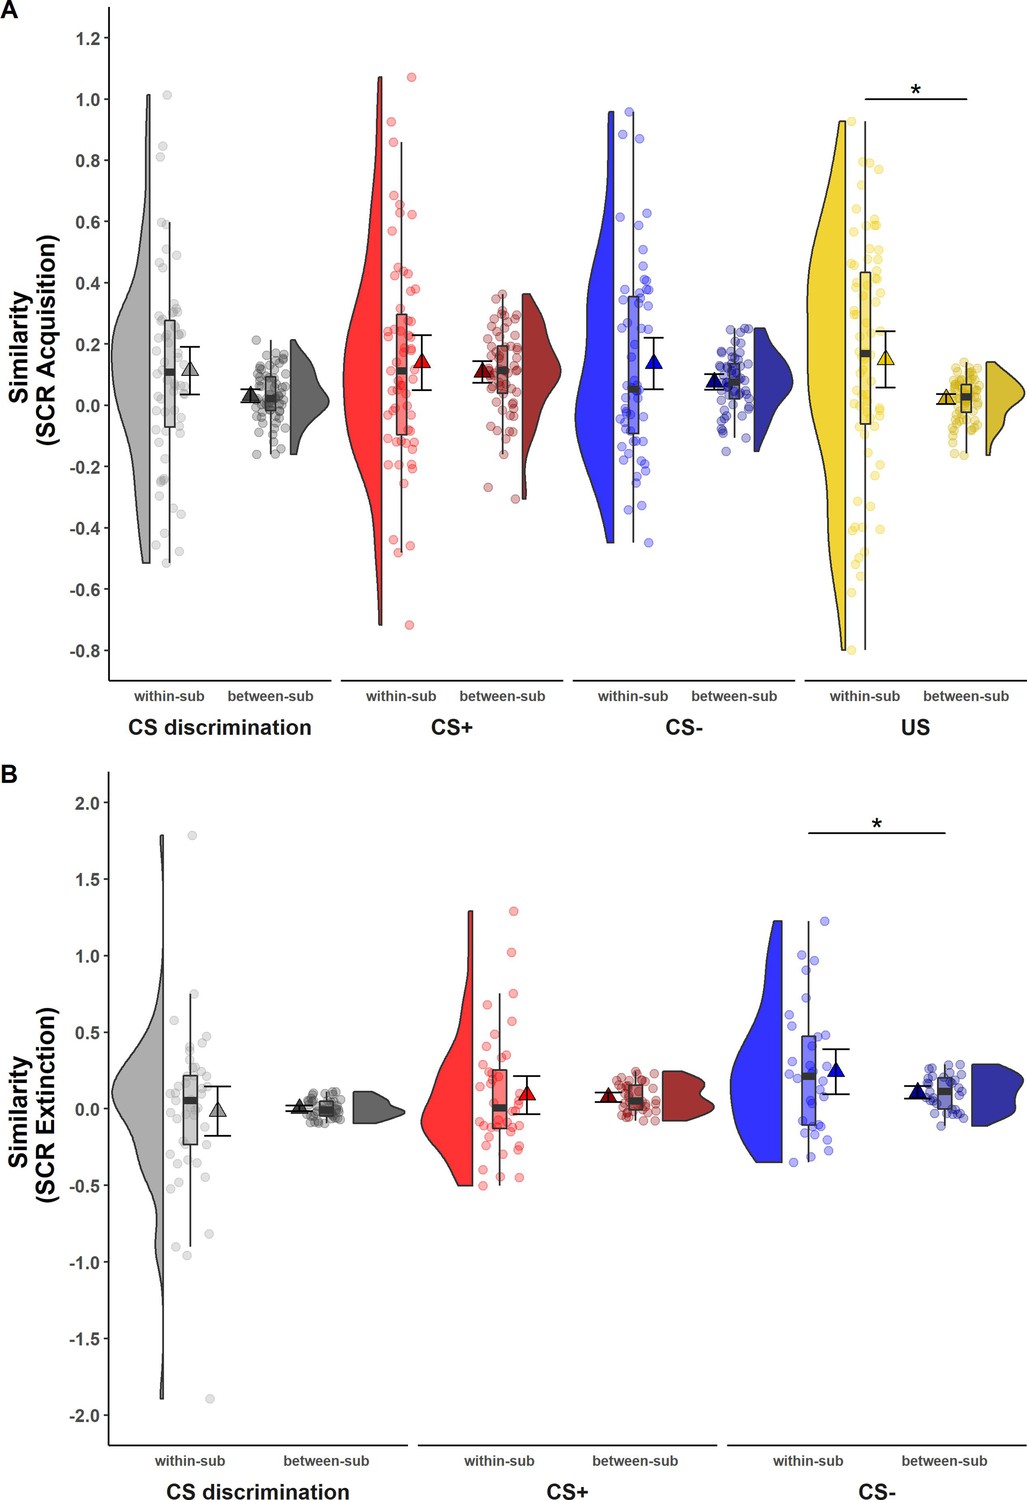
Illustration of within- and between-subject similarity for raw skin conductance responses (SCRs) during (A) acquisition and (B) extinction training separately for CS discrimination (gray), CS+ (red), CS− (blue), and unconditioned stimulus (US) responses (yellow).
Results for log-transformed as well as log-transformed and range corrected SCRs were almost identical to the results from raw data and are hence not reported here. Single data points represent Fisher r-to-z transformed correlations between single trial SCRs of each subject at T0 and T1 (within-subject similarity) or averaged r-to-z transformed correlations between single trial SCRs of one subject at T0 and all other subjects at T1 (between-subject similarity). Triangles represent mean correlations, corresponding error bars represent 95% confidence intervals. Boxes of boxplots represent the interquartile range (IQR) crossed by the median as bold line, ends of whiskers represent the minimum/maximum value in the data within the range of 25th/75th percentiles ±1.5 IQR. Distributions of the data are illustrated by densities next to the boxplots. One data point had a similarity above 3.5 (within-subject similarity of SCRs to the CS+) and is not shown in the figure. *p < 0.05. Note that the variances differ strongly between within- and between-subject similarity because between-subject similarity is based on correlations averaged across subjects, whereas within-subject similarity is based on non-averaged correlations calculated for each subject. Note also that similarity calculations were based on different sample sizes for acquisition and extinction training and CS discrimination as well as SCRs to the CS+, CS−, and US, respectively (for details, see Materials and methods). within-sub = within-subject; between-sub = between-subject.
Figure 3

Acquisition (A) and extinction (B) training within- and between-subject similarities (Fisher r-to-z transformed) of voxel-wise brain activation patterns (based on beta maps) for CS discrimination at T0 and T1 for the whole brain and different regions of interest (ROIs).
Triangles represent mean correlations, corresponding error bars represent 95% confidence intervals. Single data points represent Fisher r-to-z transformed correlations between the first-level response patterns of brain activation of each subject at T0 and T1 (within-subject similarity) or averaged r-to-z transformed correlations between the first-level response patterns of brain activation of one subject at T0 and all other subjects at T1 (between-subject similarity). Boxes of boxplots represent the interquartile range (IQR) crossed by the median as bold line, ends of whiskers represent the minimum/maximum value in the data within the range of 25th/75th percentiles ±1.5 IQR. Distributions of the data are illustrated with densities next to the boxplots. fMRI data for the reinstatement-test were not analyzed in the current study since data from a single trial do not provide sufficient power. *p < 0.05, **p < 0.01, ***p < 0.001. NAcc = nucleus accumbens; dACC = dorsal anterior cingulate cortex; dlPFC = dorsolateral prefrontal cortex; vmPFC = ventromedial prefrontal cortex; within-sub = within-subject; between-sub = between-subject.
Figure 4 with 1 supplement
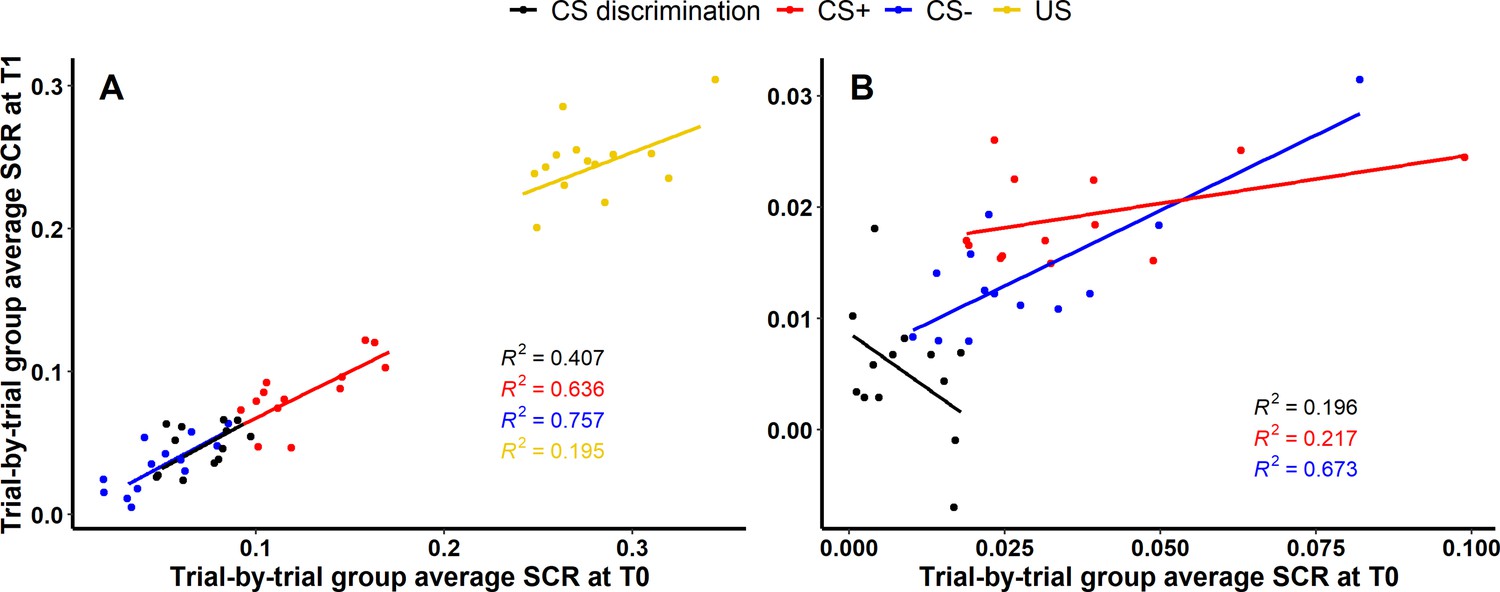
Scatter plots illustrating longitudinal reliability at the group level during (A) acquisition and (B) extinction training for raw skin conductance responses (SCRs) (in μS).
Results for log-transformed as well as log-transformed and range corrected data are presented in Figure 4—figure supplement 1. Longitudinal reliability at the group level refers to the extent of explained variance in linear regressions comprising SCRs at T0 as independent and SCRs at T1 as dependent variable. Results are shown for trial-by-trial group average SCRs to the CS+ (red), CS− (blue), the unconditioned stimulus (US; yellow), and CS discrimination (black). Single data points represent pairs of single trials at T0 and T1 averaged across participants. Note that no US was presented during extinction training and hence, no reliability of the US is shown in (B).
Figure 4—figure supplement 1
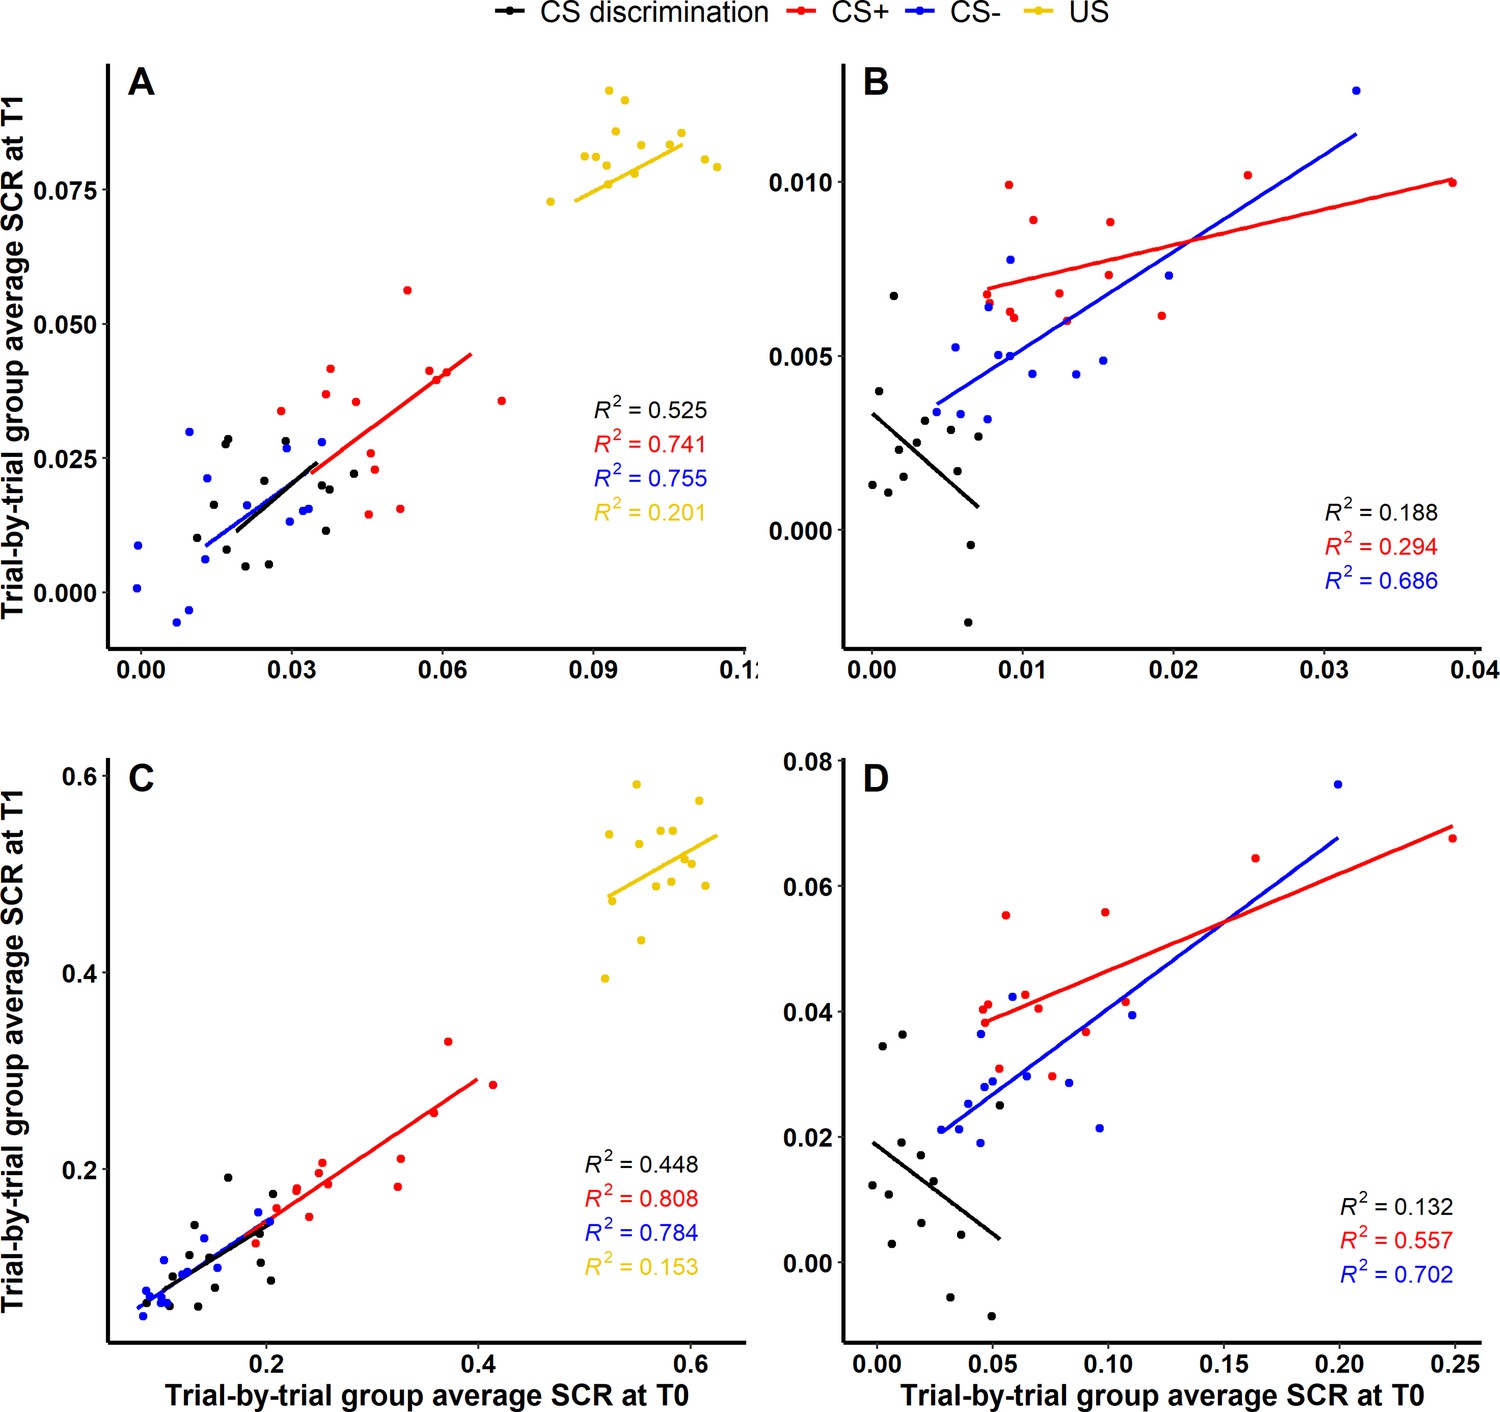
Scatter plots illustrating longitudinal reliability at the group level during (A, C) acquisition and (B, D) extinction training for log-transformed (A, B) as well as log-transformed and range corrected (C, D) skin conductance responses (SCRs).
Longitudinal reliability at the group level refers to the explained variance in linear regressions comprising SCRs at T0 as independent and SCRs at T1 as dependent variable. Results are shown for trial-by-trial group average SCRs to the CS+ (red), CS− (blue), the unconditioned stimulus (US; yellow), and CS discrimination (black). Single data points represent pairs of single trials at T0 and T1 averaged across participants. Note that no US was presented during extinction training and hence, no reliability of the US is shown in (B) and (D).
Figure 5 with 1 supplement
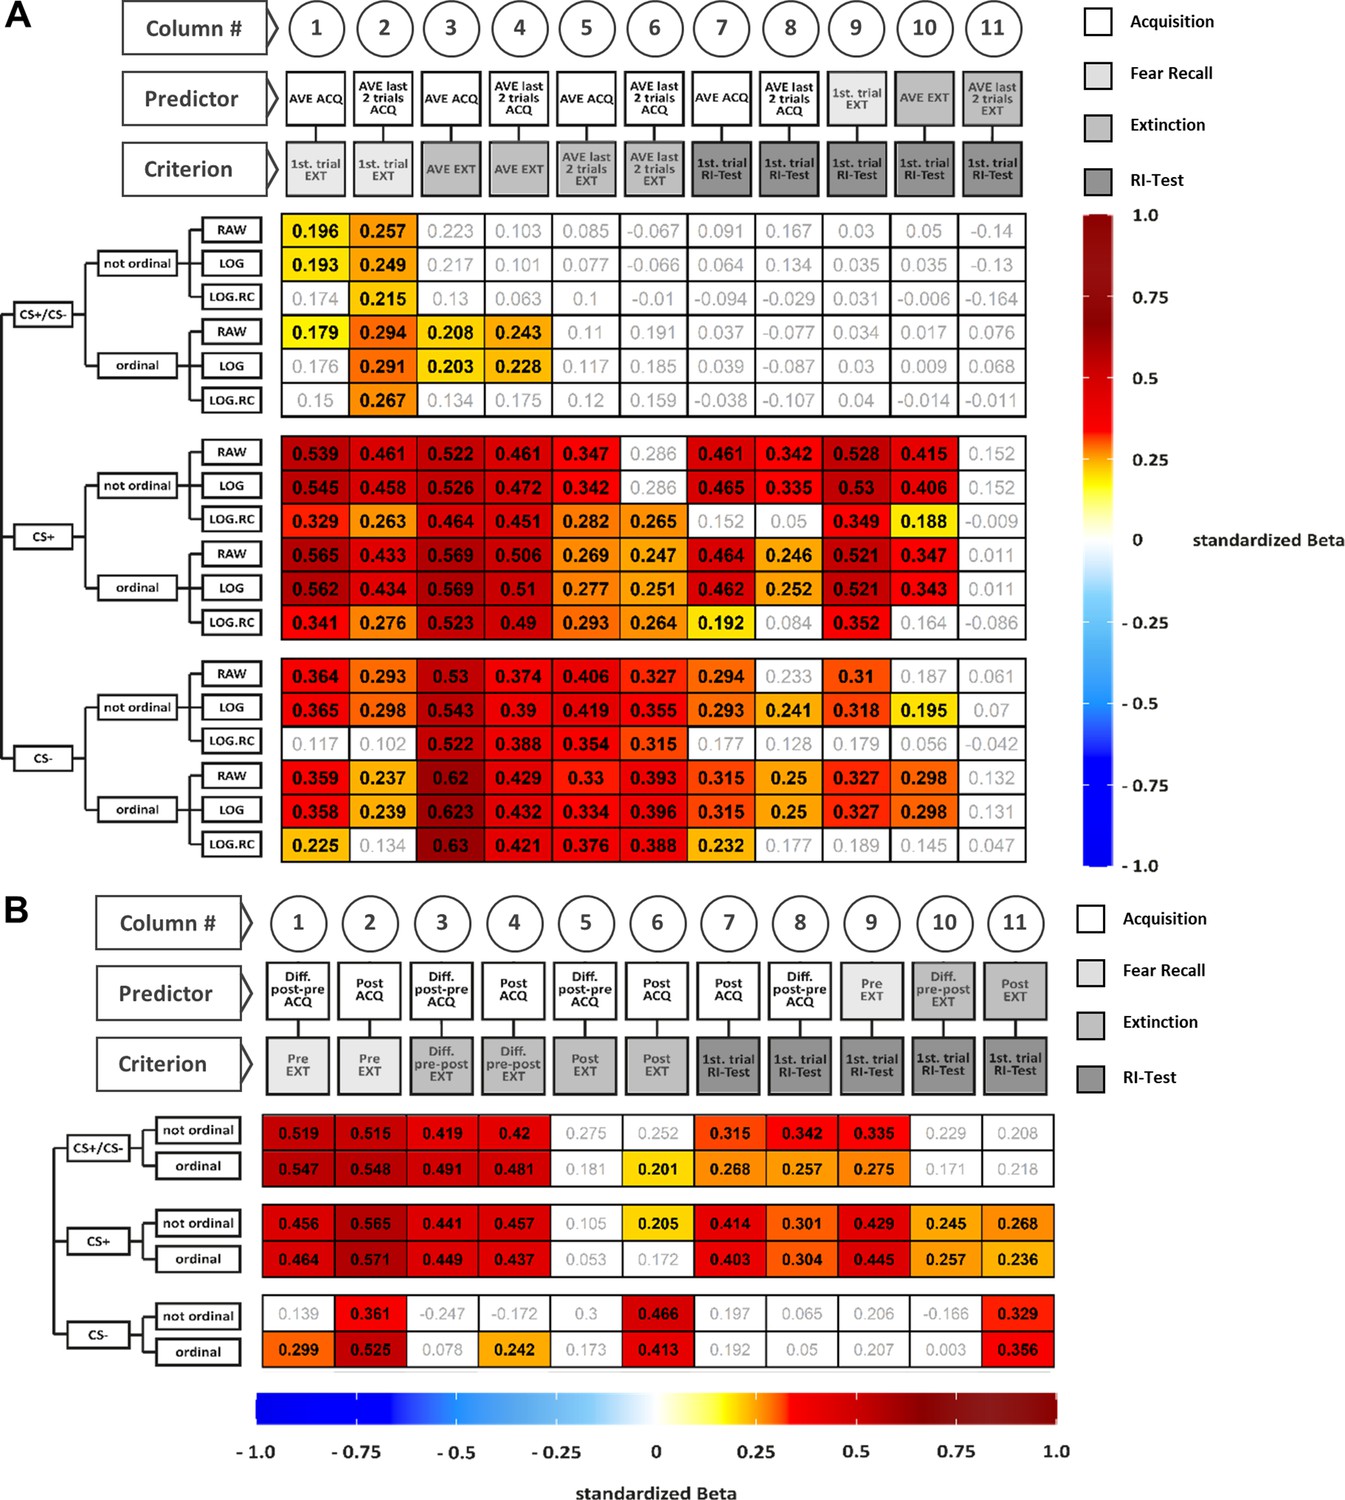
Illustration of standardized betas derived from regressions including skin conductance responses (SCRs) (A) and fear ratings (B) for all data specifications.
Colored cells indicate statistical significance of standardized betas, non-colored cells indicate non-significance. Standardized betas are color coded for their direction and magnitude showing positive values from yellow to red and negative values from light blue to dark blue. Darker colors indicate higher betas. On the y-axis, the following data specifications are plotted from left to right: CS type, ranking of the data and transformation of the data. On the x-axis, the following information is plotted: Number of the columns for better orientation, predictor, and criterion included in the regression. For example, the beta value at the top left in (A) (i.e., 0.196) is the standardized beta as retrieved from the linear regression including CS discrimination in non-ranked and raw SCRs during average acquisition as predictor and the first extinction trial as criterion. For exploratory non-preregistered regressions including a small manyverse of approximations of SCR extinction training learning rates, see Figure 5—figure supplement 1. Tables containing regression parameters beyond the standardized betas depicted in panels A and B are presented in Supplementary file 7 and Supplementary file 8. AVE = average, LOG = log-transformed data, LOG.RC = log-transformed and range corrected data, not ordinal = not ordinally ranked data, ordinal = ordinally ranked data.
Figure 5—figure supplement 1
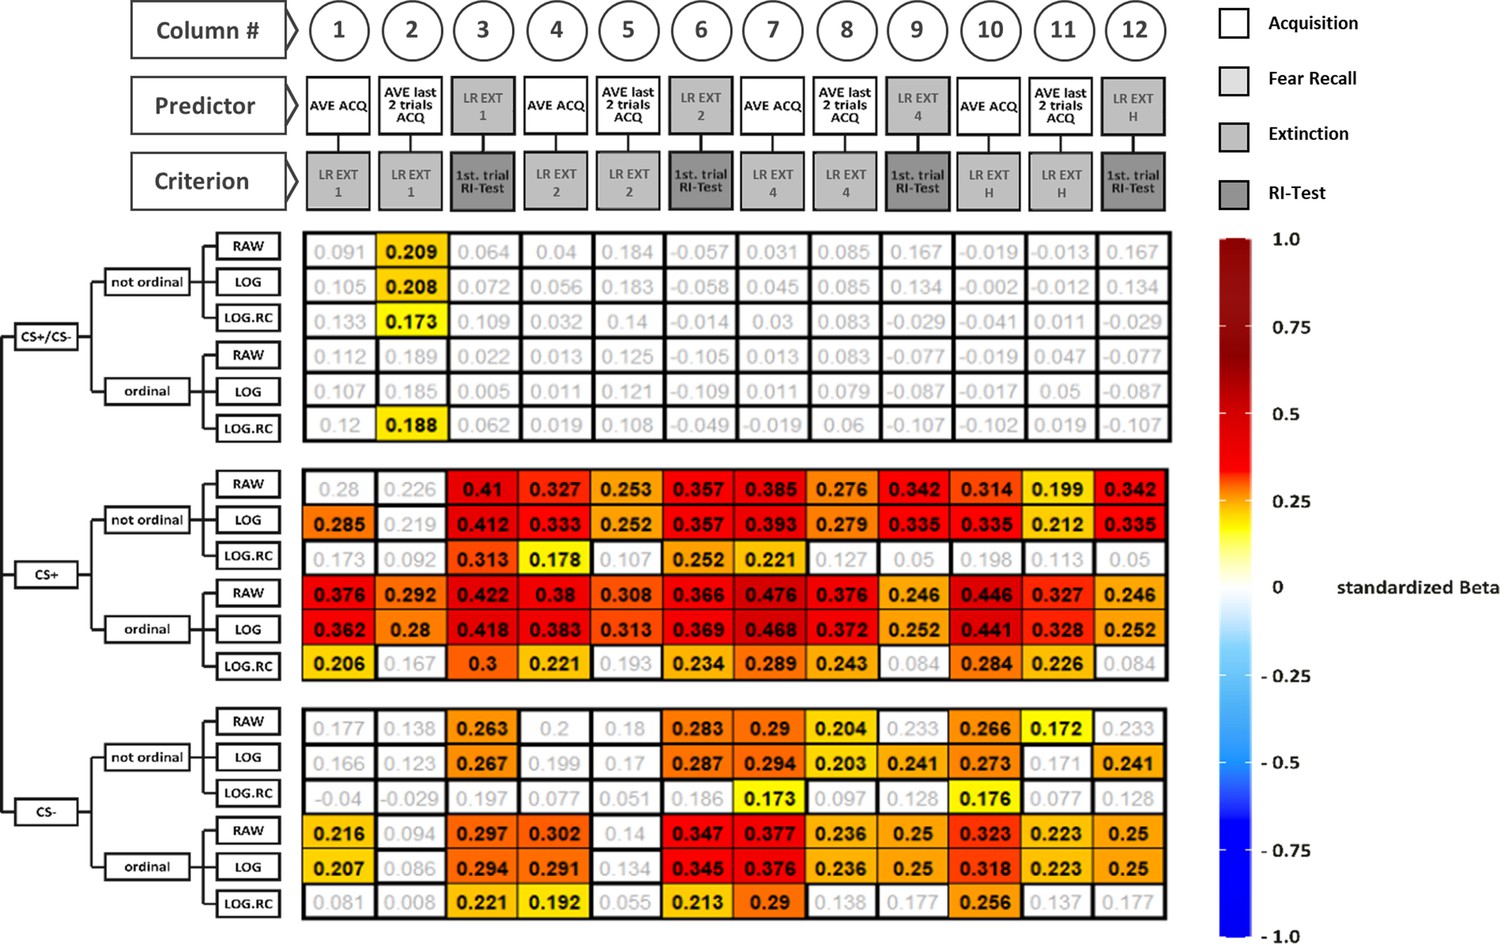
As per reviewer’s request, we illustrate standardized betas derived from non-pre-registered regressions including skin conductance response (SCR) extinction training learning rates (LR EXT).
As there is no agreed upon approach, we provide a small manyverse of approximations of extinction learning rates. We subtracted (1) the last extinction trial from the first extinction trial (i.e., for CS discrimination during the first and last trial, for CS+ and for CS−, respectively; LR EXT 1, columns 1–3), (2) the last two extinction trials from the first two extinction trials (LR EXT 2, columns 4–6), (3) the last quarter of trials from the first quarter of trials (i.e., four trials; LR EXT 4, columns 7–9), and (4) the last half from the first half of trials (i.e., seven trials; LR EXT H, columns 10–12). We acknowledge that learning rates have been inferred through different approaches in the literature (see e.g., Ney et al., 2020; Ney et al., 2022) and are often calculated from model-based approaches such as Rescorla Wagner Model (Seel, 2012) and hence our operationalizations are only four out of multiple equally justifiable options. Colored cells indicate statistical significance of standardized betas, non-colored cells indicate non-significance. Standardized betas are color coded for their direction and magnitude showing positive values from yellow to red and negative values from light blue to dark blue. Darker colors indicate higher betas. AVE = average, LOG = log-transformed data, LOG.RC = log-transformed and range corrected data, not ordinal = not ordinally ranked data, ordinal = ordinally ranked data.
Figure 6
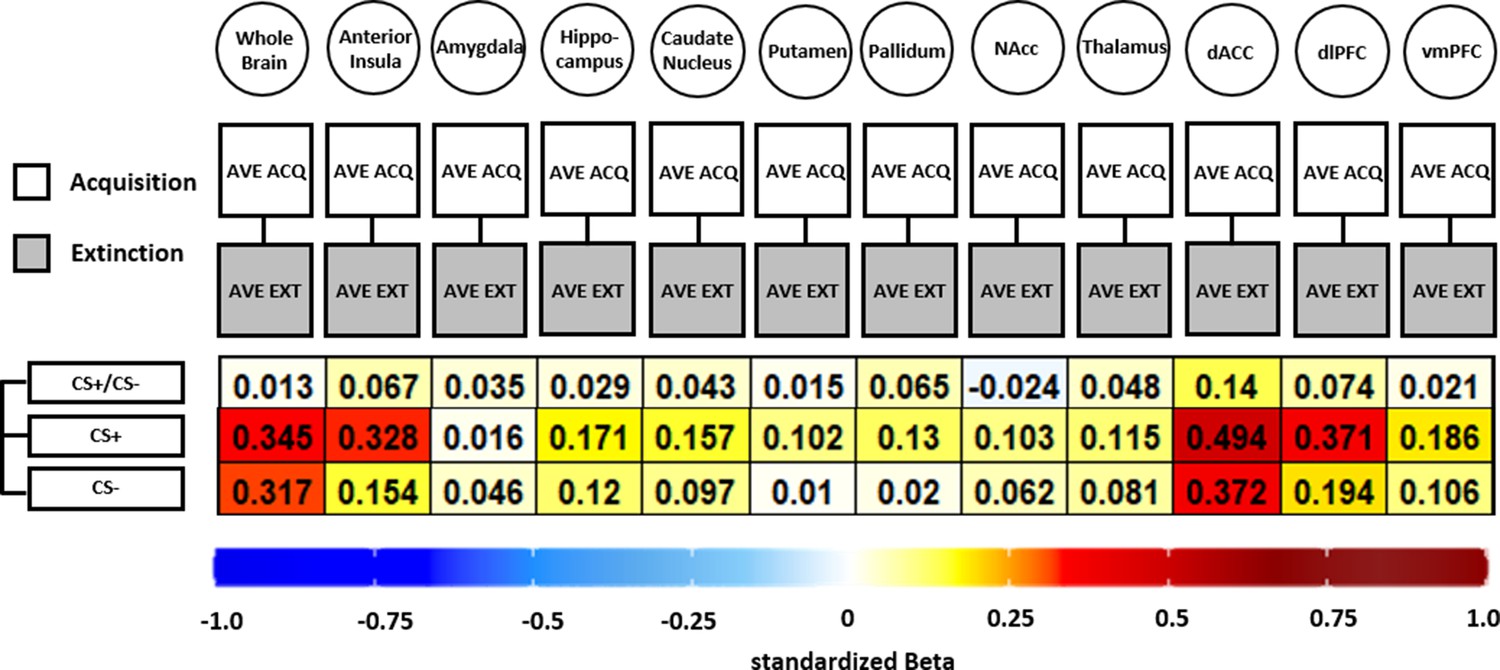
Illustration of standardized betas derived from correlation analyses between brain activation patterns during acquisition and extinction training in different regions of interest (ROIs) and different data specifications.
Standardized betas are color coded for their direction and magnitude showing positive values from yellow to red and negative values from light blue to dark blue. Darker colors indicate higher betas. NAcc = nucleus accumbens; dACC = dorsal anterior cingulate cortex; dlPFC = dorsolateral prefrontal cortex; vmPFC = ventromedial prefrontal cortex.
Figure 7

Illustration of the experimental design (A) and of the calculations of different measures for skin conductance responses (SCRs) including (averaged) acquisition trials (B).
Note that the habituation phase is not shown in the figure, but described in the text.
Author response image 1
Tables
Table 1
Definitions of key terms (A) and data specifications applied across analyses (B).
| (A) | |||||||
|---|---|---|---|---|---|---|---|
| Term | Definition | ||||||
| Internal consistency | In our study, internal consistency refers to the reliability of conditioned responding within experimental phases at both time points, respectively. It provides information on the extent to which items – or in our case – trials measure the same construct (e.g., fear acquisition). Odd and even trials were splitted (i.e., split-half method), averaged per subject and correlated across the sample. | ||||||
| Longitudinal reliability at the individual level | Longitudinal reliability at the individual level indicates to which extent responses within the same individuals are stable over time. It takes into account the individual responses of participants, which are then related across time points. Longitudinal reliability at the individual level inherently includes the group level, as it is calculated for the sample as a whole, but the individual responses are central to the calculation. | ||||||
| ‘ICC coefficients quantify the extent to which multiple measurements for each individual (within individuals) are statistically similar enough to discriminate between individuals’ (Aldridge et al., 2017). Here, we calculated two types of ICCs, namely absolute agreement and consistency. To illustrate the difference between absolute agreement and consistency in a short example (Koo and Li, 2016), consider an interrater reliability study with two raters: Consistency indicates the extent to which the score of one rater (y) is equal to the score of another rater (x) plus a systematic error (c) (i.e., y = x + c). In contrast, absolute agreement indicates to which degree y equals x. As ‘two raters’ can be replaced by ‘two time points’ and individual responses were taken into account here, we used ICCs to determine longitudinal reliability at the individual level. | ||||||
| Similarity analyses provide information on the extent to which trial-by-trial responses of one individual at one time point are comparable to responses of
| ||||||
| Overlap at the individual level reflects the degree of overlap of significant voxels between both time points for single subject-level activation patterns. | ||||||
| Longitudinal reliability at the group level | Longitudinal reliability at the group level indicates to which degree responses within the group as a whole are stable over time. More precisely, longitudinal reliability at the group level relies on first averaging all individuals responses for each trial (for SCR) or voxel (for fMRI) yielding a group average for each trial/voxel. These are then related across time points, that is the calculation is carried out using the trial-wise (for SCR) or voxel-wise (for fMRI) group averages. | ||||||
| Overlap at the group level reflects the degree of overlap of significant voxels between both time points for aggregated group-level activations. | ||||||
| (B) | |||||||
| Measure | Internal consistency | Longitudinal reliability at the individual level | Longitudinal reliability at the group level | Cross-phases predictability | |||
| ICCs | Within- and between-subject similarity | Overlap | Overlap (BOLD fMRI) or R squared (SCR) | ||||
| Included time points | All | T0 and T1 separately | T0 and T1 | T0 and T1 | T0 and T1 | T0 and T1 | T0 |
| Included stimuli | SCR | CS+, CS−, CS discrimination, US | CS+, CS−, CS discrimination, US* | CS+, CS−, CS discrimination, US | – | CS+, CS−, CS discrimination, US | CS+, CS−, CS discrimination |
| Fear ratings | – | CS+, CS−, CS discrimination, US* | – | – | – | CS+, CS−, CS discrimination | |
| BOLD fMRI | – | CS discrimination† | CS discrimination† | CS discrimination† | CS discrimination† | CS+, CS−, CS discrimination | |
| Phase operationalizations | SCR | Entire phases (ACQ, EXT, RI-Test; except first trials of ACQ and EXT) | CS+, CS−, and CS discrimination: average ACQ, last two trials ACQ‡, first trial EXT§, average EXT, last two trials EXT‡¶, first trial RI-Test§ US: average RI | Average ACQ**, average EXT | – | Average ACQ, average EXT | Average ACQ, last two trials ACQ‡, first trial EXT§, average EXT, last two trials EXT‡ ¶, first trial RI-Test§ |
| Fear ratings | – | CS+, CS−, and CS discrimination: post–pre ACQ, post ACQ, pre EXT, pre–post EXT, post EXT, first trial RI-Test US: post RI-Test | – | – | – | post–pre ACQ, post ACQ, pre EXT, pre–post EXT, post EXT, first trial RI-Test | |
| BOLD fMRI†† | – | Average ACQ, average EXT | Average ACQ, average EXT | Average ACQ, average EXT | Average ACQ, average EXT | Average ACQ, average EXT | |
| Transformations ‡ ‡ | SCR | None, log-transformation§ §, log-transformation and range correction¶ ¶ | None, log-transformation§ §, log-transformation and range correction¶ ¶ | None*** | – | None, log-transformation§ §, log-transformation and range correction¶ ¶ | None, log-transformation§ §, log-transformation and range correction¶ ¶ |
| Fear ratings | – | None | – | – | – | None | |
| BOLD fMRI | – | None | None | None | None | None | |
| Ordinal ranking††† | SCR | No ranking | No ranking‡ ‡ ‡ | No ranking | – | No ranking | No ranking and ordinal ranking § § § |
| Fear ratings | – | No ranking‡ ‡ ‡ | – | – | – | No ranking and ordinal ranking | |
| BOLD fMRI | – | No ranking | No ranking | No ranking | No ranking | No ranking | |
-
The specifications we used here are exemplary and are not intended to cover all possible data specifications. Note that internal consistency, within- and between-subject similarity and reliability at the group level could not be calculated for fear ratings due to the limited number of trials. ACQ = acquisition training, EXT = extinction training, RI = reinstatement, RI-Test = reinstatement-test.
-
*
Non-pre-registered ICCs for SCRs to the USs and US aversiveness ratings were calculated as we considered these informative.
-
†
For BOLD fMRI, ICCs were calculated only for CS discrimination and not for CS+ and CS− given the fact that the calculations are based on first-level T contrast maps and contrasts against baseline are not optimal.
-
‡
In addition to the averaged acquisition and extinction training performance, the last two SCR trials of acquisition (pre-registered) and extinction training (not pre-registered) were separated from the previous trials and averaged as equivalent to the post-acquisition/-extinction ratings. The first extinction trial was taken into account separately as fear recall.
-
§
Fear recall and reinstatement-test were operationalized as the first extinction training trial and the first reinstatement-test trial (since the reinstatement effect fades away relatively quickly, Haaker et al., 2014), respectively.
-
¶
The operationalization of extinction training as the last two trials was not pre-registered and included for completeness. In cases where phase operationalizations included more than one SCR trial, trials were averaged.
-
**
Note that reliability at a group level for SCRs during reinstatement-test was not calculated as correlations between two SCR data points are not meaningful.
-
††
fMRI data for the reinstatement-test were not analyzed in the current study since data from a single trial do not provide sufficient power.
-
‡ ‡
The pre-registered transformation types were identified to be typically employed data transformations in the literature by for example Sjouwerman et al., 2022 who also pre-registered these transformation types.
-
§ §
Raw SCR amplitudes were log-transformed by taking the natural logarithm to normalize the distribution (Levine and Dunlap, 1982).
-
¶ ¶
Log-transformed SCR amplitudes were range corrected by dividing each individual SCR trial by the maximum SCR trial across all CS and US trials. Due to potentially different response ranges, the maximum SCR trial was determined separately for experimental days as recommended by Lonsdorf et al., 2017a. Range correction was recommended to control for interindividual variability (Lykken, 1972; Lykken and Venables, 1971).
-
***
We also carried out similarity analyses for log-transformed as well as for log-transformed and range corrected data. However, results were almost identical to the results from the raw data. For reasons of space, we only report results for raw data.
-
†††
Ranking of the data was included to investigate to which degree individuals occupy the same ranks at both time points as pre-registered or put differently, whether the quality of predictions changes when the predictions were not based on the absolute values but on a coarser scale.
-
‡ ‡ ‡
As opposed to what was pre-registered, in ICC analyses, we included non-ranked data only as closer inspection of the conceptualization of ICCcon revealed that it would be redundant to calculate both ICCabs and ICCcon with ranked and non-ranked data as ICCcon itself ranks the data.
-
§ § §
Ranks of SCRs were built upon raw, log-transformed as well as log-transformed and range corrected values.
Table 2
Overlap in significantly activated voxels at the individual and group level across both time points for CS discrimination.
| Level | Phase | Coeff. | ROI | |||||||||||
|---|---|---|---|---|---|---|---|---|---|---|---|---|---|---|
| Whole brain | Insula | Amygdala | Hippocampus | Caudate | Putamen | Pallidum | Accumbens | Thalamus | dACC | dlPFC | vmPFC | |||
| (A) Individual | Acq | Jaccard | 0.076 | 0.075 | 0.011 | 0.012 | 0.039 | 0.037 | 0.018 | 0.017 | 0.033 | 0.132 | 0.080 | 0.039 |
| Dice | 0.131 | 0.121 | 0.018 | 0.021 | 0.057 | 0.058 | 0.029 | 0.024 | 0.055 | 0.189 | 0.118 | 0.061 | ||
| Ext | Jaccard | 0.007 | 0.001 | 0.000 | 0.000 | 0.001 | 0.000 | 0.000 | 0.000 | 0.001 | 0.003 | 0.001 | 0.005 | |
| Dice | 0.014 | 0.001 | 0.000 | 0.000 | 0.001 | 0.000 | 0.000 | 0.001 | 0.001 | 0.006 | 0.002 | 0.009 | ||
| (B) Group | Acq | Jaccard | 0.620 | 0.595 | 0.294 | 0.323 | 0.613 | 0.740 | 0.747 | 0.441 | 0.834 | 0.898 | 0.895 | 0.045 |
| Dice | 0.765 | 0.745 | 0.448 | 0.472 | 0.760 | 0.847 | 0.855 | 0.595 | 0.910 | 0.946 | 0.944 | 0.086 | ||
| Ext | Jaccard | 0.057 | 0.000 | 0.000 | 0.000 | 0.000 | 0.000 | 0.000 | 0.000 | 0.000 | 0.044 | 0.014 | 0.000 | |
| Dice | 0.108 | 0.000 | 0.000 | 0.000 | 0.000 | 0.000 | 0.000 | 0.000 | 0.000 | 0.085 | 0.028 | 0.000 | ||
-
Note. Results are shown for the whole brain as well as for selected regions of interest (ROIs) for fear acquisition training and extinction training. Both coefficients range from 0 (no overlap) to 1 (perfect overlap). Note that the Jaccard can be interpreted as % (Maitra, 2010). NAcc = nucleus accumbens; dACC = dorsal anterior cingulate cortex; dlPFC = dorsolateral prefrontal cortex; vmPFC = ventromedial prefrontal cortex.
Additional files
-
Supplementary file 1
Overview of experimental specifications and results of five previous studies reporting test–retest reliabilities in human fear conditioning research.
- https://cdn.elifesciences.org/articles/78717/elife-78717-supp1-v3.docx
-
Supplementary file 2
Deviations from pre-registration.
- https://cdn.elifesciences.org/articles/78717/elife-78717-supp2-v3.docx
-
Supplementary file 3
ICCabs and ICCcon for all data specifications of SCRs.
- https://cdn.elifesciences.org/articles/78717/elife-78717-supp3-v3.docx
-
Supplementary file 4
ICCabs and ICCcon for all data specifications of fear ratings.
- https://cdn.elifesciences.org/articles/78717/elife-78717-supp4-v3.docx
-
Supplementary file 5
ICCabs and ICCcon for CS discrimination during fear acquisition (Acq) and extinction training (Ext).
- https://cdn.elifesciences.org/articles/78717/elife-78717-supp5-v3.docx
-
Supplementary file 6
Paired sample t-tests comparing between- and within-subject similarity for whole brain activation pattern as well as activation pattern in the ROIs for acquisition training (Acq) and extinction training (Ext).
- https://cdn.elifesciences.org/articles/78717/elife-78717-supp6-v3.docx
-
Supplementary file 7
Detailed results of linear regressions: SCR.
- https://cdn.elifesciences.org/articles/78717/elife-78717-supp7-v3.docx
-
Supplementary file 8
Detailed results of linear regressions: fear ratings.
- https://cdn.elifesciences.org/articles/78717/elife-78717-supp8-v3.docx
-
Transparent reporting form
- https://cdn.elifesciences.org/articles/78717/elife-78717-transrepform1-v3.docx
-
MDAR checklist
- https://cdn.elifesciences.org/articles/78717/elife-78717-mdarchecklist1-v3.pdf
Download links
A two-part list of links to download the article, or parts of the article, in various formats.
Downloads (link to download the article as PDF)
Open citations (links to open the citations from this article in various online reference manager services)
Cite this article (links to download the citations from this article in formats compatible with various reference manager tools)
Robust group- but limited individual-level (longitudinal) reliability and insights into cross-phases response prediction of conditioned fear
eLife 11:e78717.
https://doi.org/10.7554/eLife.78717


