Viscoelastic properties of suspended cells measured with shear flow deformation cytometry
- Department of Physics, Friedrich-Alexander University Erlangen-Nurnberg, Germany
- Department of Physics and Astronomy, York-University Toronto, Canada
- Aix-Marseille Universite´, CNRS, Inserm, LAI, Turing centre for living systems, France
- Max Planck Institute for the Science of Light and Max-Planck-Zentrum fur Physik und Medizin, Germany
- Institute of Polymer Materials, Friedrich-Alexander University Erlangen-Nurnberg, Germany
- Institute of Neuropathology, University Hospital Erlangen, Germany
- Department of Physics, University of Bayreuth, Germany
Figures
Figure 1 with 1 supplement
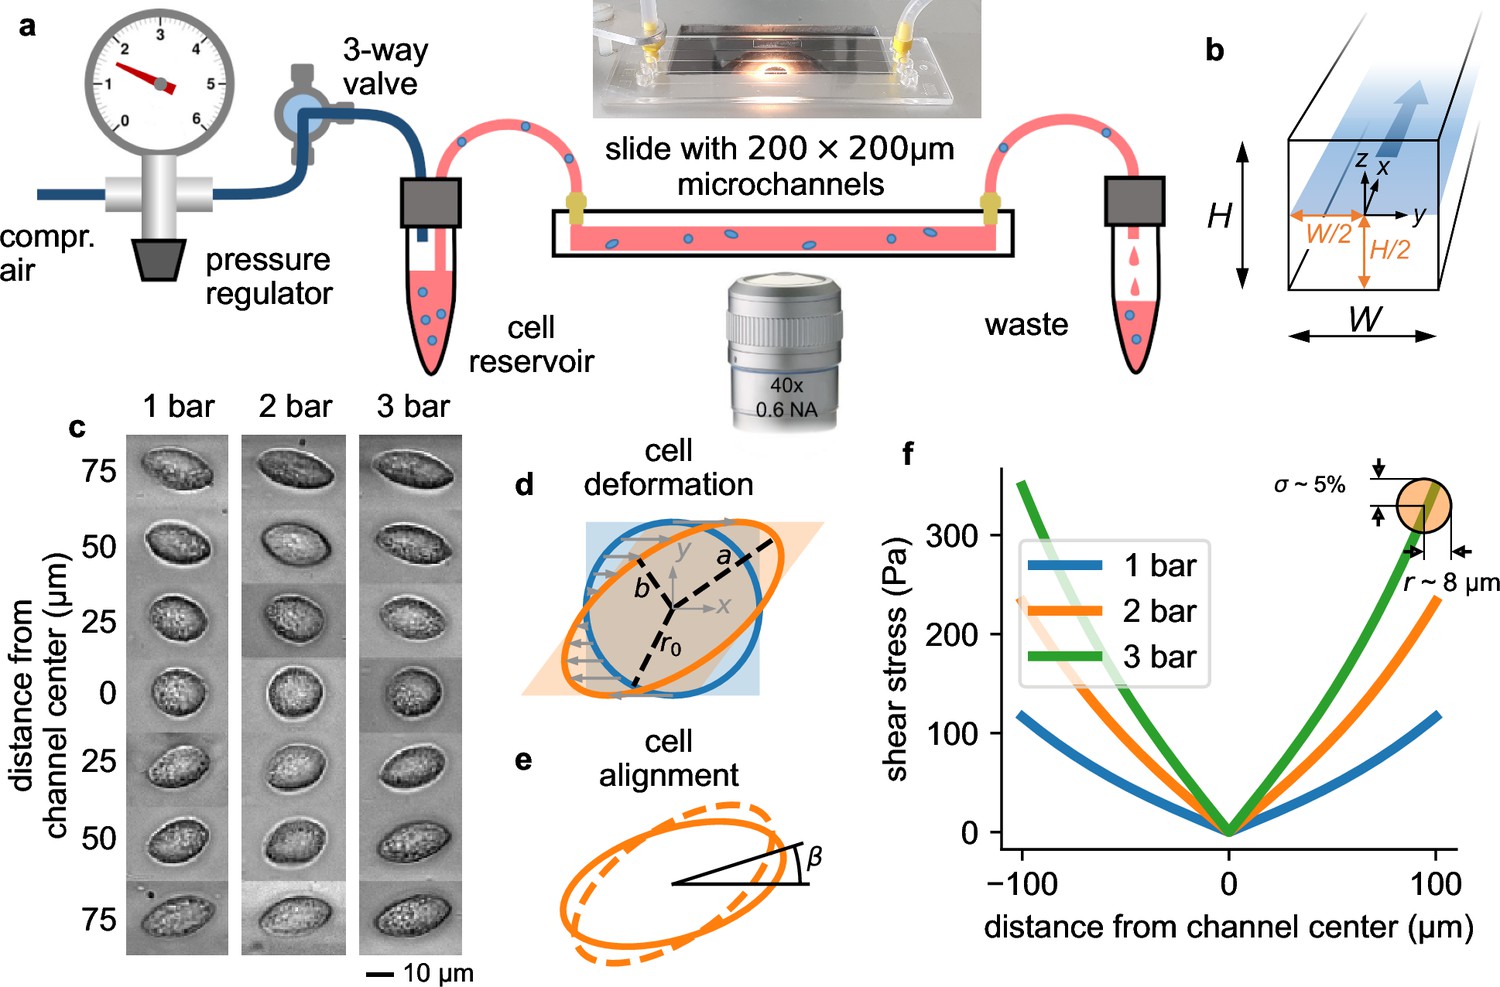
Measurement setup and principle.
a, Schematic of the microfluidic device. b, Cross section through the microchannel with dimensions = = 200 µm. The focal plane of the microscope at a height of /2=100 µm is indicated by the blue shaded area. Fluid flow is in direction. c, Bright field images of NIH-3T3 cells under control conditions at different y-positions in a microchannel at a pressure of 1, 2, and 3 bar. Cells appear round in the channel center and become more elongated near the walls. d, Illustration of cell deformations under fluid shear. The circular cell with radius r0 (blue) is transformed to an elliptical shape (orange) with semi-major axis and semi-minor axis depending on the ratio of fluid shear stress and the cell’s shear modulus (Equation 16). e, The sheared cell (dashed outline) will partially align in flow direction (solid outline), characterized by an alignment angle β. This angle depends on the ratio of cell viscosity and suspension fluid viscosity (Equation 17). , , and β are measured from the segmented cell shapes. f, Fluid shear stress (computed according to Equation 4) versus distance from the channel center in -direction for three different pressures of 1, 2, and 3 bar. Close to the channel wall, the shear stress varies by 5% across the cell surface for a typical cell with a radius of 8 µm (indicated by the orange circle). Cells that extend beyond the channel center are excluded form further analysis.
Figure 1—figure supplement 1
Software flow-chart.
Figure 2 with 2 supplements
Cell responses to shear stress and shear rate.
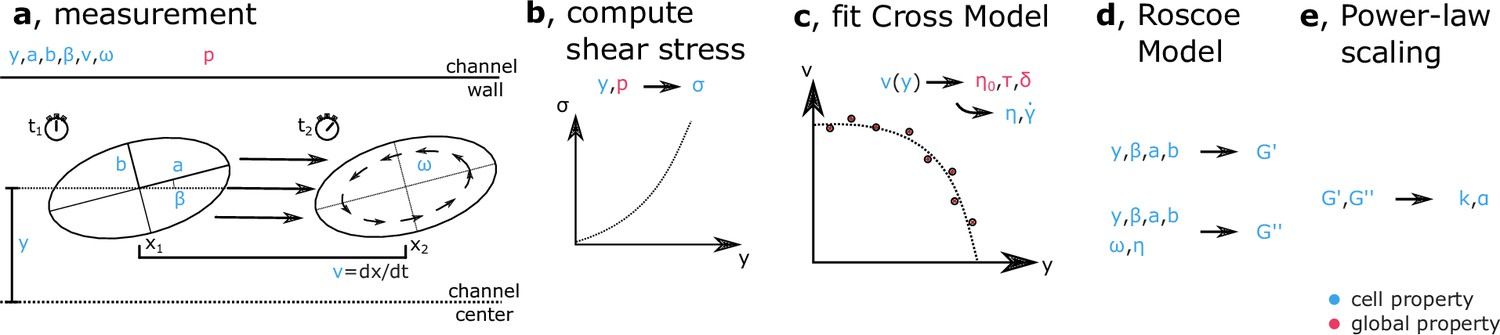
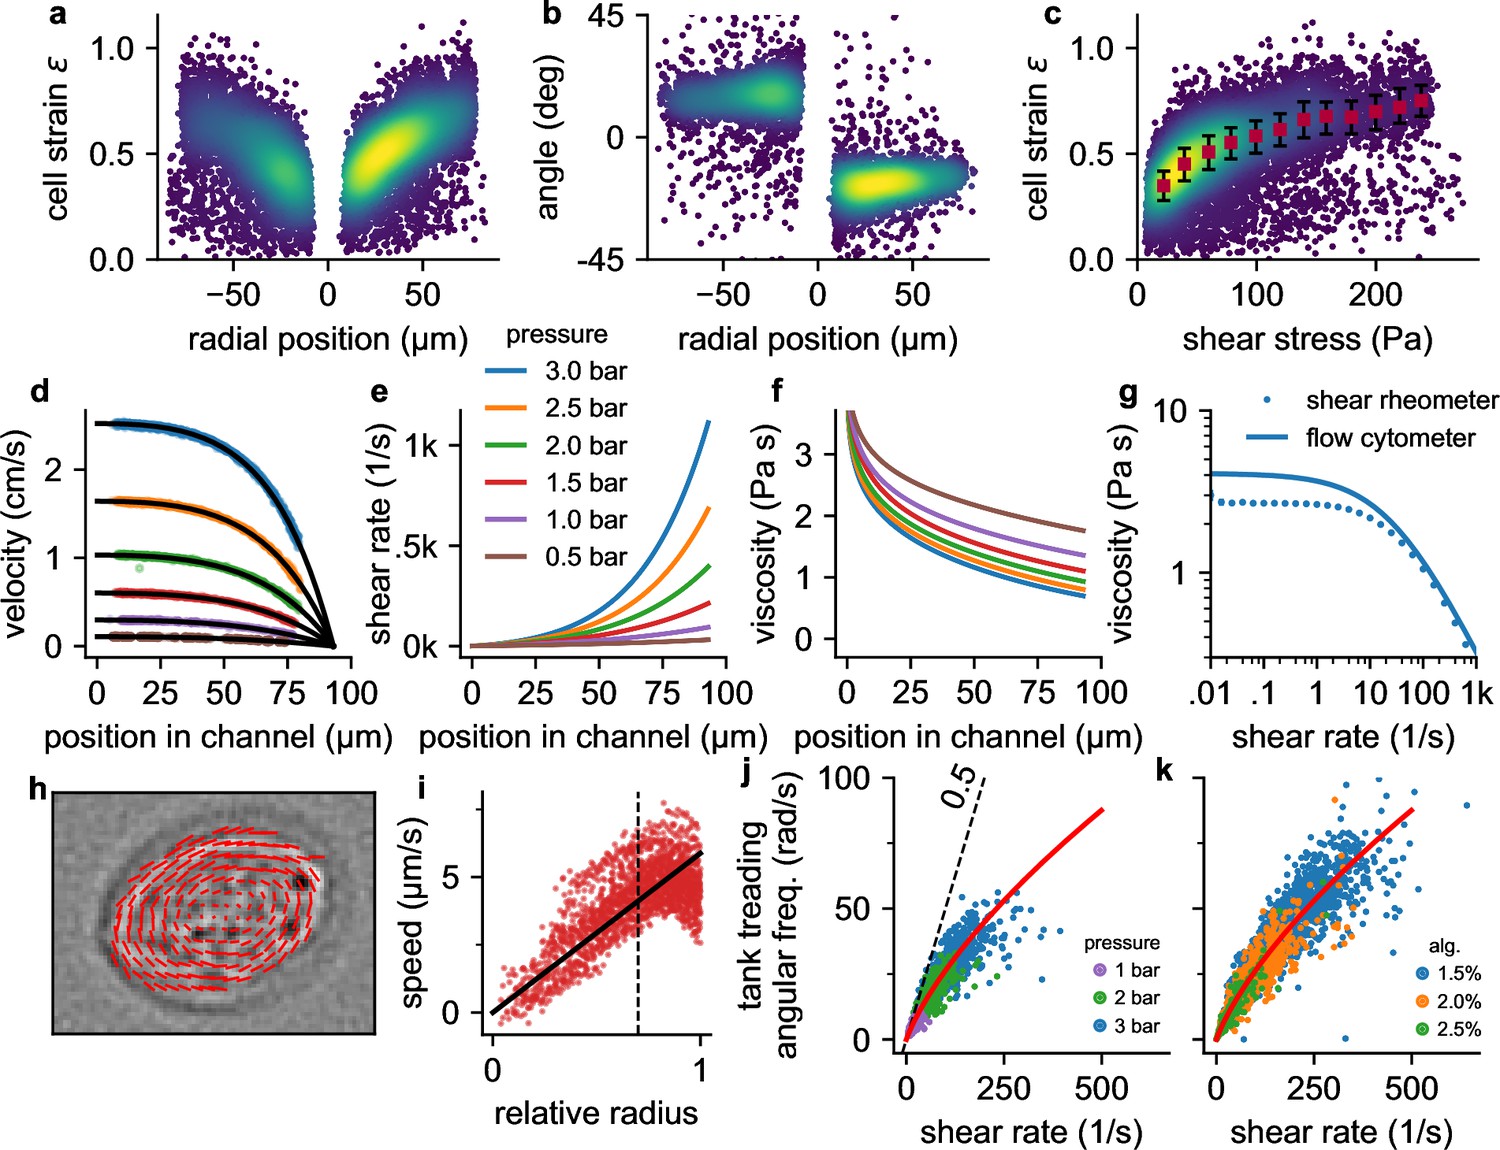
a, Cell strain versus radial () position in the channel for NIH-3T3 cells at a pressure of 3 bar. Each data point corresponds to a single cell. Colors indicate Gaussian kernel density. b, Cell alignment angle β versus radial position in the channel () for the same cells as in a. c, Cell strain versus shear stress for the same cells as in a. Red squares indicate median values over shear stress bins of 20 Pa starting from 10 Pa, error bars indicate quartiles. d, Fluid flow velocity versus radial channel position () for different driving pressures (0.5, 1.0, 1.5, 2.0, 2.5, 3.0 bar). Each data point corresponds to the speed of a single cell. Black lines show individual fit curves obtained by fitting the Cross-model (power-law shear thinning fluid with zero-stress viscosity) to the velocity profile (Equation 5 - Equation 9). e, Shear rate of the suspension fluid versus radial channel position () for different driving pressures. The shear rate is computed with Equation 7. f, Local suspension fluid viscosity at different channel positions computed with Equation 6. g, Suspension fluid viscosity versus shear rate from the fit of the Cross-model (blue line) to the data shown in d, and measured with a cone-plate rheometer (blue circles). h, Tank-treading rotation of a cell in the channel, quantified from the optical flow between two subsequent images. i, Rotational speed of cell image pixels (same cell as in h) versus the ellipse-corrected radius (radial pixel position normalized by the radius of the cell ellipse at that angle). Only cell pixels with an ellipse-corrected radius below 0.7 (dotted line) are used for the linear fit of the tank-treading frequency to the data (solid line) to avoid cell boundary artefacts. j, The angular tank-treading frequency increases with the shear rate, with a slope approaching 0.5 for small shear rates (dashed black line). Each point represents the data of an individual cell; different colors indicate different pressures. The red line presents the fit of Equation 20 to the data. k, same as in j but for measurements at a pressure of 2 bar in differently concentrated alginate hydrogels.
Figure 2—figure supplement 1
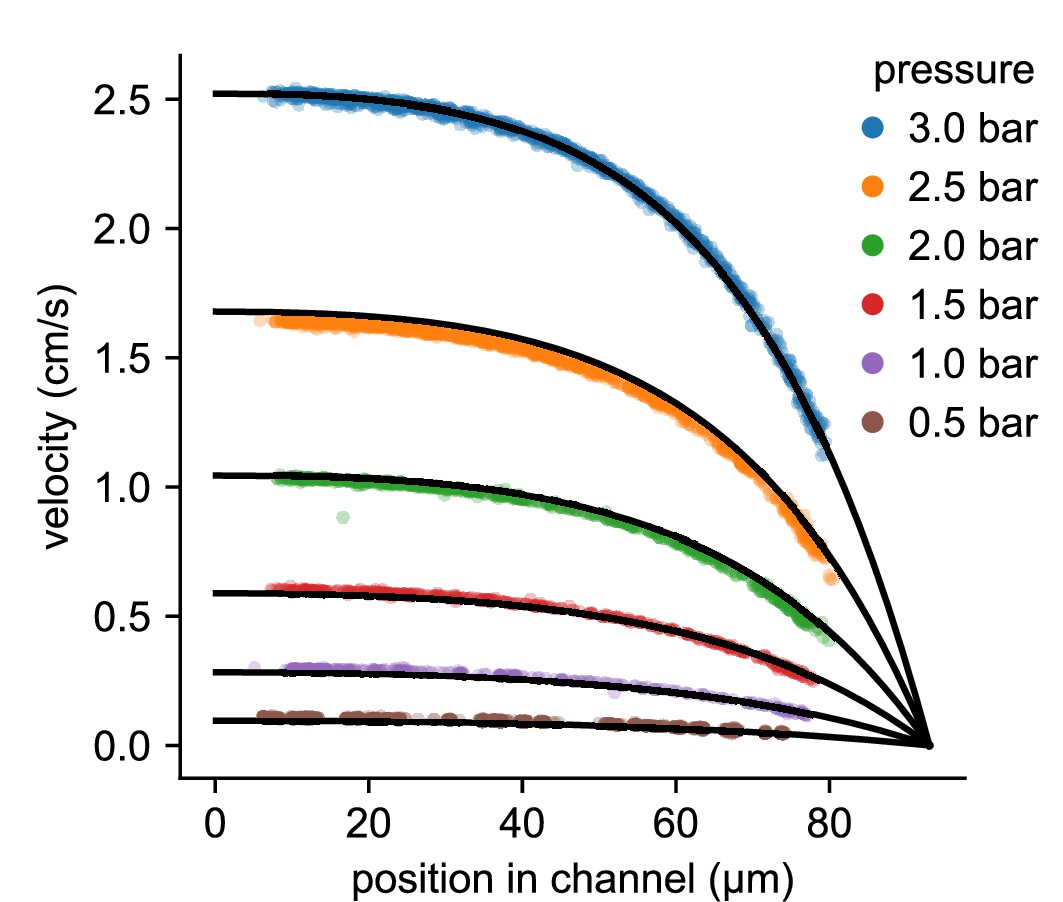
Velocity profile of a 2% alginate solution as a function of the -position in the channel for different driving pressures (same data as in Figure 2d).
The top black line through the 3 bar data points shows the velocity profile fitted to the 3 bar data (each point representing the measured velocity of an NIH-3T3 cell) using Equation 4– 9. Based on this fit, we determine the Cross-model rheological parameters () of the alginate solution and then predict the velocity profile for all other driving pressures (0.5–2.5 bar). The excellent agreement between measured and predicted velocities confirms the applicability of Equation 4– 9.
Figure 2—figure supplement 2

Parameters describing the shear-thinning behavior of the suspension fluid for different alginate concentrations (1.5%, 2.0%, 2.5%).
The parameters are obtained from a fit of Equation 6 to the flow velocity profile in the channel (Figure 2d) as described in section ‘Velocity profile, shear rate profile, and viscosity’. Data points represent repeated measurements from three different preparations (indicated by different markers) for each of the 3 concentrations (indicated by different colors). τ shows a pronounced covariance with and δ and fluctuates between measurements (coefficient of variation is 0.26), whereas the fit of and τ is more robust (coefficient of variation is 0.15 and 0.06, respectively).
Figure 3 with 1 supplement
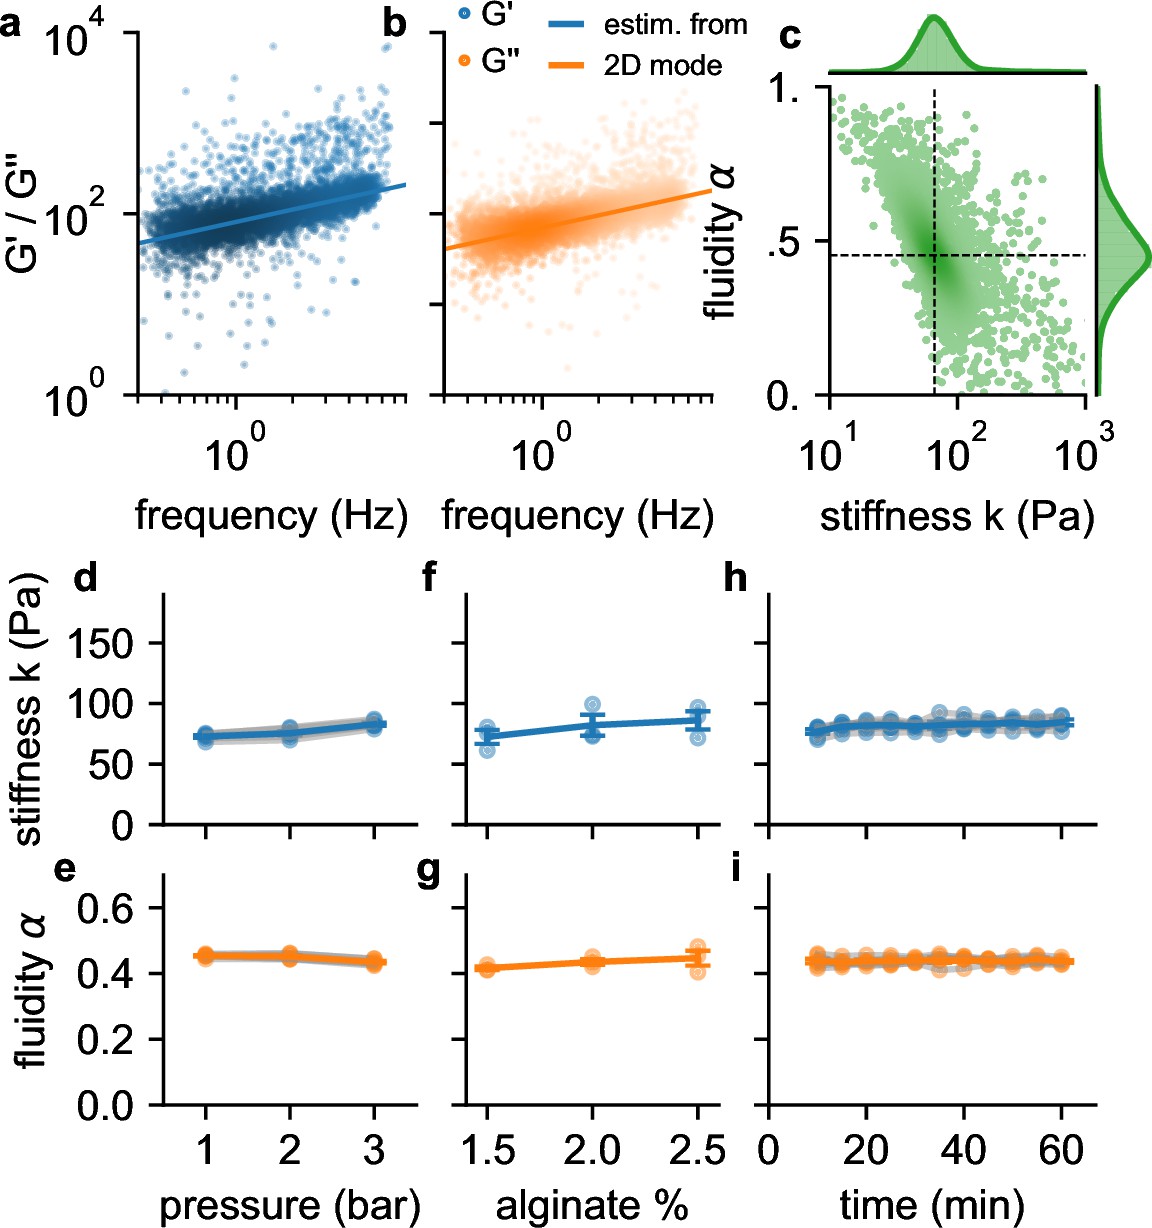
Frequency, pressure, suspension fluid, and time dependency of viscoelastic cell behavior.
a, (blue dots) b and (orange dots) of individual NIH-3T3 cells measured at 300 kPa. Lines are not a fit to the data but indicate the predicted behavior of (blue line) and (orange line) versus angular (tank-treading) frequency according to Equation 1 of a typical cell with stiffness and fluidity corresponding to the mode of the 2D histogram shown in c (the mode is indicated by the intersection of the dashed lines). c, Distribution of stiffness and fluidity α of the same cells as shown in a,b, dashed lines indicate the mode of the 2D histogram. Color coding shows 2D Gaussian kernel density estimation. Histograms show the probability density distributions of (top) and α (side) with Gaussian kernel density estimates (green shading). d, Stiffness of NIH-3T3 cells increases with pressure (blue lines and symbols indicate mean ± se, gray lines and transparent symbols indicate individual data from 6 independent measurements). e, Fluidity α (same cells as in d) remains constant for all measured pressures. f,g, Stiffness and fluidity show only a weak dependence on alginate concentration (measured at a pressure of 200 kPa, mean ± se (blue) from 3 independent measurements (gray)). h,i, and α of NIH-3T3 cells remain constant for at least 60 min after suspending them in a 2% alginate solution (measured at a pressure of 300 kPa, mean ± se (blue) from 5 independent measurements (gray)).
Figure 3—figure supplement 1
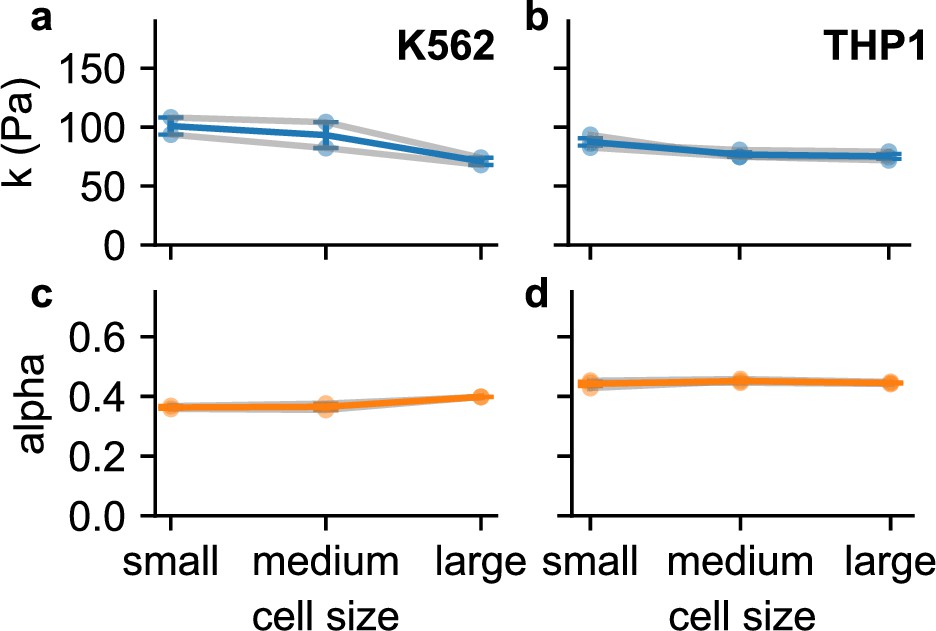
Stiffness and fluidity α of K562 cells (2 independent measurements, measured at a pressure of 3 bar) and THP1 cells (3 measurements, 2 bar) for different cell sizes.
Data a shown as mean ± se from 2 (or 3) independent measurements with n>1500 cells for each measurement. Cells are grouped according to their size (equivalent diameter of the undeformed cell) with an equal number of cells in each group (K564 small <6.7 µm, large >8.4 µm; THP1 small <9 µm, large >10 µm).
Figure 4 with 1 supplement
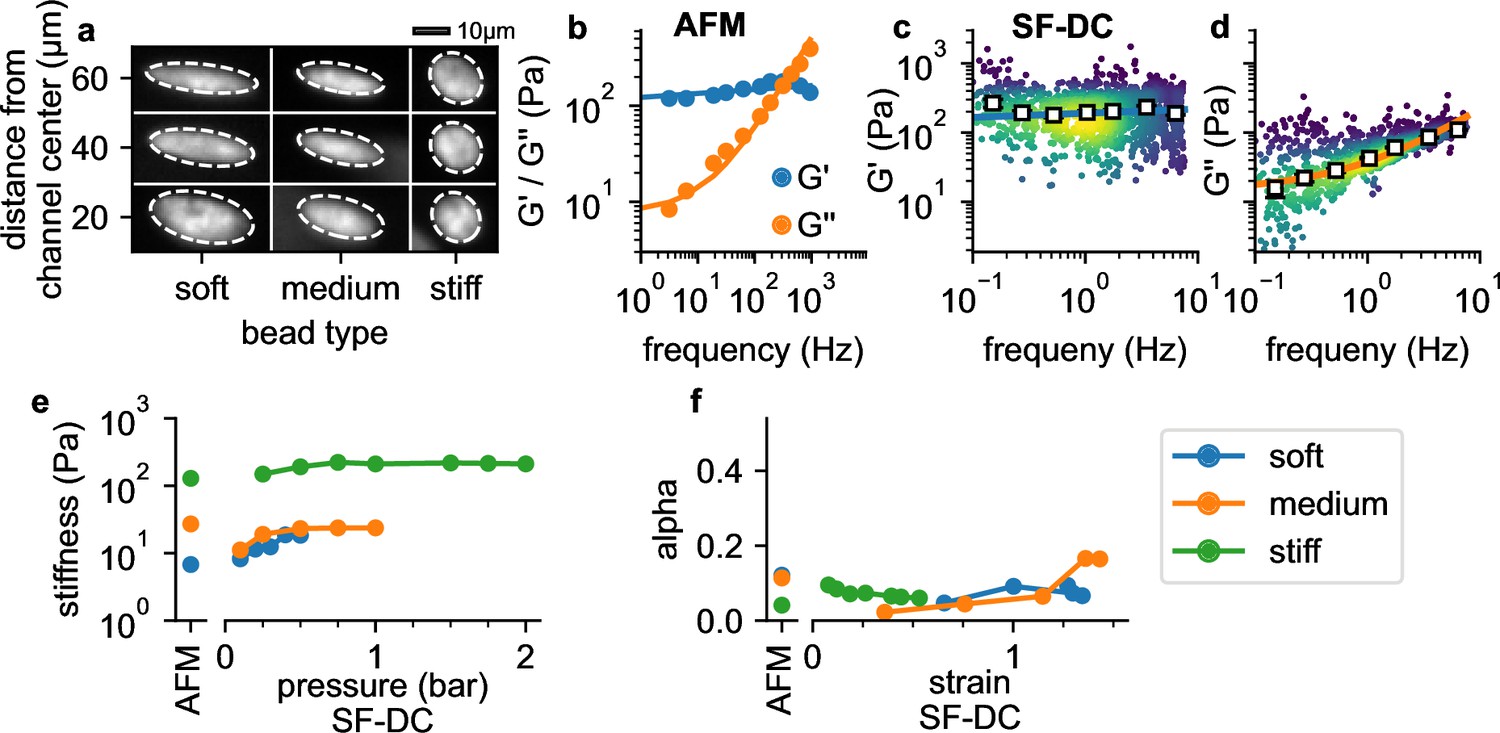
Validation with polyacrylamide beads.
(a) Deformation of PAAm beads with different acralymide-bisacrylamide total monomer concentrations (soft 3.9%, medium 5.9%, stiff 6.9%) at different positions in the channel. (b) AFM data (G' and G" versus frequency, mean values from 14 stiff PAAm beads (blue/orange circles), solid lines are the fit of Equation 2 to the data). G’ (c) and G” (d) for stiff beads at 2 bar. White squares indicate binned median values, blue and orange solid lines are the fit of Equation 2 to the data. (e) AFM-measured stiffness compared to the stiffness versus pressure measured with shear flow deformation cytometry (SF-DC) for differently stiff PAAm beads. (f) AFM-measured fluidity compared to fluidity versus strain measured with SF-DC for the same beads as in e.
Figure 4—figure supplement 1

Frequency-dependent shear modulus (blue) and loss modulus (orange) of polyacrylamide (PAAm) beads (soft: 3.9% (top row); medium: 5.9% (middle row); stiff: 6.9% (bottom row)) measured with atomic force microscopy (left column) and shear flow deformation cytometry (middle and right columns).
Lines show the fit of Equation 2 to the AFM data (left column, solid circles show mean values from beads), or to the shear flow cytometry data (middle and right column, each dot represents the data from one bead, colors represent Gaussian kernel density, white squares show the median values over equal-sized bins).
Figure 5
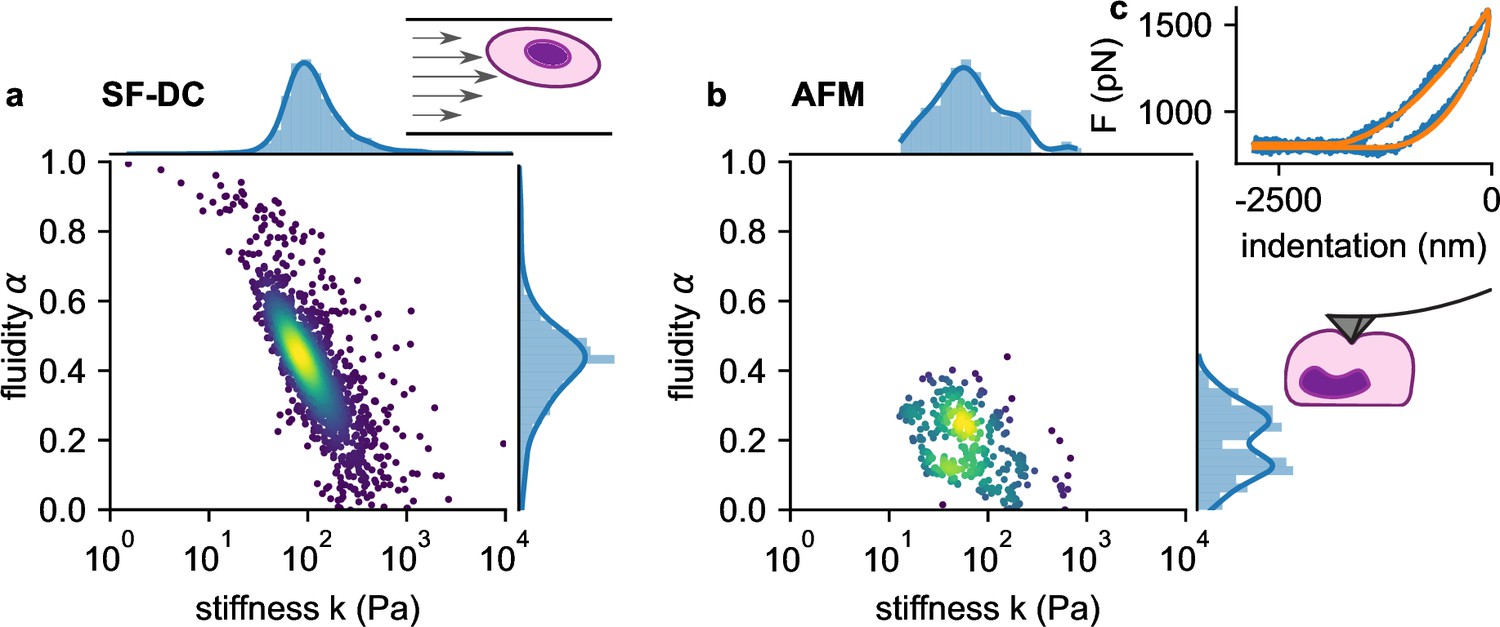
Comparison of viscoelastic cell properties measured with shear flow deformability cytometry (SF-DC) and AFM.
a. Stiffness versus fluidity α of THP1 cells (n=5000) measured with SF-DC at a pressure of 2 bar, 2% alginate solution. Colors represent Gaussian kernel density. Histograms show the probability density distributions of (top) and α (side) with Gaussian kernel density estimates (blue line). b, AFM measurements of THP1 cells. Each point represents and α from one cell, each obtained from the fit of Equation 24 to 3 or more force-indentation curves for each cell. c, Typical force-indentation curve (blue line) and fit with Equation 24 (orange line).
Figure 6

Dose response measurements.
a, Dose response curve of NIH-3T3 cells treated with different concentrations of latrunculin B. Stiffness is normalized to the stiffness of DMSO-treated cells, grey points indicate n=4 independent measurements for each concentration, each measurement is the average of a 0.5, 1, 2, and 3 bar measurement, boxplot indicate median (orange line) and 25 and 75 percentiles, whiskers indicate 5 and 95 percentiles. Blue line is the fit of the Hill-Langmuir-equation to the data, with an EC50 of 31.2 nM. b, Dose-response curve of HL 60 cells. Hill-Langmuir fit gives an EC50 value of 25.9 nM.
Figure 7
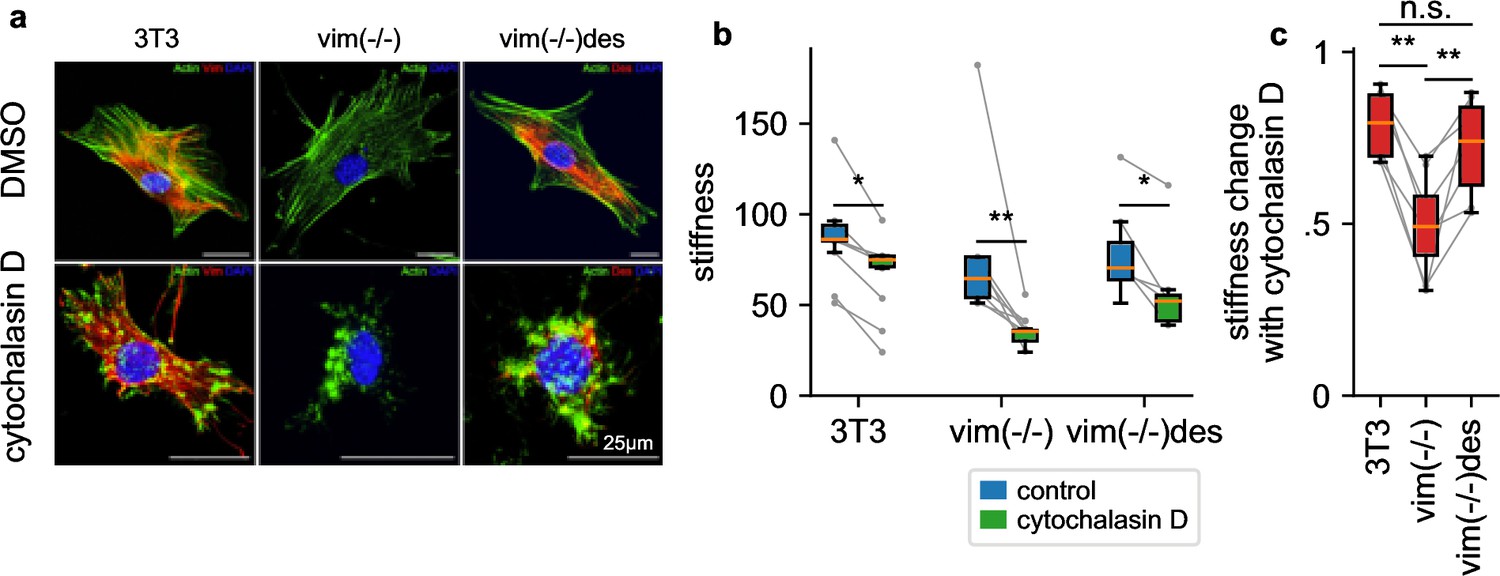
Influence of intermediate filaments.
a, NIH-3T3 MEFs, vimentin-knockout, and desmin-knockin MEFs in DMSO control conditions (upper row) and with cytochalasin D treatment (lower row). Actin (stained with phalloidin-Atto-488) is shown in green, desmin (stained with a rabbit-anti-desmin-CT1 antibody) in red, and the nucleus (stained with DAPI) in blue. b, Stiffness of DMSO control (blue box) and cytochalasin D treated cells (green box) (orange line: median, box: 25 and 75 percentile, whiskers: 5 and 95 percentile, gray points and lines connect mean values from independent measurements performed on the same day, with 1813 cells on average contributing to each data point). c, Stiffness change after treatment with cytochalasin D relative to DMSO control. (statistical significance: * p < 0.05, ** p < 0.01, two-sided Mann-Whitney-U test).
Figure 8
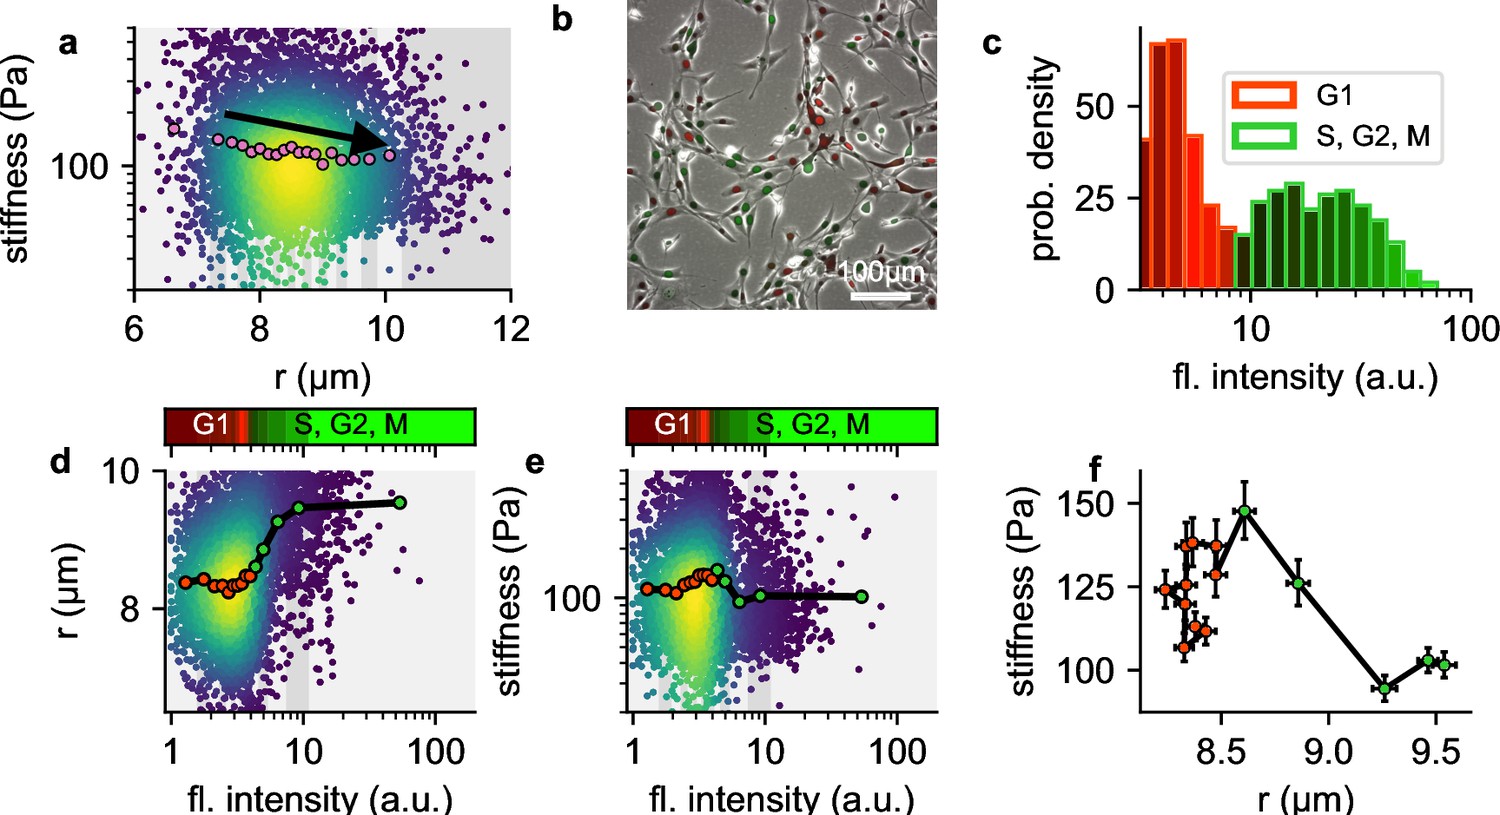
Influence of cell cycle.
a, Cell stiffness versus cell radius, each point corresponds to data from one cell, colors represent Gaussian kernel density, pink circles show median values over bins with equal cell count. Cell stiffness tends to decrease with increasing cell radius. b, Phase contrast and fluorescent image of Fucci-cell cycle indicator-transfected NIH-3T3 cells. Cells in G1 phase show low green and high red fluorescence intensities, cells in S, G2, or M phase show high green and low red fluorescence intensities. c, Histogram of green fluorescence intensities of Fucci-cell transfected NIH-3T3 cells. Bar colors reflect the RGB-colormap of the red and green channel intensities averaged over all cells within a bin. Accordingly, the cell cycle can be deduced from the green intensity alone. d, Cell radius versus green fluorescent intensity. Each point corresponds to data from one cell, colors represent Gaussian kernel density, circles show median values over bins containing an equal number (∼100) of cells. Colorbar represents the RGB-colormap of the red and green intensities of the cells before harvesting, mapped onto the green fluorescent intensity after harvesting measured in the shear flow cytometer. Cell radius increases after cells exit G1 phase. e, Cell stiffness versus green fluorescent intensity. Cells stiffness increases during G1 phase and decreases after entering S phase. f, Cell stiffness versus cell radius; data points correspond the the median values in d and e, red color designates cells in G1 phase, green color designates cells in S, G2 or early M phase. During G phase, cells increase their stiffness while maintaining their radius. After entering S phase, cells increase their radius while their stiffness decreases.
Videos
Video 1
Tank-treading motion of cells in a fluid shear flow.
Cells are imaged with a frame rate of 500 Hz during their transit through the field-of-view. A smaller image of the cell is cropped from a moving reference frame so that the cell appears stationary. Images are high-pass filtered and contrast-enhanced to visualize cell-internal structures.
Video 2
Protocols and instructions for shear flow deformation cytometry.
The video explains step-by-step how to prepare cells for measurements, how to set up the measurement device, and how to operate the data acquisition software.
Tables
Table 1
Cell line-specific composition of culture medium.
| cells | Base medium | serum | PenStrep | GlutaMAX | Geneticin | Sodium pyruvate | MEM NEAA | HEPES |
|---|---|---|---|---|---|---|---|---|
| NIH-3T3 | DMEM | 10% BCS | 1% | - | - | - | - | - |
| vim(-/-) | DMEM | 10% FCS | 1% | 1% | - | - | - | - |
| vim(-/-)des | DMEM | 10% FCS | 1% | 1% | 1 mg/ml | - | - | - |
| HL60 | RPMI | 10% FCS | 1% | - | - | - | - | - |
| THP-1 | RPMI | 10% FCS | 1% | - | - | 1mM | 1% | 10mM |
-
All % values are (v/v)%. NIH-3T3: mouse embryonic fibroblast cells (No. CRL-1658, American Type Culture Collection); vim(-/-): mouse embryonic fibroblast cells derived from vimentin(-/-) mice (kindly provided by Prof. Dr. T. M. Magin, University of Bonn) and further subcloned to eliminate desmin- or keratin-expressing cells, as described in Gregor et al., 2014; vim(-/-)des: vim(-/-) MEFs re-expressing wild-type desmin, generated as described in Herrmann et al., 2020; HL60: human leukemic lymphoblast cells (No. CCL-240, American Type Culture Collection); THP-1: monocytic cells (No. TIB-202, American Type Culture Collection); DMEM: Dulbecco’s Modified Eagle Medium (Gibco 11995065); RPMI: Roswell Park Memorial Institute 1640 Medium (Gibco 21875034); PenStrep: 100 x penicillin-streptomycin-glutamin solution (Gibco 10378016); GlutaMAX: L-alanine-L-glutamine supplement (Gibco 35050–038); Geneticin (Gibco 10131027); BCS: bovine calf serum (Sigma 12,133 C); FCS: fetal calf serum (Sigma F7524); MEM NEAA: 100 x non-essential amino acid solution without L-glutamine (Gibco 11140–035); HEPES (Gibco 15630–056); Sodium pyruvate (Gibco 11360–039).
Additional files
Download links
A two-part list of links to download the article, or parts of the article, in various formats.
Downloads (link to download the article as PDF)
Open citations (links to open the citations from this article in various online reference manager services)
Cite this article (links to download the citations from this article in formats compatible with various reference manager tools)
Viscoelastic properties of suspended cells measured with shear flow deformation cytometry
eLife 11:e78823.
https://doi.org/10.7554/eLife.78823


