Pre-existing chromosomal polymorphisms in pathogenic E. coli potentiate the evolution of resistance to a last-resort antibiotic
- Department of Zoology, University of Oxford, United Kingdom
- Fujian Provincial Key Laboratory of Soil Environmental Health and Regulation, College of Resources and Environment, Fujian Agriculture and Forestry University, China
Figures
Figure 1
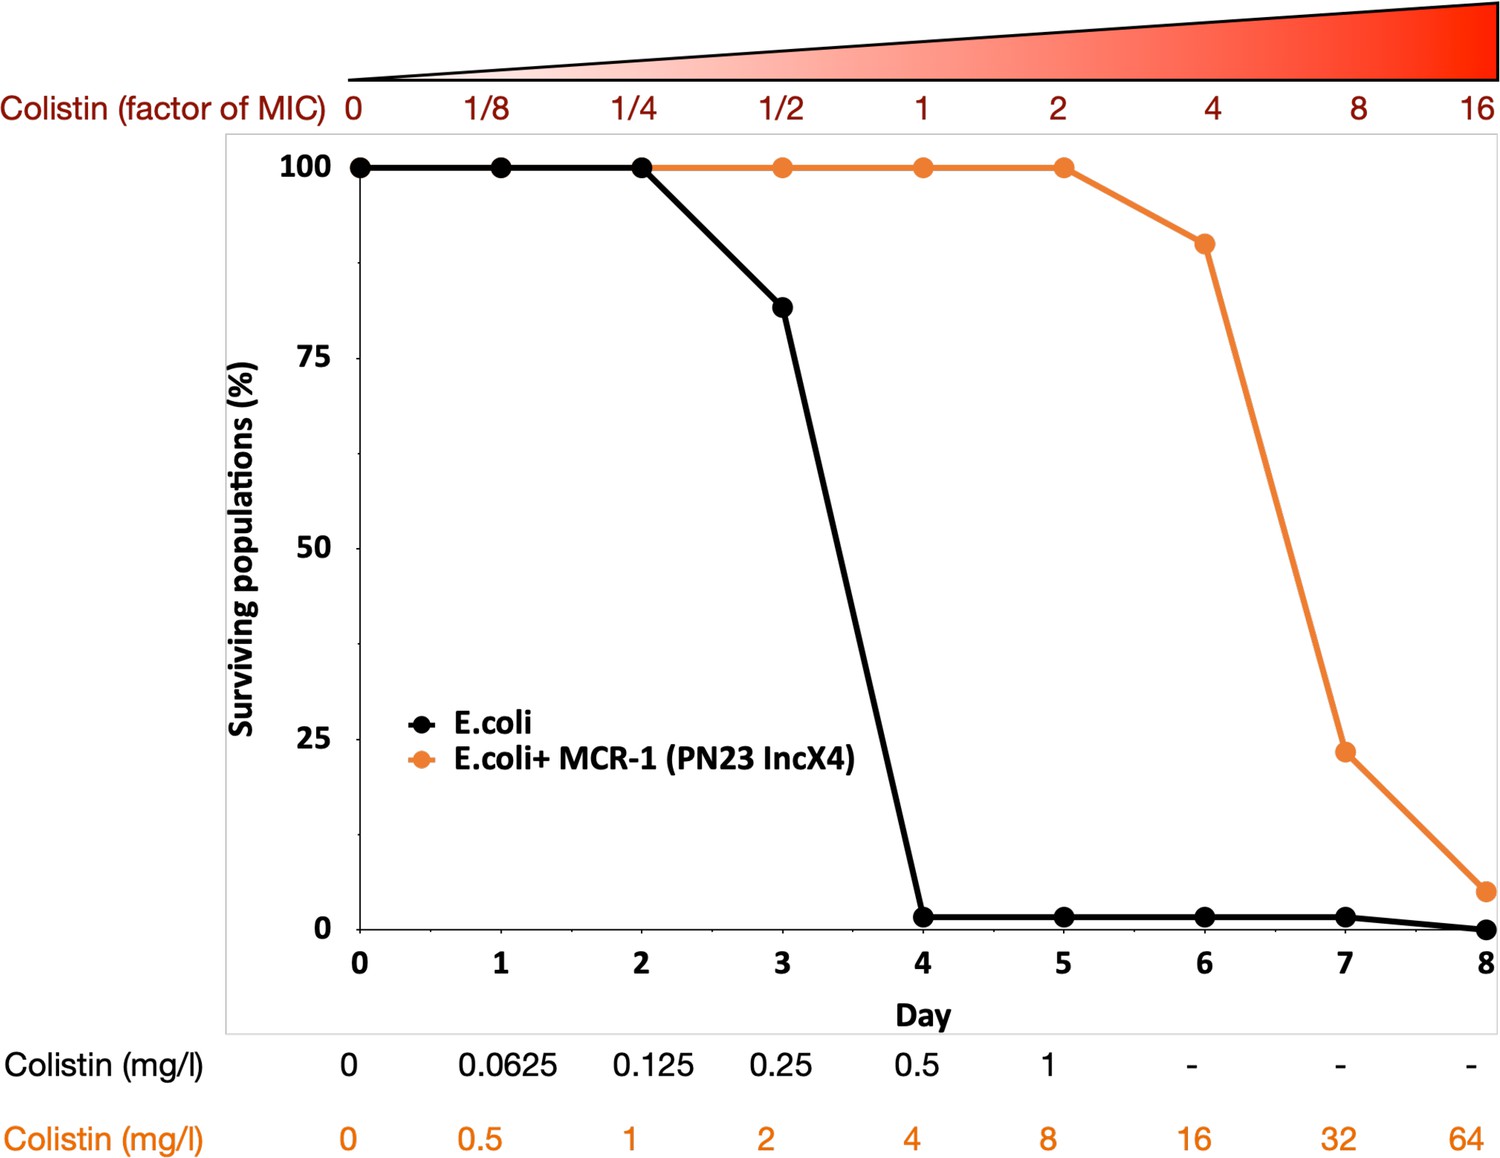
MCR-1 carrying bacterial populations (MCREC) show accelerated evolution of high-level colistin resistance.
The plot shows the survival of wild-type and MCR-1 carrying populations of E. coli (n = 120) populations for E. coli and n = 60 populations for E. coli + MCR-1 (PN23 IncX4) over time under increasing selection for colistin resistance. MCR-1 carrying populations showed increased survival, which is indicative of higher colistin evolvability. The numbers shown at the bottom represent the colistin concentration for wild-type E. coli (black) and for E. coli with MCR-1 (orange).
Figure 2 with 4 supplements
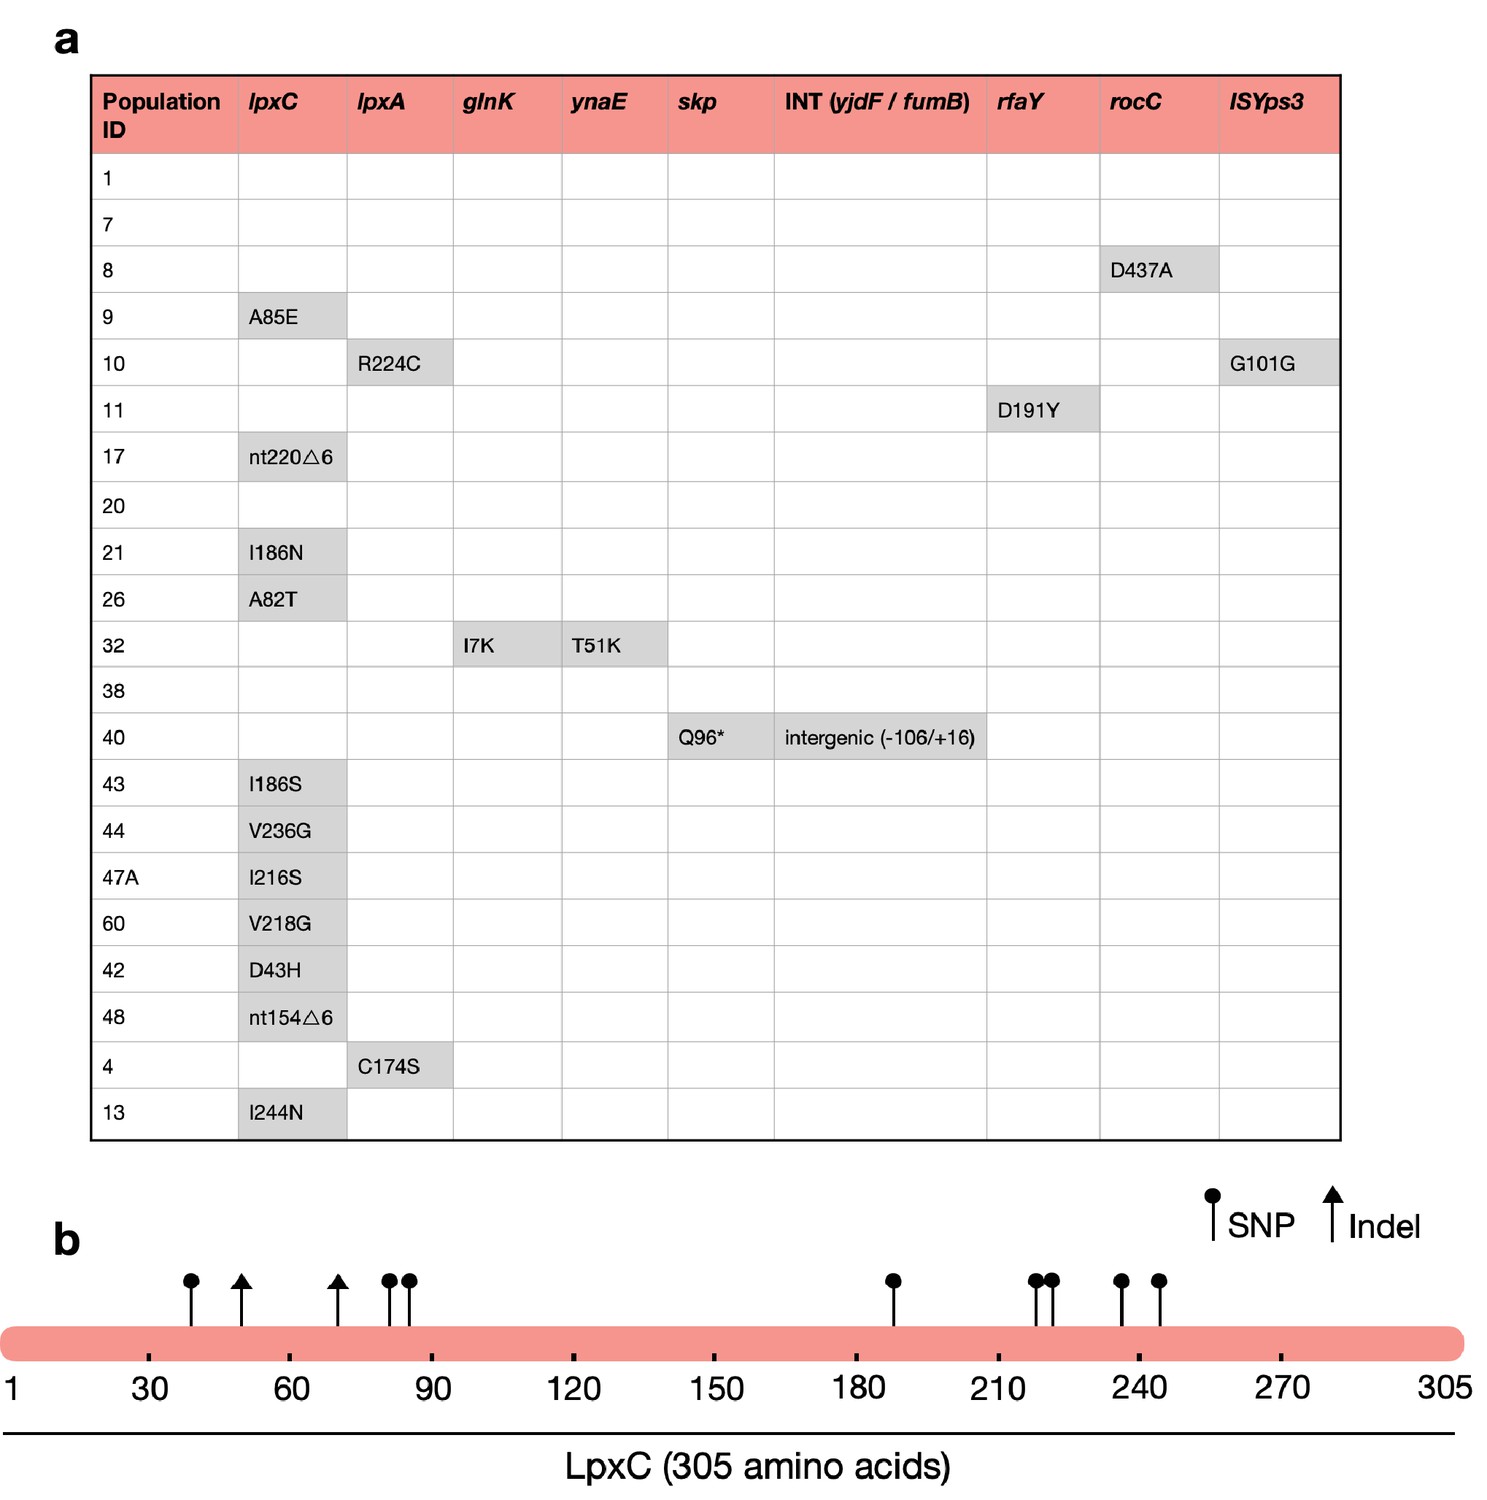
The majority of MCREC clones show mutations in LpxC.
(a) List of mutations identified in colistin-evolved MCR-1-positive clones. (b) Figure shows the mutations identified in LpxC. LpxC positions 79, 238, 242, and 246 are important for Zn binding and LpxC activity (Jackman et al., 2001). nt – nucleotide; △ – deletion; SNP – single-nucleotide polymorphism; Indel – insertions/deletions of nucleotides.
Figure 2—figure supplement 1
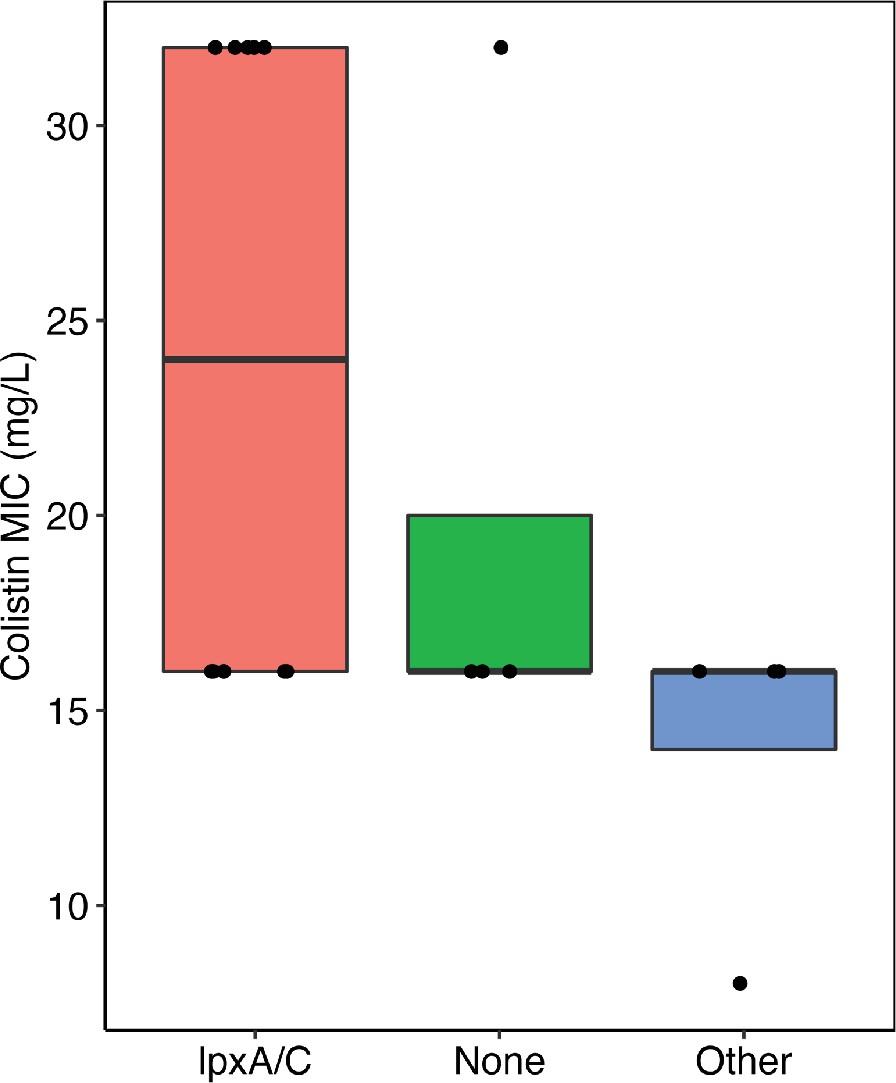
Figure comparing the colistin resistance of clones with mutations in lpxA/C, other targets, and no mutations (i.e. none).
There was no significant difference between the groups (Wilcoxon rank-sum test). Each clone represents one data point.
Figure 2—figure supplement 2
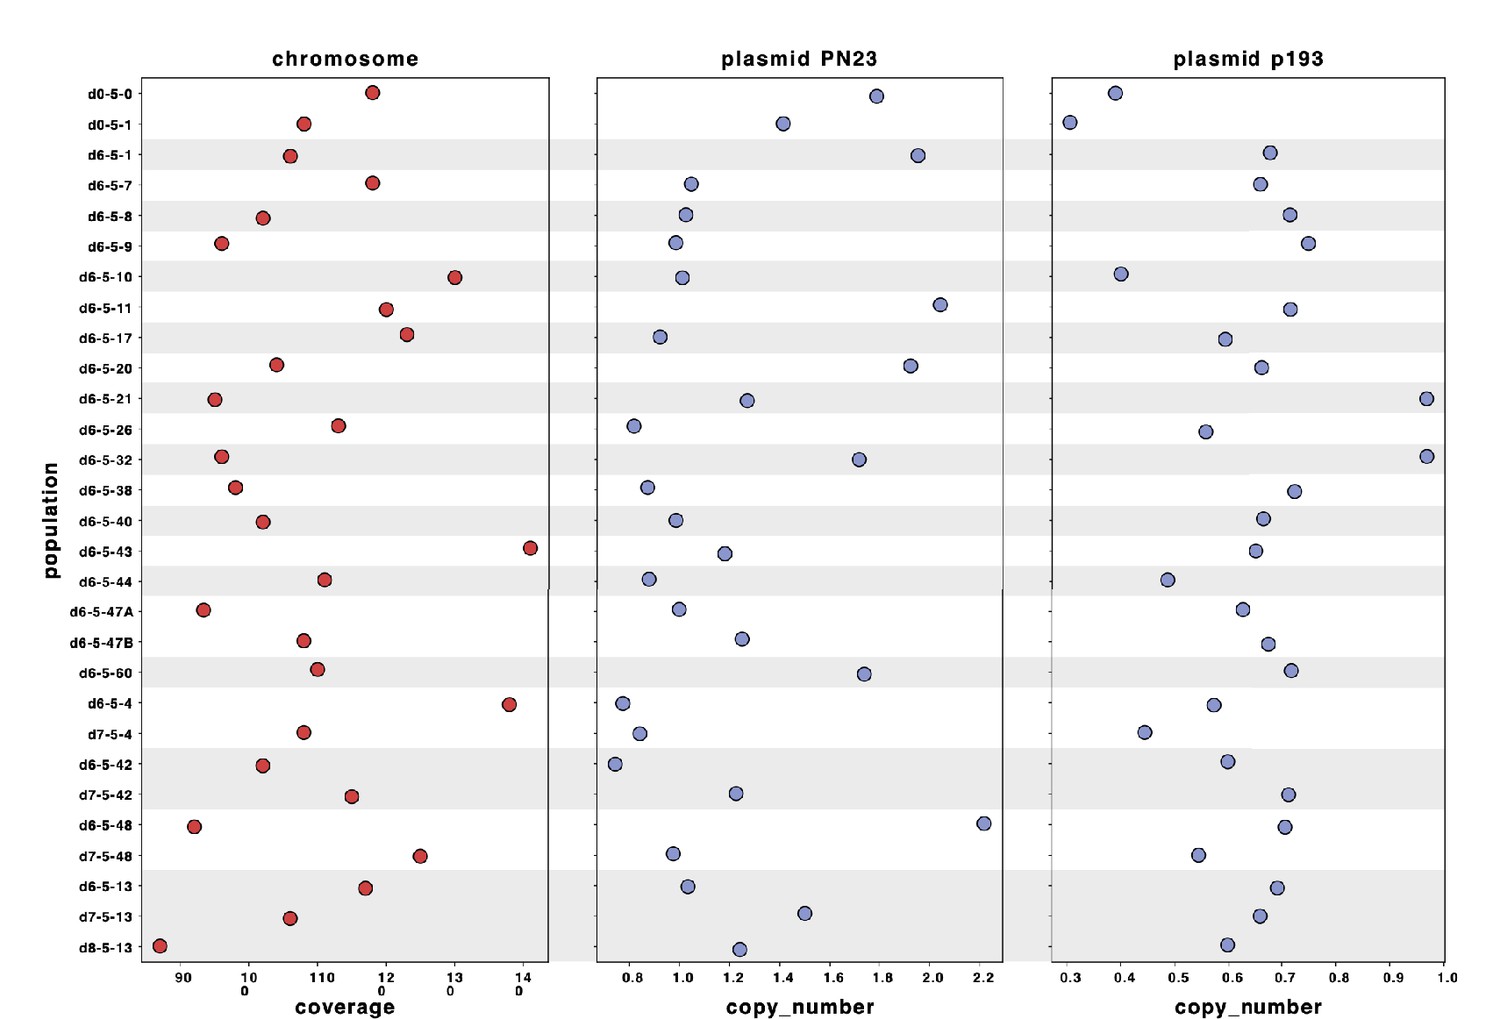
Sequencing reads of each population were mapped to the hybrid assembly of reference d0-5-1.
The sequence of plasmid PN23 was assembled in a single sequence, and the sequence of plasmid p193 was distributed in three contigs. Plasmid copy number for each population was calculated by dividing the average depth of coverage of each plasmid by the depth of coverage of the chromosome.
Figure 2—figure supplement 3
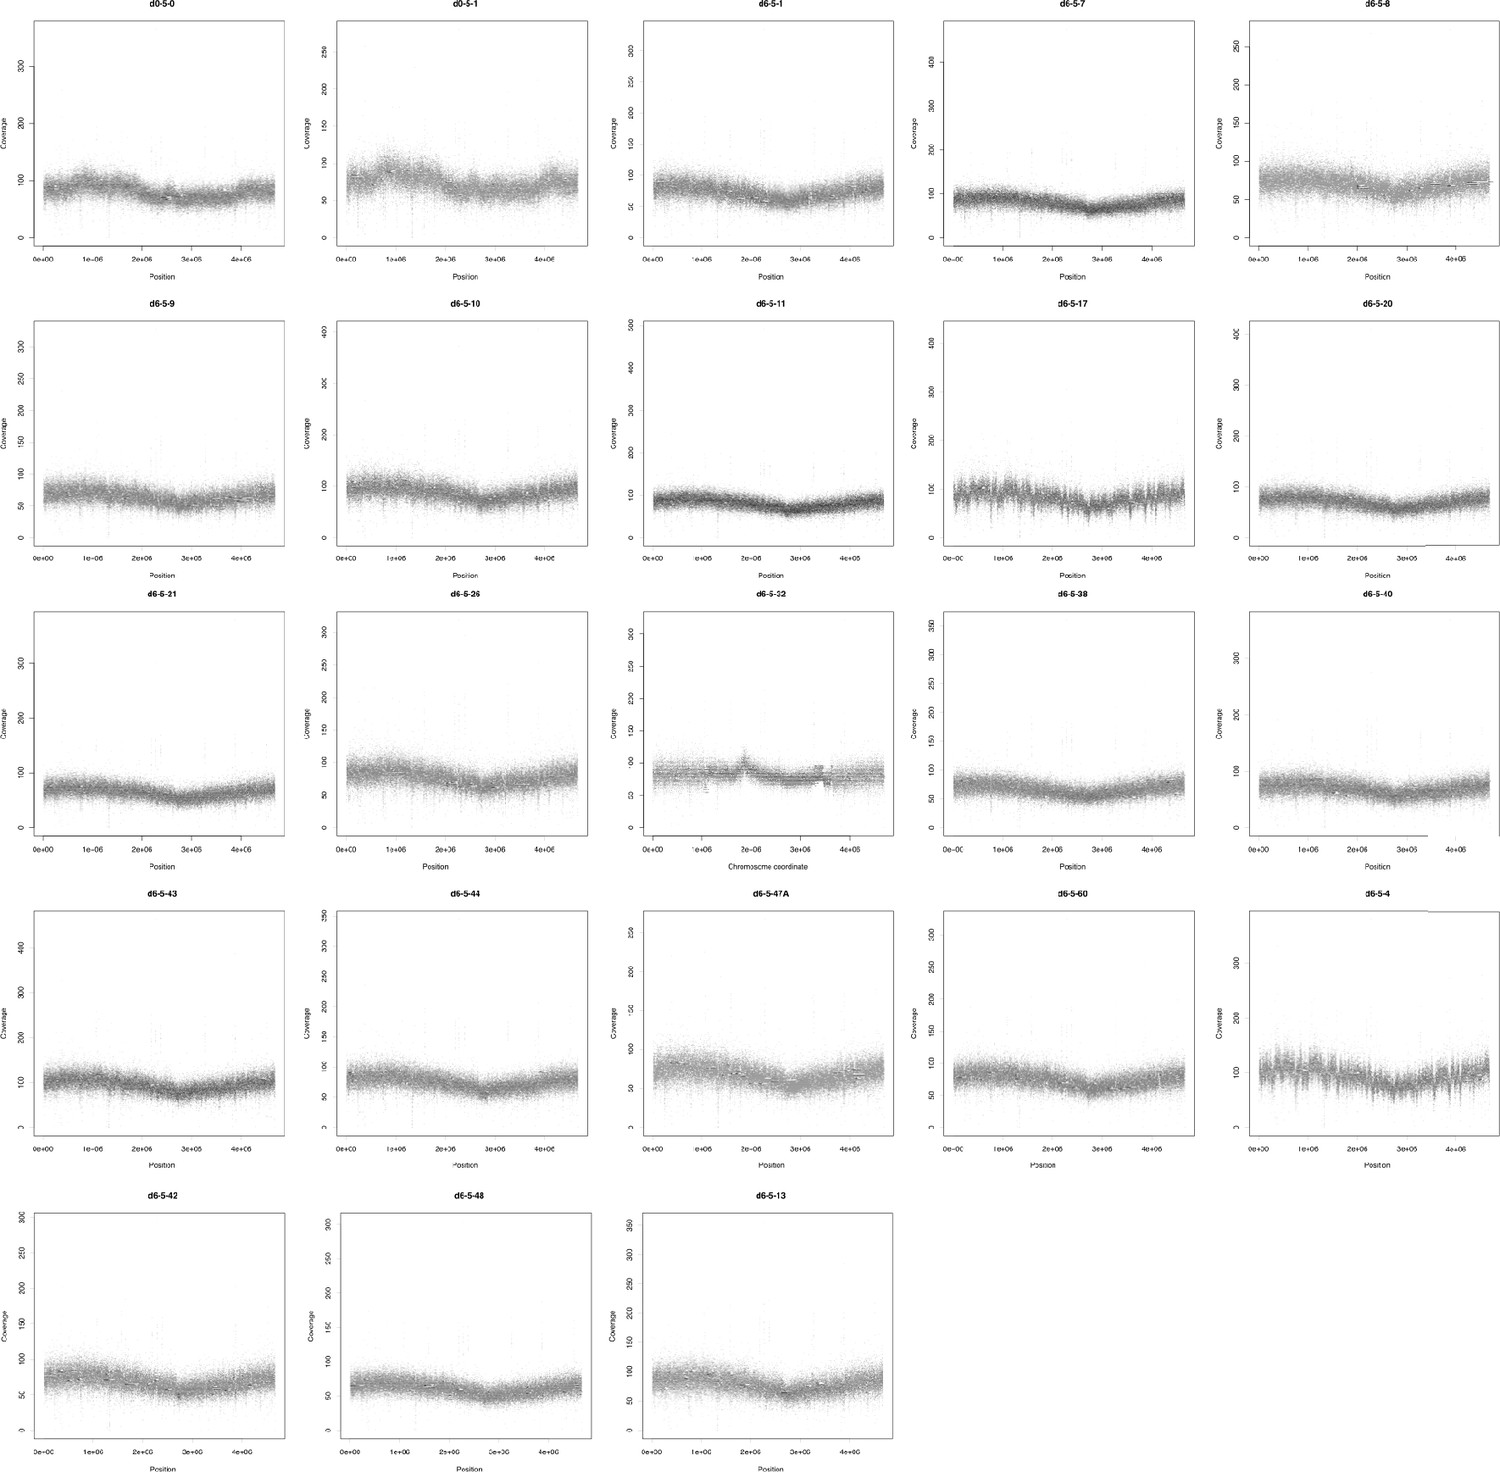
Sequencing coverage (y-axis) of each coding region (black dots) in the chromosome of each population.
x-Axis represents the position of each CDS in the respective replicon. Coverage was normalized given its GC content and calculated using CNOGpro (Brynildsrud et al., 2015) and the d0-5-1 reference chromosome sequence.
Figure 2—figure supplement 4
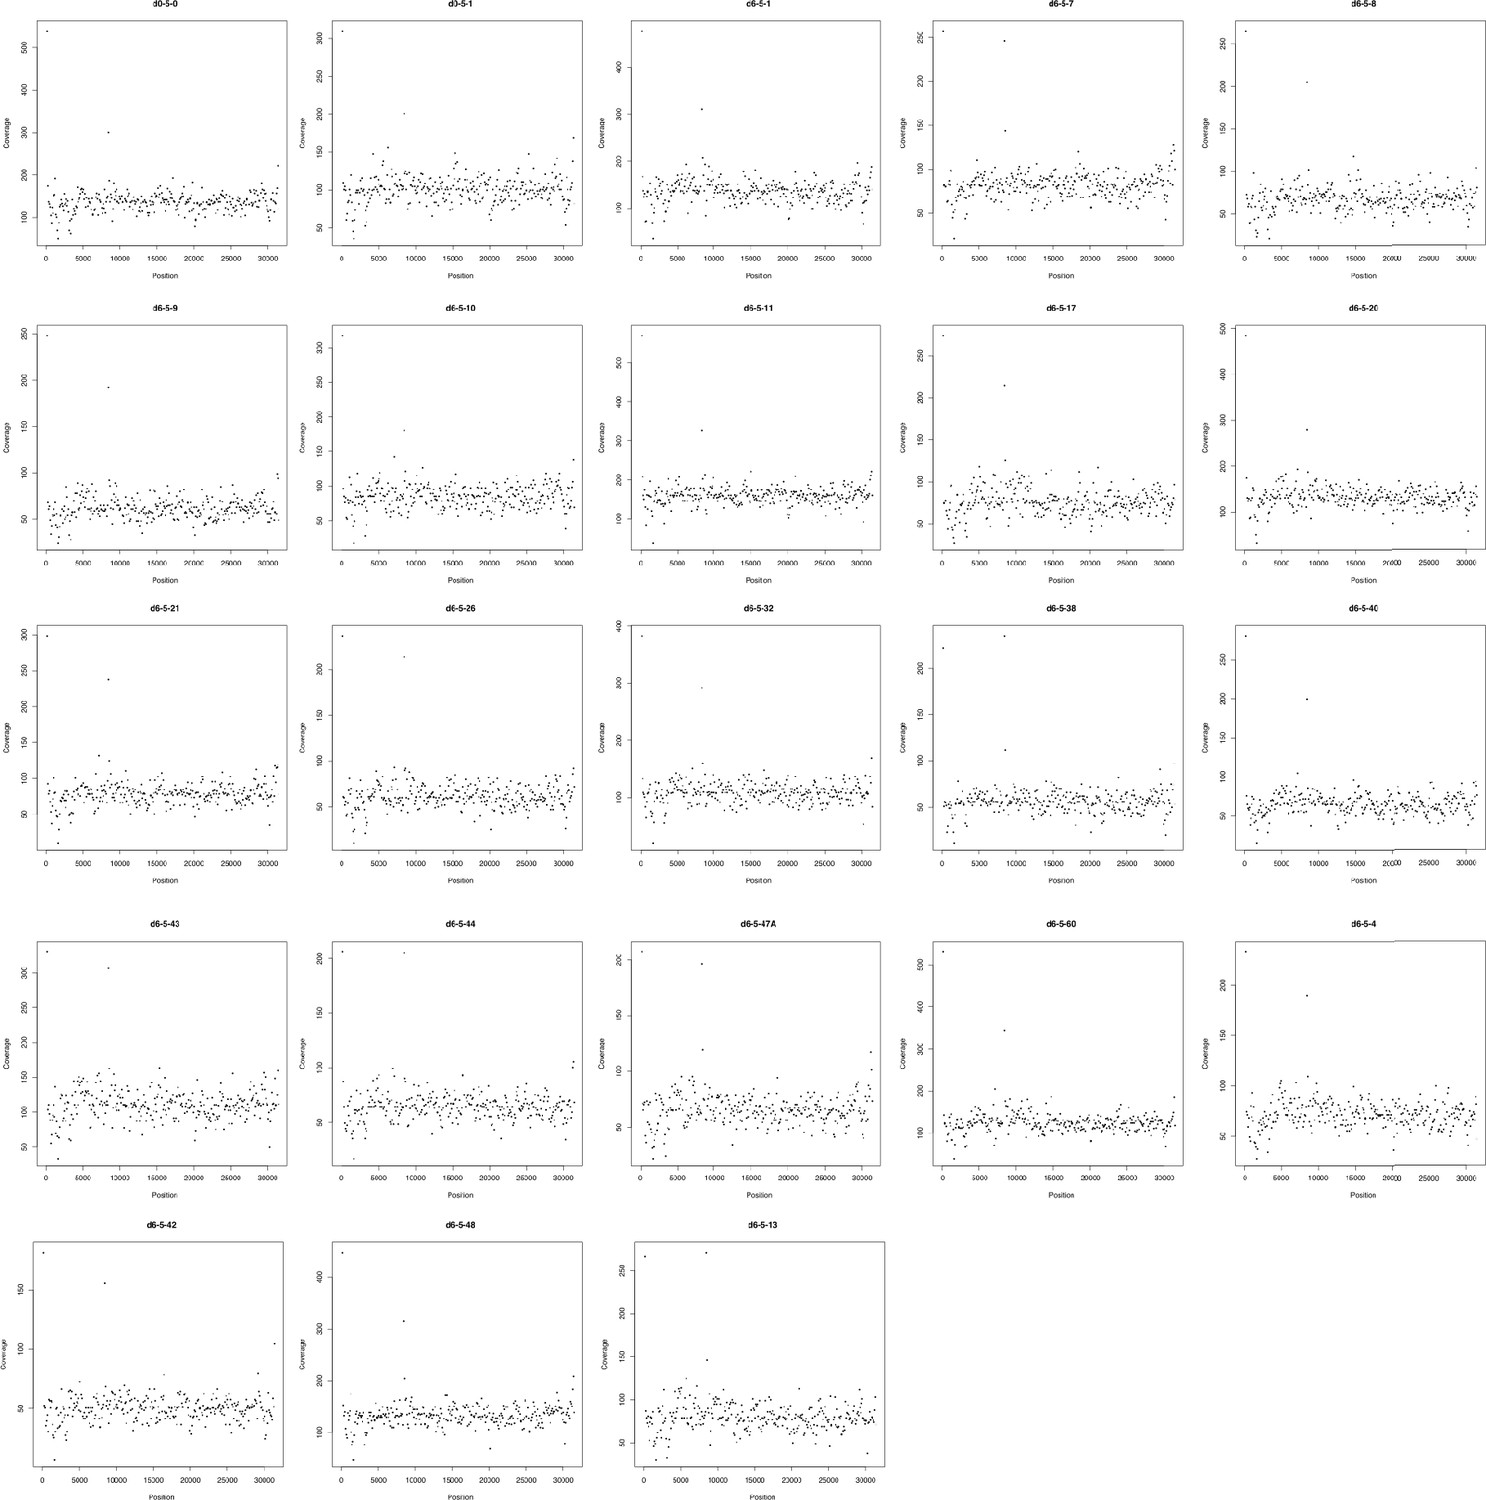
Sequencing coverage (y-axis) of each coding region (black dot) in the PN23 plasmid of each population.
x-Axis represents the position of each CDS in the respective replicon. Coverage was normalized given its GC content and calculated using CNOGpro (Brynildsrud et al., 2015) and the d0-5-1 reference PN23 plasmid sequence.
Figure 3
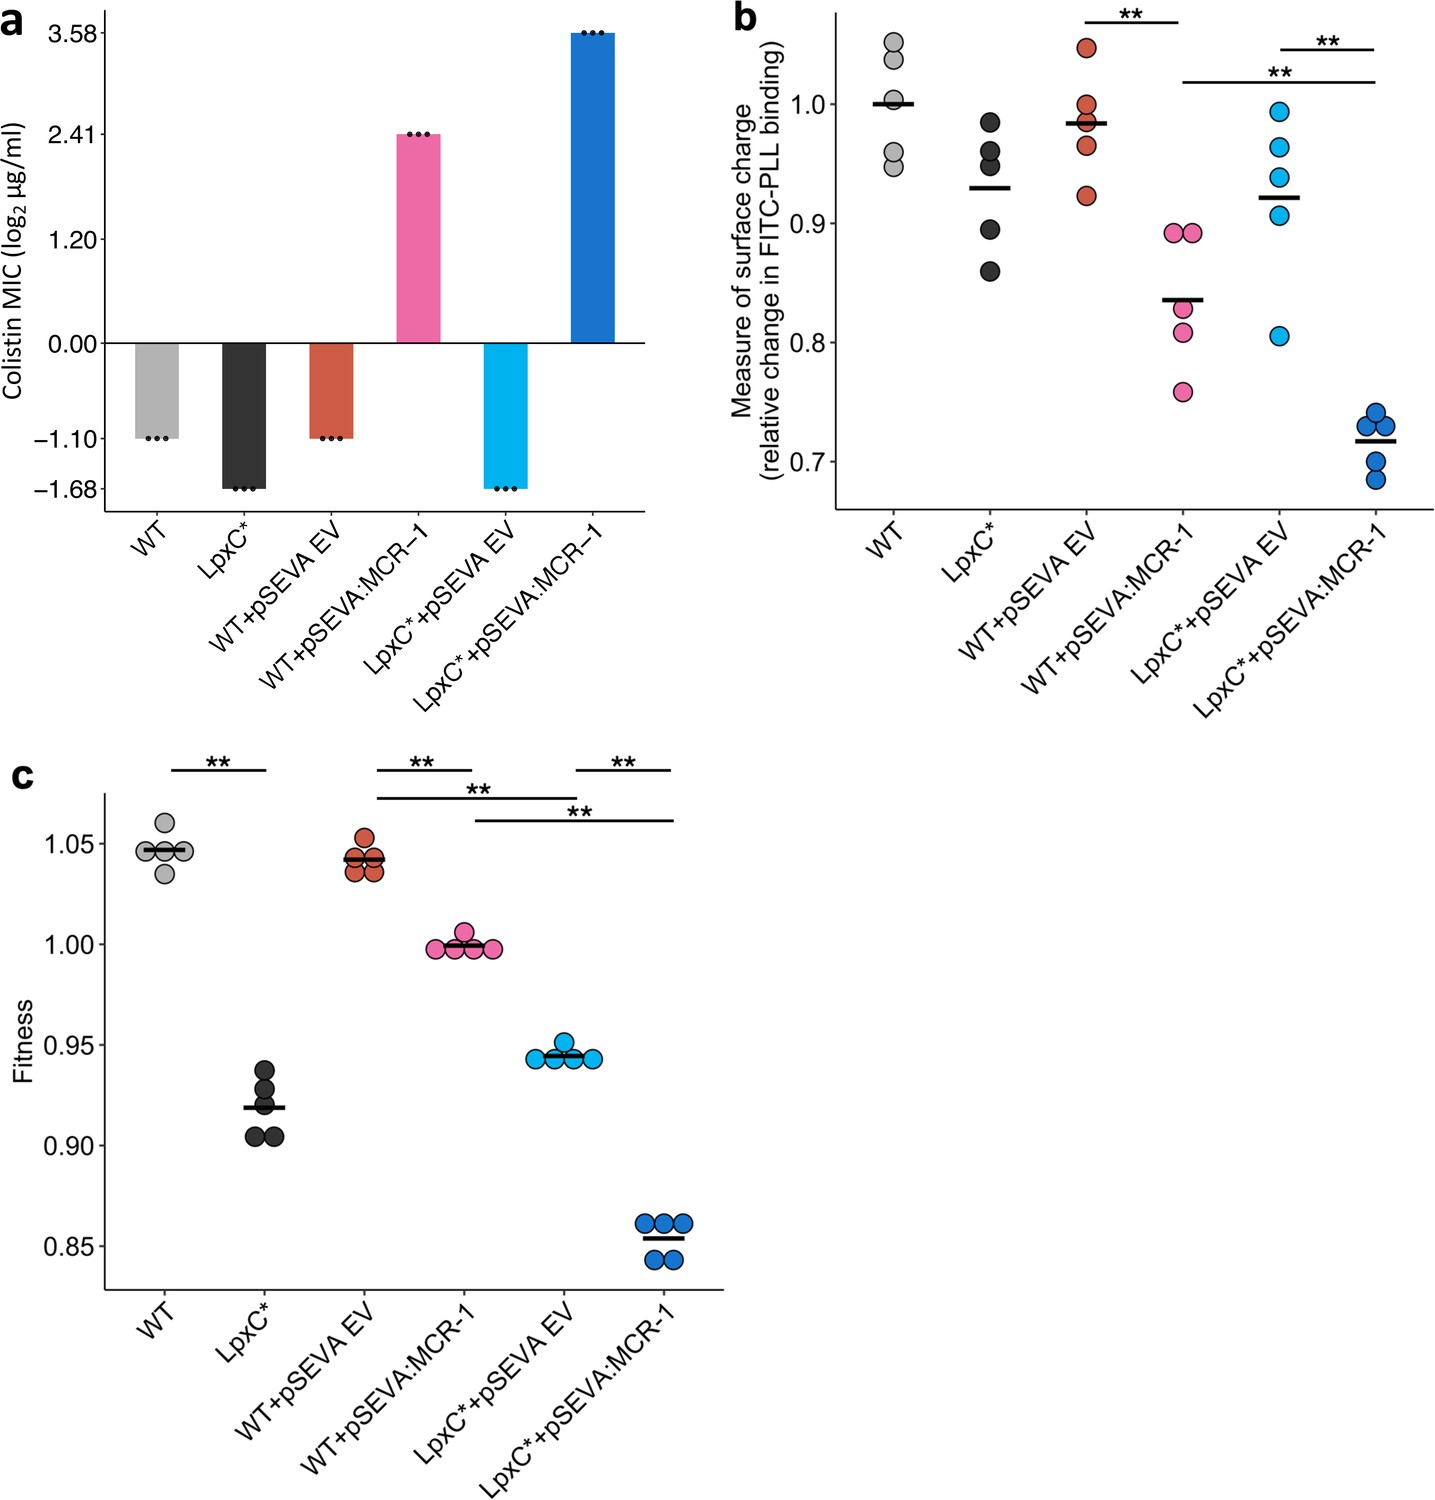
Effect of the lpxC mutation (lpxC*), with and without MCR-1, on bacterial susceptibility to colistin resistance (a), membrane surface charge (b), and fitness (c).
(a) Bacterial susceptibility to colistin was tested by measuring minimum inhibitory concentration (MIC) (n = 3 biological replicates per strain). (b) Relative change in membrane surface charge was measured by using fluorescein isothiocyanate-labelled poly-L-lysine (FITC-PLL)-binding assay (n = 5 biological replicates/strain) (see Methods). The changes were compared to wild-type (WT) control strain. (c) Bacterial fitness was measured using in vitro competition assay where strains were competed against a tester E. coli strain carrying a chromosomally integrated GFP (n = 5 biological replicates per competition). Statistical significance was determined by pairwise comparisons using the Wilcoxon rank-sum test, and double asterisks show differences with a p value <0.01. Central horizontal lines represent mean values of biological replicates. WT – wild type; EV – empty vector.
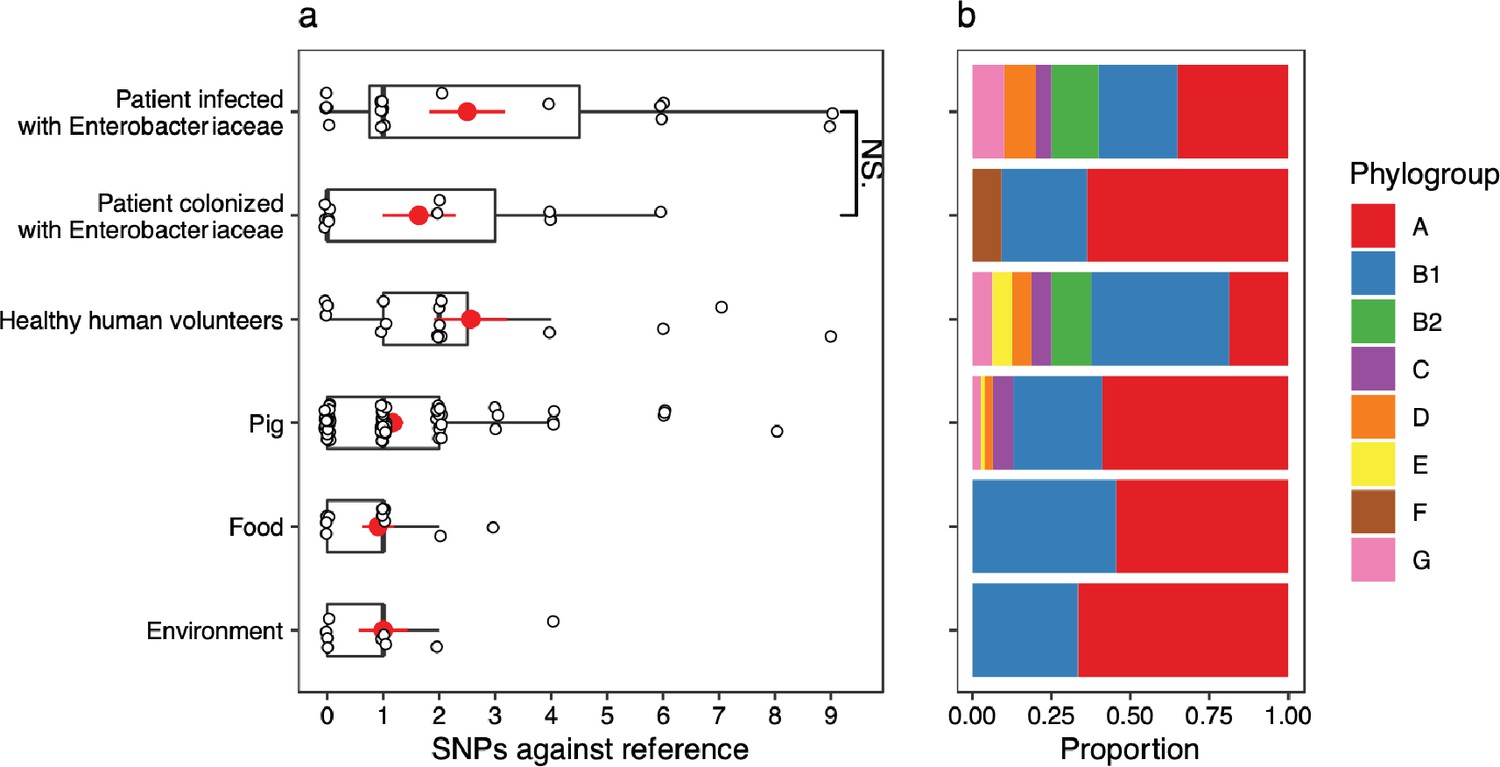
Figure 4 with 1 supplement

mcr-1-positive isolates from patients infected with Enterobacteriaceae have more mutations in lpxC compared to isolates from other sources.
Data shown are from n = 673 unfiltered MCR-1 plasmid carrying isolates collected in 2016 by Shen et al., 2020. (a) Single-nucleotide polymorphisms (SNPs) in lpxC determined by the alignment of the lpxC sequence for each assembled isolate against the reference lpxC sequence from E. coli MG1655 (NC_000913.3:106557–107474). Mean values (± standard error) are shown by red points (lines). Isolates from patients infected with Enterobacteriaceae have significantly more SNPs than other sources, for example, those from patients only colonized with Enterobacteriaceae (Wilcoxon rank-sum test, W = 1150, p < 0.001). ***p < 0.001. However, this difference is associated with (b) the population structure of E. coli, with a greater proportion of phylogroups B2 and D in isolates from infected patients. The same plot for filtered isolates (Figure 4—figure supplement 1) showed a similar pattern although the comparison between patients infected vs. colonized was not significant.
Figure 4—figure supplement 1
A version of Figure 4 showing single-nucleotide polymorphisms (SNPs) in lpxC in the Shen dataset with filtering criteria for isolate assemblies applied (see Methods).
Figure 5 with 2 supplements
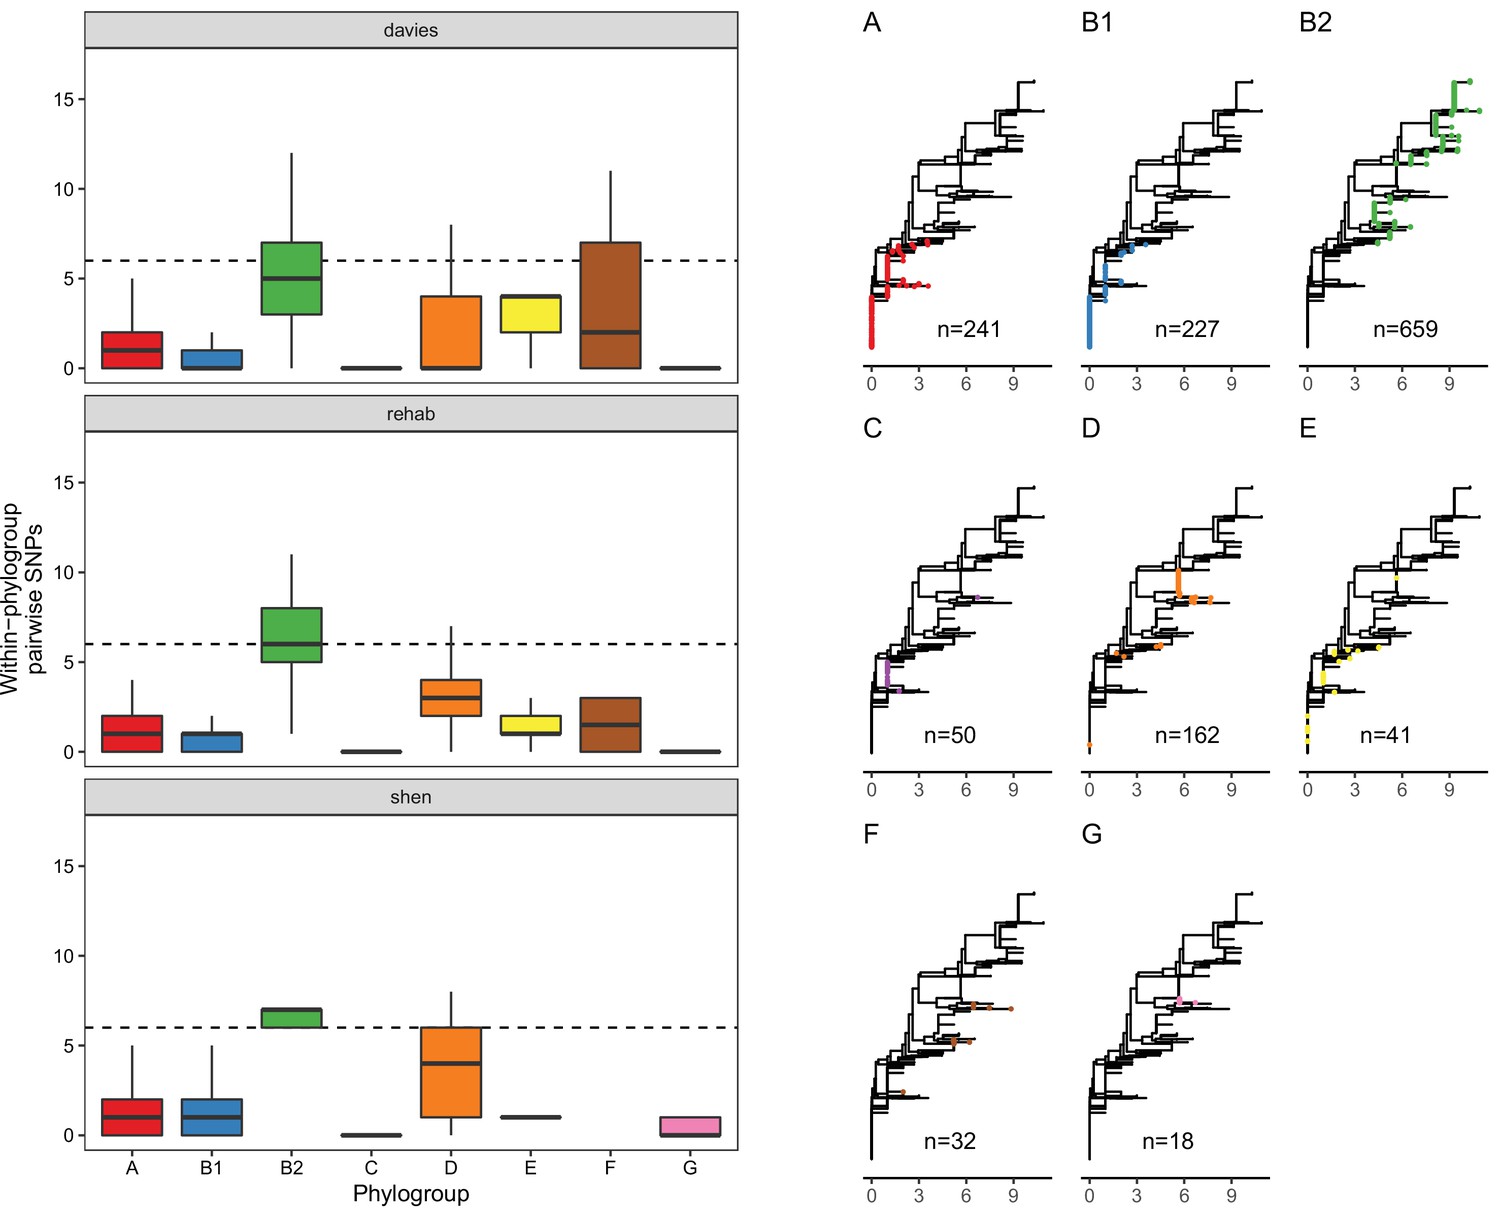
LpxC diversity in main E. coli phylogroups.
The diversity of lpxC within phylogroup B2 is greater across three different datasets (called Davies et al., 2020, Shaw et al., 2021, Shen et al., 2020) (see Methods for details). Left: boxplots of the pairwise single-nucleotide polymorphisms (SNPs) between lpxC sequences of the same phylogroup within different studies. Dashed line shows the median pairwise distance (six SNPs) between isolates of different phylogroups. Right: a midpoint-rooted neighbour-joining tree of lpxC diversity, with coloured tips in each panel showing the location of isolates from each main phylogroup (A-G). Assembled isolates were filtered to only include high-quality assemblies (see Methods).
Figure 5—figure supplement 1
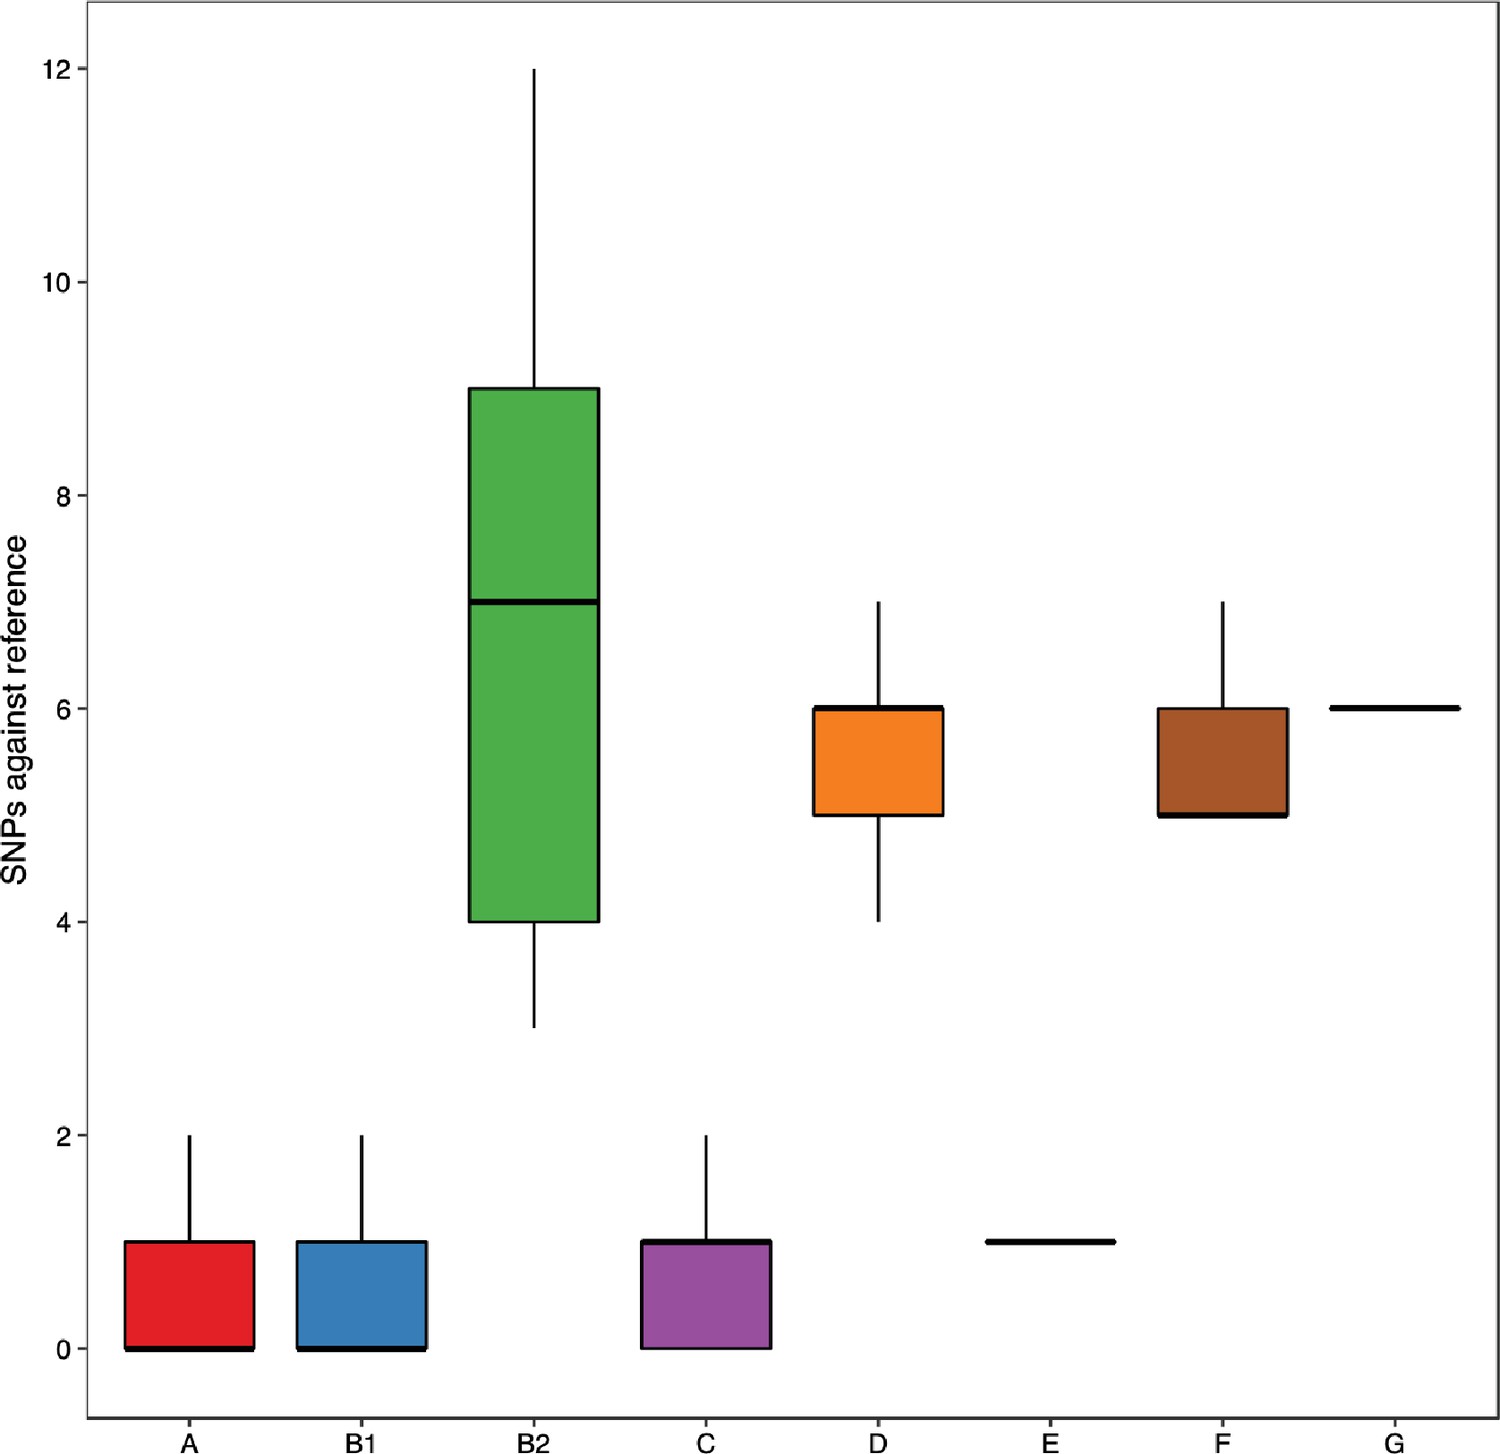
Analysing NCBI RefSeq complete assemblies shows that B2 isolates have more single-nucleotide polymorphisms (SNPs) relative to the reference lpxC than other phylogroups, reproducing the finding from the three assembled datasets (Figure 5).
Figure 5—figure supplement 2
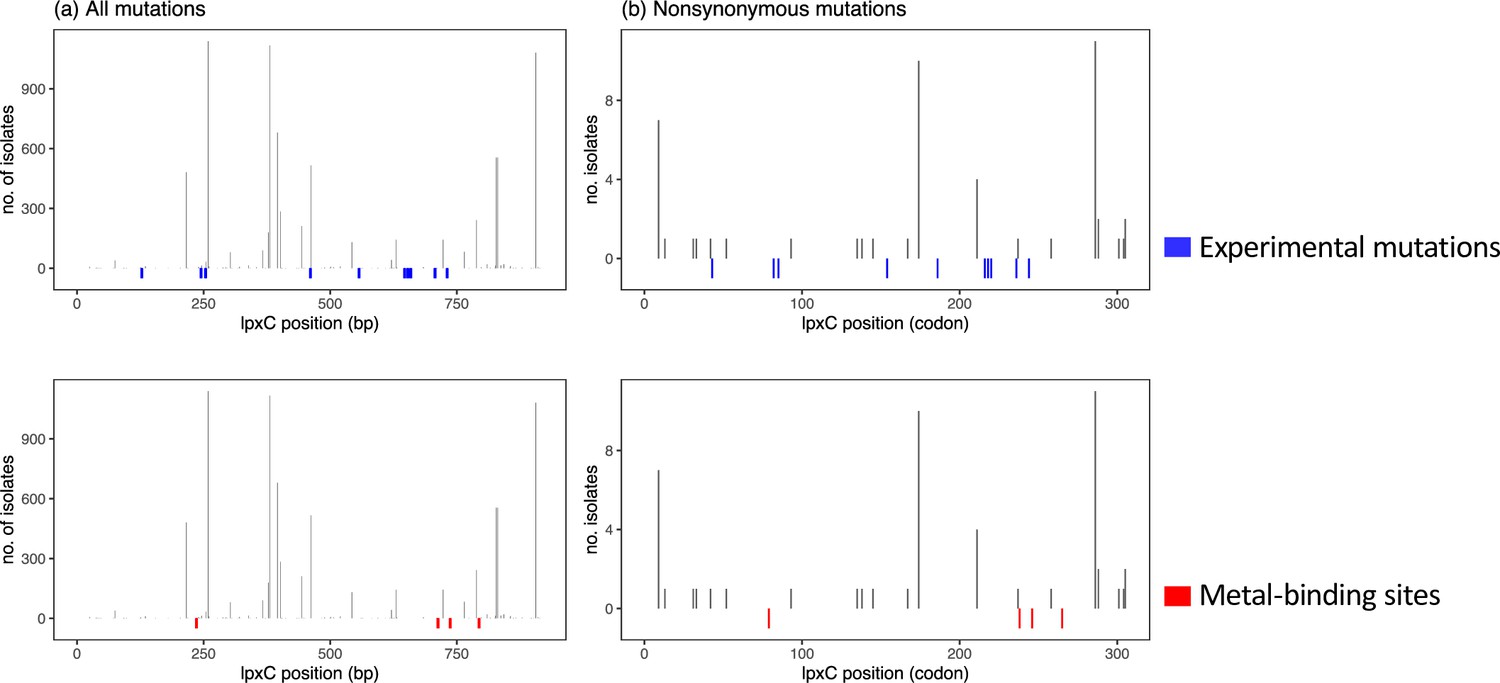
Correlation between the sites mutated in public genomes and the experimentally mutated sites (blue), as well as the four sites involved in metal binding of lpxC (red).
Additional files
-
Supplementary file 1
Colistin minimum inhibitory concentration (MIC) of the evolved populations.
- https://cdn.elifesciences.org/articles/78834/elife-78834-supp1-v1.xlsx
-
Supplementary file 2
Primers used in this study.
- https://cdn.elifesciences.org/articles/78834/elife-78834-supp2-v1.xlsx
-
Supplementary file 3
Accessions, phylogroup, and single-nucleotide polymorphisms (SNPs) in lpxC gene in E. coli isolates.
- https://cdn.elifesciences.org/articles/78834/elife-78834-supp3-v1.xlsx
-
MDAR checklist
- https://cdn.elifesciences.org/articles/78834/elife-78834-mdarchecklist1-v1.pdf
Download links
A two-part list of links to download the article, or parts of the article, in various formats.
Downloads (link to download the article as PDF)
Open citations (links to open the citations from this article in various online reference manager services)
Cite this article (links to download the citations from this article in formats compatible with various reference manager tools)
Pre-existing chromosomal polymorphisms in pathogenic E. coli potentiate the evolution of resistance to a last-resort antibiotic
eLife 11:e78834.
https://doi.org/10.7554/eLife.78834


