Live-cell imaging in human colonic monolayers reveals ERK waves limit the stem cell compartment to maintain epithelial homeostasis
- Department of Cellular and Molecular Medicine, University of Arizona, United States
- Department of Molecular and Cellular Biology, The University of Arizona, United States
- University of Arizona Cancer Center, United States
- Cancer Biology Graduate Interdisciplinary Program, University of Arizona, United States
- Department of Medicine, The University of Arizona, United States
Figures
Figure 1 with 2 supplements
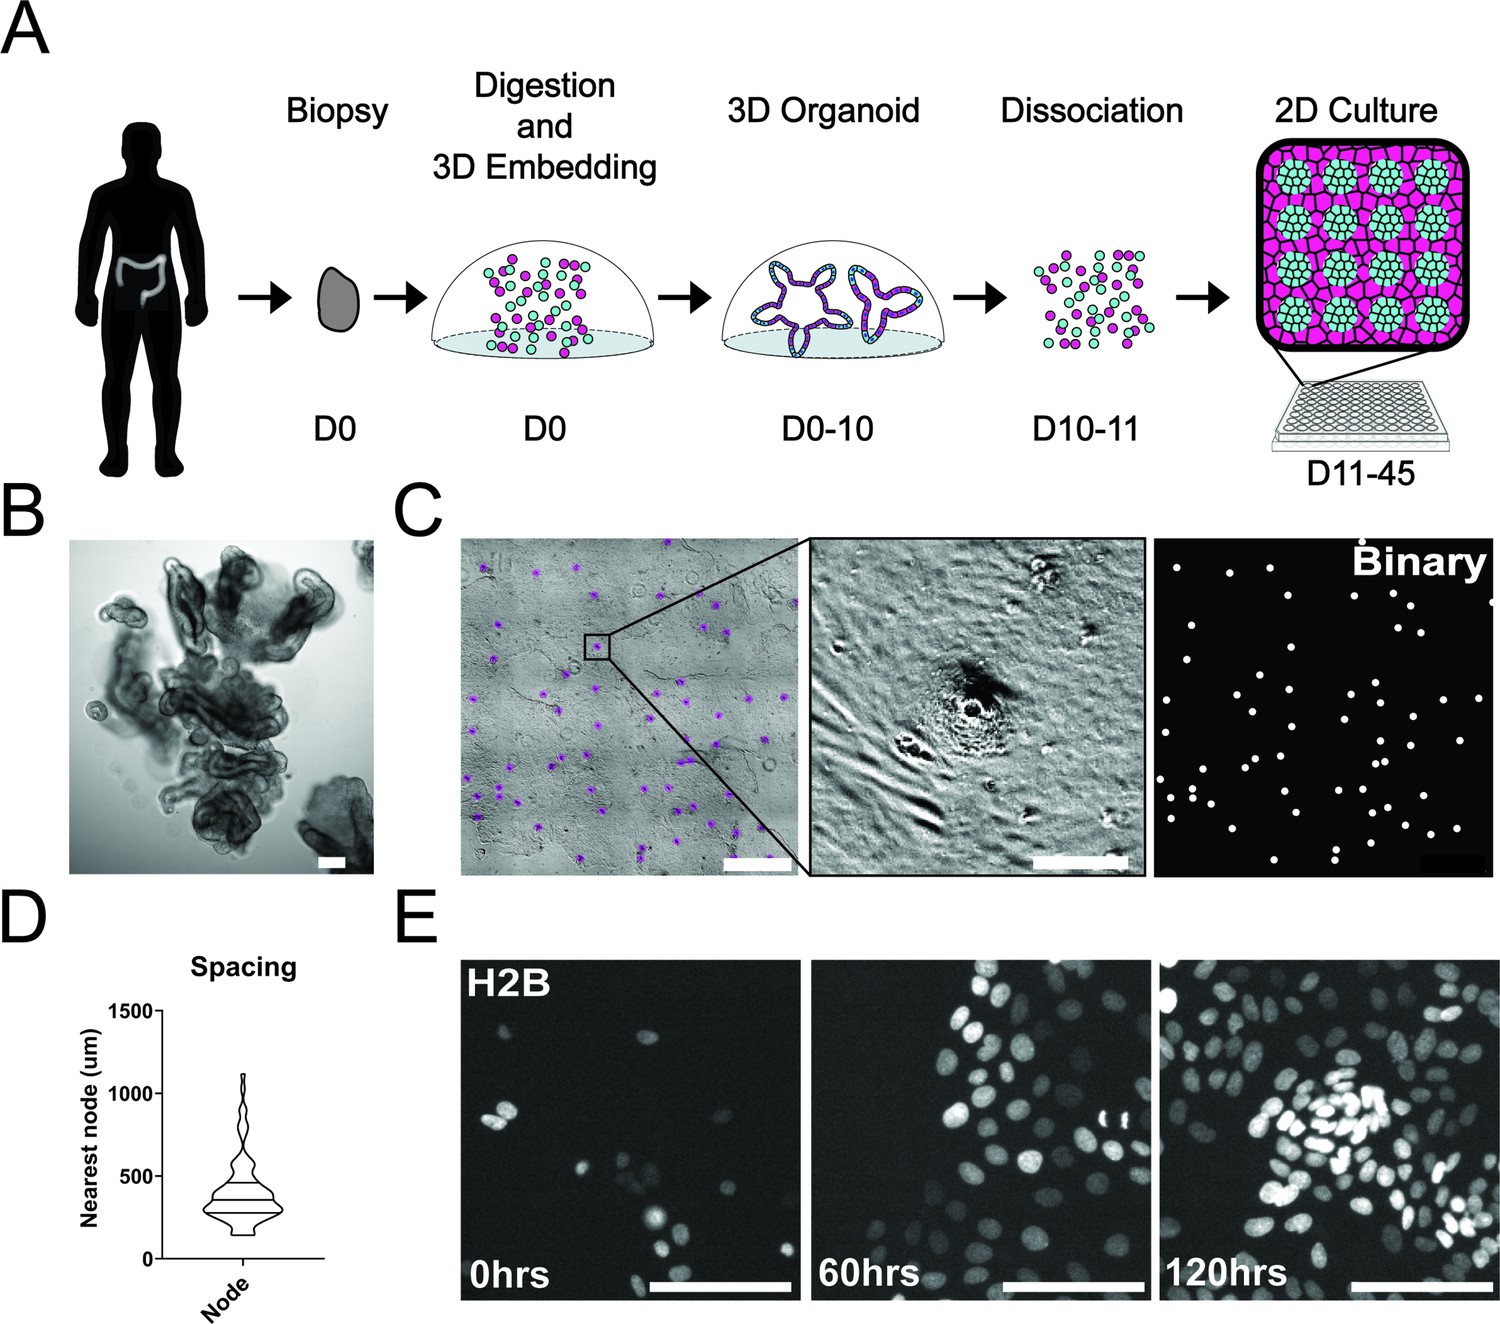
Development and self-organization of colonic patient-derived colonic organoid monolayers.
(A) Model depicting the workflow for the development of organoid monolayers. Patient biopsies are digested using collagenase to form a single cell suspension. Cells are then embedded in Matrigel and grown in 3D using a defined organoid growth medium. Organoids are expanded in 3D before seeding onto 2D imaging plates coated with a thin layer of Matrigel. Within 5 days, single cells self-organize to form a regularly patterned organoid monolayer. Organoid monolayers maintain homeostasis in this patterned state for up to 45 days. (B) Representative brightfield image of a single 3D colonic organoid. (C) Representative brightfield image of organoid monolayer. Left-automated image segmentation of nodes across a single well. Automated detection of nodes is shown in purple. Middle-sSingle node, zoom of left. Right-binary image of segmentation showing regular spacing of nodes across the culture. (D) Violin plot showing the distribution of spacing across organoid monolayers. Data represents quantification of 84 nodes (Figure 1—source data 1). (E) Live cell images of self-organization over 5 days using organoids expressing H2B-iRFP670 for nuclear tracking. All scale bars represent 100 µM except C, left, which represents 1000 µM.
-
Figure 1—source data 1
Source data for Figure 1D.
- https://cdn.elifesciences.org/articles/78837/elife-78837-fig1-data1-v2.xls
Figure 1—figure supplement 1
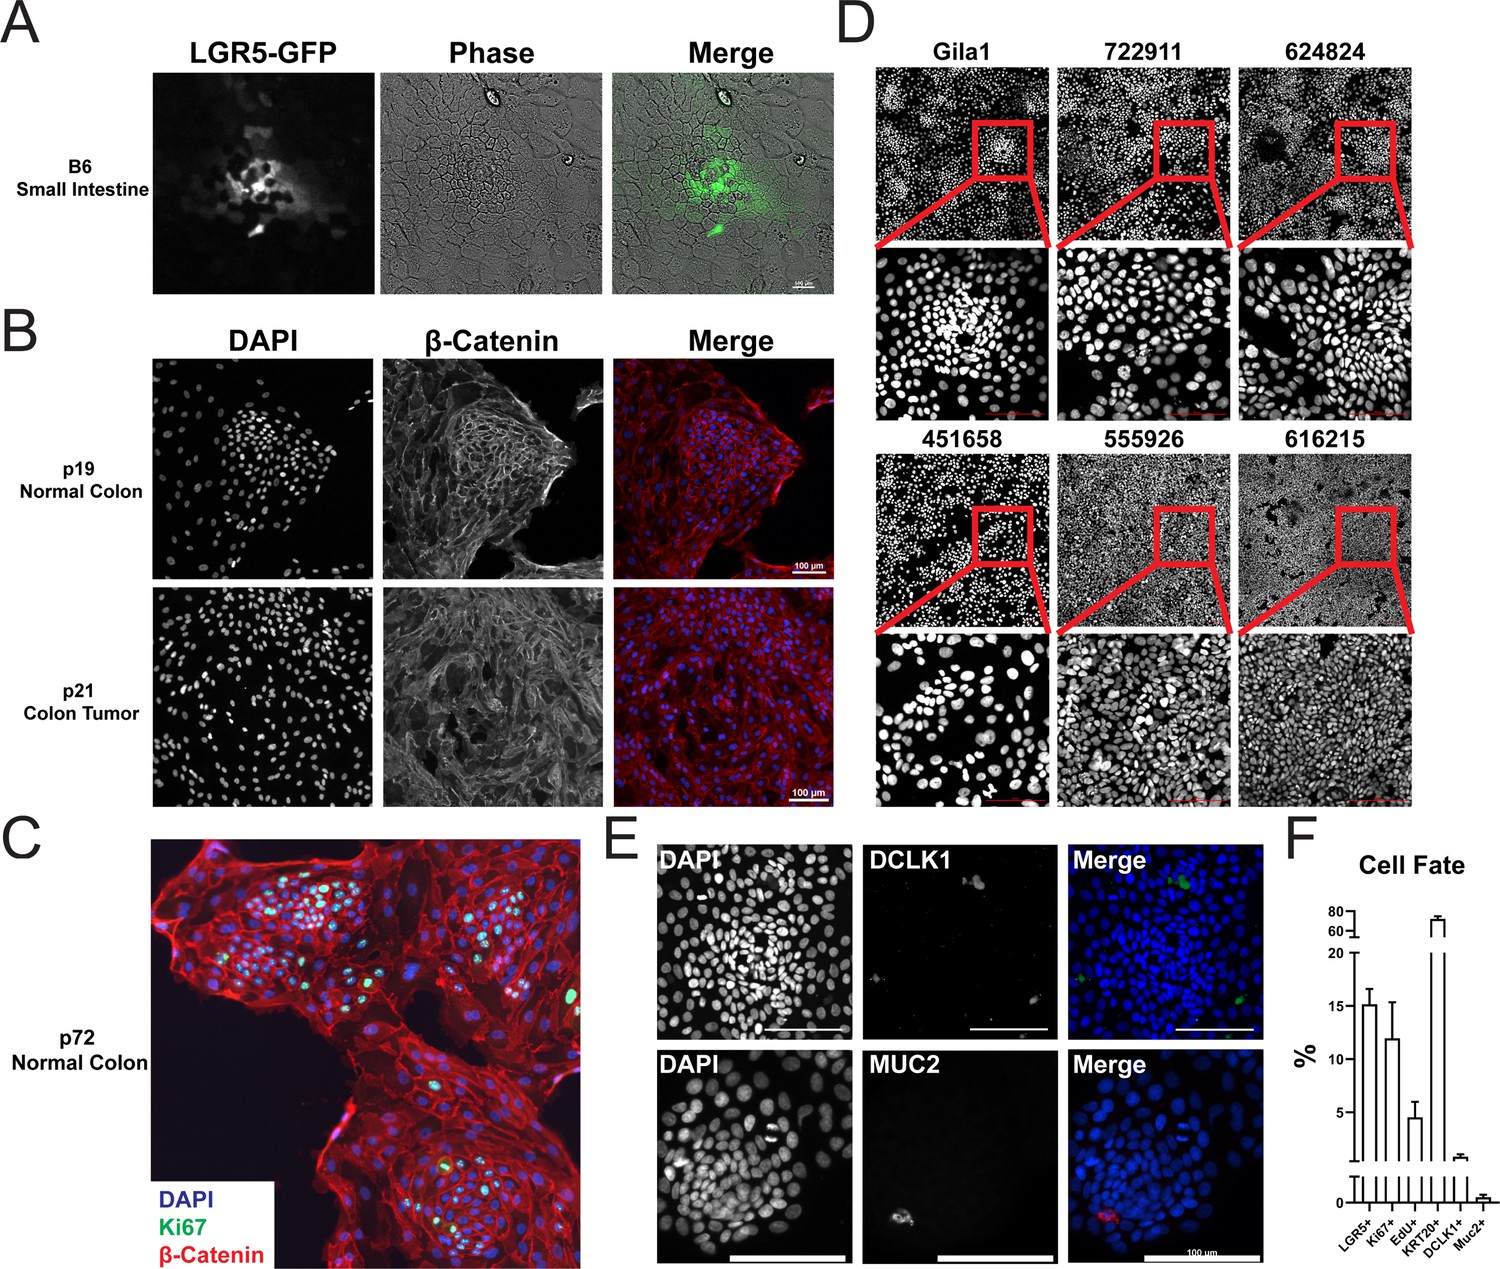
Organoid monolayer patterning in normal and tumor- derived tissues.
(A) Representative images of LGR5 expressing murine small intestine organoid monolayer. Channels from left to right: LGR5-GFP (green) and phase contrast. (B) Images of organoid monolayers derived from normal (top) or tumor (bottom) derived colon tissue. Channels from left to right: DAPI (blue) and β-catenin (red). (C) Representative image of another organoid monolayer derived from normal colonic tissue. Channels: DAPI (blue), Ki67 (green), and β-catenin (red). (D) Representative images of Gila1 and five other tumor organoid monolayers prepared identically. No tumor lines, despite differences in major driver genes, showed tissue patterning (nodes) as seen with Gila1 polyp-derived or normal colonic organoid monolayers. Scale bars represent 100 µm. (E) Representative images of GiLA1 monolayers stained for either DCLK1 (tuft) or MUC2 (goblet) cell lineage markers. (F) Quantification of cell fates derived from data shown in E and Figure 2.
Figure 1—video 1
Self-organization of 2D Monolayers.
Time course imaging of H2B (left) and Brightfield (right) of self-organization over 120 hr. Images were acquired every 15 min. Scale bar represents 100 μm.
Figure 2
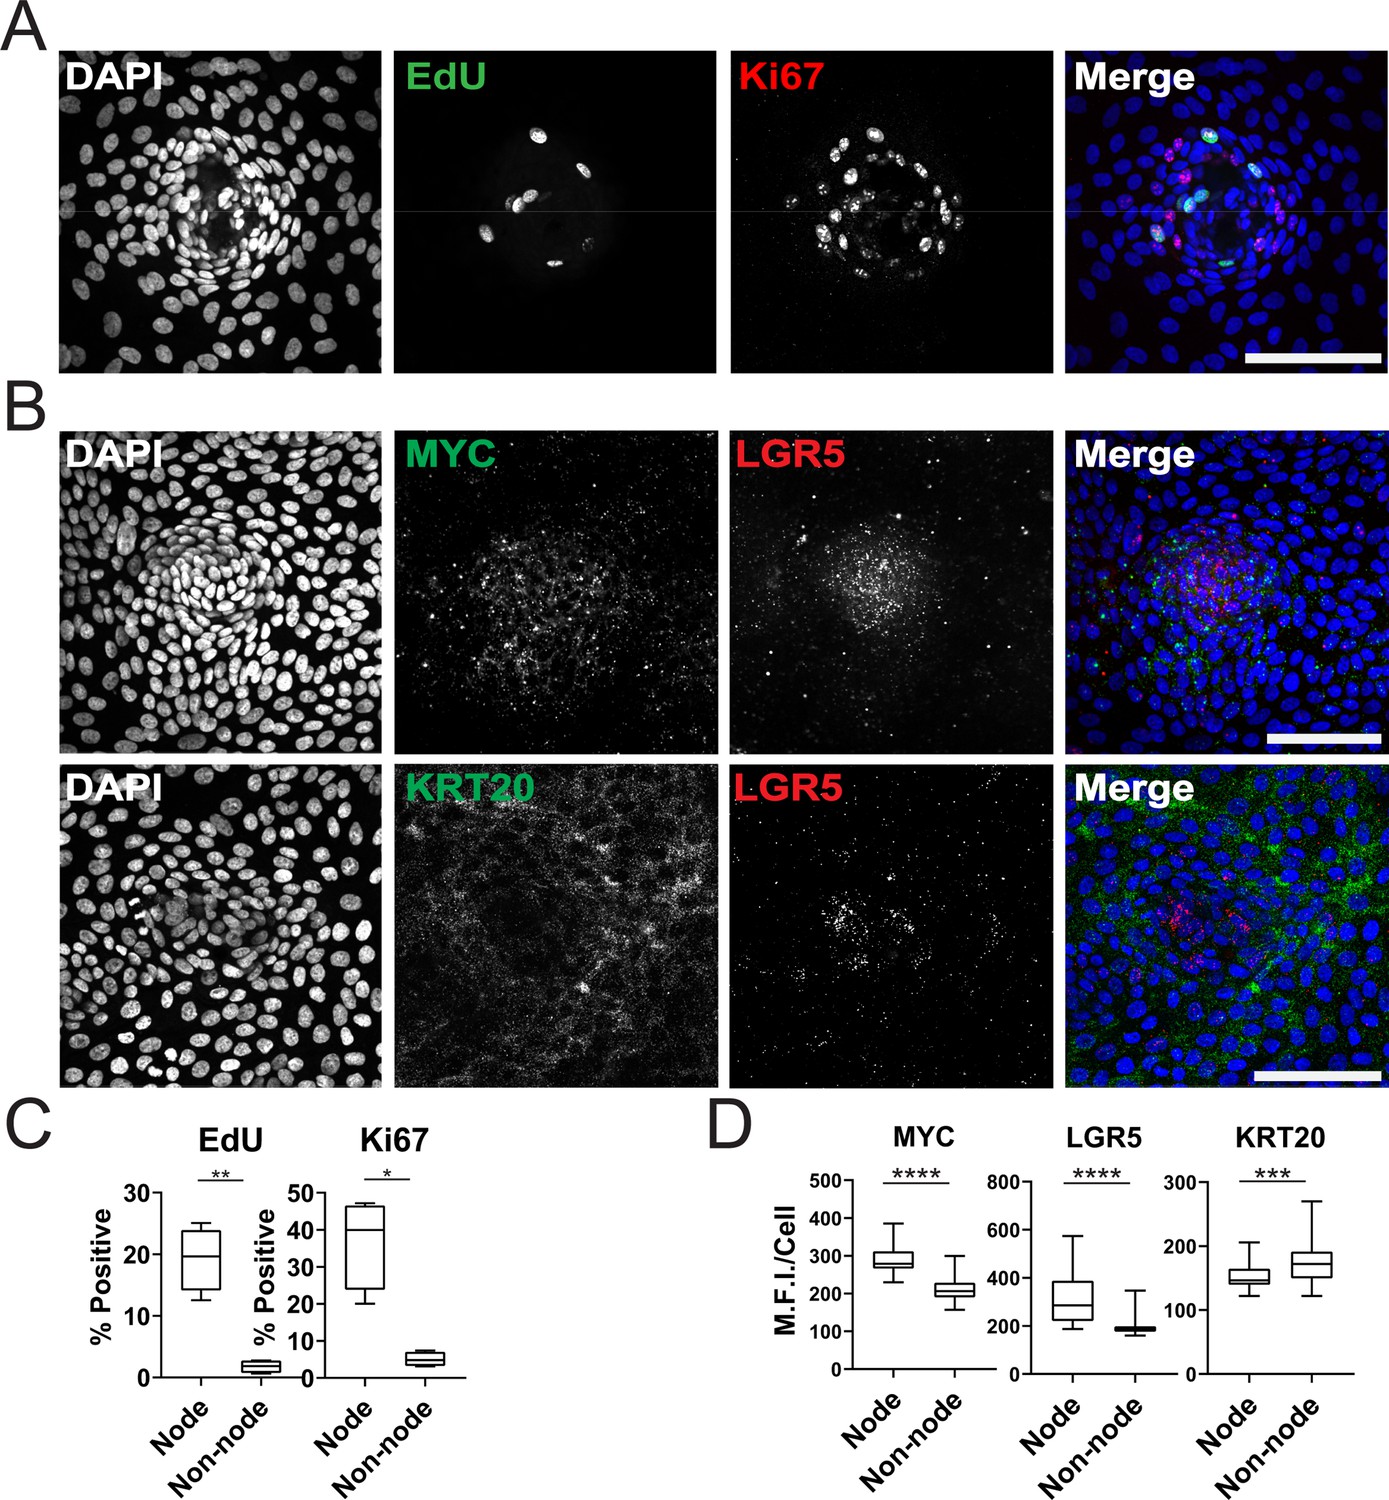
Characterization of Organoid Monolayer Compartments.
(A) Representative Figure 2D organoids stained for nuclei (blue), EdU (green), and ki67 (red). (B) Representative images of single-cell RNA fluorescence in situ hybridization (FISH) against Wnt target genes MYC and LGR5 in a single node. (C) Quantification of A showing the percent of positive cells in node or non-node regions, asterisks represent significance from paired t-test (Figure 2—source data 1–2). (D) Quantification of images represented in B, mean fluorescence intensity (MFI) of target transcripts in each single cell is shown. Cells were separated based on presence in nodes vs non-nodes. Three to four biological replicates were performed. Data shown is from analysis of 64–224 cells binned from 16 technical replicates (Figure 2—source data 3–5). Asterisks represent significance from Mann Whitney analysis, ****=p<0.0001 etc. All scale bars represent 100 µM.
-
Figure 2—source data 1
Source data for Figure 2C_EdU.
- https://cdn.elifesciences.org/articles/78837/elife-78837-fig2-data1-v2.xls
-
Figure 2—source data 2
Source data for Figure 2C_ki67.
- https://cdn.elifesciences.org/articles/78837/elife-78837-fig2-data2-v2.xls
-
Figure 2—source data 3
Source data for Figure 2D_MYC.
- https://cdn.elifesciences.org/articles/78837/elife-78837-fig2-data3-v2.xls
-
Figure 2—source data 4
Source data for Figure 2D_LGR5.
- https://cdn.elifesciences.org/articles/78837/elife-78837-fig2-data4-v2.xls
-
Figure 2—source data 5
Source data for Figure 2D_KRT20.
- https://cdn.elifesciences.org/articles/78837/elife-78837-fig2-data5-v2.xls
Figure 3 with 6 supplements
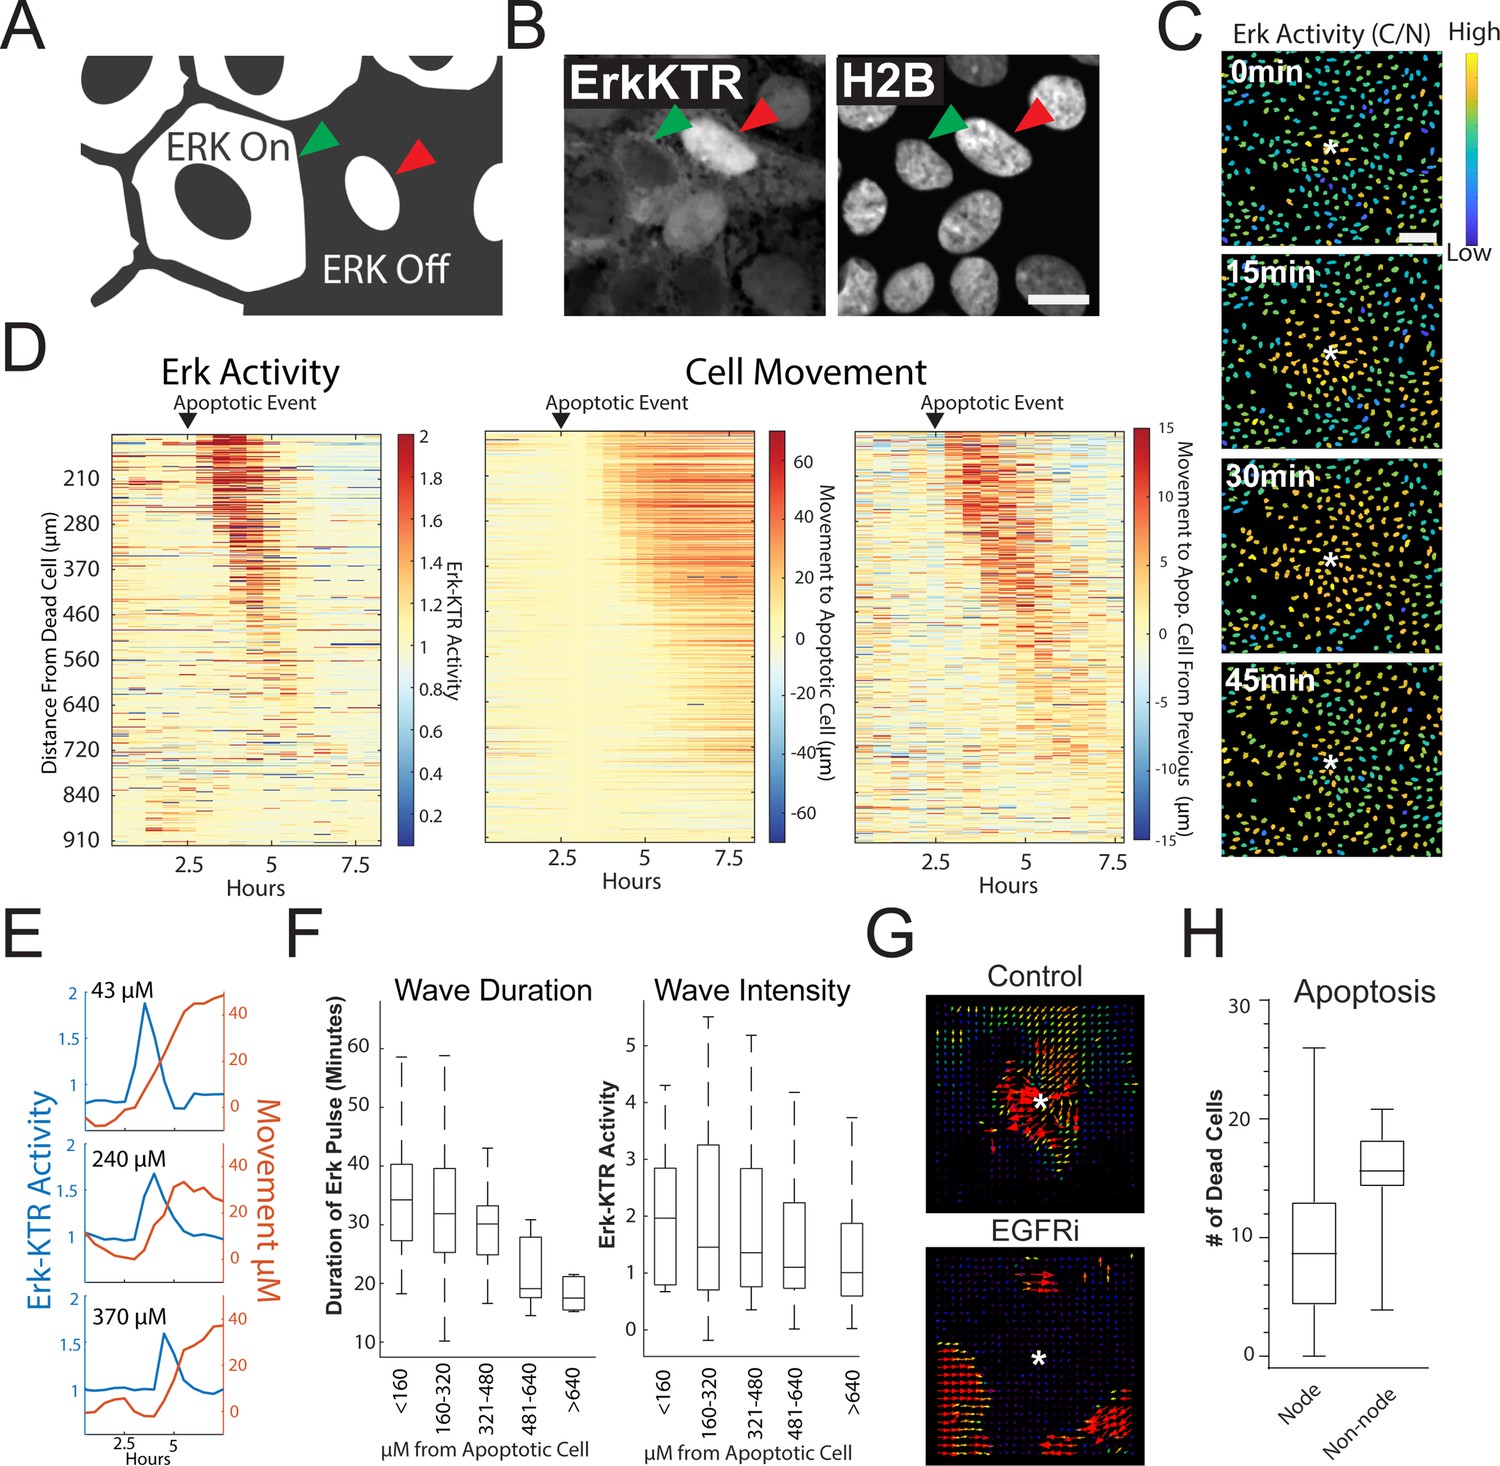
Apoptosis Induces an ERK Signaling Wave that Instructs Cell Movement.
(A) Model depicting how to interpret the ERK-KTR translocation reporter. Cells with mostly cytoplasmic ERK-KTR have high ERK activity (left, green arrow). Cells with mostly nuclear ERK-KTR signal have low ERK activity (right, red arrow). Scale bar represents 10 µM. (B) Representative images of the ERK-KTR active vs inactive. (C) Representative images showing a single ERK wave propagating from an apoptotic cell (white*). Heat map of the nuclear to cytoplasmic ratio of the ERK-KTR is shown in blue (low)/yellow (high). Scale bar in top image represents 100 µM. (D) Left: single-cell analysis of ERK activity over time after an apoptotic event. Heat maps are ordered from closest (top) to furthest (bottom) distance from the dying cell over time. ERK activity is shown (red, high ERK activity; blue, low ERK activity). Middle-single cell analysis of cell movement obtained from the same dataset shown on left. Change in distance towards the position of the apoptotic event is shown. Right-relative change in distance compared to the previous frame is shown. Data is represented from a single wave event. 455 cells were analyzed. (E) Representative single-cell traces comparing ERK activity (blue) and cell movement (red) at a given distance from the apoptotic cell is shown. (F) Left: duration of ERK signaling wave at a given distance from an apoptotic cell. Right- ERK-KTR activity at a given distance from an apoptotic cell (Figure 3—source data 1). (G) Representative images of particle image velocimetry (PIV) of H2B-iRFP670 images after an apoptotic event. Organoids were treated with or without 5 µM Gefitinib. These data correspond with movie 3. Arrows indicate direction and amplitude of movement for the duration of the movie. Asterisk represent the position of the apoptotic cell. (H) Location of cleaved caspase three positive cells in monolayer over 24 hr. Data was acquired from 96 time points and is represented as the number of caspase positive cells in node or non-node area (Figure 3—source data 2).
-
Figure 3—source data 1
Source data for Figure 3D–F.
- https://cdn.elifesciences.org/articles/78837/elife-78837-fig3-data1-v2.xlsx
-
Figure 3—source data 2
Source data for Figure 3H.
- https://cdn.elifesciences.org/articles/78837/elife-78837-fig3-data2-v2.xls
Figure 3—figure supplement 1
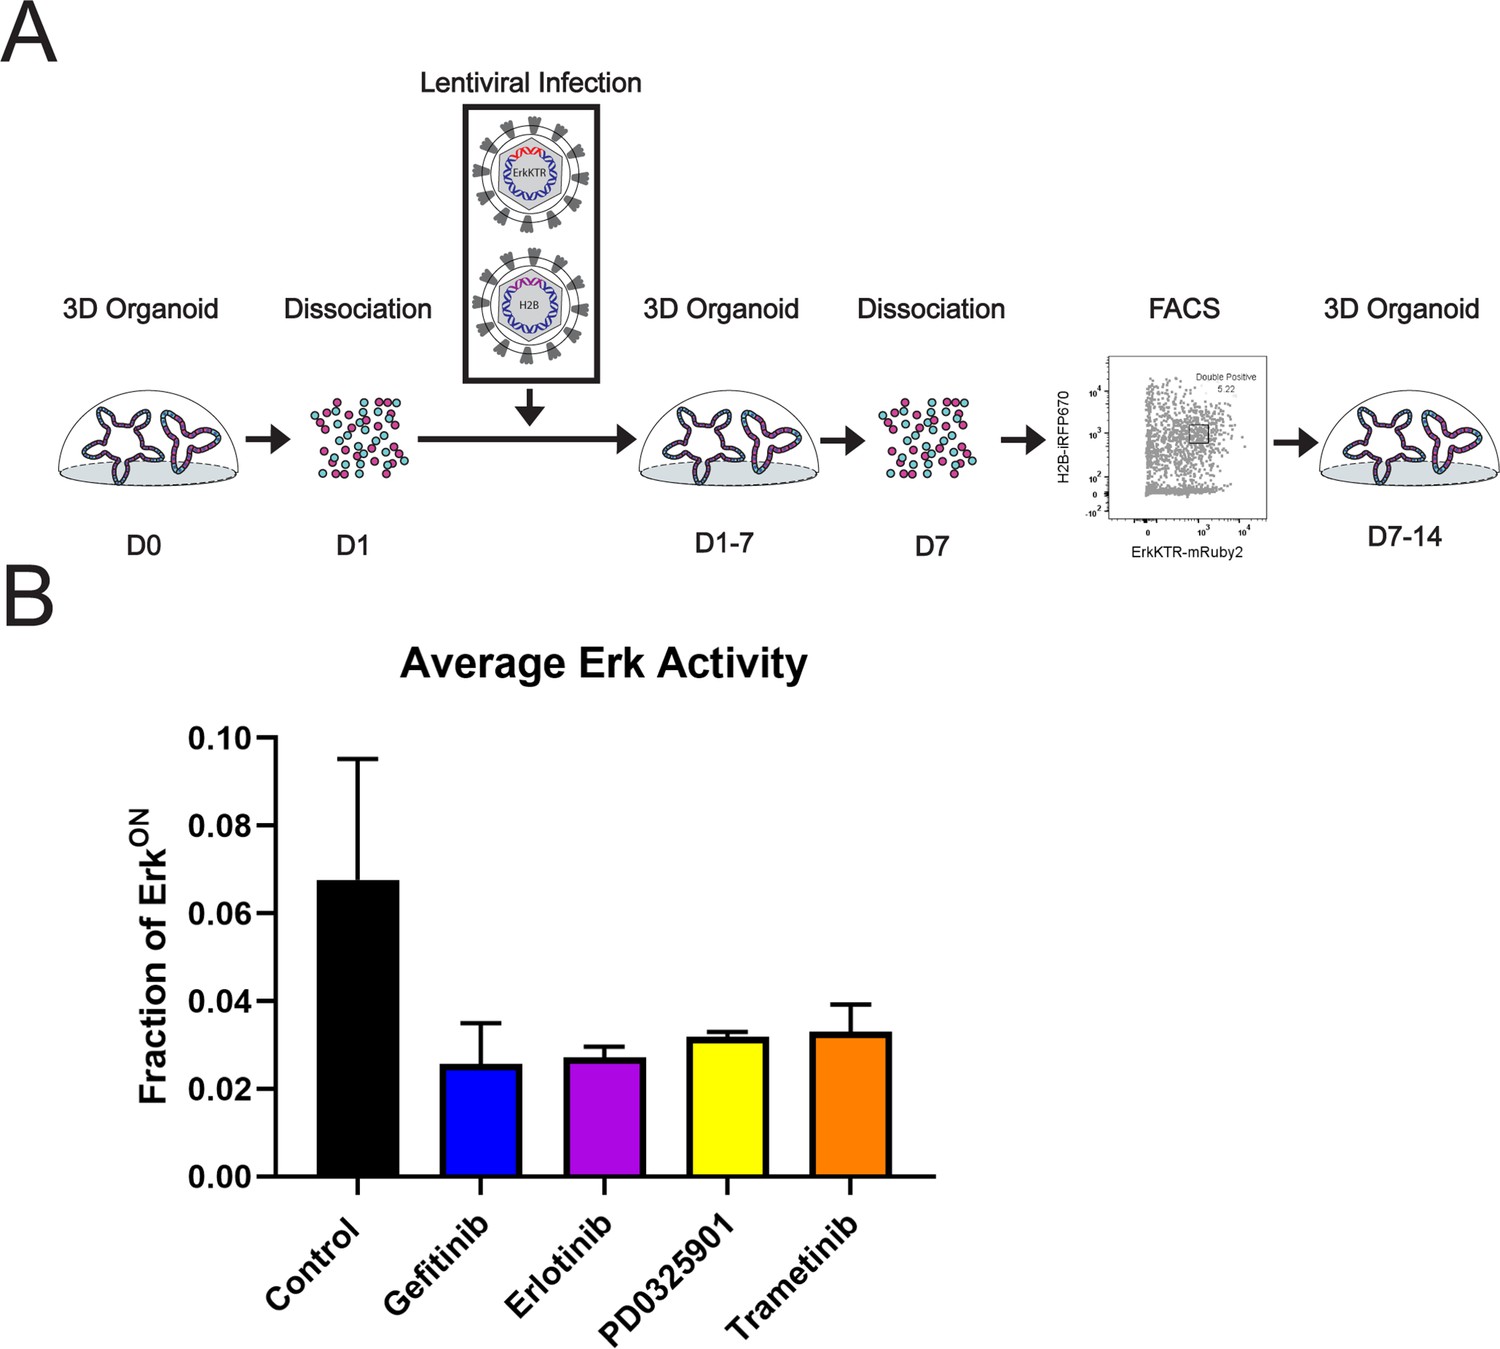
Generation and validation of ErkKTR Organoids from Human Biopsies.
(A) Model depicting the development of organoid monolayers expressing live cell reporters for kinase activity. (B) ERK-KTR activity in organoid monolayers. Cells were treated with 1 µM of Gefitinib (EGFRi), Erlotinib (EGFRi), PD0325901 (MEKi), or Trametinib (MEKi) for 24 hr. Average ERK activity across all cells over 24 hr is shown. Error bars represent standard deviation across three independent replicates.
Figure 3—figure supplement 2
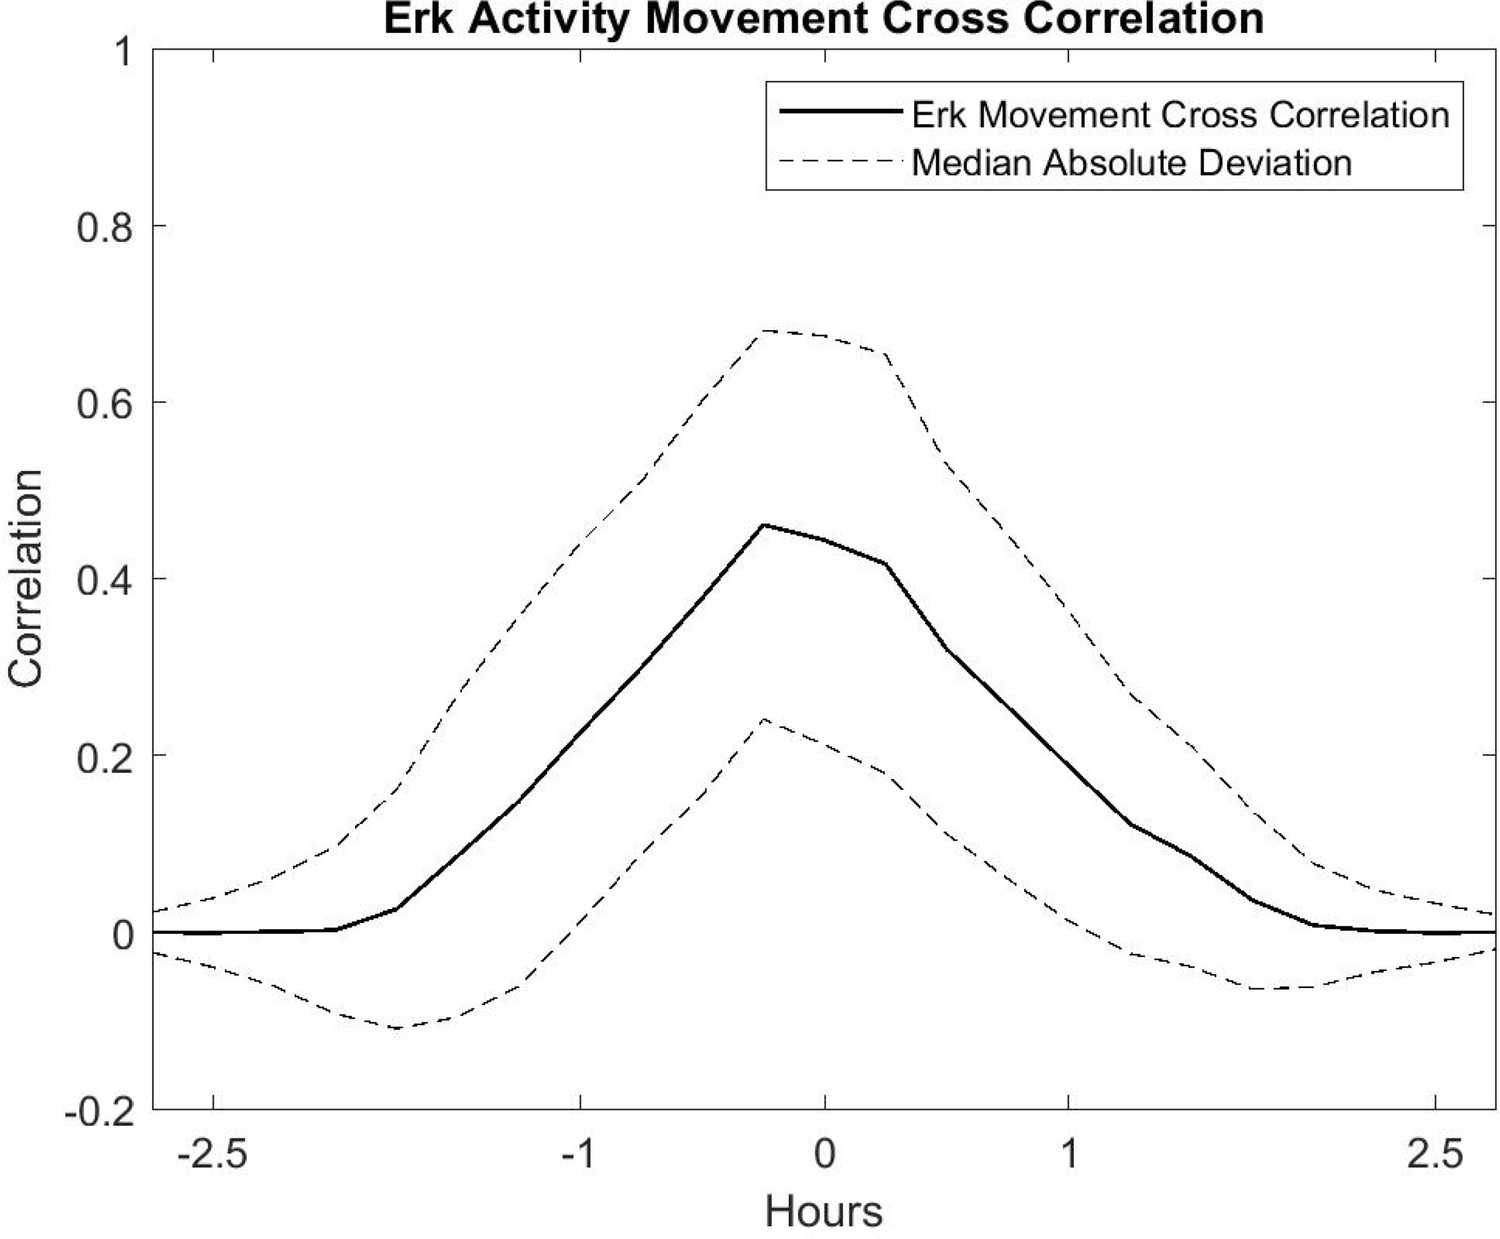
Cross-correlation Analysis of Cell Movement vs ERK Activity.
Correlation is shown as a solid line and the median absolute deviation is shown as dashed lines.
Figure 3—figure supplement 3
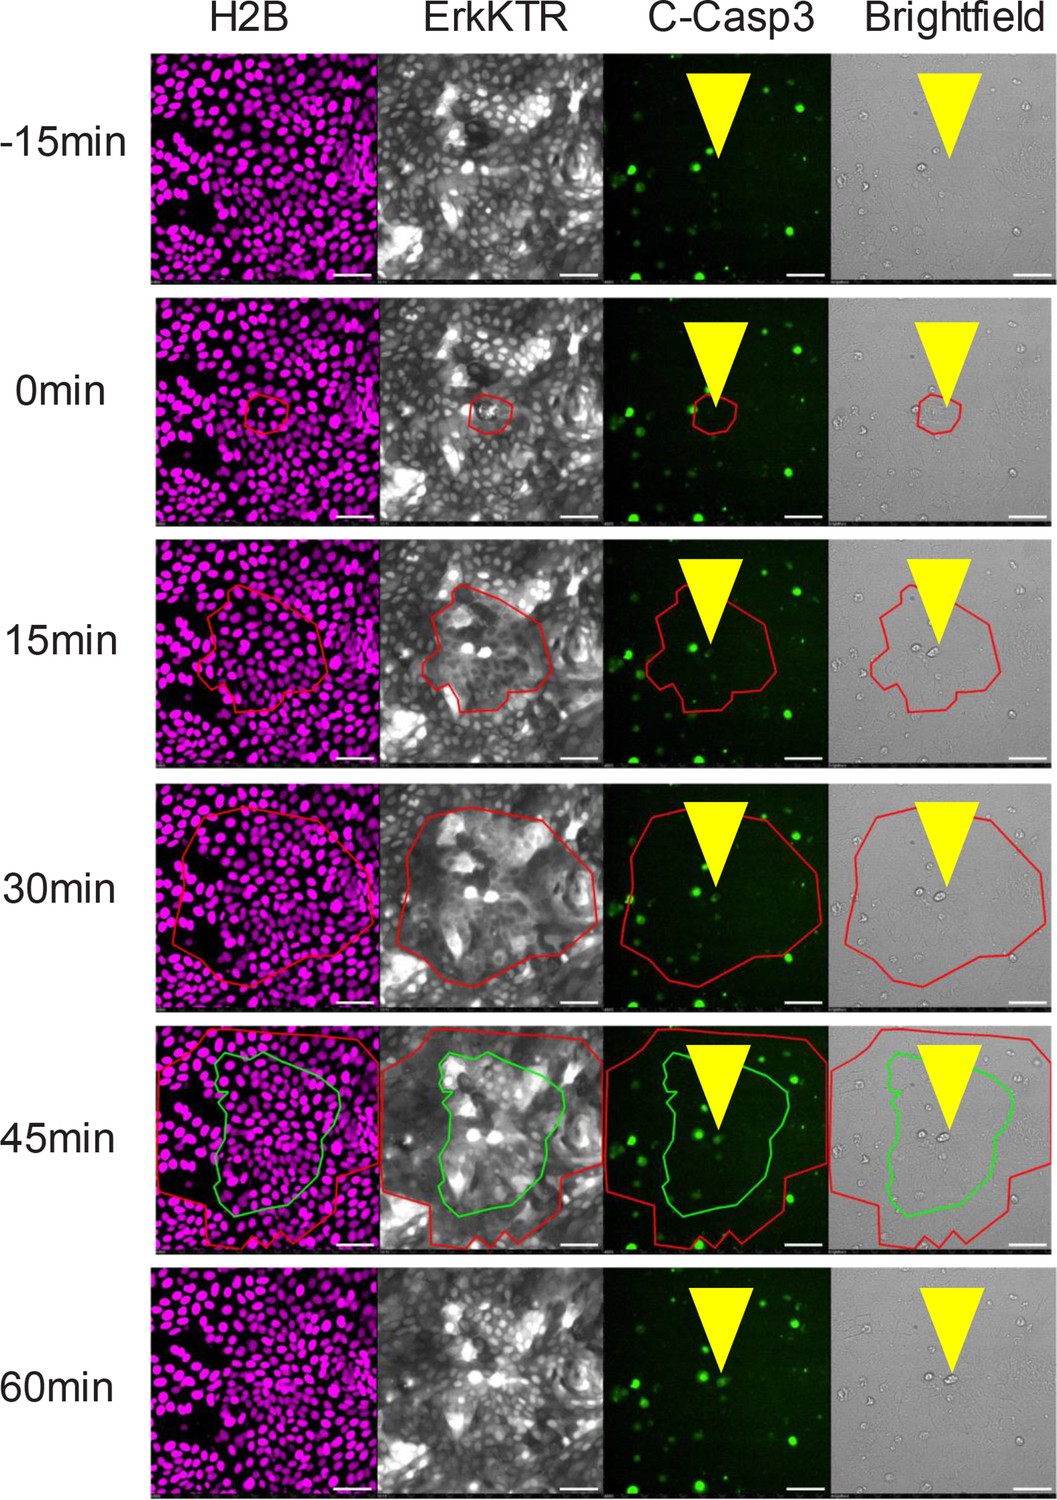
Representative Images of Caspase 3 Dye Localization in node vs non-node areas.
Red circle represents node area. Channels from left to right: H2B, ERK-KTR, cleaved caspase, and Brightfield. Scale bars represent 100 µm.
Figure 3—video 1
ERK Waves Originate from Apoptotic Cells.
Channels from left to right: H2B (purple), ERK-KTR (white), cleaved caspase 3 (green), and brightfield taken over the course of a single wave event. The red expanding circle indicates the area of high ERK activation. The green circle indicates cells that turn off ERK signaling after the initial wave passes. Images were acquired every 15 min for 75 min. Scale bar represents 100 μm.
Figure 3—video 2
Cell Movement is Instructed by an ERK wave.
Time course imaging of a single ERK wave with DMSO only. Channels from left to right: H2B (purple) and ERK-KTR (white). Images were acquired every 15 min for 105 min. Scale bar represents 100 μm.
Figure 3—video 3
Cell Movement is Instructed by an ERK Wave.
Time course imaging of a single ERK wave with treatment with 10 µM of the EGFR inhibitor Gefitinib. Channels from left to right: H2B (purple) and ERK-KTR (white). Images were acquired every 15 min for 105 min. Scale bar represents 100 μm.
Figure 4 with 5 supplements

ERK Dynamics are Essential to Maintain Tissue Patterning in Organoid Monolayers.
(A) Representative images of cell density variation in node vs non-node. Top left: H2B-iRFP670. Top right: ERK-KTR. Bottom left- binary nuclear segmentation showing high- and low-density regions. Bottom right: a spatial heat map of ERK activity over 16 hr in node and surrounding region. (B) Representative images of ERK activation after 100 nM phorbol 12-myristate 13-acetate (PMA) treatment for 20 min. Top- ERK-KTR before treatment with PMA. Bottom- ERK-KTR of the same node 20 min after PMA treatment. (C) Quantification of ERK-KTR activity after 30 min of 100 nM PMA treatment. Analysis from 255 single cells is shown (Figure 4—source data 1). (D) Representative images of cell clustering following 100 nM PMA treatment. Top 4 panels show nuclear distribution across stitched image (top) and zoom (bottom) before and after PMA treatment. Bottom 4 panels show binary segmentation to clearly show loss of cell clustering following PMA treatment. (E) Histograms showing distance between nuclei with or without treatment with 100 nM PMA. Data is represented as nearest nuclei distance. Analysis of 3523 cells is shown (Figure 4—source data 2). (F) Quantification of patterning loss before and after treatment with 100 nM PMA for 24 hr. Analysis of 53 images is shown (Figure 4—source data 3). (G) Representative images of ERK-KTR activity after pulsing cells for 1 min with PMA followed by washout and chase for 24 hr. Top- all cells show high ERK activity with intact node. Bottom-node loss and resuppression of ERK activity after 24 hr. Asterisks represent significance from Mann Whitney analysis, ****=p<0.0001 etc. Scale bars represent 100 µM.
-
Figure 4—source data 1
Source data for Figure 4C.
- https://cdn.elifesciences.org/articles/78837/elife-78837-fig4-data1-v2.xls
-
Figure 4—source data 2
Source data for Figure 4E.
- https://cdn.elifesciences.org/articles/78837/elife-78837-fig4-data2-v2.xls
-
Figure 4—source data 3
Source data for Figure 4F.
- https://cdn.elifesciences.org/articles/78837/elife-78837-fig4-data3-v2.xls
Figure 4—figure supplement 1
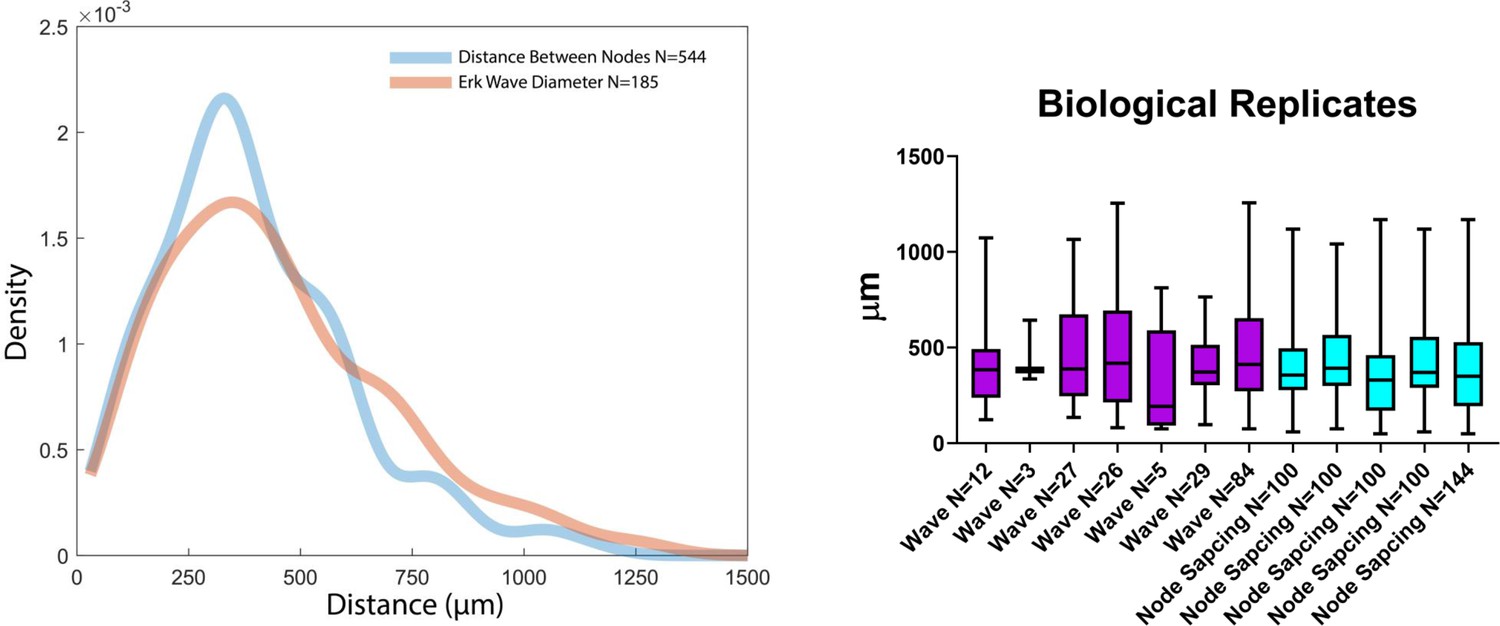
Correlation Between Node Spacing and Wave Distance.
Figure 4—video 1
ERK Activity is Increased in Non-node Regions.
Time course imaging of a single node. Channels from left to right: H2B (purple) and ERK-KTR (white). Images were acquired every 7 min for 10 hr. Scale bar represents 100 μm.
Figure 4—video 2
Spatial Heat Map of ERK Activity Over Time of a Single Node.
Nuclear to cytoplasmic ratio of the ERK-KTR was measured at the single cell level over time. A threshold for active ERK cells was then combined with spatial clustering to identify ERK-active compartments. High ERK compartments were then superimposed from each imaging timepoint to create a single heat map for regional ERK activity over time. Images were acquired every 7 min for 16 hr. Yellow indicates high ERK activity, blue indicates low ERK activity. Scale is the same as in 4 a.
Figure 4—video 3
Activation of ERK-KTR using Phorbol 12-myristate 13-acetate (PMA).
Organoids were treated with 100 nM PMA for 5 min prior to imaging at 20 min intervals for 120 min. Channels from left to right: H2B (purple) and ERK-KTR (white). Scale bar represents 100 μm.
Figure 4—video 4
1 min Pulse of Phorbol 12-myristate 13-acetate (PMA) Induces Lasting Node Loss and Transient ERK Activation.
Channels from left to right: H2B (purple) and ERK-KTR (white). Organoids were treated with 100 nM PMA for 1 min prior to imaging. Images were acquired every 30 min for 48 hr. Scale bar represents 100 μm.
Figure 5 with 3 supplements
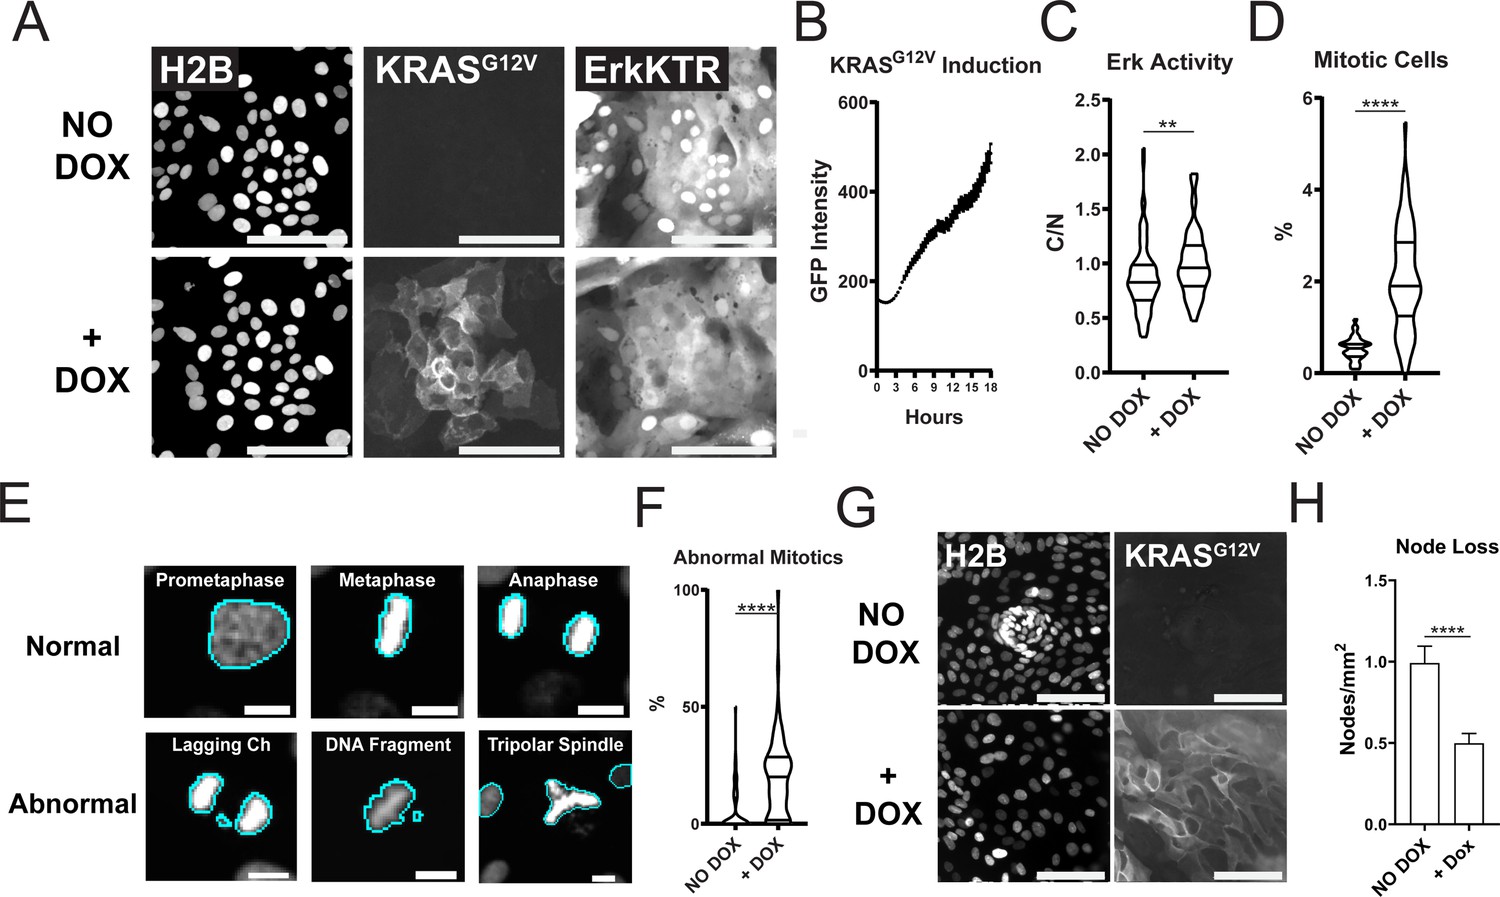
Expression of Oncogenic KRASG12V Induces ERK Activation, Increased Proliferation, Mitotic Abnormalities, and Tissue Patterning Loss.
(A) Representative images of GiLA1 monolayers expressing H2B, Dox-inducible GFP-KRASG12V, and ERK-KTR before (top) and 7 hr after (bottom) 1 μg/ml of doxycycline. Scale bars represent 100 μm. (B) Quantification of KRASG12V induction after treatment with 1 μg/ml doxycycline for 16 hr. Analysis from 16 images over 54 timepoints is shown (Figure 5—source data 1). (C) Quantification of ERK-KTR before and after 7 hr of doxycycline. Data is represented as the cytoplasmic to nuclear ratio of the KTR intensity (Figure 5—source data 2). Analysis of 85–91 single cells is shown. (D) Quantification of the percent of mitotic cells with or without treatment with 1 μg/ml doxycycline for 16 hr (Figure 5—source data 3). (E) Representative images of normal or abnormal mitotic events taken from experiments described in figures C and D. Scale bars represent 10 μm. (F) Quantification of abnormal mitotic events in cells treated with 1 μg/ml doxycycline for 16 hr. Data is represented as percent of total mitotic cells within the image. At least 58 images were analyzed for each condition. Images harbored 400–1200 cells (Figure 5—source data 4). (G) Representative images of nodes in H2B and GFP-KRASG12V expressing cells with or without 1 μg/ml doxycycline for 7 days. Scale bars represent 100 μm. (H) Quantification of images shown in G (Figure 5—source data 5). Data is represented as mean and SEM of at least 64 images harboring 400–1200 cells. Asterisks represent significance from Mann Whitney analysis, ****=p<0.0001 etc.
-
Figure 5—source data 1
Source data for Figure 5B.
- https://cdn.elifesciences.org/articles/78837/elife-78837-fig5-data1-v2.xls
-
Figure 5—source data 2
Source data for Figure 5C.
- https://cdn.elifesciences.org/articles/78837/elife-78837-fig5-data2-v2.xls
-
Figure 5—source data 3
Source data for Figure 5D.
- https://cdn.elifesciences.org/articles/78837/elife-78837-fig5-data3-v2.xls
-
Figure 5—source data 4
Source data for Figure 5F.
- https://cdn.elifesciences.org/articles/78837/elife-78837-fig5-data4-v2.xls
-
Figure 5—source data 5
Source data for Figure 5H.
- https://cdn.elifesciences.org/articles/78837/elife-78837-fig5-data5-v2.xls
Figure 5—figure supplement 1
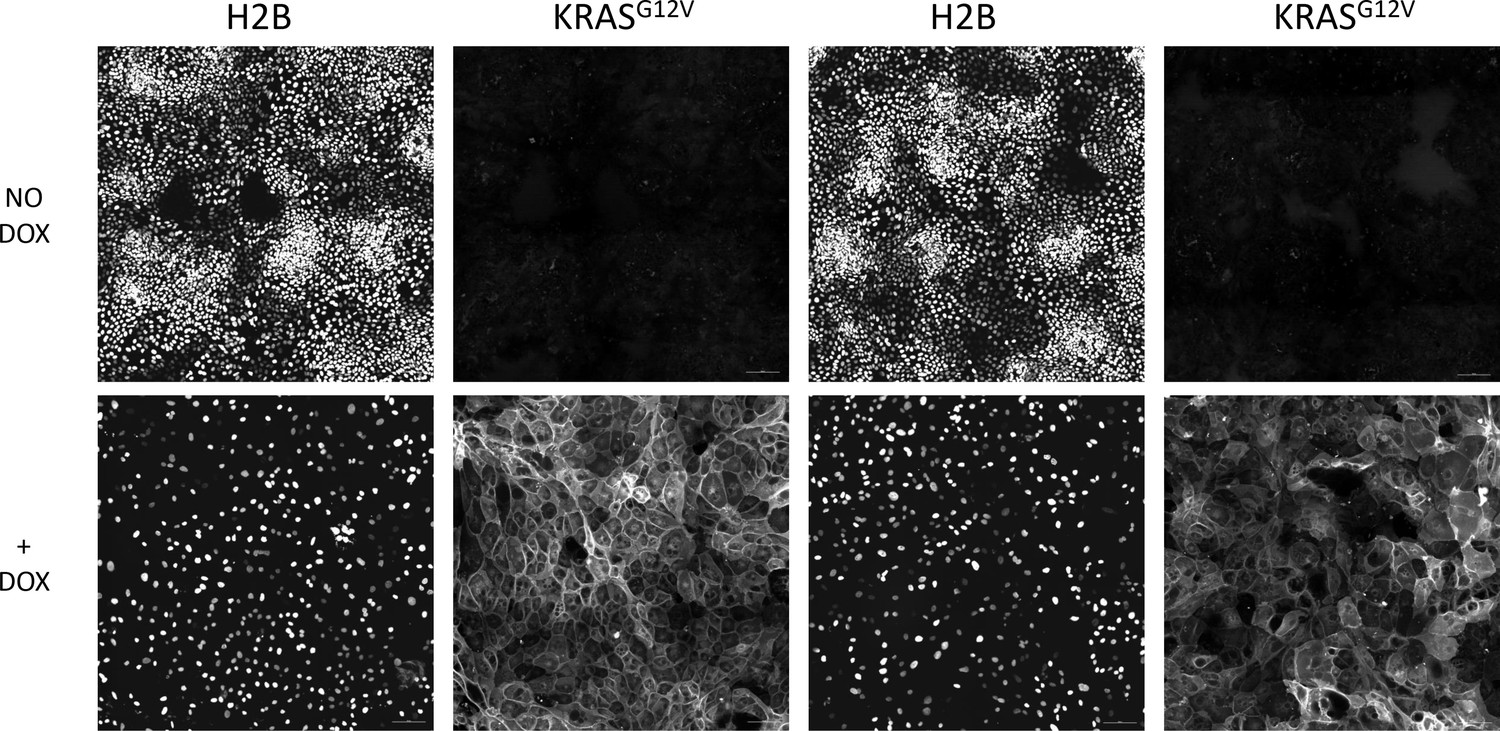
Loss of Patterning After KRASG12V Induction.
GiLA1 monolayers harboring dox-inducible KRASG12V were allowed to pattern for 4 days and then treated with (Bottom) or without (Top) 1 μg/ml doxycycline every 24 hr for 14 days. Two representative images of H2B and KRASG12V are shown.
Figure 5—video 1
Spontaneous Formation of Nodes After Monolayer Formation in Uninduced KRASG12V Gila1 Monolayers.
Node formation can be seen in the bottom right of the image after 18 hr and is maintained. H2B-iRFP670 (left), GFP- KRASG12V (right). Scale bar represents 100 μm.
Figure 5—video 2
Lack of Node Formation in Gila1 Monolayers after KRASG12V Induction by Doxycycline.
Monolayers were incubated with 1 μg/ml doxycycline for 16 hr then imaged for 22 hr. H2B-iRFP670 (left), GFP- KRASG12V (right) Scale bar represents 100 μm.
Figure 6 with 4 supplements
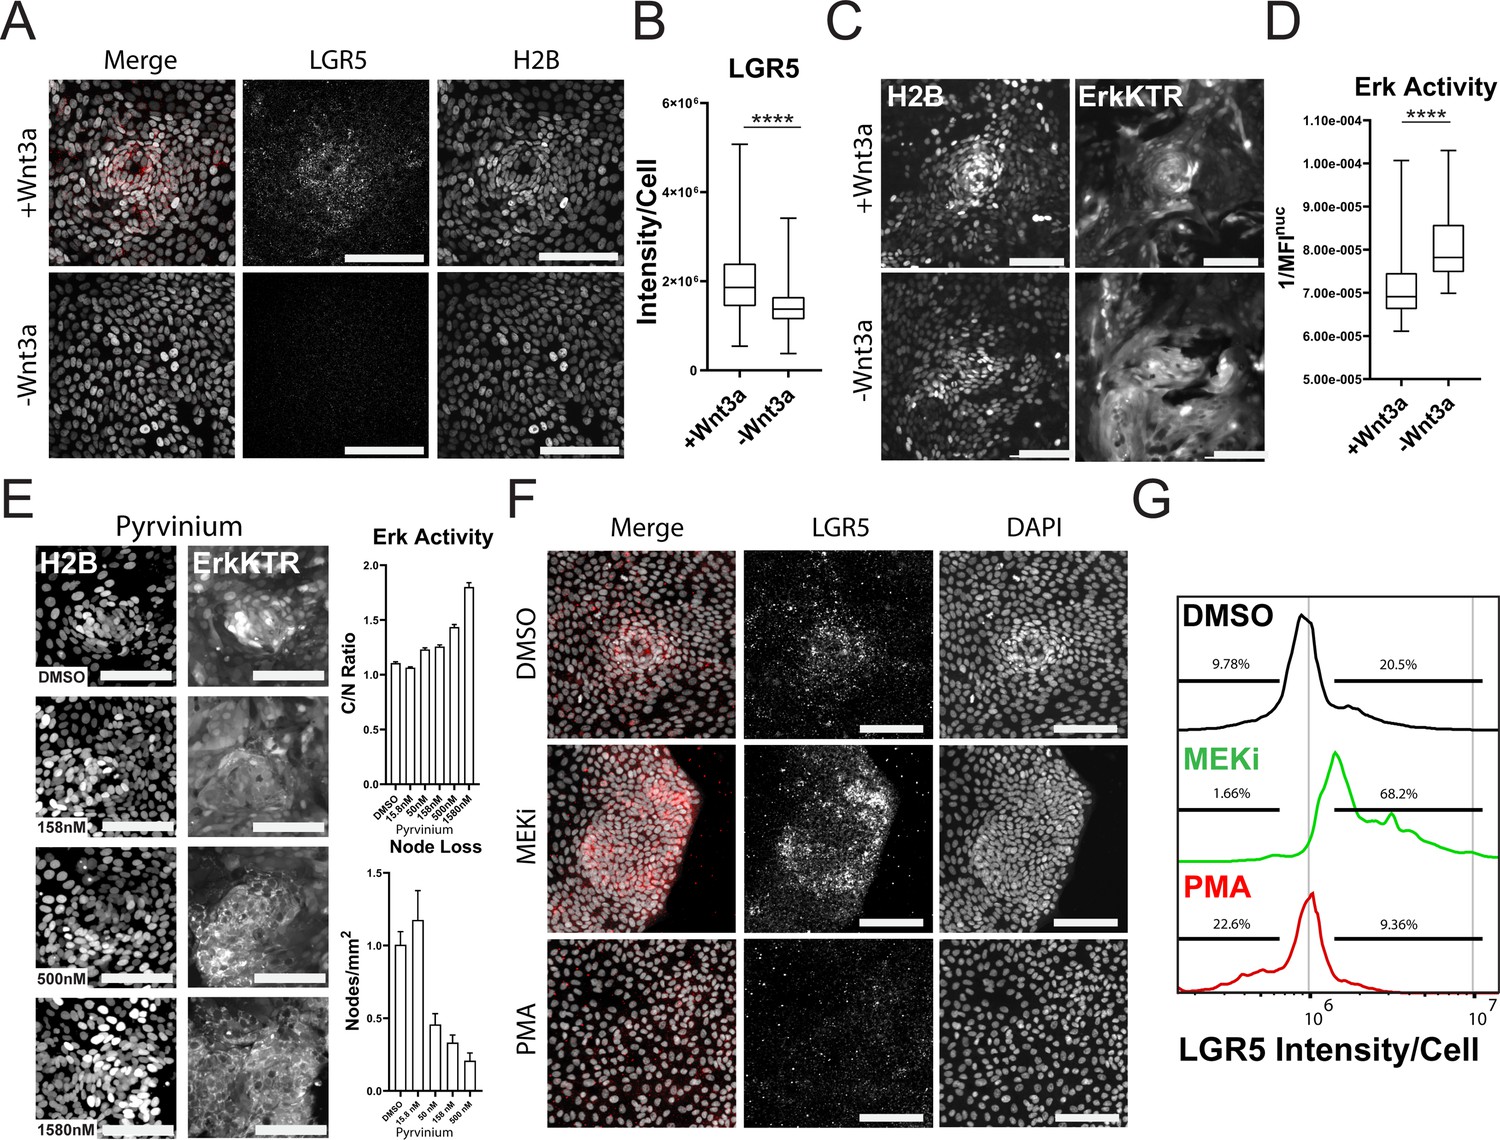
Wnt and ERK Signaling Mutually Limit Each Other to Preserve Tissue Homeostasis.
(A) Representative images of LGR5 mRNA in organoid monolayer after removal of Wnt3a for 72 hr. H2B-GFP is shown in white and LGR5 mRNA is shown in red. (B) Quantification of scRNA FISH for LGR5 in organoid monolayers after removal of Wnt3a from organoid media. Data are represented as the sum of LGR5 intensity per cell. Analysis of at least 386 cells is shown (Figure 6—source data 1). (C) Representative images of ERK kinase activity after Wnt3a removal for 24 hr. Inverted nuclear intensity of ERK-KTR is shown. (D) Quantification of ERK kinase activity after removal of Wnt3a from organoid media from 0 to 48 hr following Wnt removal. Analysis of at least 287 cells is shown (Figure 6—source data 2). (E) Left: Representative images of H2B (left) and ERK-KTR (right) with or without treatment with a dose response of Pyrvinium for 4 hr. Top right: quantification of ERK activity after treatment with the Wnt inhibitor pyrvinium for 4 hr. Analysis of at least 1844 cells is shown. Bottom right-quantification of node loss after treatment with a dose response of pyrvinium for 4 days. Analysis of 14–79 images is shown (Figure 6—source data 3 and Figure 6—source data 4). (F) Representative images of smRNA FISH for LGR5 in organoid monolayers after treatment with either 1 µM PD0325901 (MEKi) or 100 nM PMA for 24 hr followed by 24 hr of normal media. (G) Quantification of experiment described in F. Data is represented as histograms of the sum of LGR5 intensity per cell. Gates show percent of high and low LGR5 +expressing cells. Analysis of 5014–11282 cells is shown. Asterisks represent significance from Mann Whitney analysis, ****=p<0.0001 etc. Scale bars represent 100 µM (Figure 6—source data 5).
-
Figure 6—source data 1
Source data for Figure 6B.
- https://cdn.elifesciences.org/articles/78837/elife-78837-fig6-data1-v2.xls
-
Figure 6—source data 2
Source data for Figure 6D.
- https://cdn.elifesciences.org/articles/78837/elife-78837-fig6-data2-v2.xls
-
Figure 6—source data 3
Source data for Figure 6E_top right.
- https://cdn.elifesciences.org/articles/78837/elife-78837-fig6-data3-v2.xls
-
Figure 6—source data 4
Source data for Figure 6E_bottom right.
- https://cdn.elifesciences.org/articles/78837/elife-78837-fig6-data4-v2.xls
-
Figure 6—source data 5
Source data for Figure 6G.
- https://cdn.elifesciences.org/articles/78837/elife-78837-fig6-data5-v2.xls
Figure 6—figure supplement 1
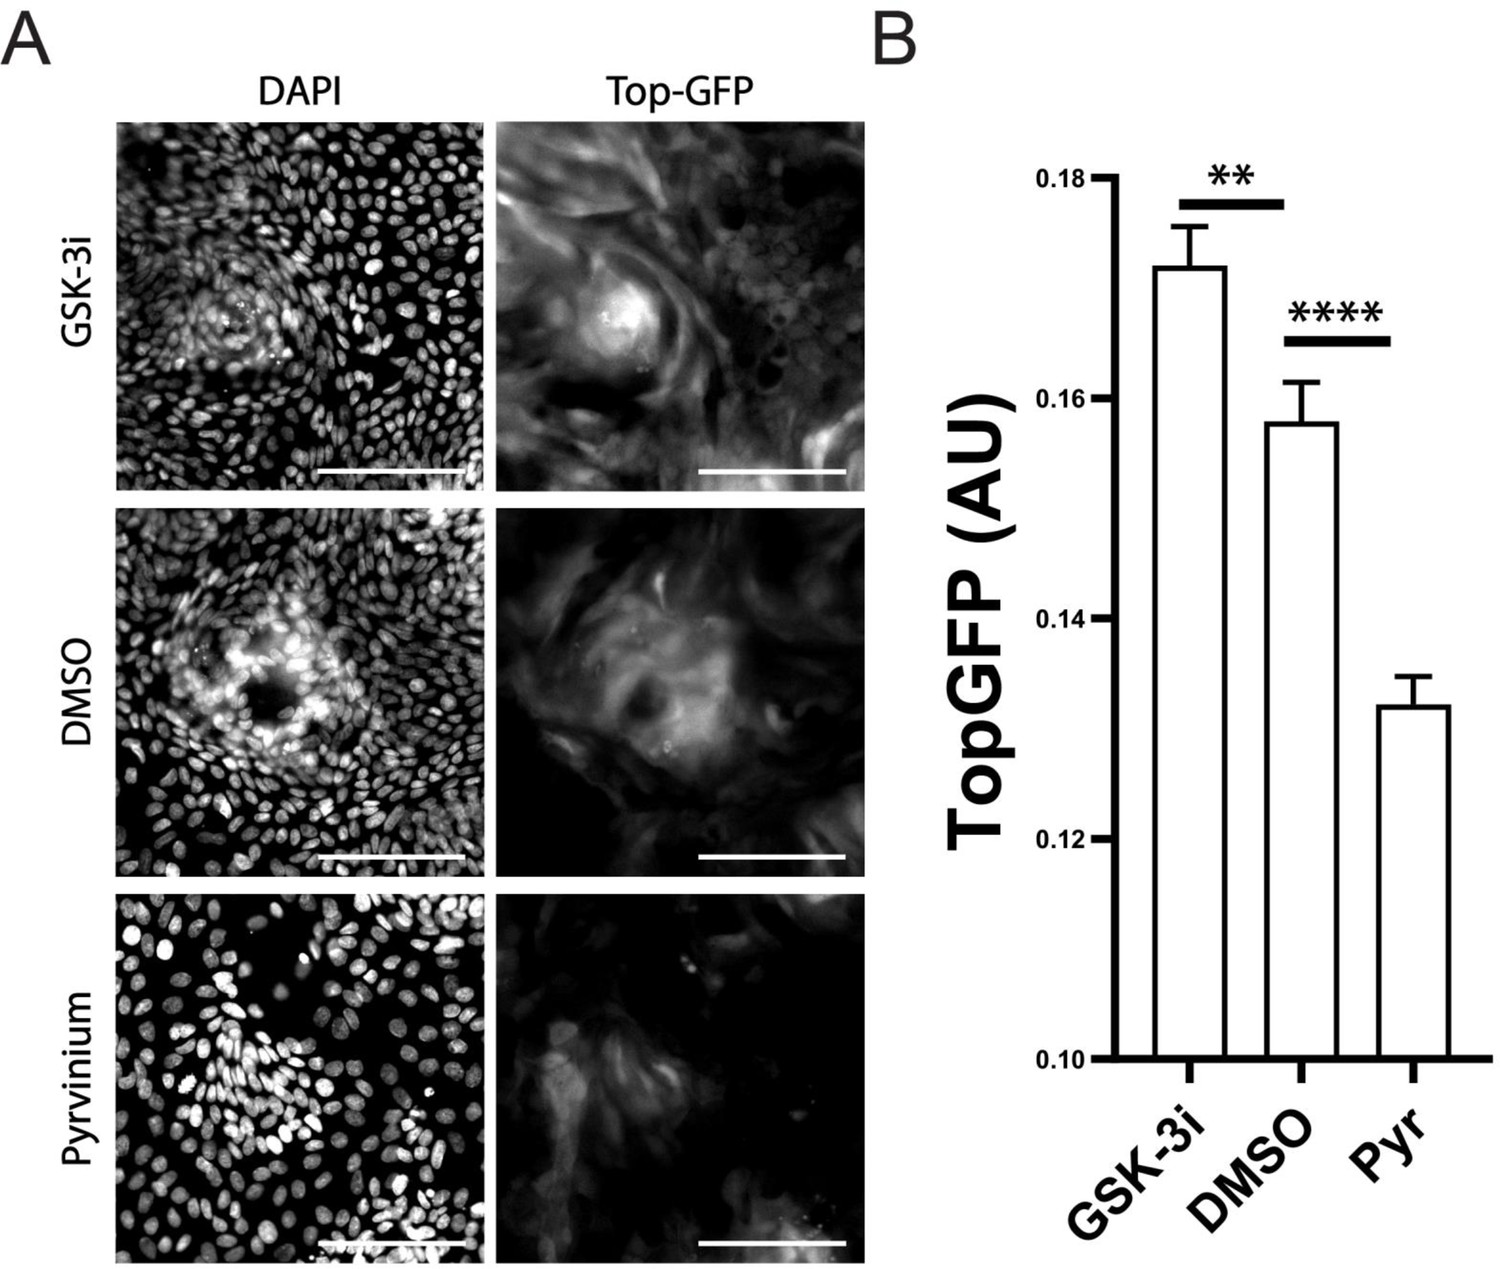
Pyrvinium Inhibits Wnt Signaling in Organoid Monolayers.
Organoids were treated with either 3 µM pyrvinium to block Wnt signaling or 10 µM GSK-3 inhibitor to stimulate the Wnt pathway for 72 hr. Cells were fixed and stained for DAPI. Total GFP fluorescence across the monolayer was measured and normalized by mCherry control to obtain TopGFP measurements per condition. Significance between treatment groups was determined by t-test. Scale bar = 100 µm.
Figure 6—figure supplement 2
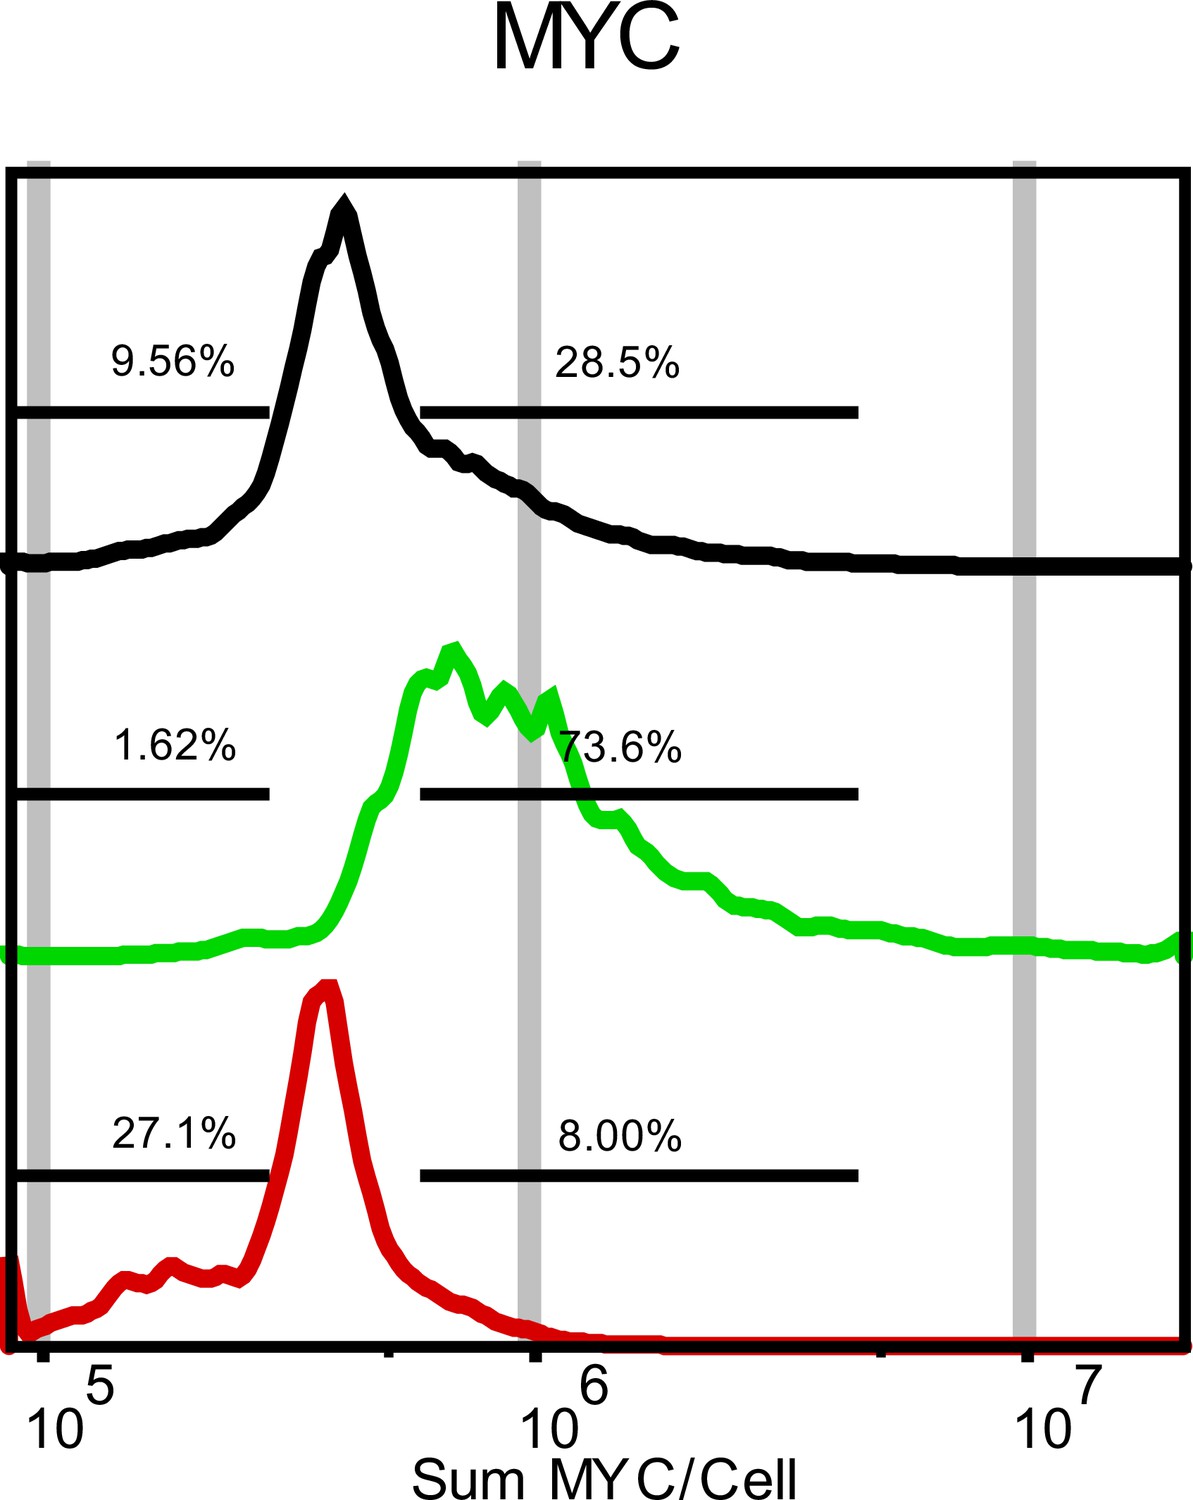
Quantification of MYC Transcript Levels Following Treatment with Either 100 nM PMA (RED) or 1 µM PD0325901 (MEKi-GREEN).
Data is represented as sum intensity of the FISH probe in each cell. Gates were made against untreated control to displaypopulation shift.
Figure 6—video 1
ERK-KTR is Activated by Wnt Deprivation.
Time course imaging of a single node. Channels from left to right: H2B (purple) and ERK-KTR (white). Images were acquired every 30 min for 23 hr. Organoids were incubated with complete media for 24 hr prior to imaging. Scale bar represents 100 μm.
Figure 6—video 2
ERK-KTR is Activated by Wnt Deprivation.
Time course imaging of a single node. Channels from left to right: H2B (purple) and ERK-KTR (white). Images were acquired every 30 min for 23 hr. Organoids were incubated without recombinant Wnt3a for 24 hr prior to imaging. Scale bar represents 100 μm.
Figure 7
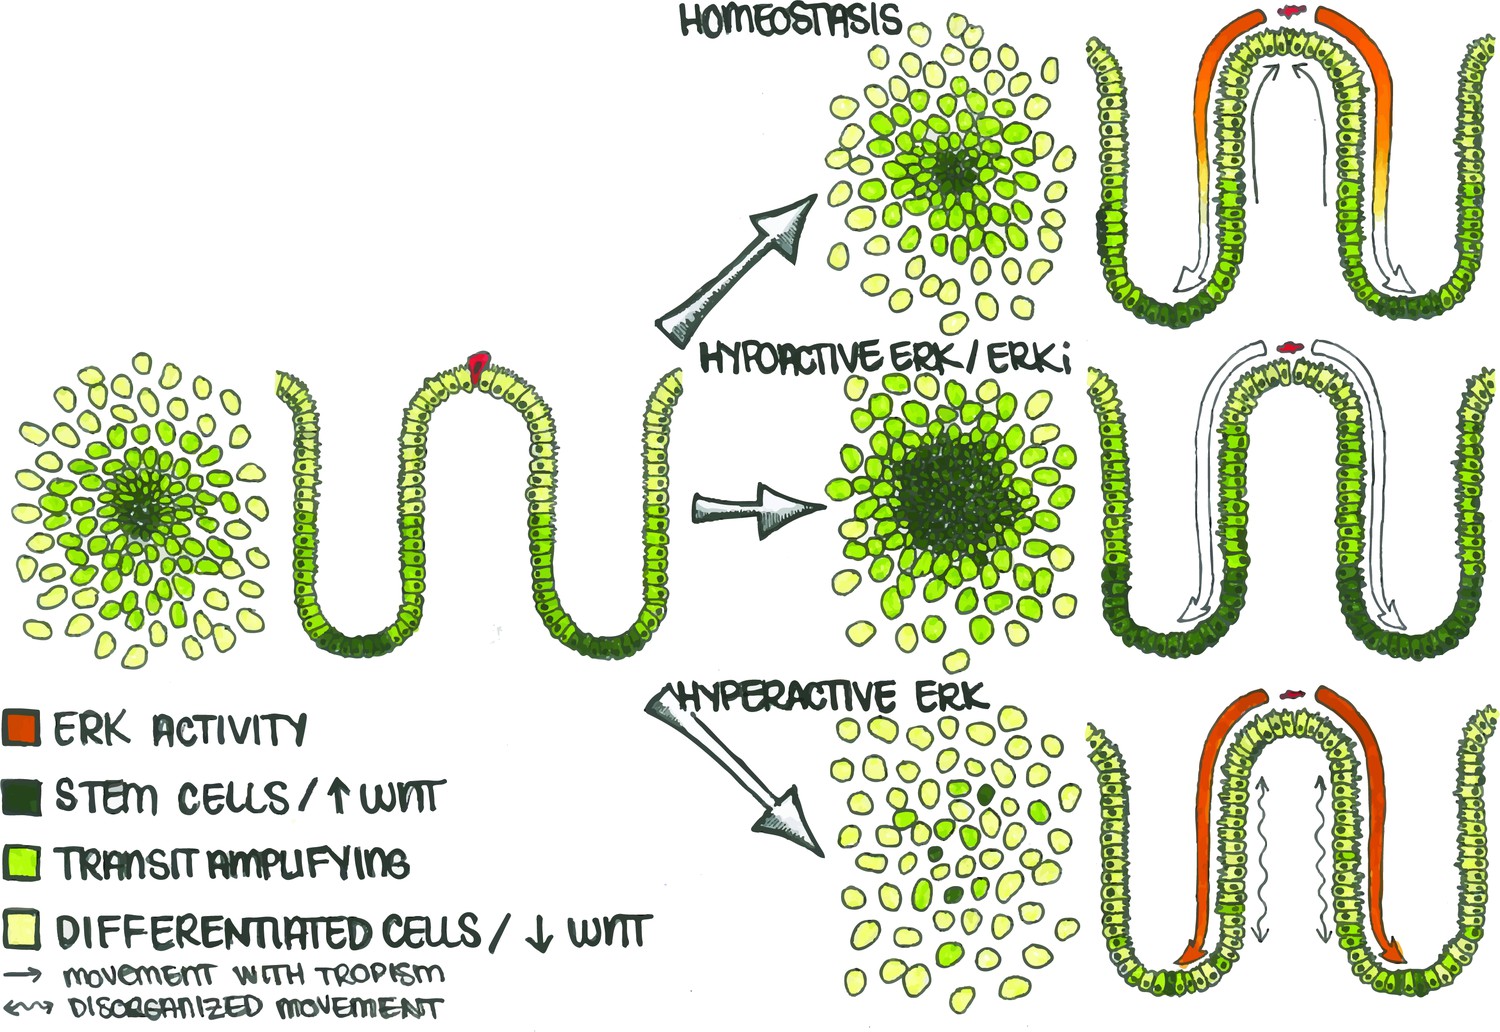
Apoptotic Cells Induce ERK Waves Which Limit the Stem Cell Compartment to a Defined Region.
In the human colon, differentiated cells (light green) eventually undergo cell death (red cell) and are replaced by stem (dark green) and transit amplifying (lime green) cells. During homeostasis (top), apoptosis in the differentiated cell region triggers an ERK wave which propagates across the epithelium. This wave both triggers nearby cells to migrate (straight arrows) towards the site of apoptosis to maintain barrier function and also inhibits WNT signaling in order to maintain the correct proportion of stem, transit-amplifying, and differentiated cells. If ERK is inhibited (middle), the stem cell compartment expands and directional migration is lost. Conversely, if ERK is hyperactivated (bottom), cell movement becomes disorganized (wavy arrows) and spatially distinct cellular compartments are lost.
Additional files
-
Supplementary file 1
scRNA FISH custom probe sequences used for KRT20, MYC, and KRT20 are shown.
- https://cdn.elifesciences.org/articles/78837/elife-78837-supp1-v2.xlsx
-
Transparent reporting form
- https://cdn.elifesciences.org/articles/78837/elife-78837-transrepform1-v2.pdf
-
Source data 1
Technical and Biological Replicates Performed.
- https://cdn.elifesciences.org/articles/78837/elife-78837-data1-v2.zip
Download links
A two-part list of links to download the article, or parts of the article, in various formats.
Downloads (link to download the article as PDF)
Open citations (links to open the citations from this article in various online reference manager services)
Cite this article (links to download the citations from this article in formats compatible with various reference manager tools)
Live-cell imaging in human colonic monolayers reveals ERK waves limit the stem cell compartment to maintain epithelial homeostasis
eLife 11:e78837.
https://doi.org/10.7554/eLife.78837


