Murine endothelial serine palmitoyltransferase 1 (SPTLC1) is required for vascular development and systemic sphingolipid homeostasis
- Vascular Biology Program, Boston Children’s Hospital, Department of Surgery, Harvard Medical School, United States
- Unit of Integrative Metabolomics, Institute of Environmental Medicine, Karolinska Institute, Sweden
- Department of Ophthalmology, Boston Children's Hospital, Harvard Medical School, United States
- Department of Respiratory Medicine and Allergy, Karolinska University Hospital, Sweden
- Gunma University Initiative for Advanced Research, Gunma University, Japan
- Center for Interdisciplinary Cardiovascular Sciences, Cardiovascular Medicine, Brigham and Women's Hospital, Harvard Medical School, United States
- Genetics and Biochemistry Branch, National Institute of Diabetes and Digestive and Kidney Diseases, National Institutes of Health, United States
Figures
Figure 1 with 4 supplements
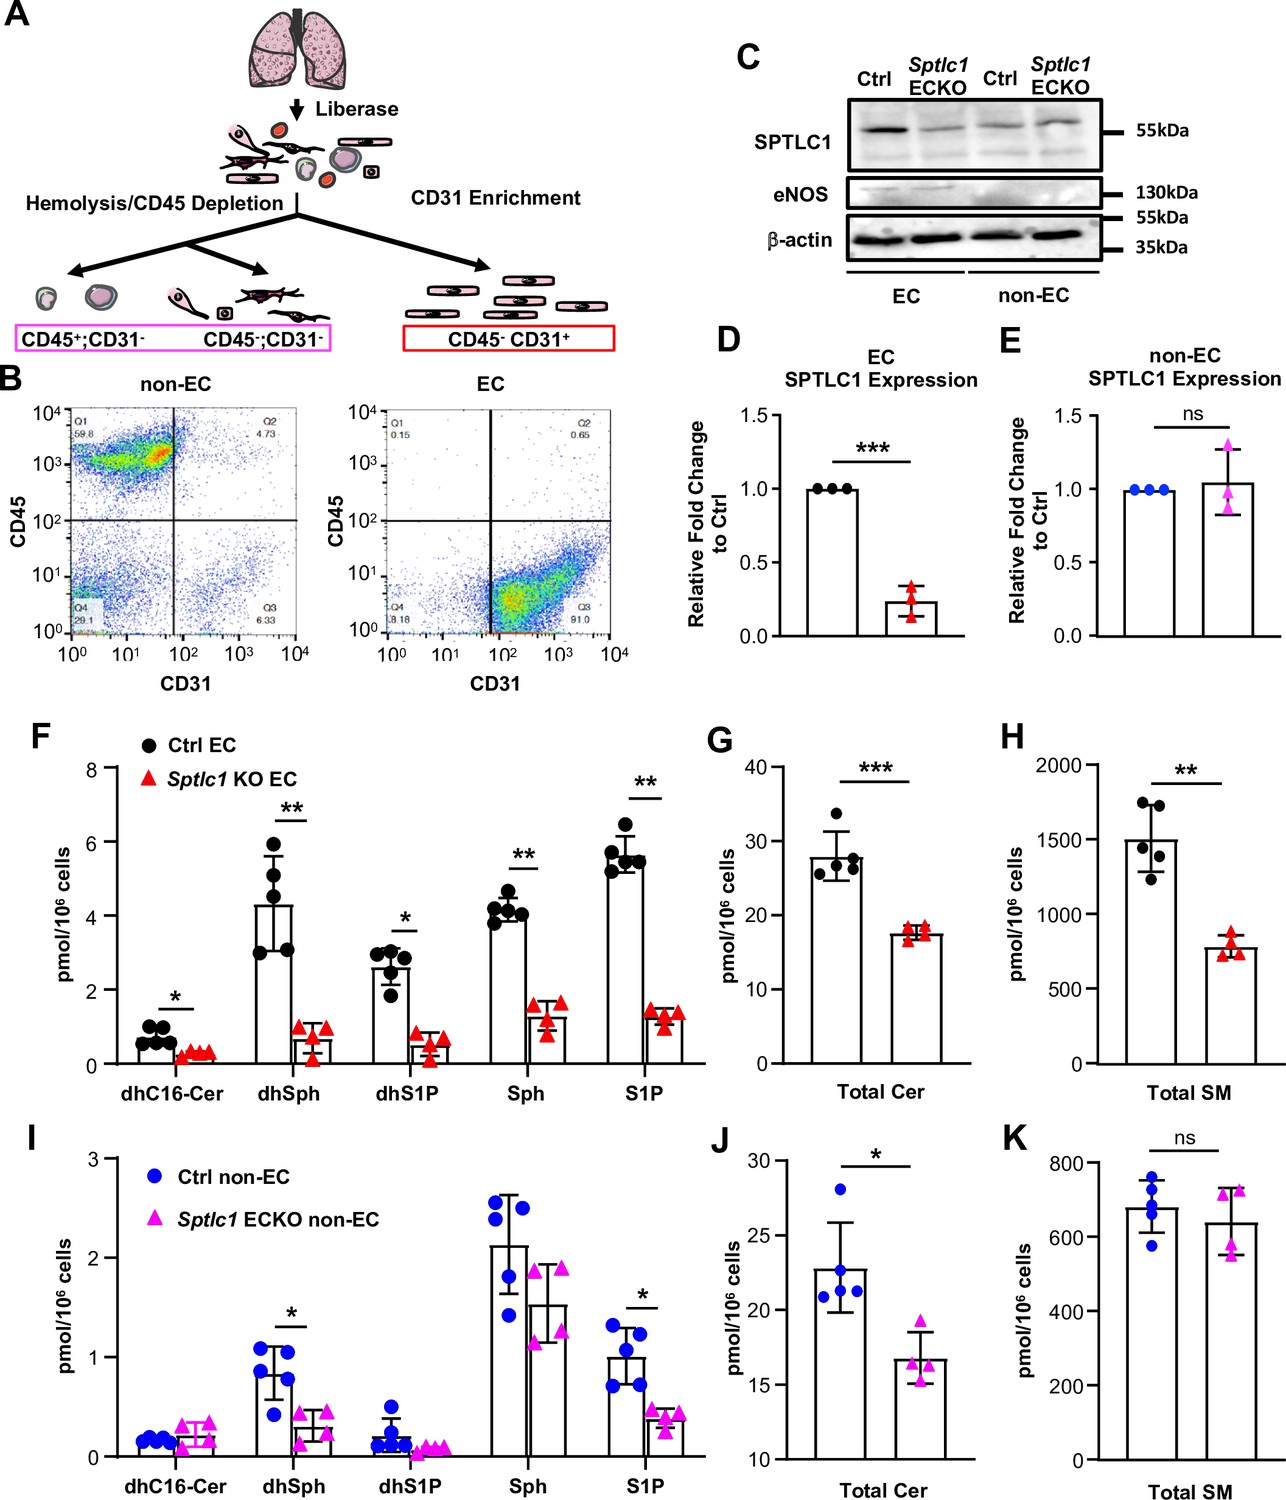
Ablation of Sptlc1 in EC reduces SL content in both EC and non-EC cell population of the lung.
(A) Scheme of lung EC and non-EC isolation procedure used in this figure. (B) Representative flow cytometry analysis for determination of lung non-EC and EC population purities. Non-EC is identified as CD45+/-; CD31- cells (Q1 + Q4). EC is identified as CD45-; CD31 + cells (Q3) (n=4 for both EC and non-EC). (C) EC and non-EC from Ctrl and Sptlc1 ECKO lungs were analyzed by Western Blotting for SPTLC1 and eNOS expressions. eNOS was used as an EC marker to demonstrate purity of each population. β-actin was used as an internal control. Relative fold change of SPTLC1 to Ctrl in EC and non-EC population were normalized to β-actin and quantified in (D) an (E) (n=3 for both genotypes). SL content in Ctrl and Sptlc1 KO EC was determined by LC-MS/MS, including dhC16-Cer, dhSph, dhS1P, Sph and S1P in (F), total Cer content in (G), and SM in (H) (n=5 for Ctrl EC, n=4 for Sptlc1 KO EC). SL content in Ctrl and Sptlc1 KO non-EC was determined by LC-MS/MS, including dhC16-Cer, dhSph, dhS1P, Sph, and S1P in (I), total Cer content in (J), and total SM content in (K) (n=5 for Ctrl non-EC, n=4 for Sptlc1 KO non-EC). Values of lipidomic results can be accessed in Figure 1—source data 1. Data are expressed as mean ± SD. Statistical significance was determined by unpaired t test. *p<0.05; **p<0.01. ***p<0.001. ns, non-significant.
-
Figure 1—source data 1
Levels of dhC16-Cer, dhSph, dhS1P, Sph, S1P, Cer, and SM in lung EC and non-EC populations of Ctrl and Sptlc1 ECKO mice.
- https://cdn.elifesciences.org/articles/78861/elife-78861-fig1-data1-v3.xlsx
-
Figure 1—source data 2
Original blots of EC and non-EC from Ctrl and Sptlc1 ECKO lungs.
- https://cdn.elifesciences.org/articles/78861/elife-78861-fig1-data2-v3.zip
Figure 1—figure supplement 1

Sptlc1 ECKO mice exhibit similar body weight and blood chemistry as control mice.
(A) Schematic diagram illustrates generation of Sptlc1 ECKO mice. (B) Body weight was measured at indicated time after tamoxifen injection in Ctrl and Sptlc1 ECKO mice (n=3 for Ctrl, n=3–4 for Sptlc1 ECKO). (C) Blood chemistry analysis was performed using Ctrl and Sptlc1 ECKO serum via VETSCAN VS2 Chemistry Analyzer (n=4 for Ctrl, n=3 for Sptlc1 ECKO). Statistical significance in (B) was determined by One way-ANOVA test. Statistical significance in (C) was determined by unpaired t test. Data are expressed as mean ± SD. ns, non-significant.
Figure 1—figure supplement 2
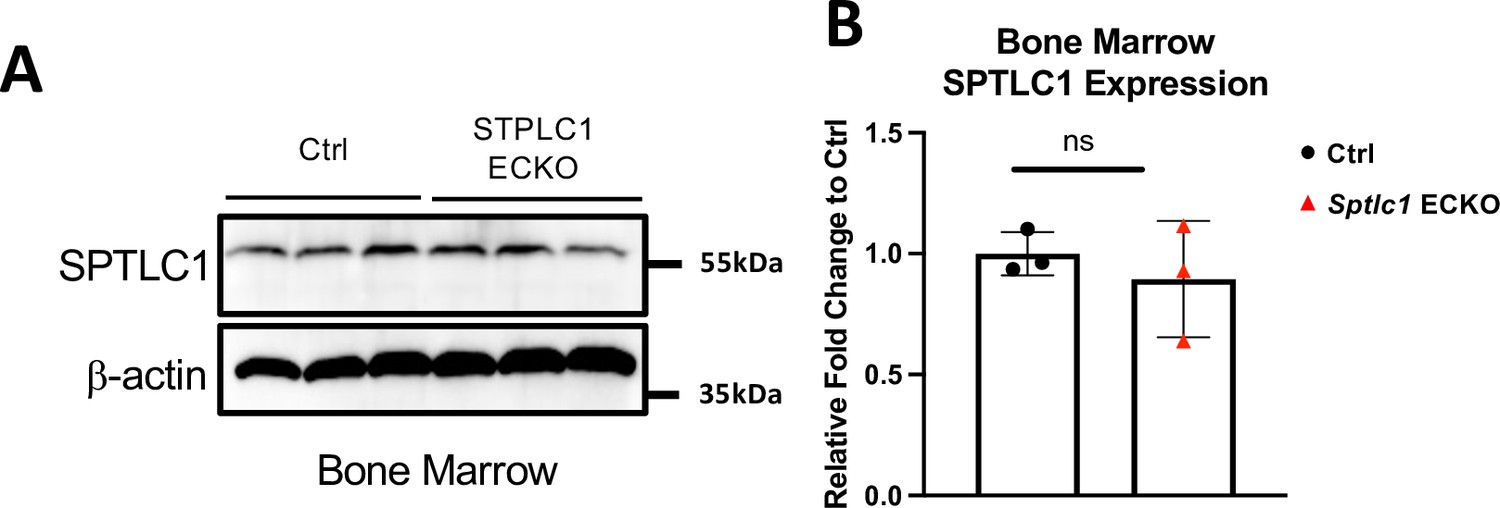
SPTLC1 expressions are not affected in bone marrow of Sptlc1 ECKO mice.
(A) Bone marrow cells isolated from Ctrl and Sptlc1 ECKO mice were analyzed by western blotting for SPTLC1 expressions. β-actin was used as an internal control (n=3 for Ctrl, n=3 for Sptlc1 ECKO). (B) Relative fold change to Ctrl samples was quantified. Statistical significance was determined by unpaired t test. Data are expressed as mean ± SD. ns, non-significant.
-
Figure 1—figure supplement 2—source data 1
Original blots of lysates from Ctrl and Sptlc1 ECKO bone marrows.
- https://cdn.elifesciences.org/articles/78861/elife-78861-fig1-figsupp2-data1-v3.zip
Figure 1—figure supplement 3
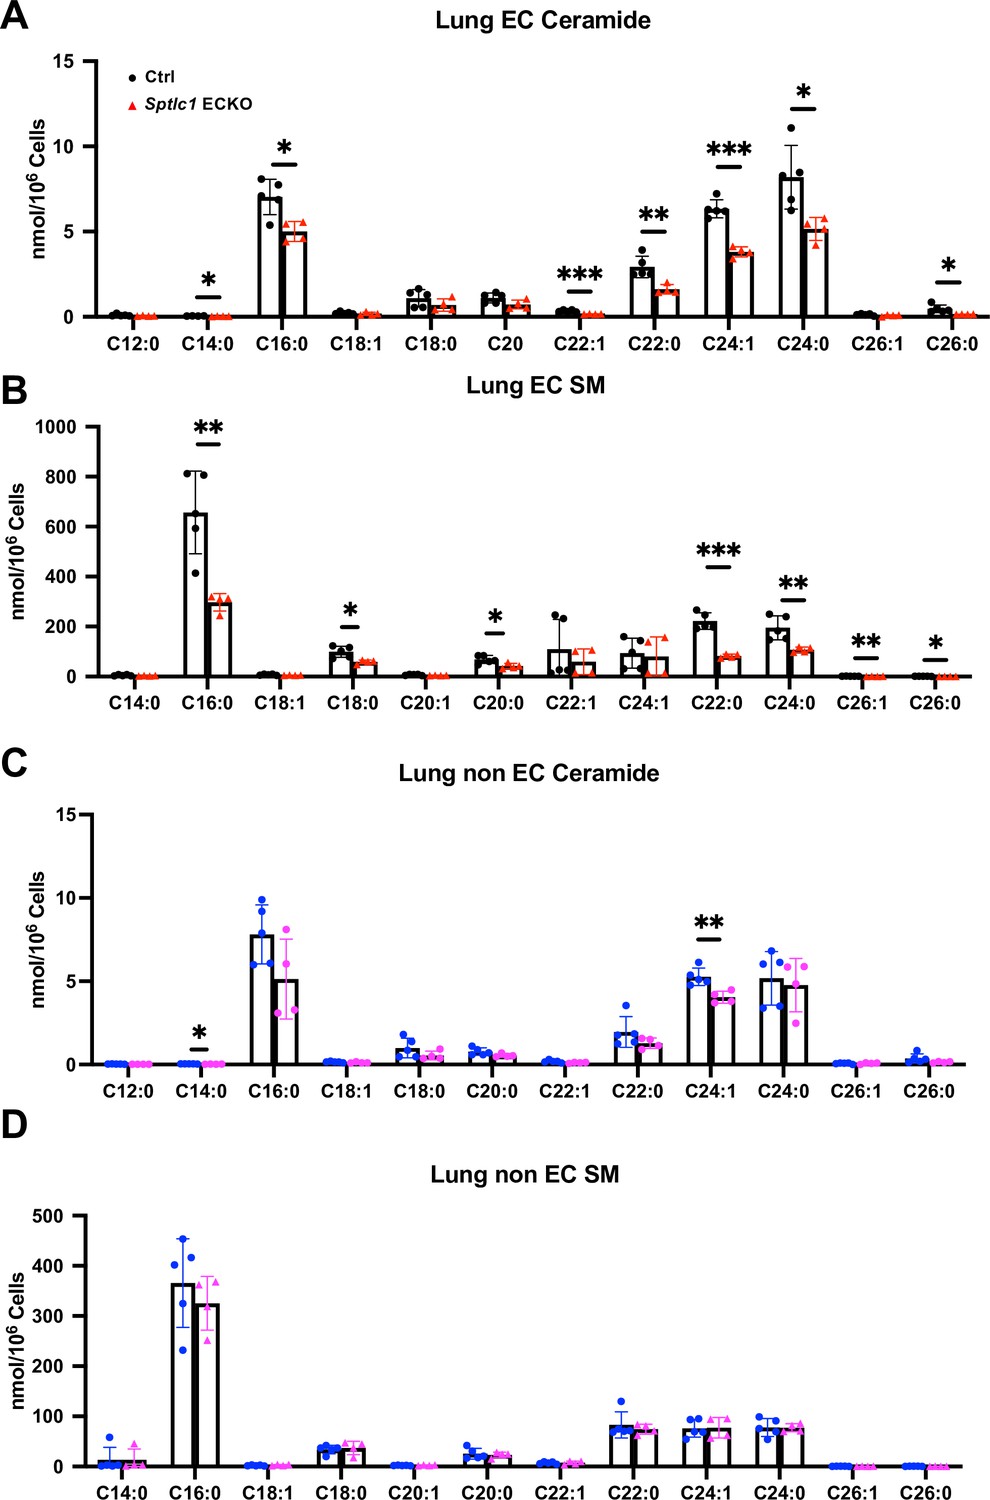
Cer and SM are reduced in Sptlc1 KO EC while they are mildly affected in non-EC.
(A) Lung EC Cer with different chain lengths in Ctrl and Sptlc1 ECKO mice were measured by LC-MS/MS (n=5 for Ctrl EC, n=4 for Sptlc1 KO EC). (B) Lung EC SMs with different chain lengths in Ctrl and Sptlc1 ECKO mice were measured by LC-MS/MS (n=5 for Ctrl EC, n=4 for Sptlc1 KO EC). (C) Lung non-EC Cer with different chain lengths in Ctrl and Sptlc1 ECKO mice were measured by LC-MS/MS (n=5 for Ctrl non-EC, n=4 for Sptlc1 KO non-EC). (D) Lung non-EC SMs with different chain lengths in Ctrl and Sptlc1 ECKO mice were measured by LC-MS/MS (n=5 for Ctrl non-EC, n=4 for Sptlc1 KO non-EC). Statistical significance was determined by unpaired t test. Data are expressed as mean ± SD. *p<0.05. **p<0.01. ***p<0.001. ns, nonsignificant.
Figure 1—figure supplement 4

eNOS expressions and phosphorylation of eNOS are not affected in Sptlc1 KO EC.
(A) Lung EC isolated from Ctrl and Sptlc1 ECKO mice were analyzed by Western Blotting for eNOS, phospho-eNOS and SPTLC1 expressions. β-actin was used as an internal control (n=4 for Ctrl, n=4 for Sptlc1 ECKO). (B) Relative fold change to β-actin signal was quantified. Statistical significance was determined by unpaired t test. Data are expressed as mean ± SD. ns, non-significant.
-
Figure 1—figure supplement 4—source data 1
Original blots of EC and non-EC from Ctrl and Sptlc1 ECKO lungs.
- https://cdn.elifesciences.org/articles/78861/elife-78861-fig1-figsupp4-data1-v3.zip
Figure 2
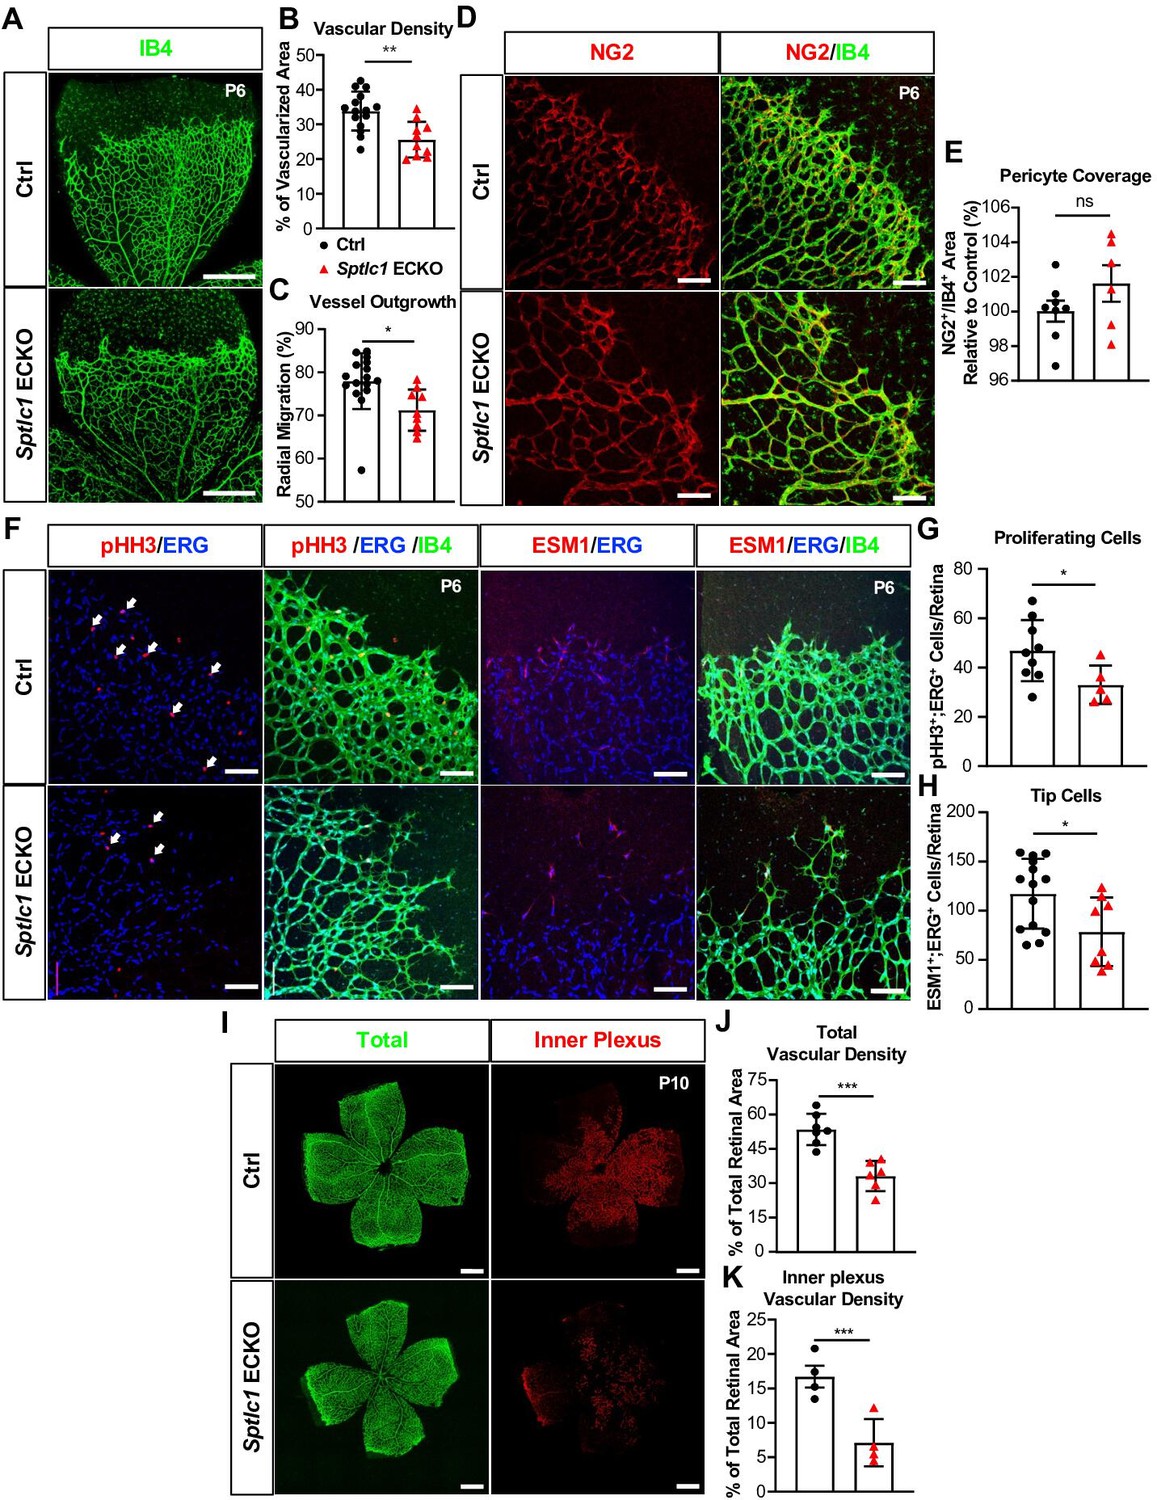
Retinal vascular development is delayed in the absence of Sptlc1 in EC.
(A) Retinal vascular plexus at P6 of Ctrl and Sptlc1 ECKO mice were immunostained with Isolectin-B4 (IB4). Vascular density and outgrowth were quantified in (B) and (C) (n=16 for Ctrl, n=9 for Sptlc1 ECKO). (D) Pericytes were immunostained with NG2 and pericytes coverage was quantified by NG2+/IB4+ area as shown in (E) (n=8 for Ctrl, n=6 for Sptlc1 ECKO). (F) Proliferating cells and tip cells were immunostained with phospho-histone H3 (pHH3) and ESM1 respectively. ERG immunostaining was served as an EC marker. White arrows indicate pHH3+/ERG+ cells and quantified in (G) (n=8 for Ctrl, n=6 for Sptlc1 ECKO). Tip cells were quantified by ESM1+/ERG+ cells as shown in (H) (n=14 for Ctrl, n=8 for Sptlc1 ECKO). (I) Retinal vascular plexus at P10 of Ctrl and Sptlc1 ECKO mice were immunostained with IB4. Representative images of total and inner plexus were shown and vascular density was quantified in (J) and (K) (n=4 for Ctrl, n=4 for Sptlc1 ECKO). Data are expressed as mean ± SD. Statistical significance was determined by unpaired t test. *p<0.05; **p<0.01; ***p<0.001. ns, nonsignificant. Scale bar in (A): 500 μm, in (D) and (F): 100 μm, in (I) and (L): 500 μm.
Figure 3 with 2 supplements
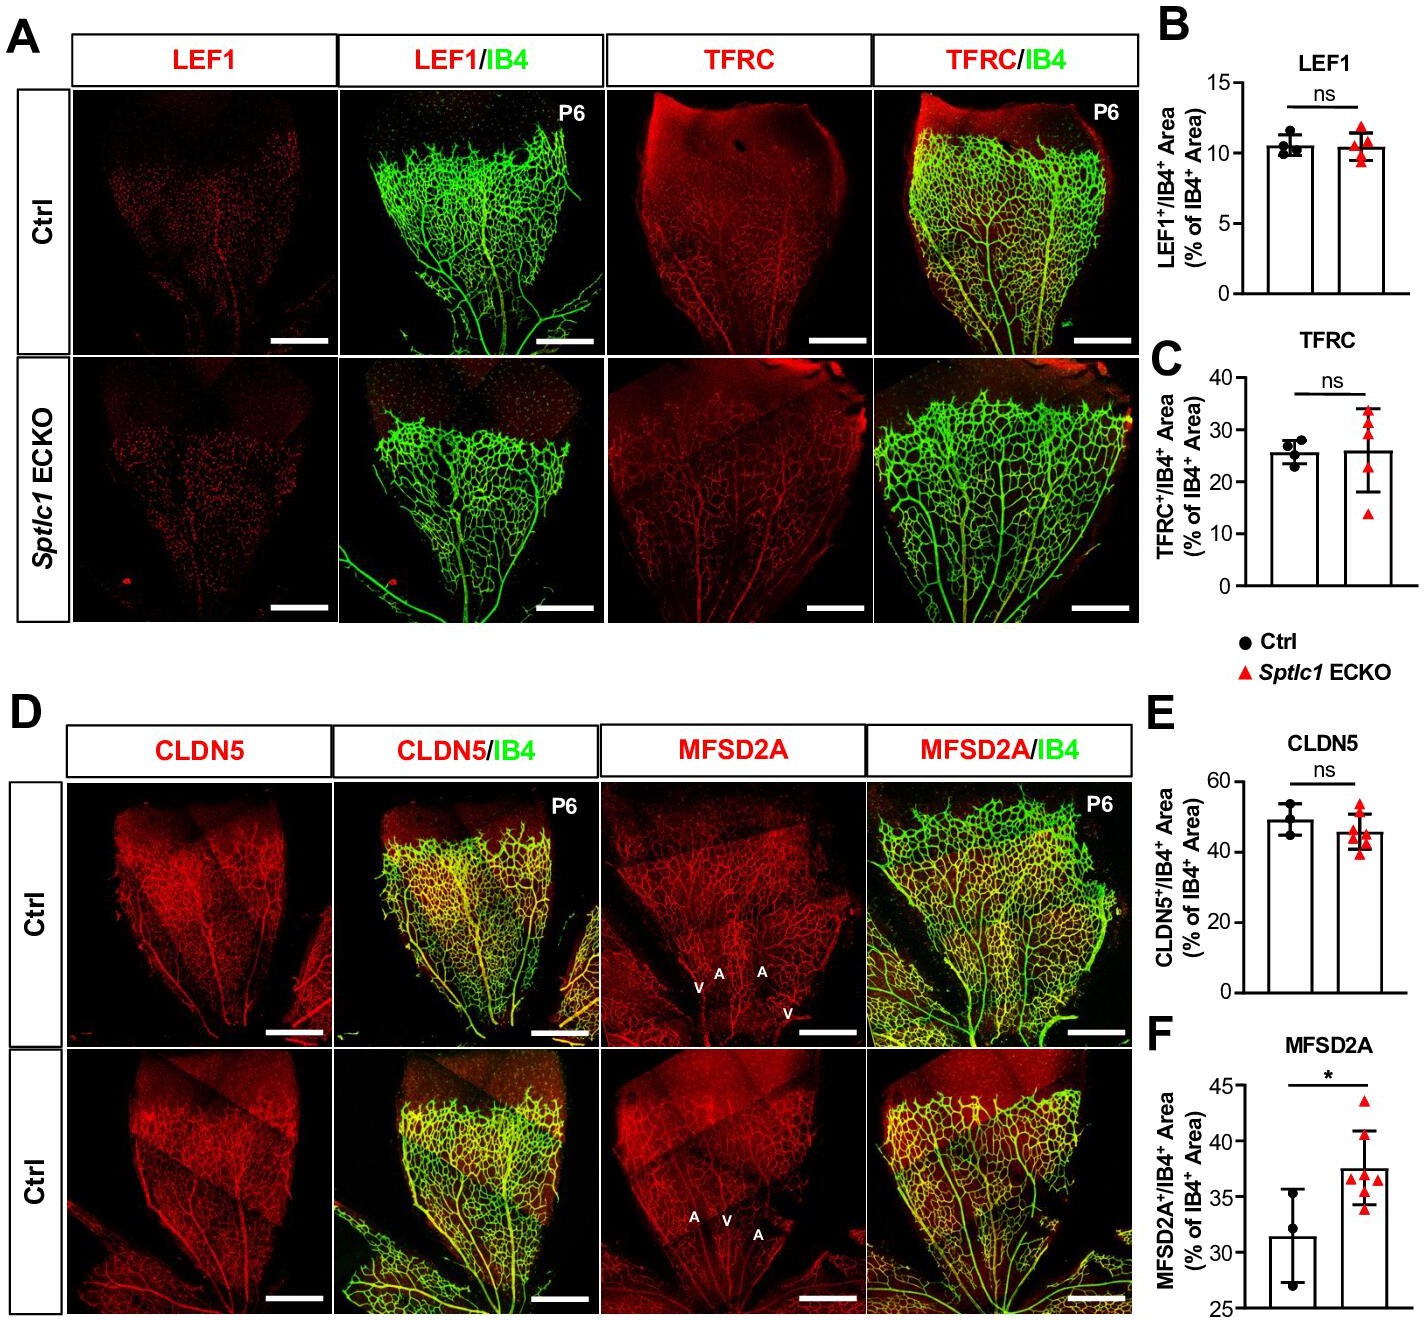
Blood-retina barrier (BRB) protein expressions are not reduced in the retina of Sptlc1 ECKO mice.
(A) BRB associated proteins including LEF1 and TFRC in Ctrl and Sptlc1 ECKO P6 retina were immunostained and quantified by colocalization with IB4 staining shown in (B) and (C) (n=4 for Ctrl, n=5 for Sptlc1 ECKO). (D) Tight junction protein, CLDN5 in Ctrl and Sptlc1 ECKO P6 retina were immunostained and quantified by colocalization with IB4 staining shown in (E) (n=3 for Ctrl, n=7 for Sptlc1 ECKO). BRB specific protein, MFSD2A, in Ctrl and Sptlc1 ECKO P6 retina were immunostained and quantified by colocalization with IB4 staining shown in (F) (n=3 for Ctrl, n=7 for Sptlc1 ECKO). Arterial and venous regions are marked as ‘A’ and ‘V’. Data are expressed as mean ± SD. Statistical significance was determined by unpaired t test. *p<0.05; ns, non-significant. Scar bars, 100 μm.
Figure 3—figure supplement 1
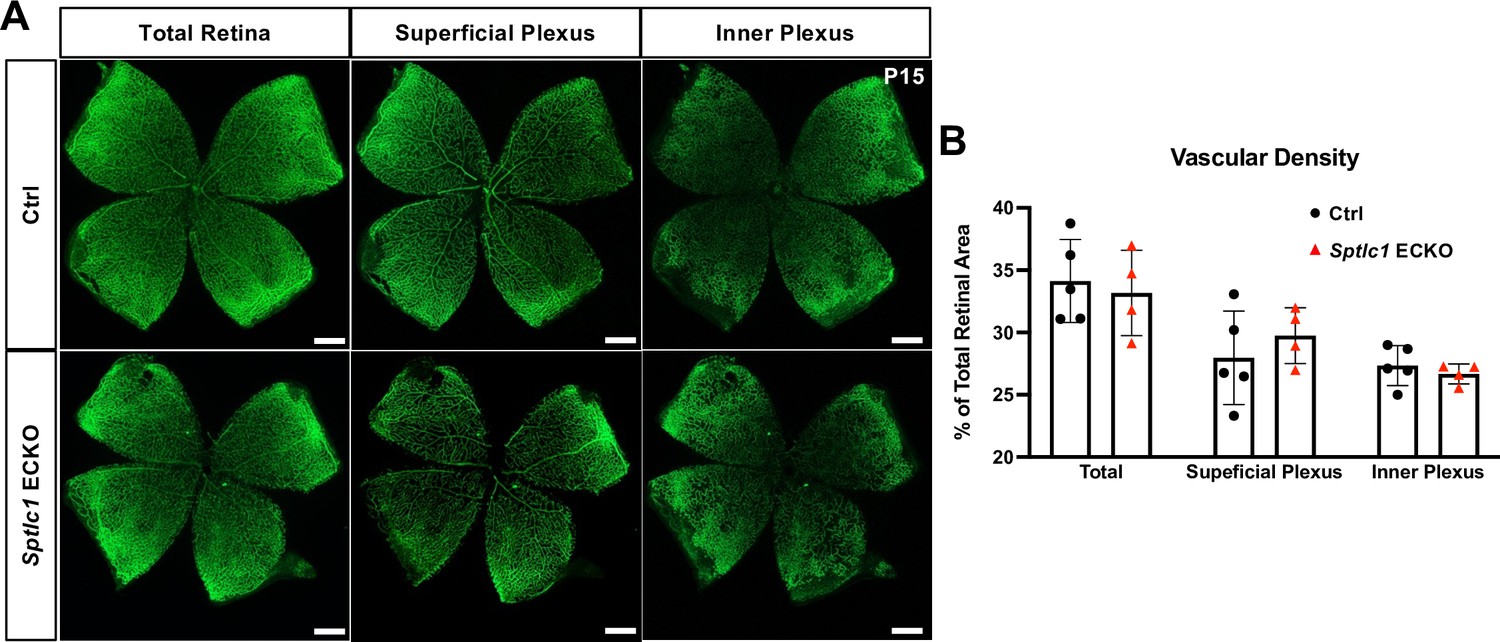
Retinal vascular development is normalized at P15 in Sptlc1 ECKO mice.
(A) Retinal vascular plexus at P15 of Ctrl and Sptlc1 ECKO mice were immunostained with IB4. Vascular density of total vasculature, superficial plexus and inner plexus were quantified in (B) (n=5 for Ctrl, n=4 for Sptlc1 ECKO). Statistical significance was determined by unpaired t test. Data are expressed as mean ± SD. Scale bars, 500 μm.
Figure 3—figure supplement 2
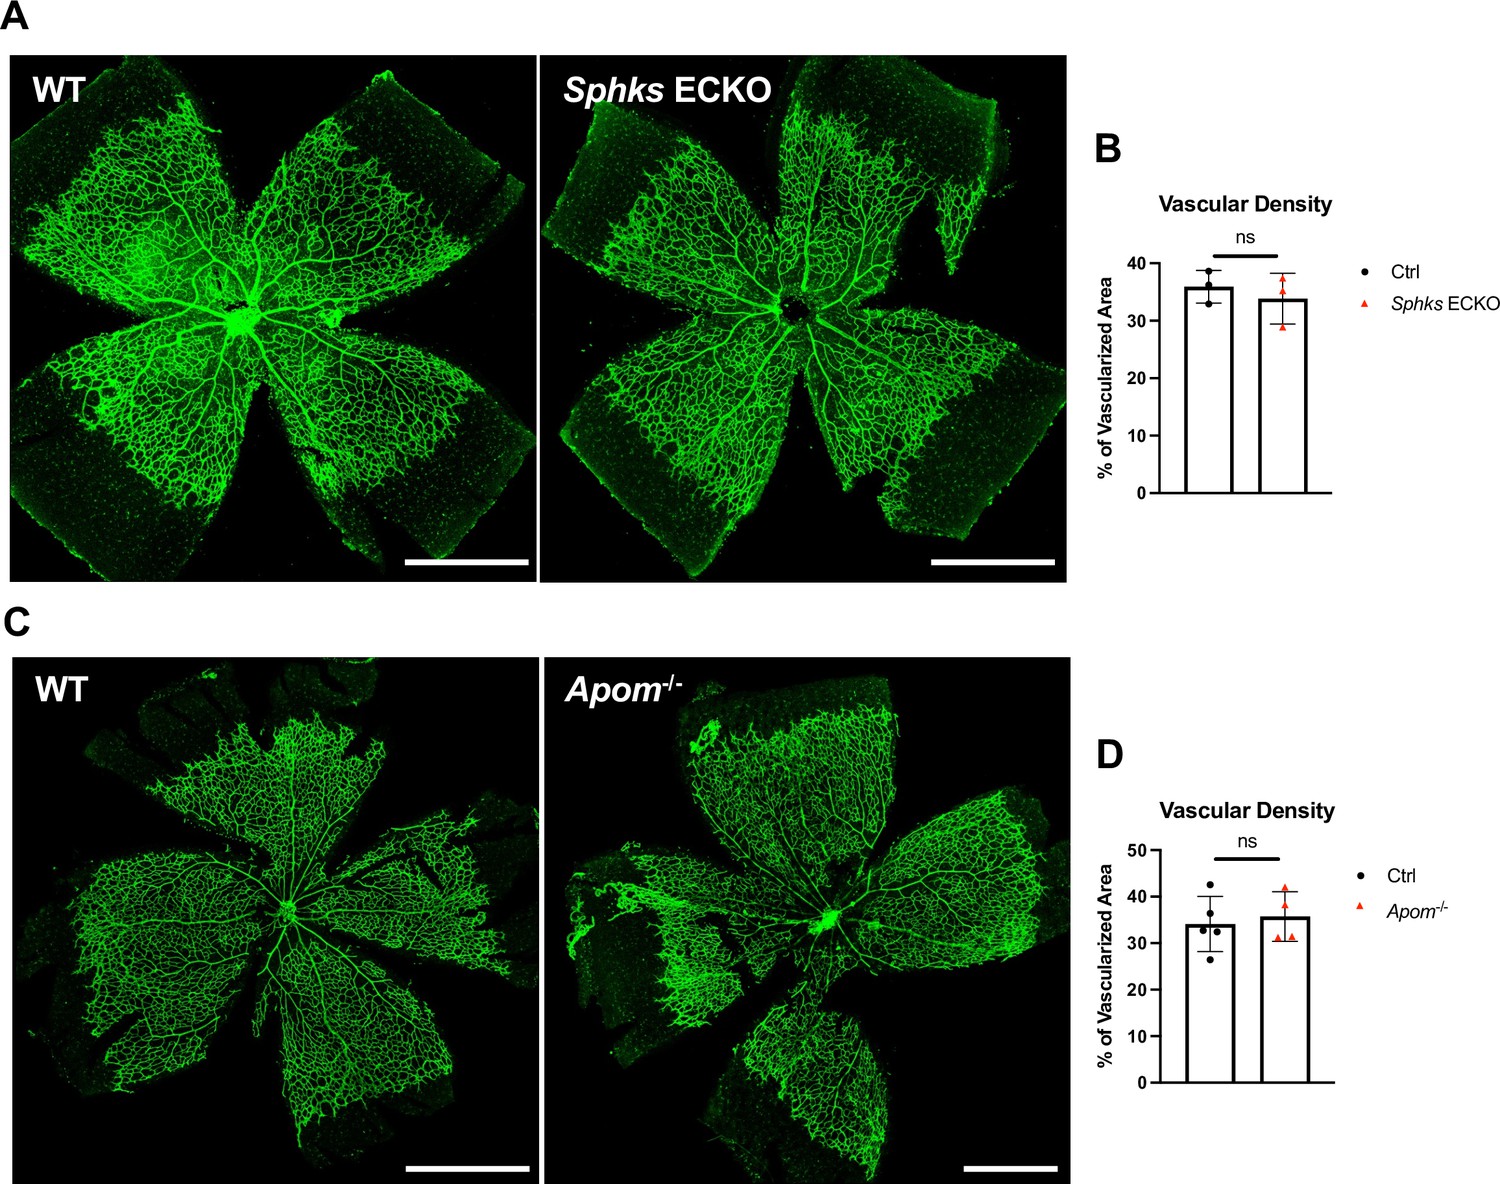
Retinal vascular development is not affected in SK ECKO and Apom-/- mice.
(A) Retinal vascular plexus at P6 of Ctrl (Sphk1fl/fl; Sphk2-/-), and Sphks ECKO (Sphk1fl/fl;Sphk2-/-; Cdh5-Cre) were immunostained with IB4. Vascular density was quantified in (B) (n=3 for Ctrl, n=3 for Sphks ECKO). (C) Retinal vascular plexus at P8 of WT and Apom-/- mice were immunostained with IB4. Vascular density was quantified in (D). (n=5 for WT, n=4 for Apom-/-) Statistical significance was determined by unpaired t test. Data are expressed as mean ± SD. Scale bars, 500 μm. ns, non-significant.
Figure 4
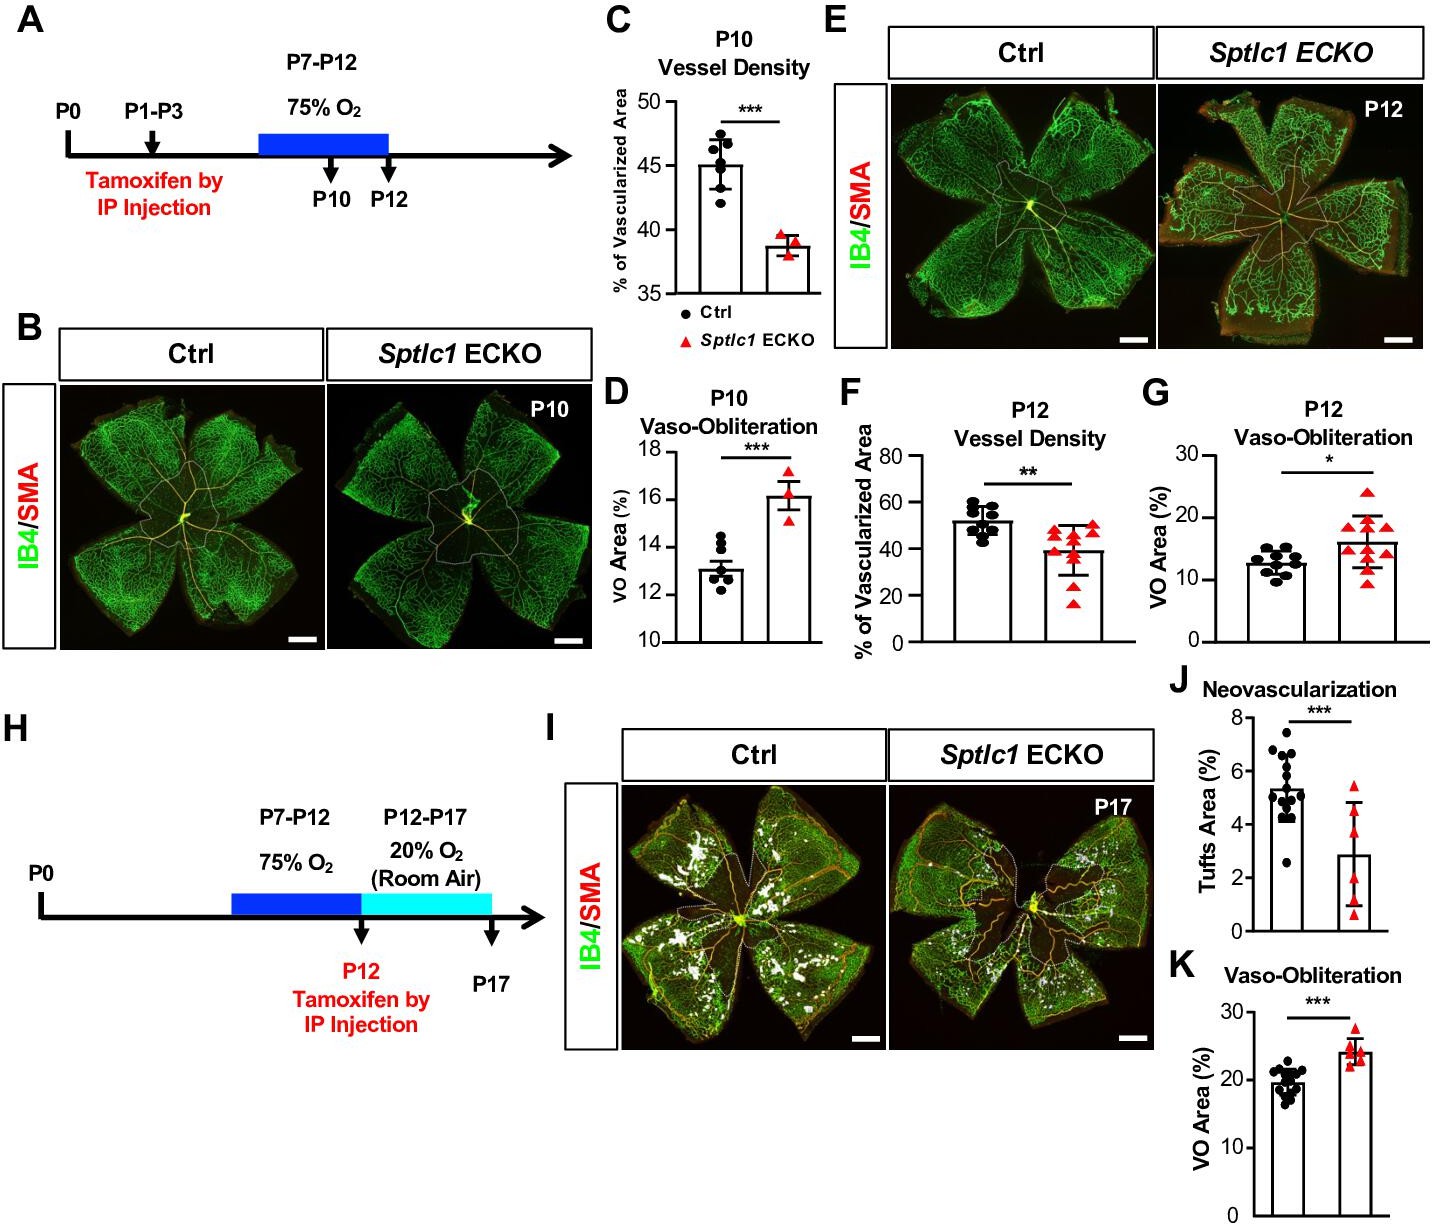
Sptlc1 ECKO mice show enhanced vaso-obliteration and reduced neovascularization in oxygen induced retinopathy model.
(A) Schematic of timeline for tamoxifen treatment, oxygen challenge and tissue collection used from (B) to (G). (B) P10 retinas of control and Sptlc1 ECKO mice were immunostained with IB4 and smooth muscle actin (SMA). Vascular density and vaso-obliteration (dashed line area) were quantified in (C) and (D) (n=7 for Ctrl, n=3 for Sptlc1 ECKO). (E) P12 retinas of control and Sptlc1 ECKO mice were stained with IB4 and SMA. Vascular density and vaso-obliteration (dashed line area) were quantified in (F) and (G). (n=10 for Ctrl, n=11 for Sptlc1 ECKO). (H) Schematic of timeline for tamoxifen treatment, oxygen challenge and tissue collection used from (I) to (K). Note that tamoxifen was administered after 75% O2 challenge. (I) P17 retinas of control and Sptlc1 ECKO mice were immunostained with IB4 and SMA. Neovascularization (white area) and vaso-obliteration (dashed line area) were quantified in (J) and (K) (n=15 for Ctrl, n=6 for Sptlc1 ECKO). Data are expressed as mean ± SD. Statistical significance was determined by unpaired t test. *p<0.05; **p<0.01, ***p<0.001. ns, non-significant. Scale bars, 500 μm.
Figure 5
Loss of SPT activity in EC impairs VEGF signaling via modulation of lipid rafts.
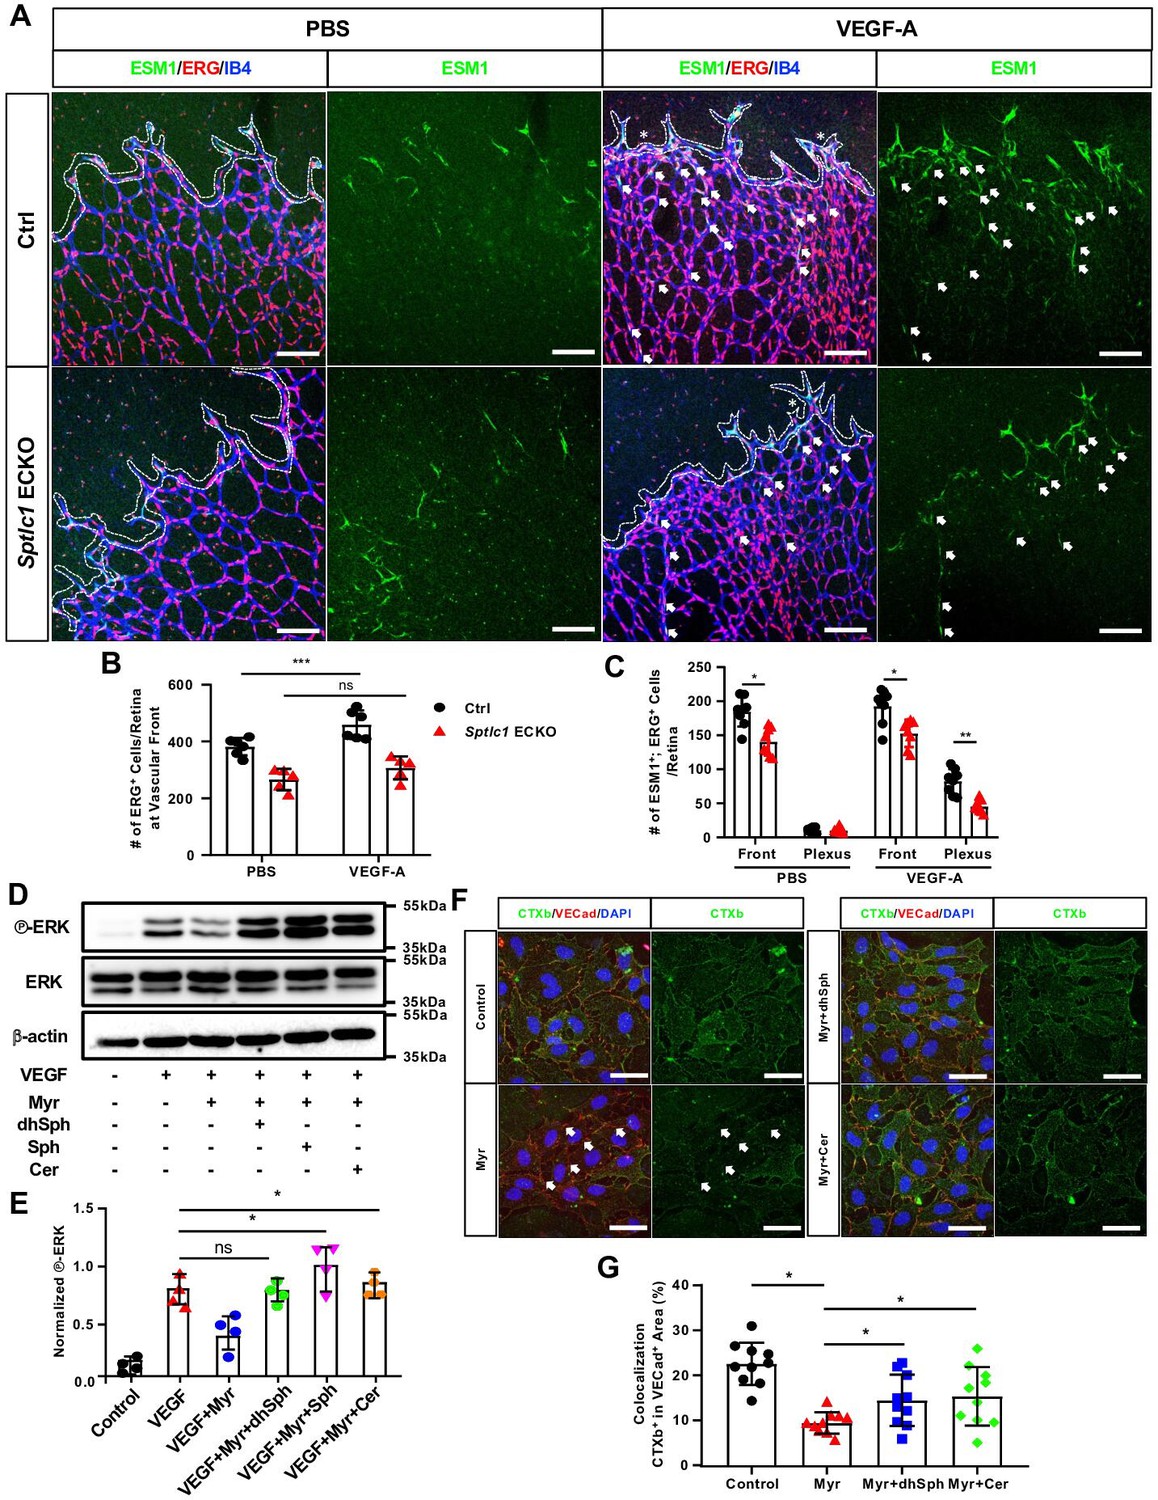
(A) P6 retinas of control and Sptlc1 ECKO mice 4 hr post intraocular administration of mouse VEGF-A (50 ng/retina) or vehicle (PBS) were immunostained with ESM1, ERG and IB4. ERG numbers in the vascular front regions (dashed line area) were quantified in (B). Asterisks indicate dilated vessel area. ESM1+/ERG+ cells in the vascular front and capillary plexus (outside of dashed line area) were quantified in (C) (n=8 for Ctrl, n=8 for Sptlc1 ECKO). Arrows indicate ectopic tip cells induced by VEGF treatment in capillary plexus regions. (D) HUVECs treated with Myriocin (Myr), dhSph, Sph and Cer followed by 5 min VEGF-A (50 ng/mL) were analyzed by western blotting for total and phospho-ERK. (E) Relative fold change to phosphorylation of ERK was first normalized to total ERK then toβ-actin as internal control (n=4). (F) HUVECs treated with Myr, dhSph, and Sph were immunostained with conjugated CTxb to label lipid rafts and VECad to label plasma membrane. Arrows indicate loss of CTXb signal in VECad+ area by Myr treatment. Percentage of CTXb signal colocalization in VECad+ area was quantified in (G) (n=10 in each condition from two independent experiment). Data are expressed as mean ± SD. Statistical significance was determined by unpaired t test. *p<0.05; **p<0.01; ***p<0.001, ns, non-significant. Scale bars in (A): 100 μm. and in (F): 50 μm.
-
Figure 5—source data 1
Original blots of HUVEC lysates treated with VEGF, Myr and different of SL.
- https://cdn.elifesciences.org/articles/78861/elife-78861-fig5-data1-v3.zip
Figure 6
Sptlc1 ECKO displays reduced SL content in circulation.
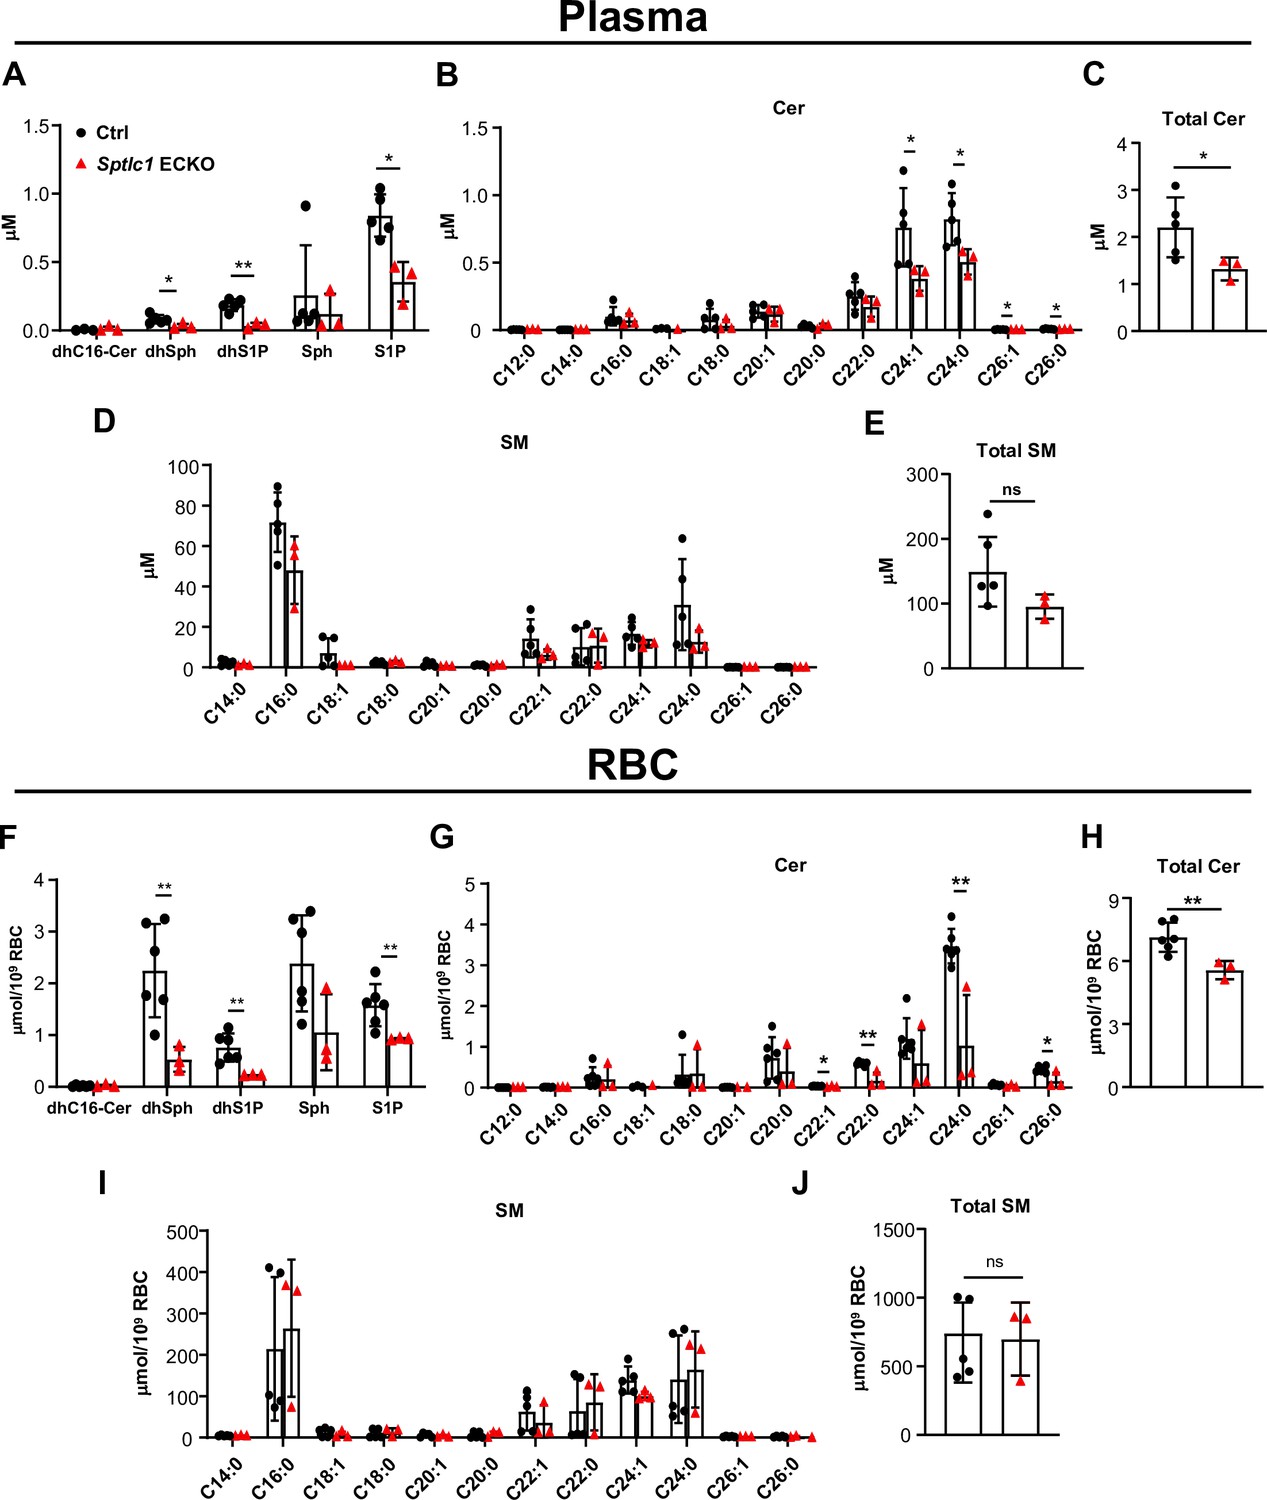
SL content in plasma from Ctrl and Sptlc1 ECKO mice was determined by LC-MS/MS, including dhC16-Cer, dhSph, dhS1p, Sph and S1P in (A), Cer with different fatty acyl chain length in (B), total Cer content in (C), and SM with different fatty acyl chain length in (D), and total SM in (E) (n=5 for Ctrl, n=3 for Sptlc1 ECKO). SL content in RBC from Ctrl and Sptlc1 ECKO mice was determined by LC-MS/MS, including dhC16-Cer, dhSph, dhS1p, Sph, and S1P in (F), Cer with different fatty acyl chain lengths in (G), total Cer content in (H), and SM with different fatty acyl chain lengths in (I), and total SM in (J) (n=5 for Ctrl, n=3 for Sptlc1 ECKO). Values of lipidomic results can be accessed in Figure 6—source data 1. Data are expressed as mean ± SD. Statistical significance was determined by unpaired t test. *p<0.05; **p<0.01. ns, non-significant.
-
Figure 6—source data 1
Levels of dhC16-Cer, dhSph, dhS1P, Sph, S1P, Cer, and SM in plasma and RBC of Ctrl and Sptlc1 ECKO mice.
- https://cdn.elifesciences.org/articles/78861/elife-78861-fig6-data1-v3.xlsx
Figure 7 with 2 supplements
Rapid reduction of SL content in circulation upon Sptlc1 deletion.
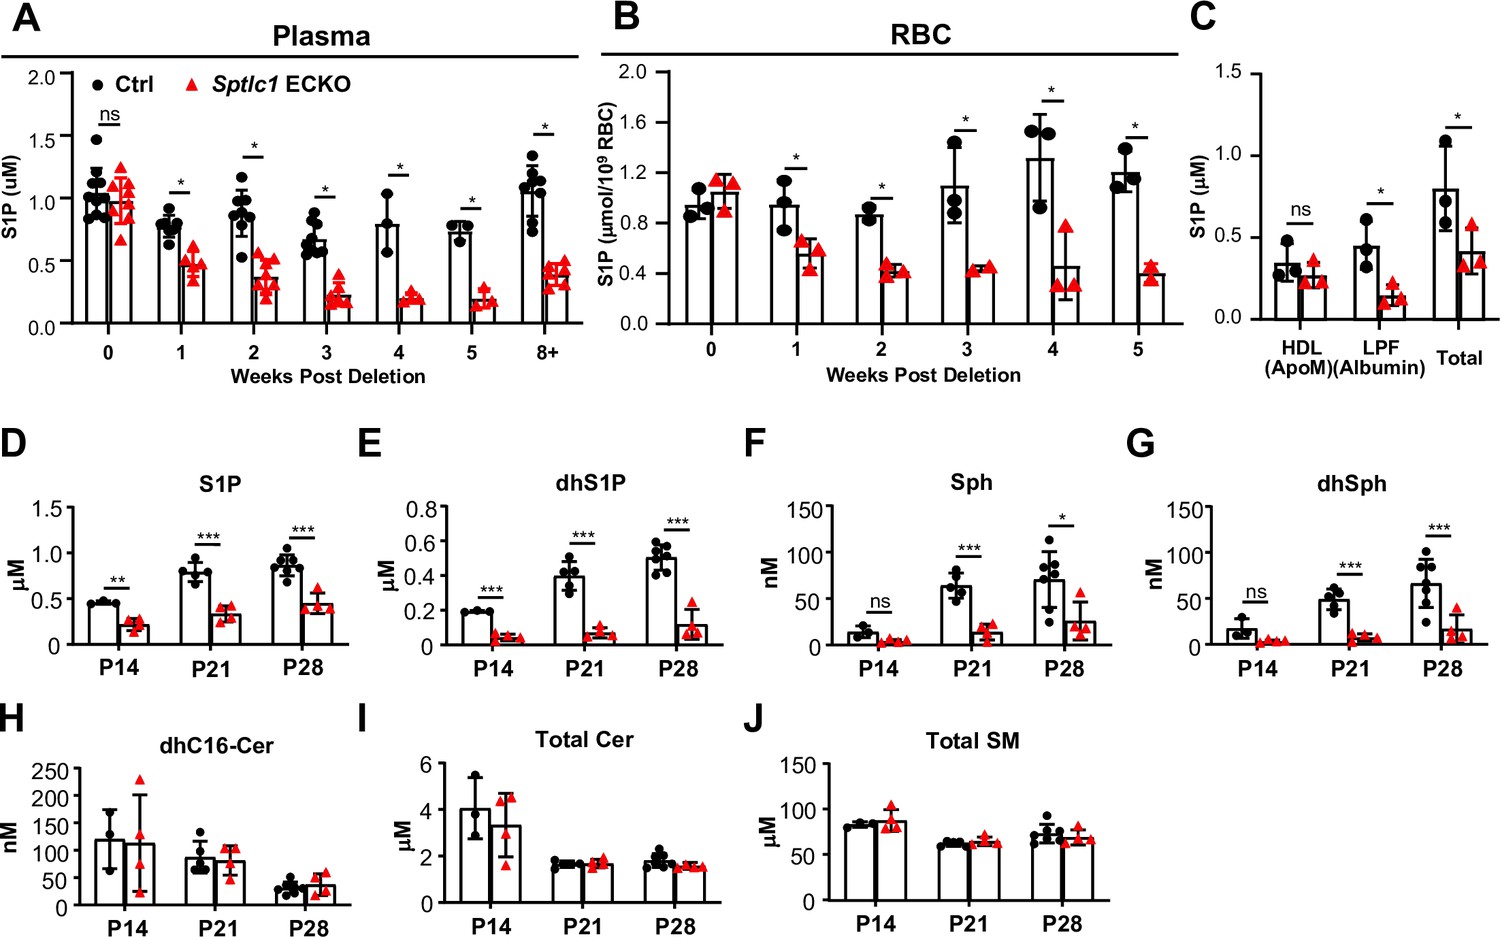
S1P levels from plasma and RBC of Ctrl and Sptlc1 ECKO mice were measured upon Sptlc1 deletion over time as shown in (A) and (B) (n=3–8 for Ctrl in each time point, n=2–8 for Sptlc1 ECKO in each time point). (C) Plasma from Ctrl and Sptlc1 ECKO mice were fractionated by HPLC (Bio-Rad) into HDL (ApoM enriched), Lipoprotein Free (LPF) (Albumin enriched). S1P levels in each fraction, including total plasma were measured by LC-MS/MS (n=3 for Ctrl, n=3 for Sptlc1 ECKO). SL content from plasma samples of Ctrl and postnatal (P1–P3) deletion of Sptlc1 in EC was measured at P14, P21 and P28 by LC-MS/MS. Species measured are as followed: S1P (D), dhS1P (E), Sph (F), dhSph (G), dhCer (H), total Cer (I), and total SM (J) (n=3–7 for Ctrl in each age, n=4 for Sptlc1 ECKO in each age). Data are expressed as mean ± SD. Statistical significances in (A) and (B) were determined by one-way ANOVA test. Values of lipidomic results can be accessed in Figure 7—source data 1. Statistical significances in (C)-(G) were determined by unpaired t test. *p<0.05; **p<0.01; ***p<0.001. ns, non-significant.
-
Figure 7—source data 1
Levels of dhC16-Cer, dhSph, dhS1P, Sph, S1P, Cer, and SM in plasma and RBC of Ctrl and Sptlc1 ECKO mice.
- https://cdn.elifesciences.org/articles/78861/elife-78861-fig7-data1-v3.xlsx
Figure 7—figure supplement 1

Plasma FPLC fractionation indicates similar protein abundance of ApoM and Albumin in HDL and lipoprotein free fraction between Ctrl and Sptlc1 ECKO mice.
(A) HPLC analyses of plasma samples demonstrated the abundance of proteins in HDL and lipoprotein free (LPF) fractions in Ctrl and Sptlc1 ECKO mice as indicated by O.D.280 measurements (Blue lines) (n=3 for both genotypes). (B) HDL fraction from (A) were analyzed by Western blotting for ApoM (Abcam, 1:2000) with indicated sample volume (n=1 for both genotypes). (C) LPF fraction of plasma samples from (A) were analyzed by SDS-PAGE followed by Coomassie staining with indicated sample volume. Albumin is identified based on molecular weight (n=1 for both genotypes).
-
Figure 7—figure supplement 1—source data 1
Original blots from HDL and LPF fractions of plasma from Ctrl and Sptlc1 ECKO mice.
- https://cdn.elifesciences.org/articles/78861/elife-78861-fig7-figsupp1-data1-v3.zip
Figure 7—figure supplement 2
Plasma Cer and SM are not affected in postnatal deletion of Sptlc1 ECKO mice.
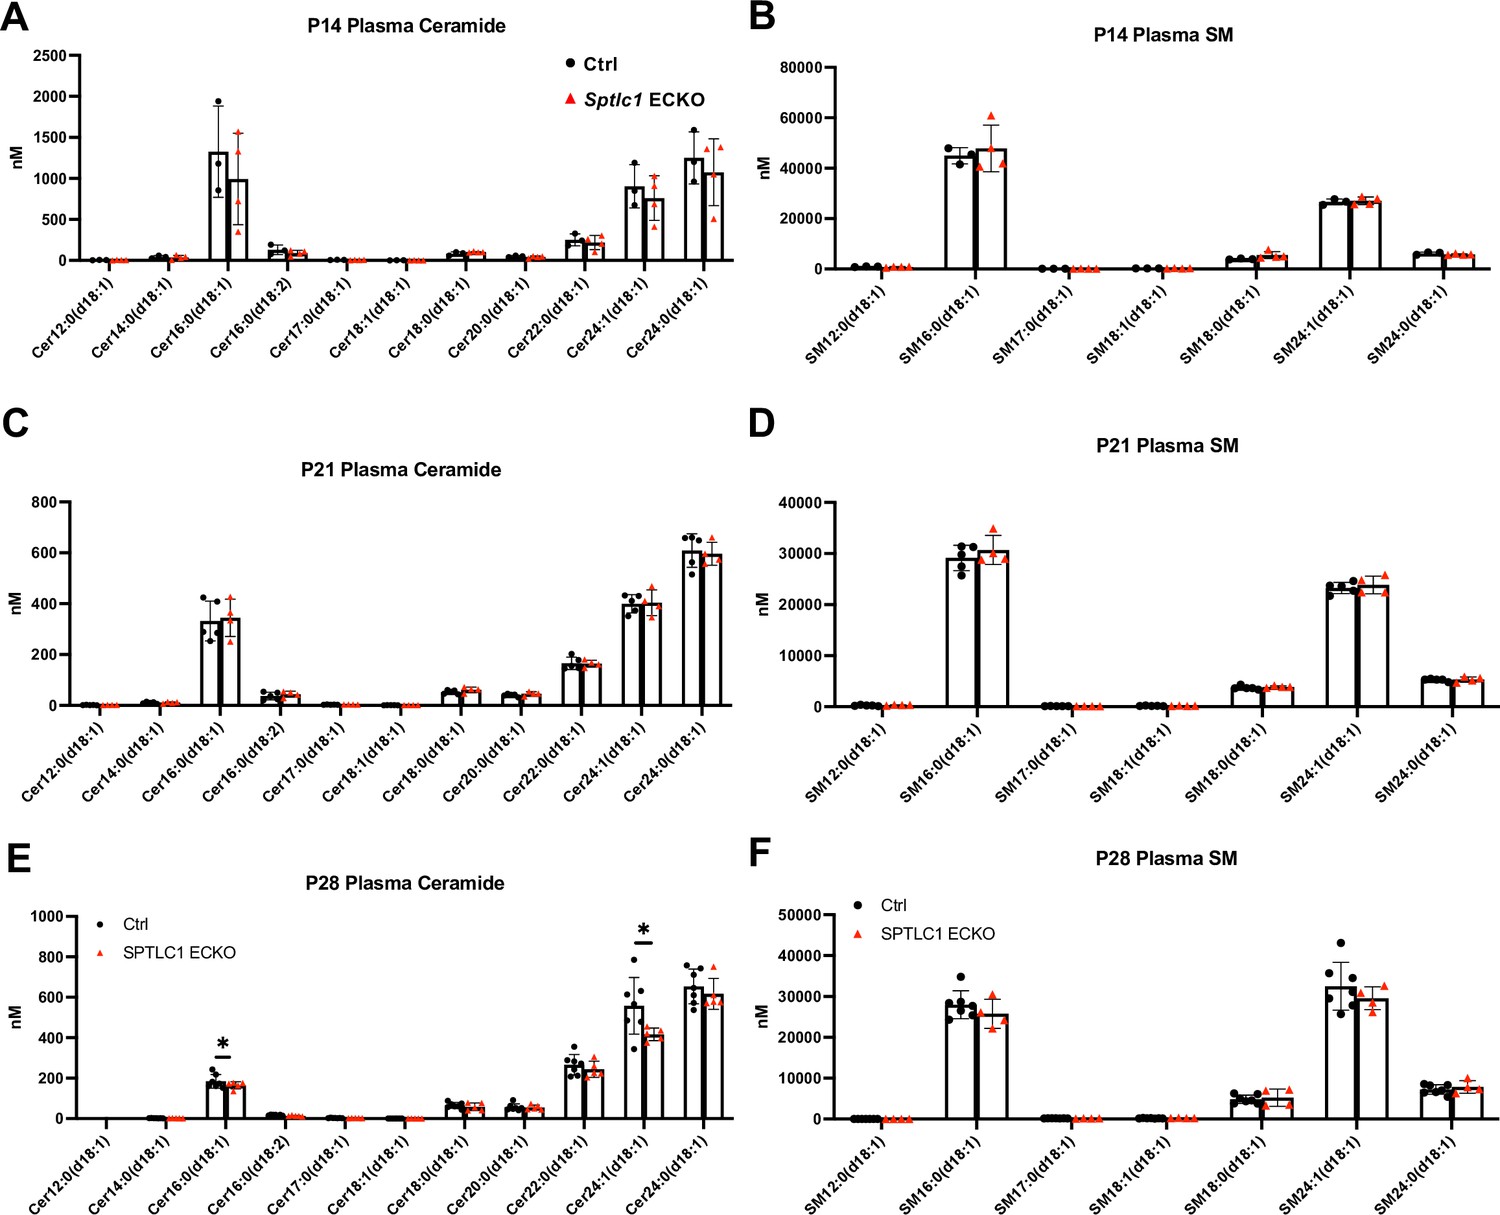
(A) and (B) P14 Cer and SM with different chain lengths in Ctrl and Sptlc1 ECKO mice were determined by LC-MS/MS (n=3 for Ctrl and n=4 for Sptlc1 ECKO). (C) and (D) P21 Cer and SM with different chain lengths in Ctrl and Sptlc1 ECKO mice were determined by LC-MS/MS (n=5 for Ctrl and n=4 for Sptlc1 ECKO). (E) and (F) P28 Cer and SM with different chain lengths in Ctrl and Sptlc1 ECKO mice were determined by LC-MS/MS (n=7 for Ctrl and n=4 for Sptlc1 ECKO). Statistical significance was determined by unpaired t test. Data are expressed as mean ± SD. *p<0.05.
Figure 8
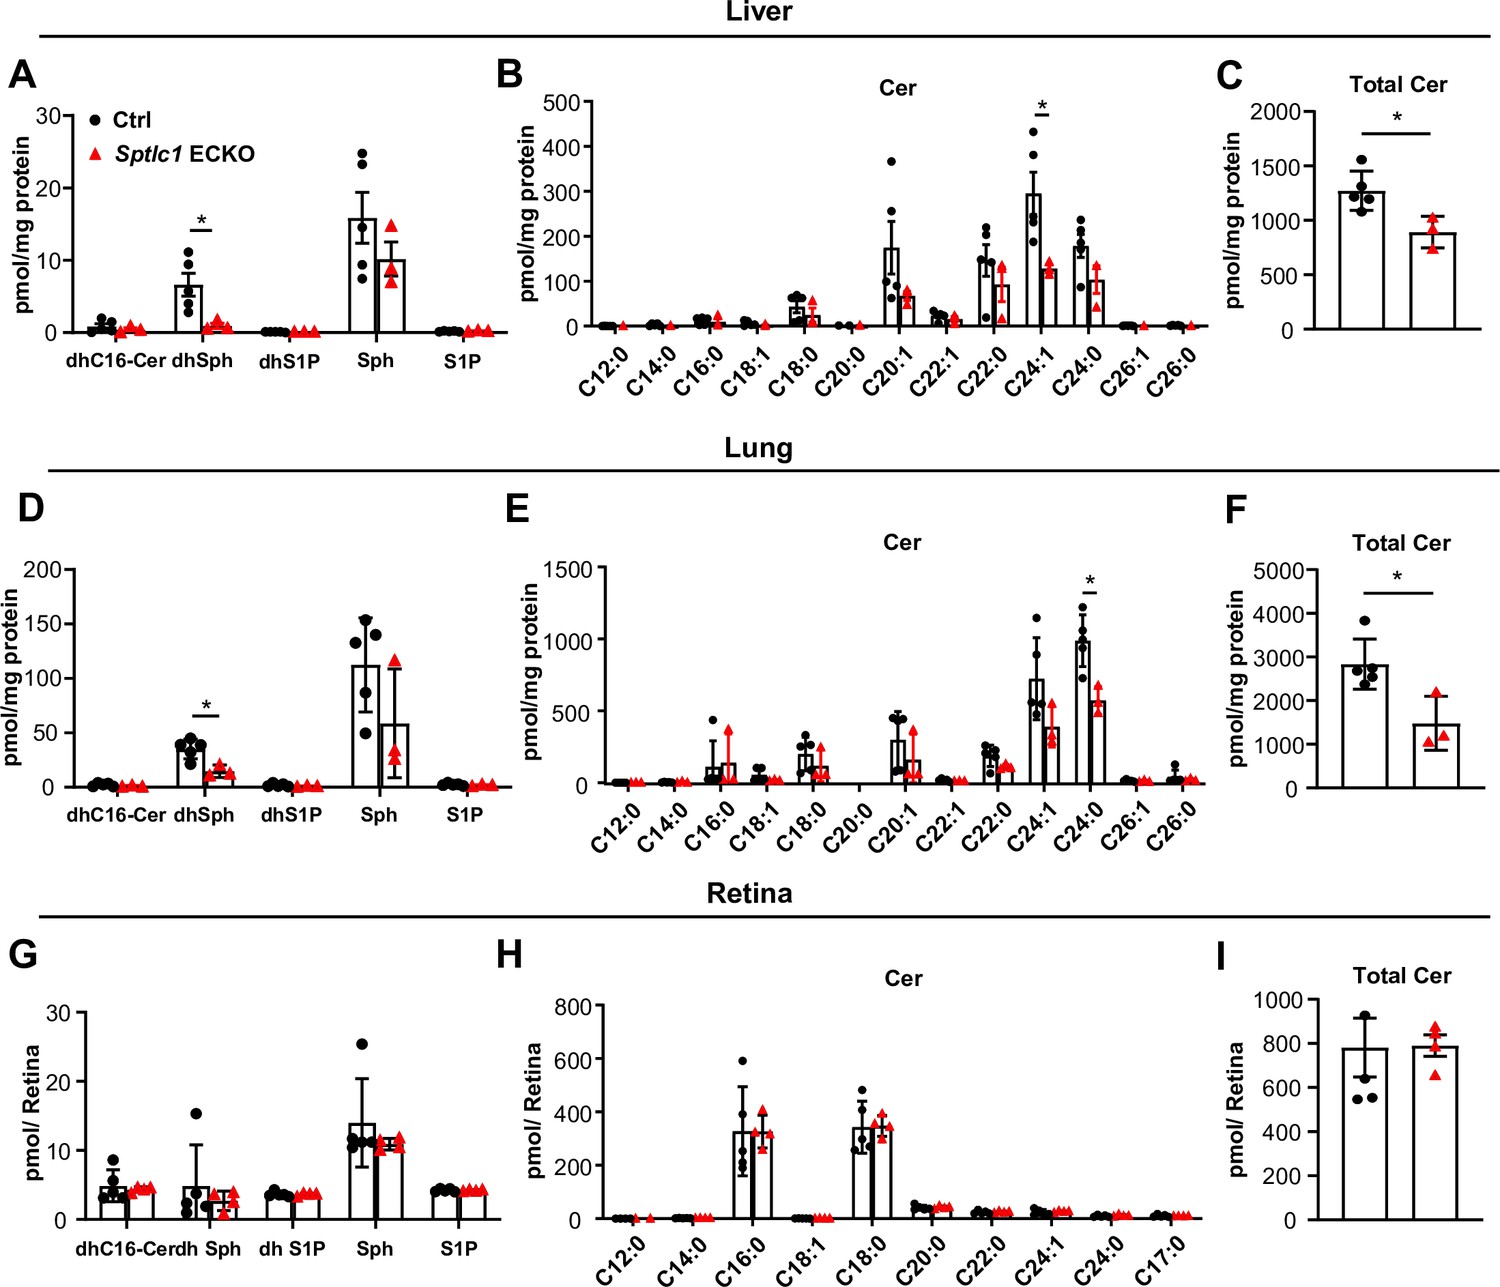
Sptlc1 ECKO mice exhibit reduced SL content in peripheral but not CNS organs.
SL content from adult liver homogenate of Ctrl and Sptlc1 ECKO adult mice was measured by LC-MS/MS, including dhCer, dhSph, dhS1P, Sph and S1P (A), Cer with different fatty acyl chain length (B) and total Cer (C) (n=3 for Ctrl, n=3 for Sptlc1 ECKO). SL content from adult lung homogenate of Ctrl and Sptlc1 ECKO mice was measured by LC-MS/MS, including dhCer, dhSph, dhS1P, Sph, and S1P (D), Cer with different fatty acyl chain length (E) and total Cer (F) (n=3 for Ctrl, n=3 for Sptlc1 ECKO). SL content from P28 retina homogenate of Ctrl and Sptlc1 ECKO mice were measured by LC-MS/MS, including dhCer, dhSph, dhS1P, Sph, and S1P (G), Cer with different fatty acyl chain length (H) and total Cer (I) (n=5 for Ctrl, n=4 for Sptlc1 ECKO). Values of lipidomic results can be accessed in Figure 8—source data 1. Data are expressed as mean ± SD. Statistical significance was determined by unpaired t test. *p<0.05.
-
Figure 8—source data 1
Levels of dhC16-Cer, dhSph, dhS1P, Sph, S1P, Cer, and from lung, liver and retina lysates of Ctrl and Sptlc1 ECKO mice.
- https://cdn.elifesciences.org/articles/78861/elife-78861-fig8-data1-v3.xlsx
Figure 9
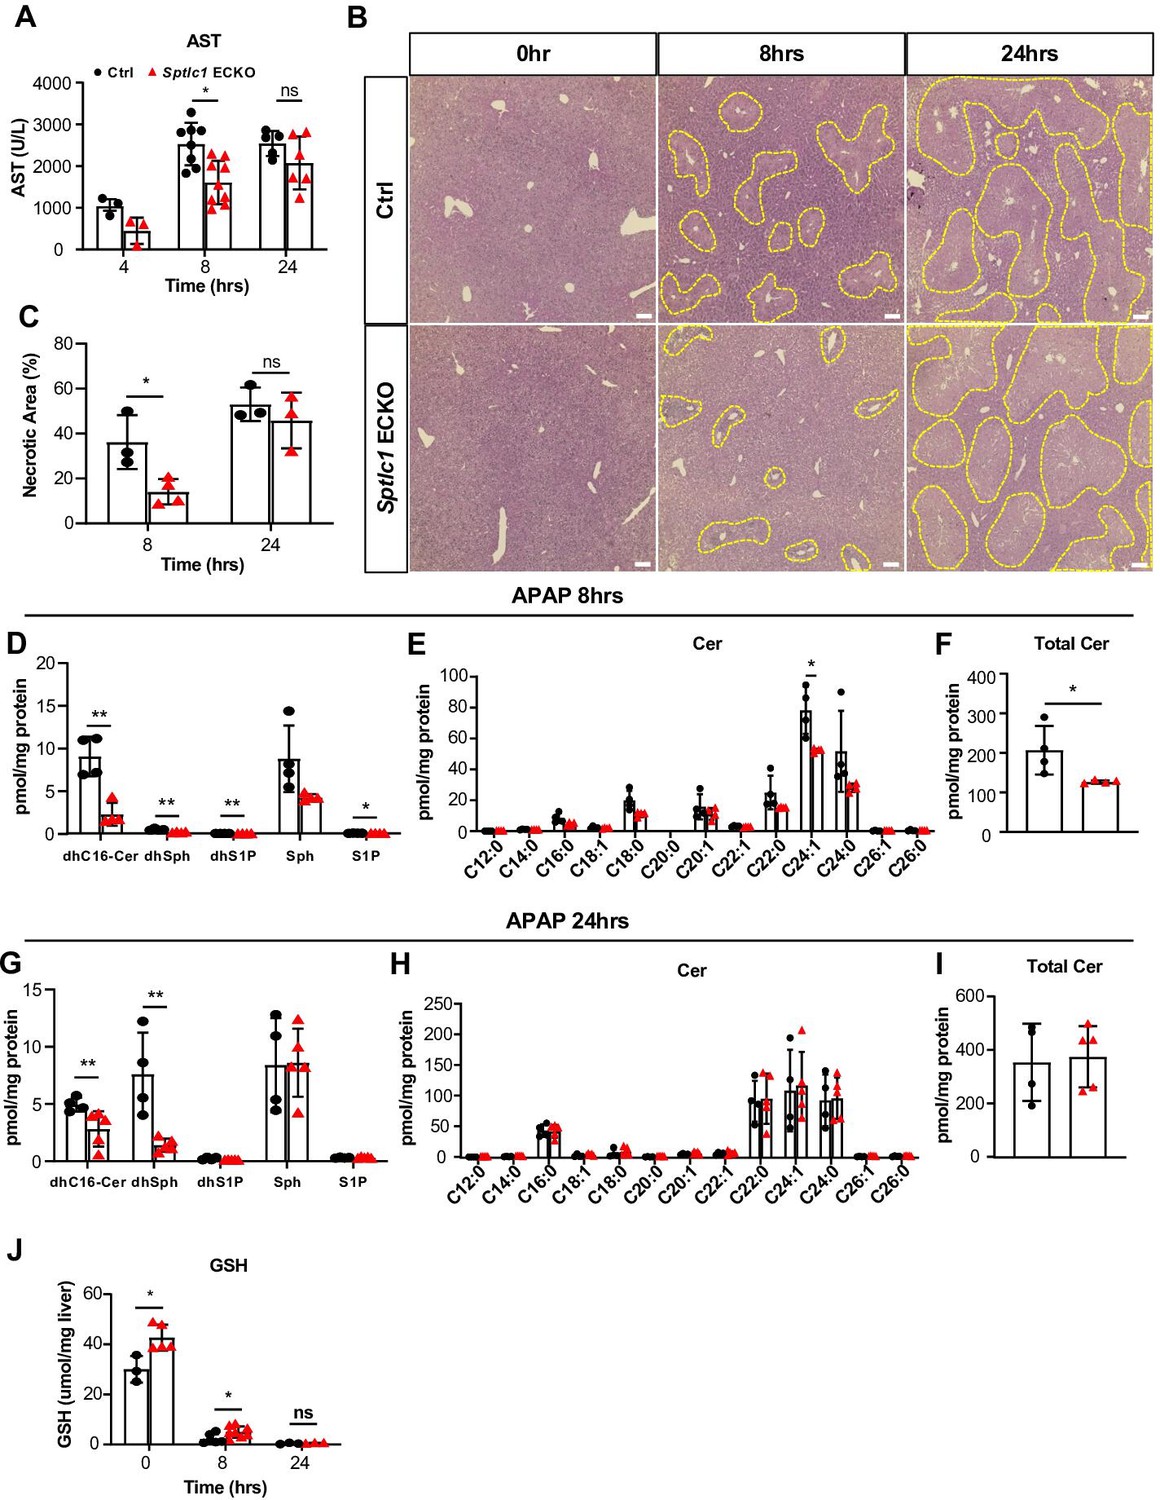
Sptlc1 ECKO mice are protected against APAP-induced hepatoxicity.
AST levels were measured from plasma samples of Ctrl and Sptlc1 ECKO mice after 4, 8, and 24 hr of APAP injection (n=3–8 for Ctrl in each time point, n=3–9 for Sptlc1 ECKO in each time point). (B) Liver sections from Ctrl and Sptlc1 ECKO mice after 0, 8, and 24 hr of APAP administration were stained with hematoxylin and eosin. Representative images were shown and dotted lined areas indicate necrotic region. The percentage of necrotic area in total imaging area was quantified in (C) (n=3–5 for Ctrl in each time point, n=3–5 for Sptlc1 ECKO in each time point. each dot represents average of five images from one mouse). SL content in Ctrl and Sptlc1 ECKO liver after 8 hr of APAP injection was measured by LC-MS/MS, including dhC16-Cer, dhSph, dhS1P, Sph and S1P (E), Cer with different fatty acyl chain lengths (F), total Cer content (G) (n=4 for Ctrl, n=4 for Sptlc1 ECKO). SL content in Ctrl and Sptlc1 ECKO liver after 24 hr of APAP injection was measured by LC-MS/MS, including dhC16-Cer, dhSph, dhS1P, Sph, and S1P (H), Cer with different fatty acyl chain length (I), total Cer content (J) (n=4 for Ctrl, n=5 for Sptlc1 ECKO). (D) GSH levels were measured from liver samples of Ctrl and Sptlc1 ECKO mice after 0, 8, and 24 hr of APAP injection (n=3–6 for Ctrl in each time point, n=3–8 for Sptlc1 ECKO in each time point). Values of lipidomic results can be accessed in Figure 9—source data 1. Data are expressed as mean ± SD. Statistical significance was determined by unpaired t test. *p<0.05. **p<0.01. Scale bar, 1 mm.
-
Figure 9—source data 1
Levels of dhC16-Cer, dhSph, dhS1P, Sph, S1P, Cer, and from liver lysates of Ctrl and Sptlc1 ECKO mice treated with APAP for 8 and 24 hrs.
- https://cdn.elifesciences.org/articles/78861/elife-78861-fig9-data1-v3.xlsx
Figure 10

Graphic abstract summarizing major findings of the study.
(A) Abrogation of SPT activity in EC leads to reduction of SL content, causing EC-intrinsic effects including disruption of lipid rafts. This alteration impairs VEGF-responsiveness, resulting in delayed developmental and pathological angiogenesis. (B) Our studies also reveal that loss of SPT activity in EC exhibit EC-extrinsic effects, where rapid reduction of several SL metabolites in plasma, red blood cells and peripheral organs (lung and liver) but not in the retina, part of the CNS.
Tables
Appendix 1—key resources table
| Reagent type (species) or resource | Designation | Source or reference | Identifiers | Additional information |
|---|---|---|---|---|
| Genetic reagent (M. musculus) | Sptlc1fl/fl mice | Alexaki et al., 2017 (PMID:28100772) | RRID:MMRRC_042294-UCD | |
| Genetic reagent (M. musculus) | Cdh5-Cre-ERT2 mice | Sörensen et al., 2009 (PMID:19144989) | RRID:MGI:3848984 | |
| Genetic reagent (M. musculus) | Sphk1fl/fl mice | Pappu et al., 2007 (PMID:17363629) | RRID:MMRRC_030038-UCD | |
| Genetic reagent (M. musculus) | Sphk2-/- mice | Mizugishi et al., 2005 (PMID:16314531) | RRID:IMSR_JAX:019140 | |
| Genetic reagent (M. musculus) | Apom-/- mice | Christoffersen et al., 2008 (PMID:18006500) | RRID:MGI:3772574 | |
| Cell line (Human) | Human eubmilical vein endothelial cells | Lonza | C2519A | |
| Antibody | Anti-CD31 MicroBeads (rat monoclonal) | Miltenyi Biotec | 130-097-418; RRID:AB_2814657 | |
| Antibody | Anti-CD45 MicroBeads (rat monoclonal) | Miltenyi Biotec | 130-052-301; RRID:AB_2877061 | |
| Antibody | (PE)-conjugated Anti-CD31 (rat monoclonal) | Biolegend | 102508; RRID:AB_312915 | For EC Isolation (1:250) |
| Antibody | (APC)-conjugated Anti-mouse CD45 (rat monoclonal) | Biolegend | 103112; RRID:AB_312977 | For EC Isolation (1:250) |
| Antibody | Anti-SPTLC1 (mouse monoclonal) | Santa Cruz Biotechnology | sc-374143; RRID:AB_10917035 | For Western Biotting (1:1000) |
| Antibody | Anti-phospho eNOS (rabbit monoclonal) | Cell Signaling Techonology | 9571; RRID:AB_329837 | For Western Biotting (1:1000) |
| Antibody | Anti-eNOS (rabbit polyclonal) | BD Biosciences | Cat #:610296; RRID:AB_397691 | For Western Biotting (1:1000) |
| Antibody | Anti-β-Actin (mouse monoclonal) | Sigma-Aldrich | Cat# A5316; RRID:AB_476743 | For Western Biotting (1:5000) |
| Antibody | Anti-rabbit IgG-HRP conjugated (goat polyclonal) | Abcam | Cat# ab205718; RRID:AB_2819160 | For Western Biotting (1:5000) |
| Antibody | Anti-mouse IgG-HRP conjugated | Millipore | AP-124P; RRID:AB_9045 | For Western Biotting (1:5000) |
| Antibody | Anti-ERK (rabbit polyclonal) | Cell Signaling Techonology | Cat# 9102; RRID:AB_330744 | For Western Blotting (1:2000) |
| Antibody | Anti-phospho ERK (rabbit monoclonal) | Cell Signaling Techonology | Cat# 9106; RRID:AB_331768 | For Western Blotting (1:2000) |
| Antibody | Anti-ApoM (rabbit monoclonal) | Abcam | ab91656; RRID:AB_204916 | For Western Blotting (1:2000) |
| Antibody | Anti-NG2 (rabbit polyclonal) | Sigma-Aldrich | AB5320; RRID: AB_91789 | For Immunofluorescence (1:200) |
| Antibody | Anti Phospho-histone H3 (Ser28, HTA28) (rat monoclonal) | Biolegend | 641001; RRID: AB_1227660 | For Immunofluorescence (1:200) |
| Antibody | Anti-ESM1 (goat polyclonal) | R&D Systems | AF1999; RRID: AB_2101810 | For Immunofluorescence (1:200) |
| Antibody | Anti-ERG (rabbit monoclonal) | Abcam | Cat# ab92513; RRID:AB_2630401 | For Immunofluorescence (1:500) |
| Antibody | Alexa Fluor 488-conjugated Anti- ERG (rabbit monoclonal) | Abcam | ab196374; RRID:AB_2889273 | For Immunofluorescence (1:200) |
| Antibody | Alexa Fluor 647-conjugated Anti- ERG (rabbit monoclonal) | Abcam | ab196149 | For Immunofluorescence (1:200) |
| Antibody | Anti-LEF1 (rabbit monoclonal) | Cell Signaling Techonology | 2230; RRID:AB_823558 | For Immunofluorescence (1:200) |
| Antibody | Anti-TFRC (rat monoclonal) | Novus Biologicals | NB100-64979; RRID: AB_962622 | For Immunofluorescence (1:200) |
| Antibody | Anti-CLDN5 (rabbit polyclonal) | Invitrogen | 34–1600; RRID: AB_2533157 | For Immunofluorescence (1:200) |
| Antibody | Anti-MFSD2A (rabbit polyclonal) | Gift from David Silver Lab | PMID: 23209793 | For Immunofluorescence (1:200) |
| Antibody | Anti-Actin, α-Smooth Muscle - Cy3 Antibody (mouse monoclonal) | Sigma-Aldrich | C6198; RRID:AB_476856 | For Immunofluorescence (1:200) |
| Antibody | Human VE-Cadherin Antibody (goat polyclonal) | R&D Systems | AF938; RRID:AB_355726 | For Immunofluorescence (1:200) |
| Chemical compound or drug | Tamoxifen | Sigma-Aldrich | T5648 | |
| Chemical compound or drug | Corn Oil | Sigma-Aldrich | C8267 | |
| Chemical compound or drug | Liberase TM Research Grade | Sigma-Aldrich | 5401127001 | |
| Chemical compound or drug | ACK lysis buffer | Thermo Fisher Scientific | A1049201 | |
| Chemical compound or drug | Alexa Fluor 647-Conjugated Isolectin GS-IB4 From Griffonia Simplicifolia | Thermo Fisher Scientific | I32450 | For Immunofluorescence (1:500) |
| Chemical compound or drug | cOmplete Protease Inhibitor Cocktail | Roche | 11836145001 | |
| Chemical compound or drug | Pierce ECL Western Blotting Substrate | Thermo Fisher Scientific | 32106 | |
| Chemical compound or drug | Bovine Serum Albumin lyophilized powder, essentially fatty acid free | Sigma-Aldrich | A6003 | |
| Chemical compound or drug | Fluoromount-G slide mounting medium | SouthernBiotech | 0100–01 | |
| Chemical compound or drug | Sphingosine-1-Phosphate (d18:1) | Avanti Lipids | 860492 P | |
| Chemical compound or drug | sphingosine-1-phosphate-d7 | Avanti Lipids | 860659 P-1mg | |
| Chemical compound or drug | Sphingosine (d18:1) | Avanti Lipids | 860490 P | |
| Chemical compound or drug | Sphinganine (d18:0) | Avanti Lipids | 860498 P | |
| Chemical compound or drug | Recombinant Mouse VEGF-164 (carrier-free) | Biolegend | 583102 | |
| Chemical compound or drug | Acetaminophen | Sigma-Aldrich | A7085 | |
| Chemical compound or drug | Myriocin | Cayman Chemical | 63150 | |
| Chemical compound or drug | C16 Ceramide (d18:1/16:0) | Cayman Chemical | 10681 | |
| Commercial assay or kit | DC Protein Assay Reagents | Bio-Rad | 5000116 | |
| Commercial assay or kit | AST Activity Assay Kit | Sigma-Aldrich | MAK055 | |
| Commercial assay or kit | Glutathione Assay Kit | Cayman Chemical | 703002 | |
| Commercial assay or kit | Vybrant Alexa Fluor 488 Lipid Raft Labeling Kit | Thermo Fisher Scientific | V34403 | |
| Software, algorithm | Fiji | NIH | RRID:SCR_002285 | |
| Software, algorithm | Graphpad Prism 9.0 | Graphpad Software | RRID:SCR_002798 | |
| Software, algorithm | Affinity Photo | Serif (Europe) | RRID:SCR_016951 | |
| Software, algorithm | Skyline | MacCoss Lab Software | RRID: SCR_014080 | |
| Sequence-based reagent | Sptlc1Flox For | Alexaki et al., 2017 (PMID:28100772) | RRID:MMRRC_042294-UCD | For genotyping Sptlc1 Flox allele 5’-GGG TTC TAT GGC ACA TTT GGT AAG-3’ |
| Sequence-based reagent | Sptlc1Flox Rev | Alexaki et al., 2017 (PMID:28100772) | RRID:MMRRC_042294-UCD | For genotyping Sptlc1 Flox allele 5’-CTG TTA CTT CTT GCC AGT GGA C-3’ |
| Sequence-based reagent | Sptlc1 Flox Deletion For | Alexaki et al., 2017 (PMID:28100772) | RRID:MMRRC_042294-UCD | For genotyping Sptlc1 Flox Deletion allele 5’-CAG AGC TAA TGG AAA GGT GTC-3’ |
| Sequence-based reagent | Sptlc1 Flox Deletion Rev | Alexaki et al., 2017 (PMID:28100772) | RRID:MMRRC_042294-UCD | For genotyping Sptlc1 Flox Deletion allele 5’-CTG TTA CTT CTT GCC AGT GGA C-3’ |
| Sequence-based reagent | Cdh5-Cre For | Sörensen et al., 2009(PMID:19144989) | RRID:MGI:3848984 | For genotyping Cdh5-Cre allele5’-TCC TGA TGG TGC CTA TCC TC-3 |
| Sequence-based reagent | Cdh5-Cre Rev | Sörensen et al., 2009 (PMID:19144989) | RRID:MGI:3848984 | For genotyping Cdh5-Cre allele 5’-CCT GTT TTG CAC GTT CAC CG-3’ |
| Sequence-based reagent | Sphk1 Flox Common For | Pappu et al., 2007 (PMID:17363629) | RRID:MMRRC_030038-UCD | For genotyping Sphk1 Flox allele 5-GGA CCT GGC TAT GGA ACC-3' |
| Sequence-based reagent | Sphk1 Flox Rev | Pappu et al., 2007 (PMID:17363629) | RRID:MMRRC_030038-UCD | For genotyping Sphk1 Flox allele 5-ATG TTT CTT TCG AGT GAC CC-3' |
| Sequence-based reagent | Sphk1Flox Rev Deletion | Pappu et al., 2007 (PMID:17363629) | RRID:MMRRC_030038-UCD | For genotyping Sphk1 Flox Deletion allele 5-AAT GCC TAC TGC TTA CAA TAC-3' |
| Sequence-based reagent | Sphk2 Mutant For | Mizugishi et al., 2005 (PMID:16314531) | RRID:IMSR_JAX:019140 | For genotyping Sphk2 allele 5'-CTC GTG CTT TAC GGT ATC GC-3' |
| Sequence-based reagent | Sphk2 Common Rev | Mizugishi et al., 2005 (PMID:16314531) | RRID:IMSR_JAX:019140 | For genotyping Sphk2 allele 5'-CAC TGC ACC CAG TGT GAA TC-3' |
| Sequence-based reagent | Sphk2 Mutant Rev | Mizugishi et al., 2005 (PMID:16314531) | RRID:IMSR_JAX:019140 | For genotyping Sphk2 allele 5'-TCA TCC TGC TGC CCC TTA C-3' |
| Sequence-based reagent | Apom For 1 | Christoffersen et al., 2008 (PMID:18006500) | RRID:MGI:3772574 | For genotyping Apom allele 5'-CAC CCA GCA ACT CAT CCT TT-3' |
| Sequence-based reagent | Apom For 2 | Christoffersen et al., 2008 (PMID:18006500) | RRID:MGI:3772574 | For genotyping Apom allele 5'-GCA GCG CAT CGC CTT CTA TC-3' |
| Sequence-based reagent | Apom Rev | Christoffersen et al., 2008 (PMID:18006500) | RRID:MGI:3772574 | For genotyping Apom allele 5'-TCT TCC CCA CAC CCT AGC TC-3' |
Additional files
Download links
A two-part list of links to download the article, or parts of the article, in various formats.
Downloads (link to download the article as PDF)
Open citations (links to open the citations from this article in various online reference manager services)
Cite this article (links to download the citations from this article in formats compatible with various reference manager tools)
Murine endothelial serine palmitoyltransferase 1 (SPTLC1) is required for vascular development and systemic sphingolipid homeostasis
eLife 11:e78861.
https://doi.org/10.7554/eLife.78861


