Nucleosome conformation dictates the histone code
- EpiCypher, United States
- Department of Biochemistry, University of Iowa Carver College of Medicine, United States
- Department of Biochemistry and Molecular Genetics, University of Colorado Anschutz Medical Campus, United States
- Department of Biochemistry and Biophysics, University of North Carolina at Chapel Hill, United States
Figures
Figure 1 with 2 supplements
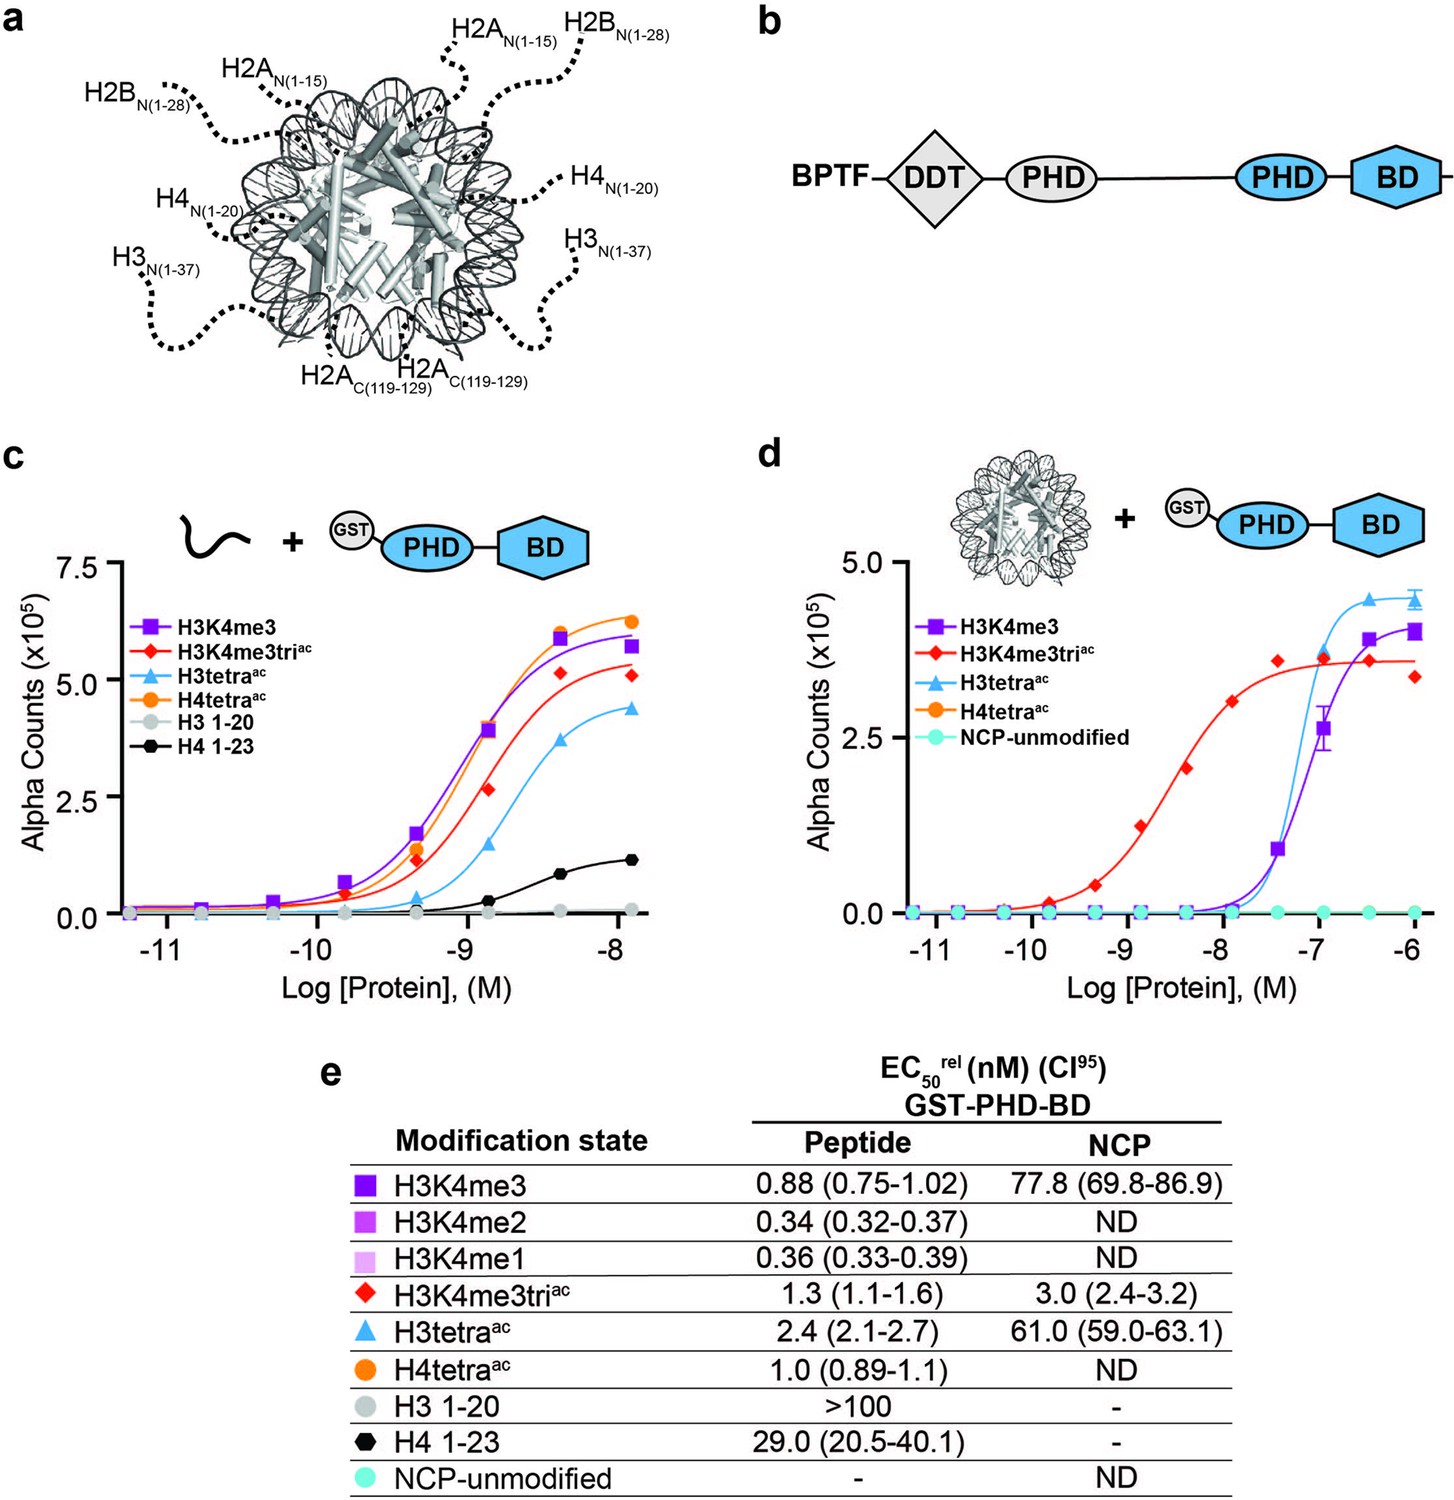
BPTF PHD-BD demonstrates restricted and synergistic PTM binding in the nucleosome vs. peptide context.
(a) The nucleosome core particle (NCP) (PDB: 3LZ0): histone N- and C-terminal tails (as defined by trypsin digest) are depicted as dotted lines and to relative scale. (b) Secondary domain architecture of BPTF [Uniprot Q12830; 3,046 aa; 338 kDa]. Region covered by the C-terminal tandem PHD-BD (aa 2865–3036; as used through this study) in blue. (c, d) dCypher assay Alpha counts plotted as a function of GST-PHD-BD Query concentration to histone peptide (c) or NCP (d) Targets. (e) Relative EC50 (EC50rel) and 95% confidence interval (CI95) values from dCypher curves (in c, d) and Figure 1—figure supplement 1d and e; for calculation see ’Materials and methods’. Targets are color coded as per legends. ND, Not Detected, Not Testable.
Figure 1—figure supplement 1
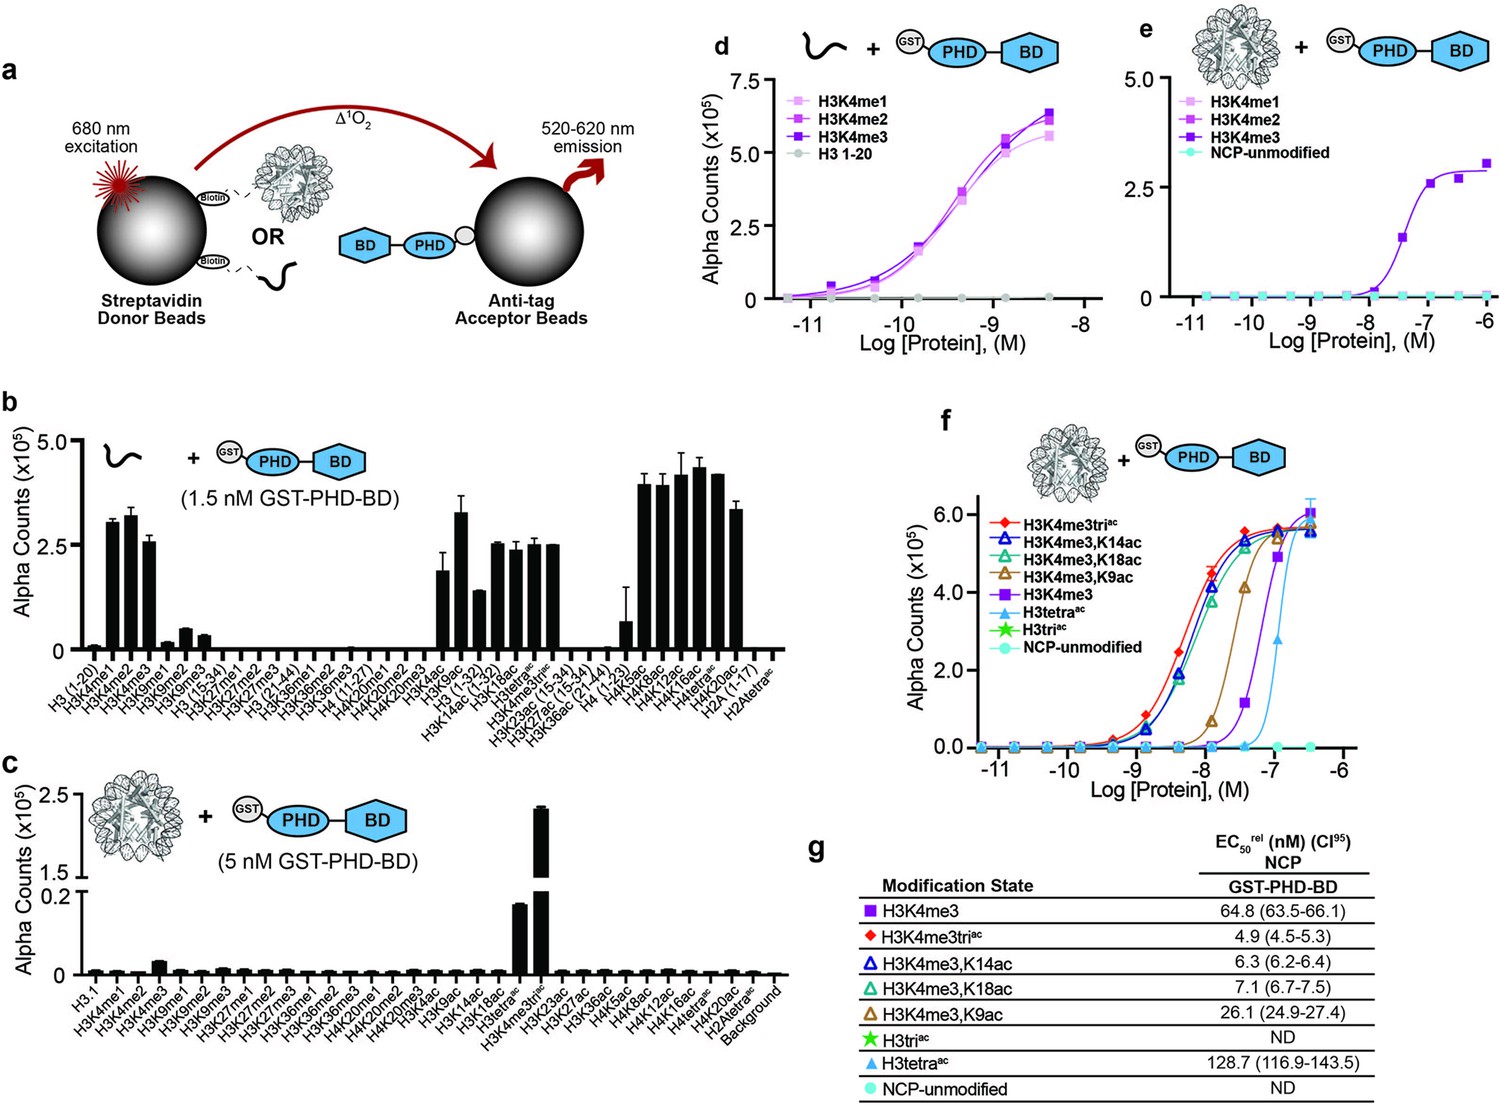
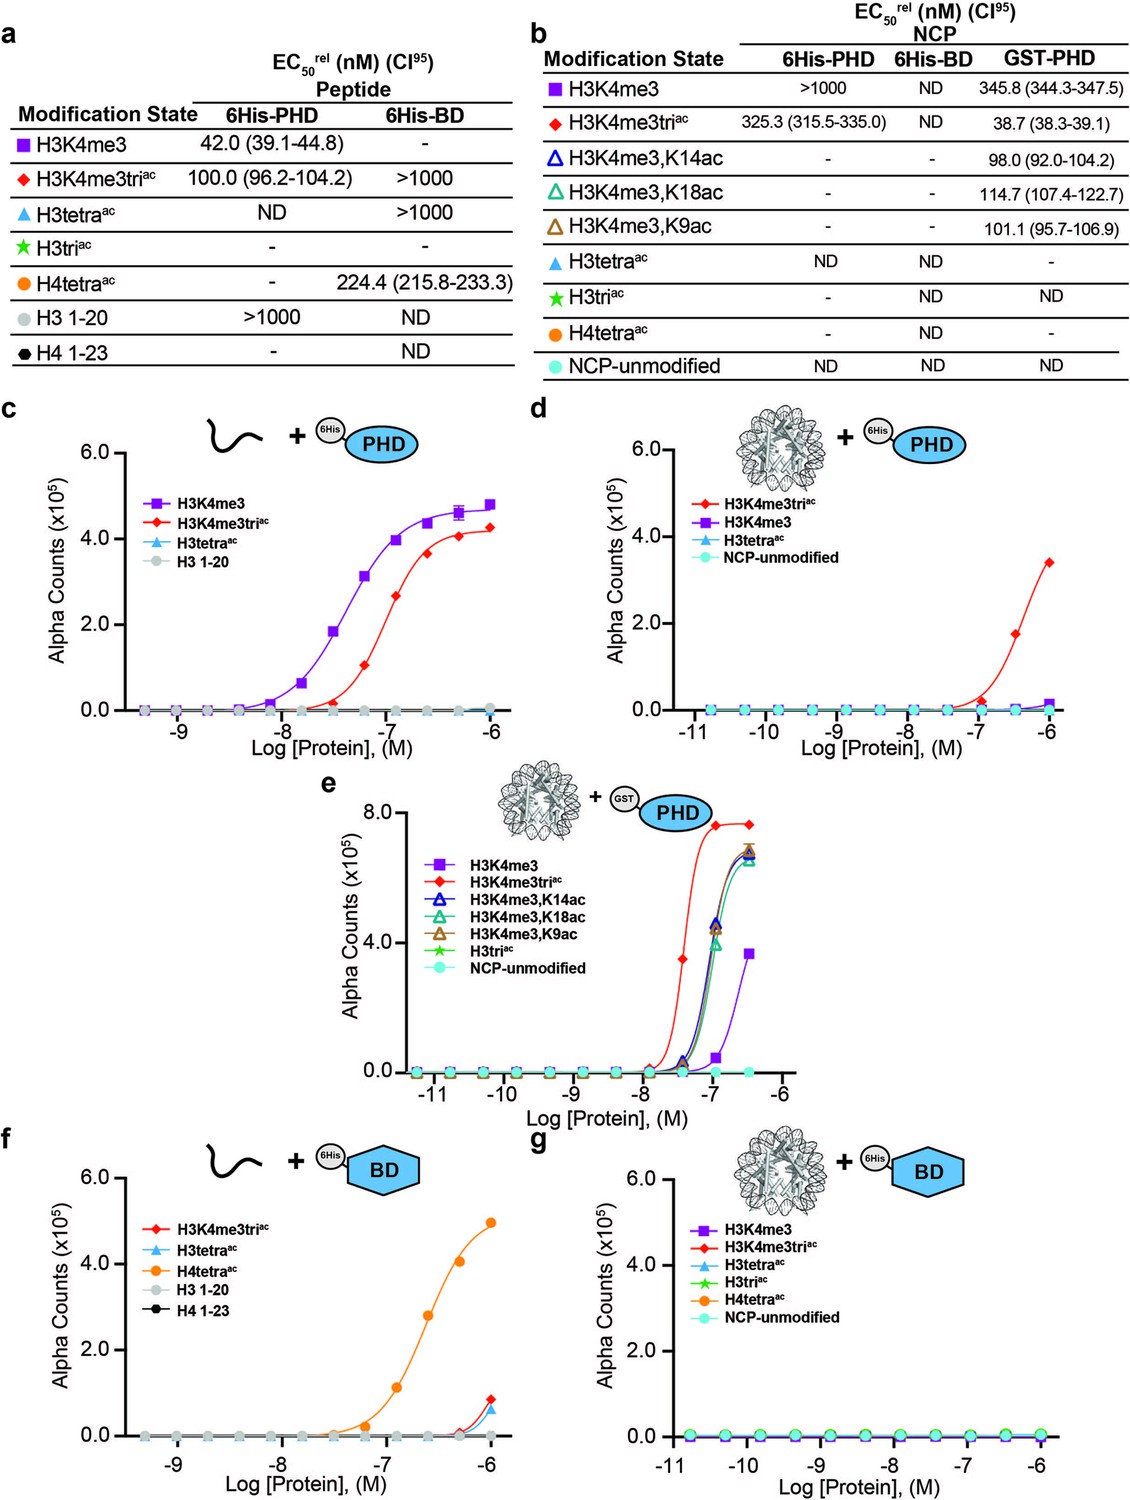
Binding preference of BPTF GST-PHD-BD for peptide vs. NCP substrates.
(a) dCypher is a no-wash bead-based proximity assay on the Alpha platform to interrogate chromatin readers (see ’Materials and methods’). PTM-defined biotinylated peptides or NCPs (the potential Targets) are immobilized to streptavidin donor beads and tagged reader domain(s) (the Queries) to anti-tag Acceptor beads. Donor beads are excited at 680 nm causing the release of singlet oxygen and quantitative fluorescence emission (520–620 nm) from proximal acceptor beads (i.e., bridged by a [Query:Target] interaction). (b,c) GST-PHD-BD selectivity (Query concentration as noted; chosen from dCypher curves in Figure 1d and e [EC80rel for H3K4me3 peptide; EC50rel for H3K4me3triac NCP]) for a panel of histone peptides (~100 nM final; b) and NCP (10 nM final; c). (d,e) GST-PHD-BD binding to histone H3 lysine 4 (H3K4) methyl states (me0 /me1/me2/me3) on peptides (d) or NCPs (e). Alpha Counts are plotted as a function of Query concentration. (f) dCypher assay alpha counts plotted as a function of GST-PHD-BD concentration to NCPs. (g) EC50rel values with 95% confidence intervals (CI95) (see ’Materials and methods’ for calculation of same) from dCypher curves in (f) with Targets color coded as per legend (see also Supplementary file 1). ND, Not Detected.
Figure 1—figure supplement 2
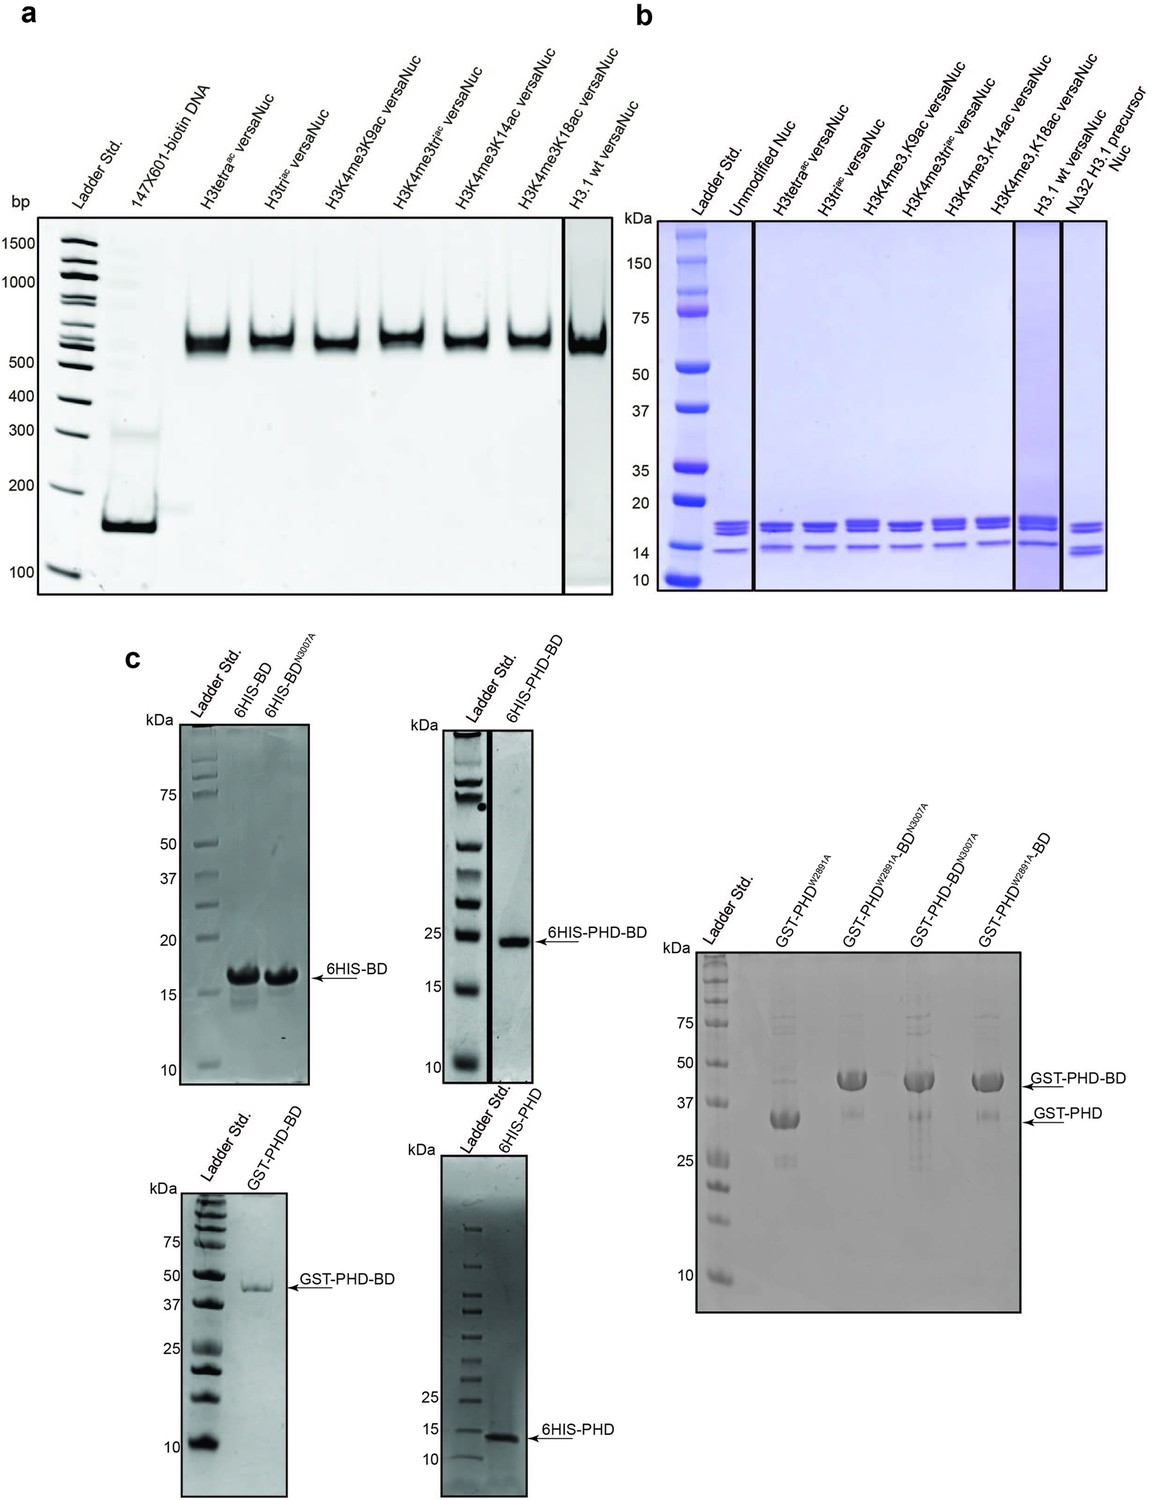
Representative protein QC.
(a) versaNucs (see ’Materials and methods’) (Lanes 1–7; post-translational modification (PTM) identity noted, 400 ng total DNA mass) were resolved by native PAGE (6%, 0.4 X TBE) and integrity confirmed by staining with ethidium bromide (vs. Lane 8; 147 × 601 biotinylated free DNA, 200 ng total DNA mass). (b) versaNucs (Lanes 1–7; 2 μg total protein mass) were resolved by reducing SDS-PAGE (4–20%) and histones visualized by Coomassie staining. Control lanes include unmodified nucleosome (native full length H3; EpiCypher #16–6006) and versaNuc precursor (H3.1 N∆32 before enzymatic ligation of H3 peptide; Supplementary file 2D). (c) Indicated purified recombinants (see Supplementary file 2A) were resolved by SDS-PAGE and visualized by Coomassie staining.
-
Figure 1—figure supplement 2—source data 1
Full native gel image for modified versaNuc reconstitution, stained with ethidium bromide.
- https://cdn.elifesciences.org/articles/78866/elife-78866-fig1-figsupp2-data1-v2.zip
-
Figure 1—figure supplement 2—source data 2
Full native gel image for wild-type versaNuc reconstitution, stained with ethidium bromide.
- https://cdn.elifesciences.org/articles/78866/elife-78866-fig1-figsupp2-data2-v2.zip
-
Figure 1—figure supplement 2—source data 3
Full SDS-PAGE image for modified versaNuc reconstitution, stained with coomassie blue.
- https://cdn.elifesciences.org/articles/78866/elife-78866-fig1-figsupp2-data3-v2.zip
-
Figure 1—figure supplement 2—source data 4
Full SDS-PAGE image for wild-type versaNuc reconstitution, stained with coomassie blue.
- https://cdn.elifesciences.org/articles/78866/elife-78866-fig1-figsupp2-data4-v2.zip
-
Figure 1—figure supplement 2—source data 5
Full SDS-PAGE image for wild-type and mutant 6His-BD, stained with coomassie blue.
- https://cdn.elifesciences.org/articles/78866/elife-78866-fig1-figsupp2-data5-v2.zip
-
Figure 1—figure supplement 2—source data 6
Full SDS-PAGE image for wild-type 6His-PHD-BD, stained with coomassie blue.
- https://cdn.elifesciences.org/articles/78866/elife-78866-fig1-figsupp2-data6-v2.zip
-
Figure 1—figure supplement 2—source data 7
Full SDS-PAGE image for wild-type GST-PHD-BD, stained with coomassie blue.
- https://cdn.elifesciences.org/articles/78866/elife-78866-fig1-figsupp2-data7-v2.zip
-
Figure 1—figure supplement 2—source data 8
Full SDS-PAGE image for wild-type 6His-PHD, stained with coomassie blue.
- https://cdn.elifesciences.org/articles/78866/elife-78866-fig1-figsupp2-data8-v2.zip
-
Figure 1—figure supplement 2—source data 9
Full SDS-PAGE image for mutant GST-PHD and GST-PHD-BD, stained with coomassie blue.
- https://cdn.elifesciences.org/articles/78866/elife-78866-fig1-figsupp2-data9-v2.zip
-
Figure 1—figure supplement 2—source data 10
All gel images for Figure 1—figure supplement 2 labeled and with regions cropped for figure denoted with dashed boxes.
- https://cdn.elifesciences.org/articles/78866/elife-78866-fig1-figsupp2-data10-v2.zip
Figure 2 with 2 supplements
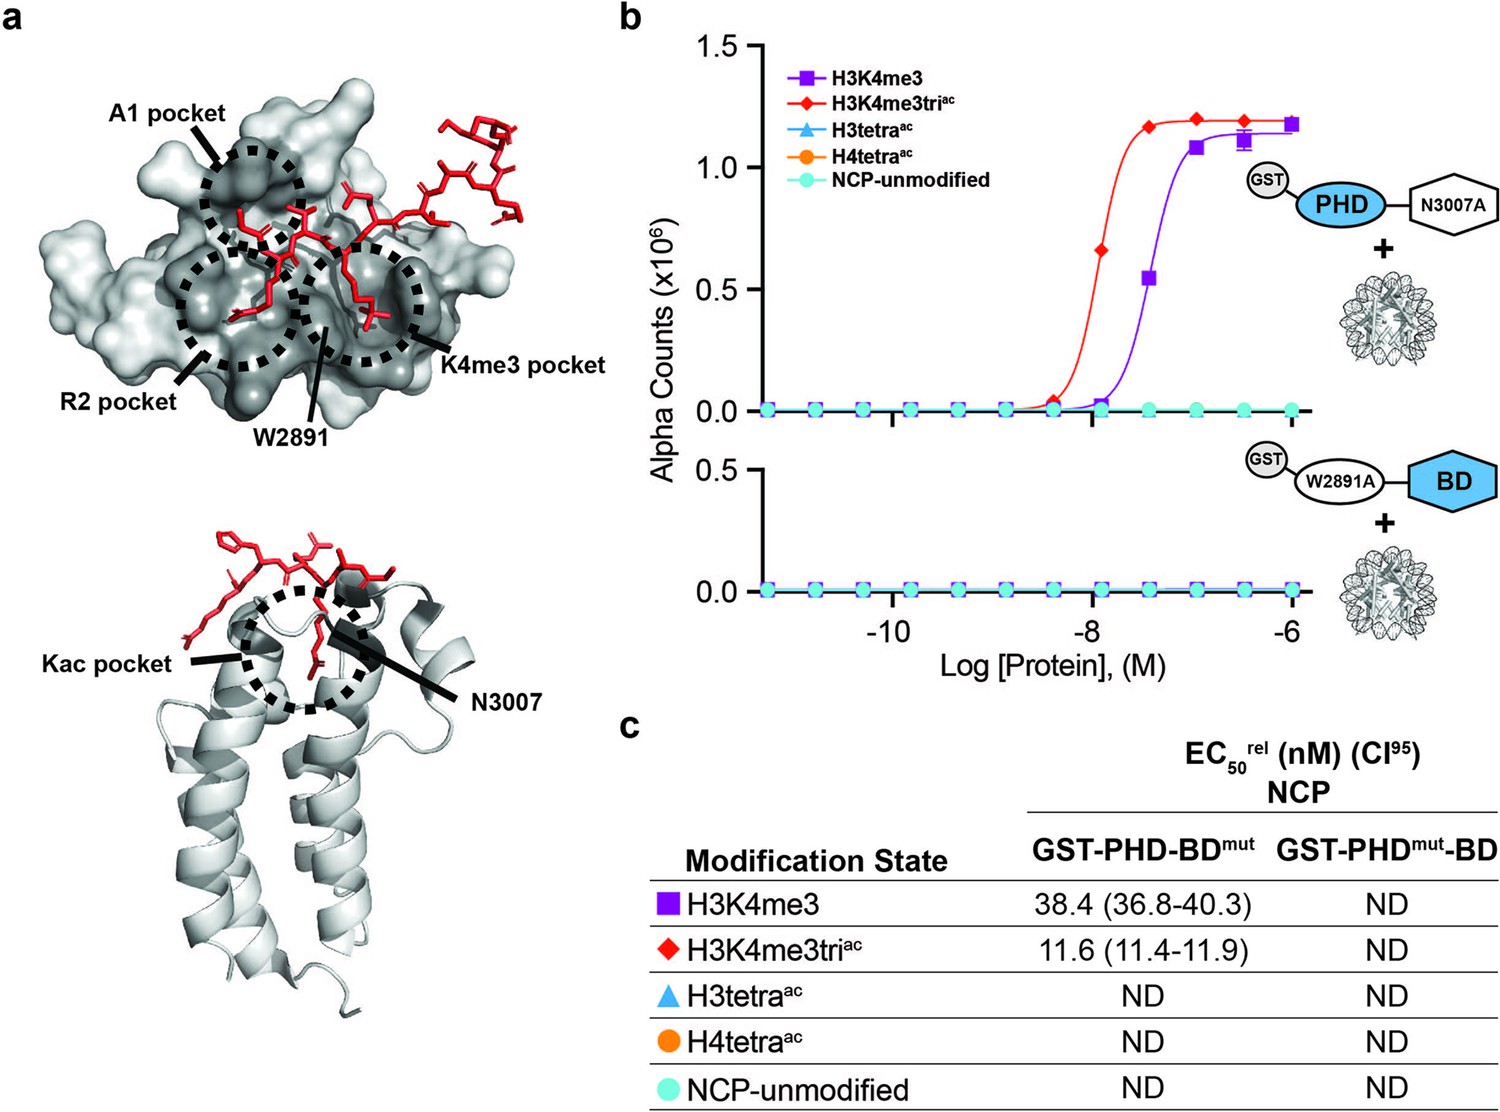
BPTF PHD and BD both contribute to nucleosome binding.
(a) The PHD-H3K4me3 (top) and BD-Kac (bottom) binding pockets on previously solved structures of the individual domains in complex with histone peptides (PDB: 2FUU and 3QZT). Binding pockets are circled/labeled: on PHD for A1, R2, and K4me3; on BD for Kac. Relative location of PTM-binding residues W2891 (PHD) and N3007 (BD) also indicated and mutated to alanine in (b, c). (b) dCypher assay Alpha counts plotted as a function of GST-PHD-BDN3007A (GST-PHD-BDmut; top) or GST-PHDW2891A-BD (GST-PHDmut-BD; bottom) Query concentration to NCP Targets. (c) EC50rel (CI95) values from dCypher curves in (b). Targets color coded as per legends. ND, Not Detected.
Figure 2—figure supplement 1
Individual BPTF reader domains have reduced affinity and restricted specificity in the nucleosome context.
(a–b) EC50rel (with CI95) values calculated from dCypher curves of GST-PHD, 6His-PHD, or 6His-BD Query binding to peptide (a) or nucleosome core particle (NCP) (b) Targets from curves in (c–g), with same color code as per each legend. ND, not detected. -, not tested. (c–e) Alpha counts plotted as a function of 6His-PHD Query concentration for peptide (c) or NCP (d) Targets, or for GST-PHD Query concentration for NCP (e). (f, g) Alpha counts plotted as a function of 6His-BD Query concentration for peptide (f) or NCP (g) Targets. See previously (Marunde et al., 2022a) and ’Materials and methods’ regarding comparison of EC50rel across different affinity tags.
Figure 2—figure supplement 2
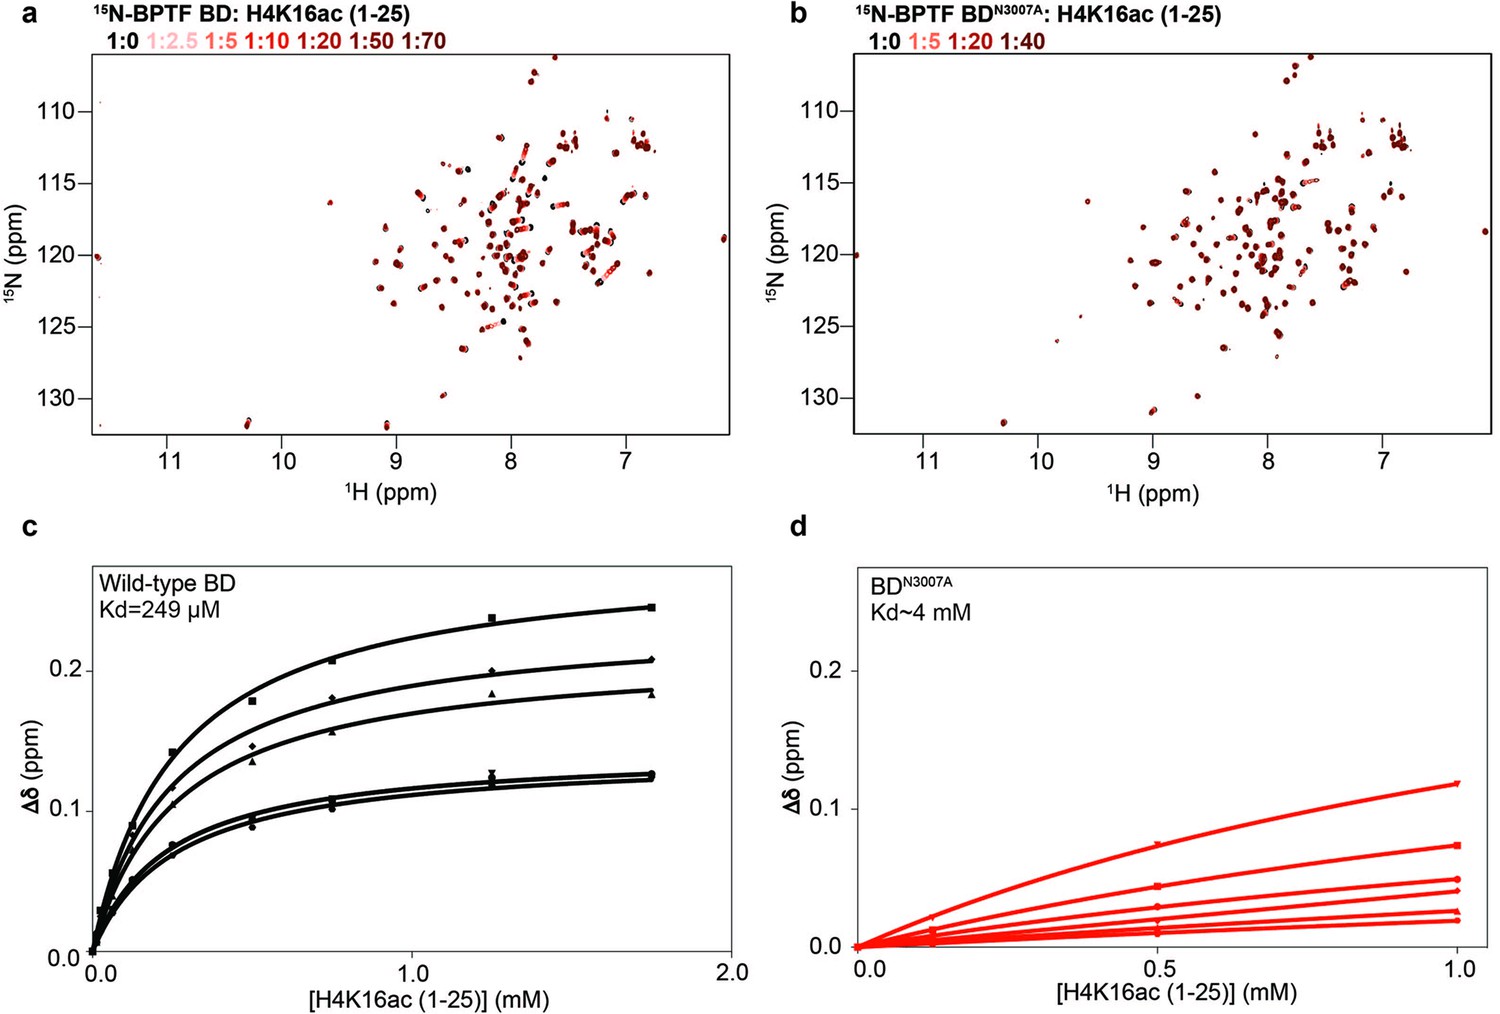
NMR analysis of mutant BPTF BD.
(a–b) Overlay of the 1H-15N-HSQC spectra of 15N-BPTF BD wild-type (a) and 15N-BPTF BD-N3007A (BDmut) (b) on titration of H4K16ac (1-25) tail peptide (Supplementary file 2D). Molar ratios are color coded as per legend. (c–d) Binding curves for the five resonances with the highest chemical shift perturbations upon addition of peptide to 15N-BPTF BD wild-type (c) and 15N-BPTF BD-N3007A (BDmut) (d). Kd values were calculated using a single site binding isotherm accounting for ligand depletion (see ’Materials and methods’) and are denoted on each plot.
Figure 3 with 1 supplement

BPTF PHD-BD bind multivalently to the H3 tail.
(a)1H,15N-HSQC overlays of 15N-PHD-BD apo (black) or in the presence of H3triac (green), H3tetraac (blue), or H3K4me3triac (red) peptides. Arrows denote trajectory of chemical shift perturbation (CSP) and are colored by peptide. Shown are representative resonances for the bromodomain (BD) (left) and plant homeodomain (PHD) (right) binding pockets. (b) Histone H3-A1 is essential for 6His-PHD-BD binding to nucleosome core particles (NCPs) (compare H3K4me3triac to NΔ1H3K4me3triac [integrity of each target confirmed with anti-H3K4me3 (Figure 3—figure supplement 1d)]). dCypher assay Alpha counts are plotted as a function of Query concentration to indicated NCP Targets.
Figure 3—figure supplement 1
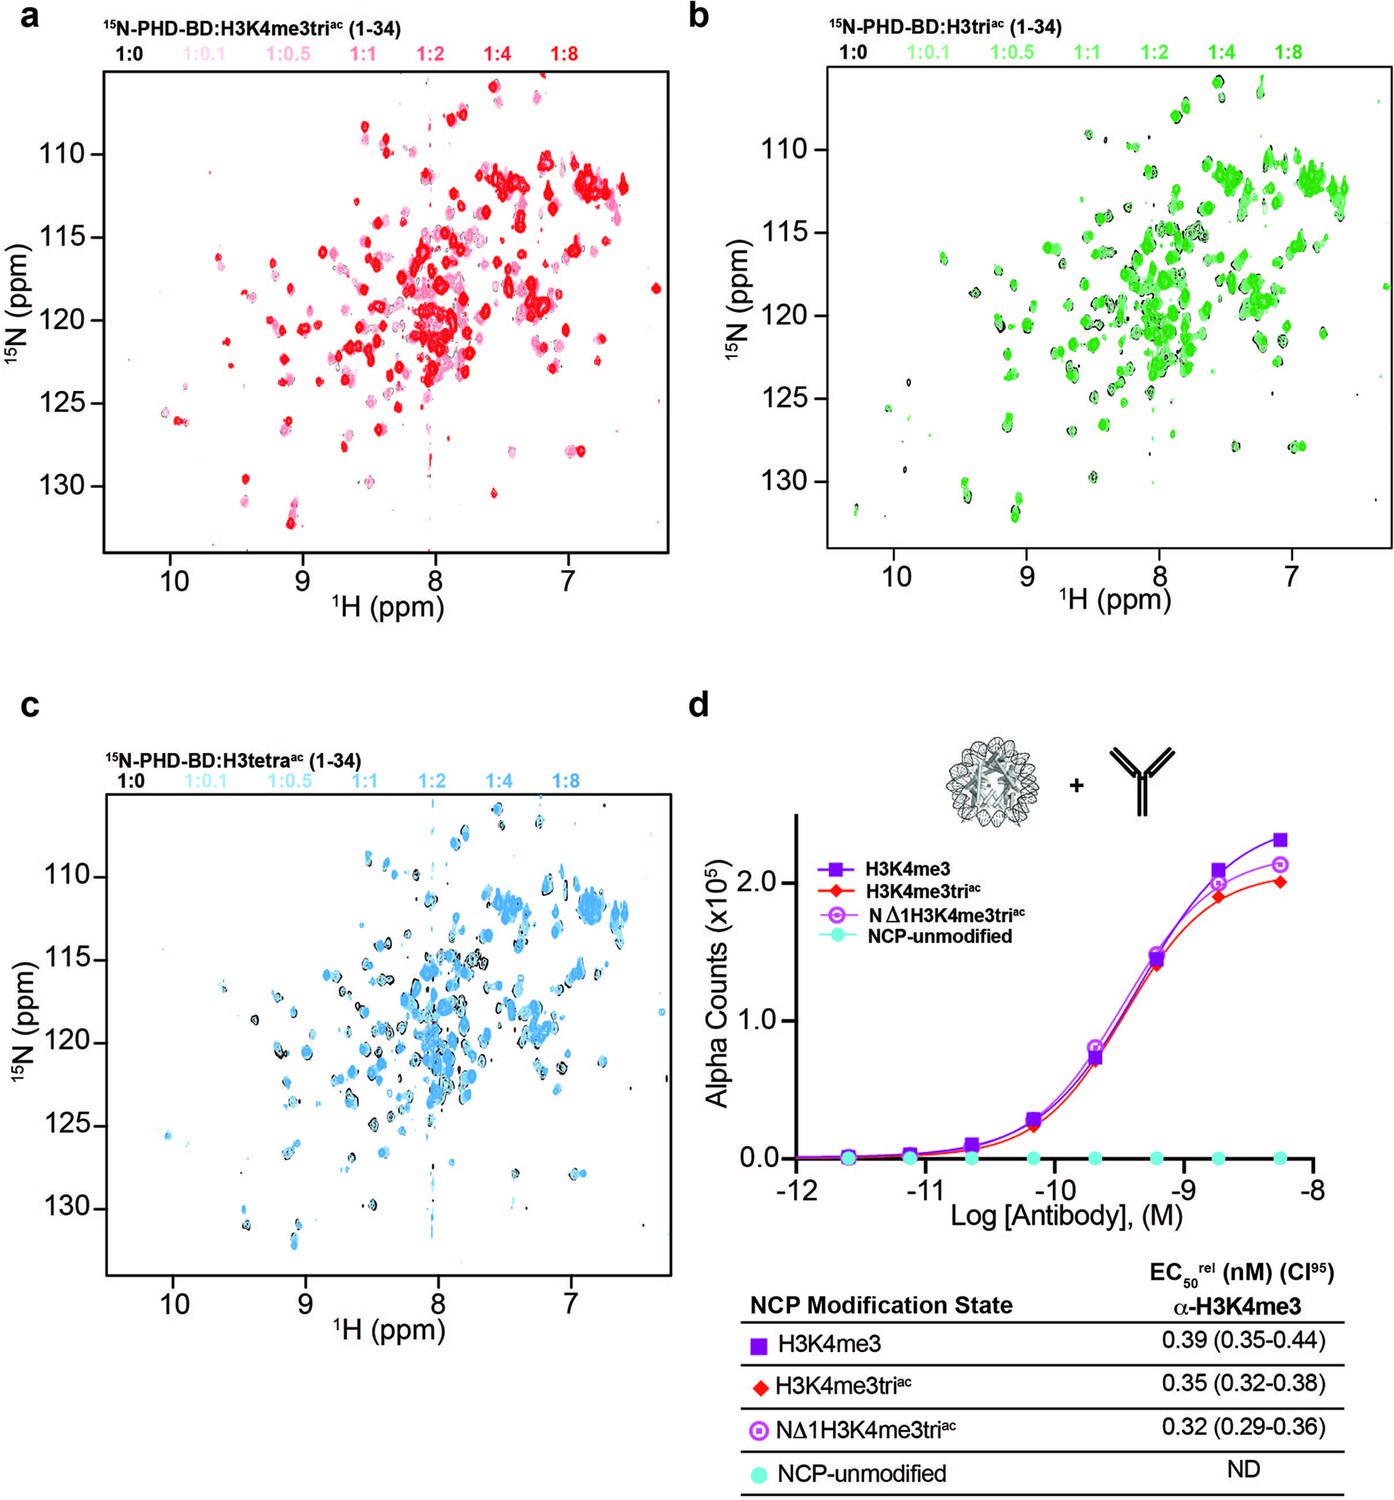
BPTF PHD-BD multivalent association with the H3 tail.
(a–c) Full spectral overlays of 15N-PHD-BD on titration with histone H3 tail peptides (aa 1–34): H3K4me3triac (a); H3triac (b); or H3tetraac (c). Molar ratios of each peptide are denoted by color in panel legends. (d) Validation of N-terminally truncated H3 NCP (NΔ1H3K4me3triac). Alpha counts plotted as a function of anti-H3K4me3 (RevMab Cat# 31-1039-00, lot # P-09–00676) concentration: binding of this antibody is dependent on H4K4me3 (compare H3K4me3 and NCP-unmodified) but independent of residue A1 (NΔ1H3K4me3triac) or acetylation at K9, K14 or K18 (H3K4me3triac). Table shows EC50rel (with CI95) values calculated from dCypher curves. Targets color coded as per legend. ND, not detected.
Figure 4 with 4 supplements

DNA binding occludes BD access to the H4 tail in the nucleosome context.
(a) Overlay 1H,15N-HSQC spectra of 15N-H4-NCP (black) and 15N-H4-tail peptide (residues 1–25, blue). (b) Overlay 1H,15N-HSQC spectra of 15N-H4-tail peptide upon titration of a 21 bp double-stranded DNA. Molar ratios are denoted by color in legend. (c) Overlay 1H,15N-HSQC spectra of 15N-H4-NCP (black) and 15N-H4-tail peptide saturated with DNA (red). (d) Overlay 1H,15N-HSQC spectra of 15N-H4-NCP (black) and 15N-H4KS16ac-NCP (red). (e) Overlay 1H,15N-HSQC spectra of 15N-H4KS16ac-NCP (red) upon titration of BPTF BD (blue). Molar ratios are denoted by color in legend. Note that contour levels are adjusted in (e) relative to (d) for visualization purposes.
Figure 4—figure supplement 1
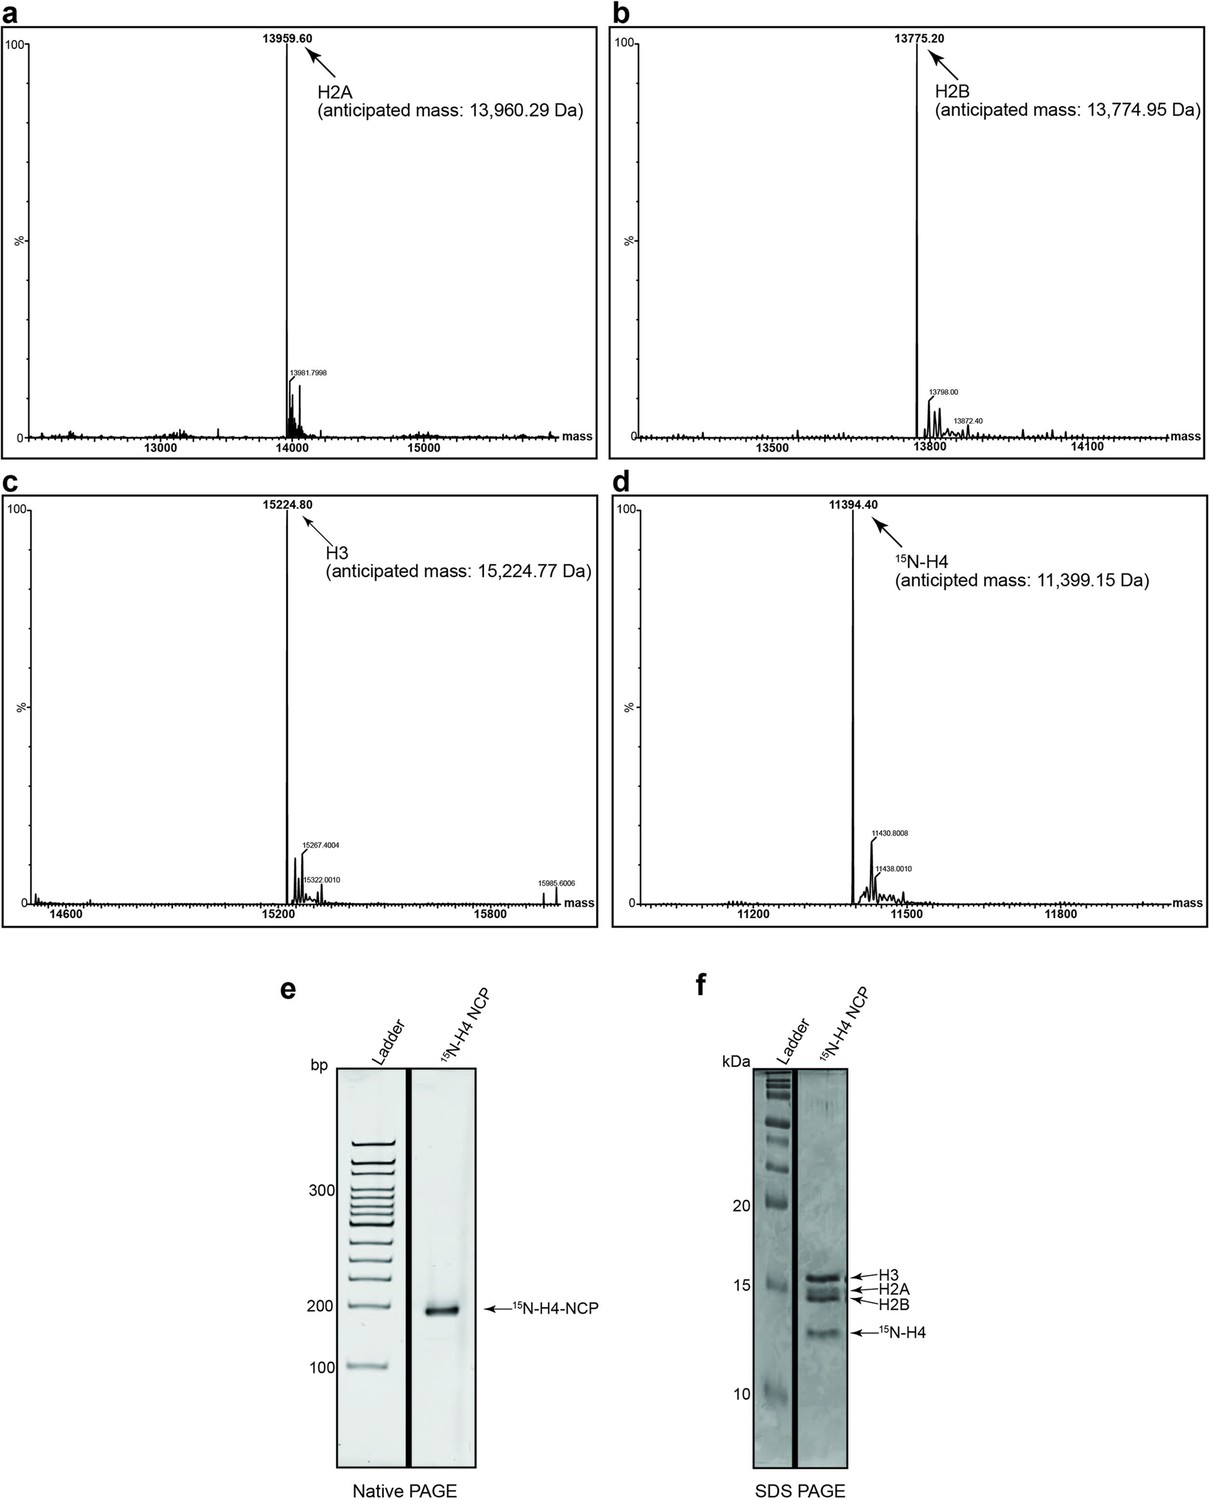
Representative protein QC (NMR related).
(a–d) Histones (including 15N-H4) for NMR were individually purified and validated by MALDI mass spectrometry prior to nucleosome core particle (NCP) reconstitution (see ’Materials and methods’). (e) The 15N-H4 containing NCP was resolved by native PAGE and stained with ethidium bromide to demonstrate reconstitution/absence of free DNA. (f) 15N-H4 containing NCPs were resolved by reducing SDS-PAGE and Coomassie stained to interrogate histone stoichiometry.
-
Figure 4—figure supplement 1—source data 1
Full native gel image for 15N-H4-NCP reconstitution, stained with ethidium bromide.
- https://cdn.elifesciences.org/articles/78866/elife-78866-fig4-figsupp1-data1-v2.zip
-
Figure 4—figure supplement 1—source data 2
Full SDS-PAGE image for 15N-H4-NCP reconstitution, stained with coomassie blue.
- https://cdn.elifesciences.org/articles/78866/elife-78866-fig4-figsupp1-data2-v2.zip
-
Figure 4—figure supplement 1—source data 3
All gel images for Figure 4—figure supplement 1 labeled and with regions cropped for figure denoted with dashed boxes.
- https://cdn.elifesciences.org/articles/78866/elife-78866-fig4-figsupp1-data3-v2.zip
Figure 4—figure supplement 2
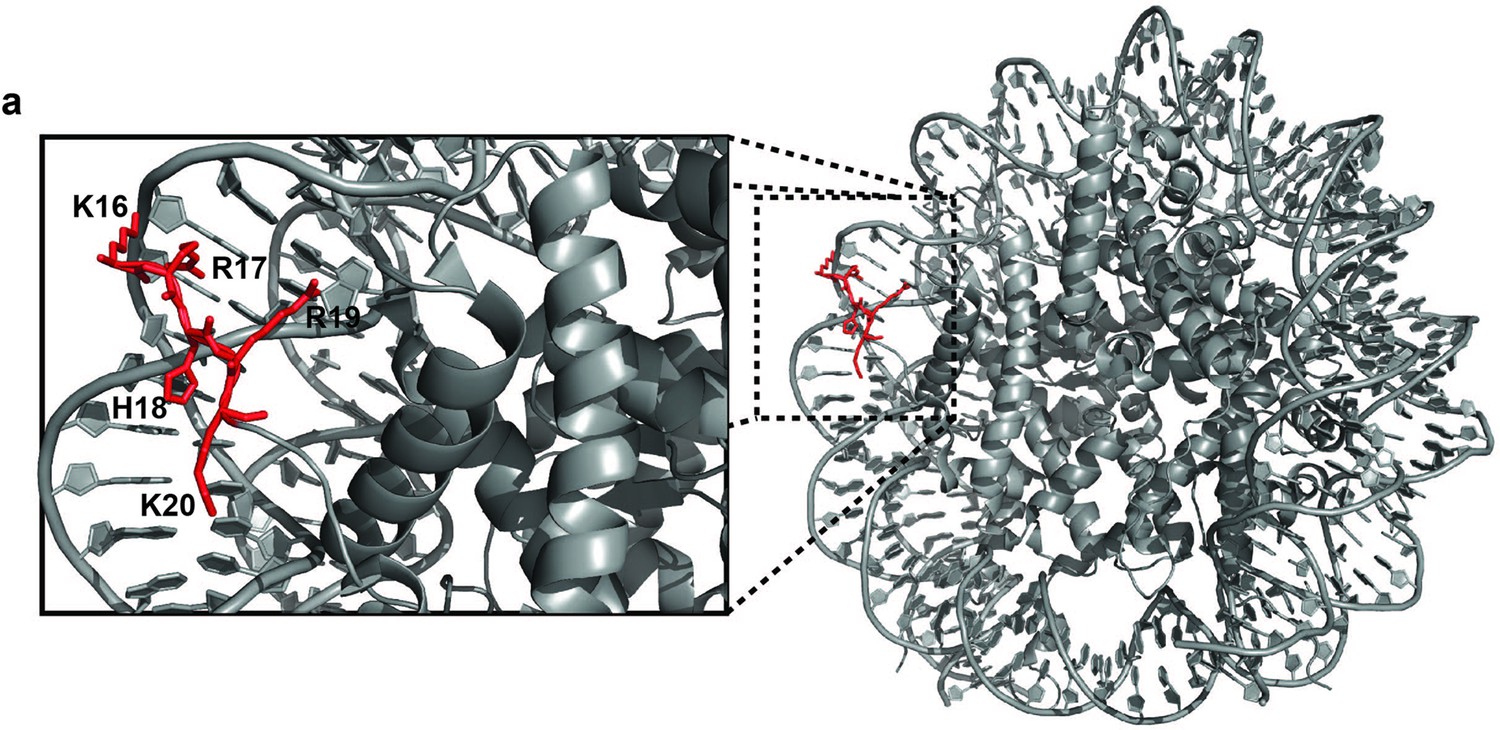
Nucleosome crystal structure (PDB ID: 3LZ0) showing interaction of the H4 tail basic patch (residues: K16-R17-H18-R19-K20) with DNA.
Figure 4—figure supplement 3
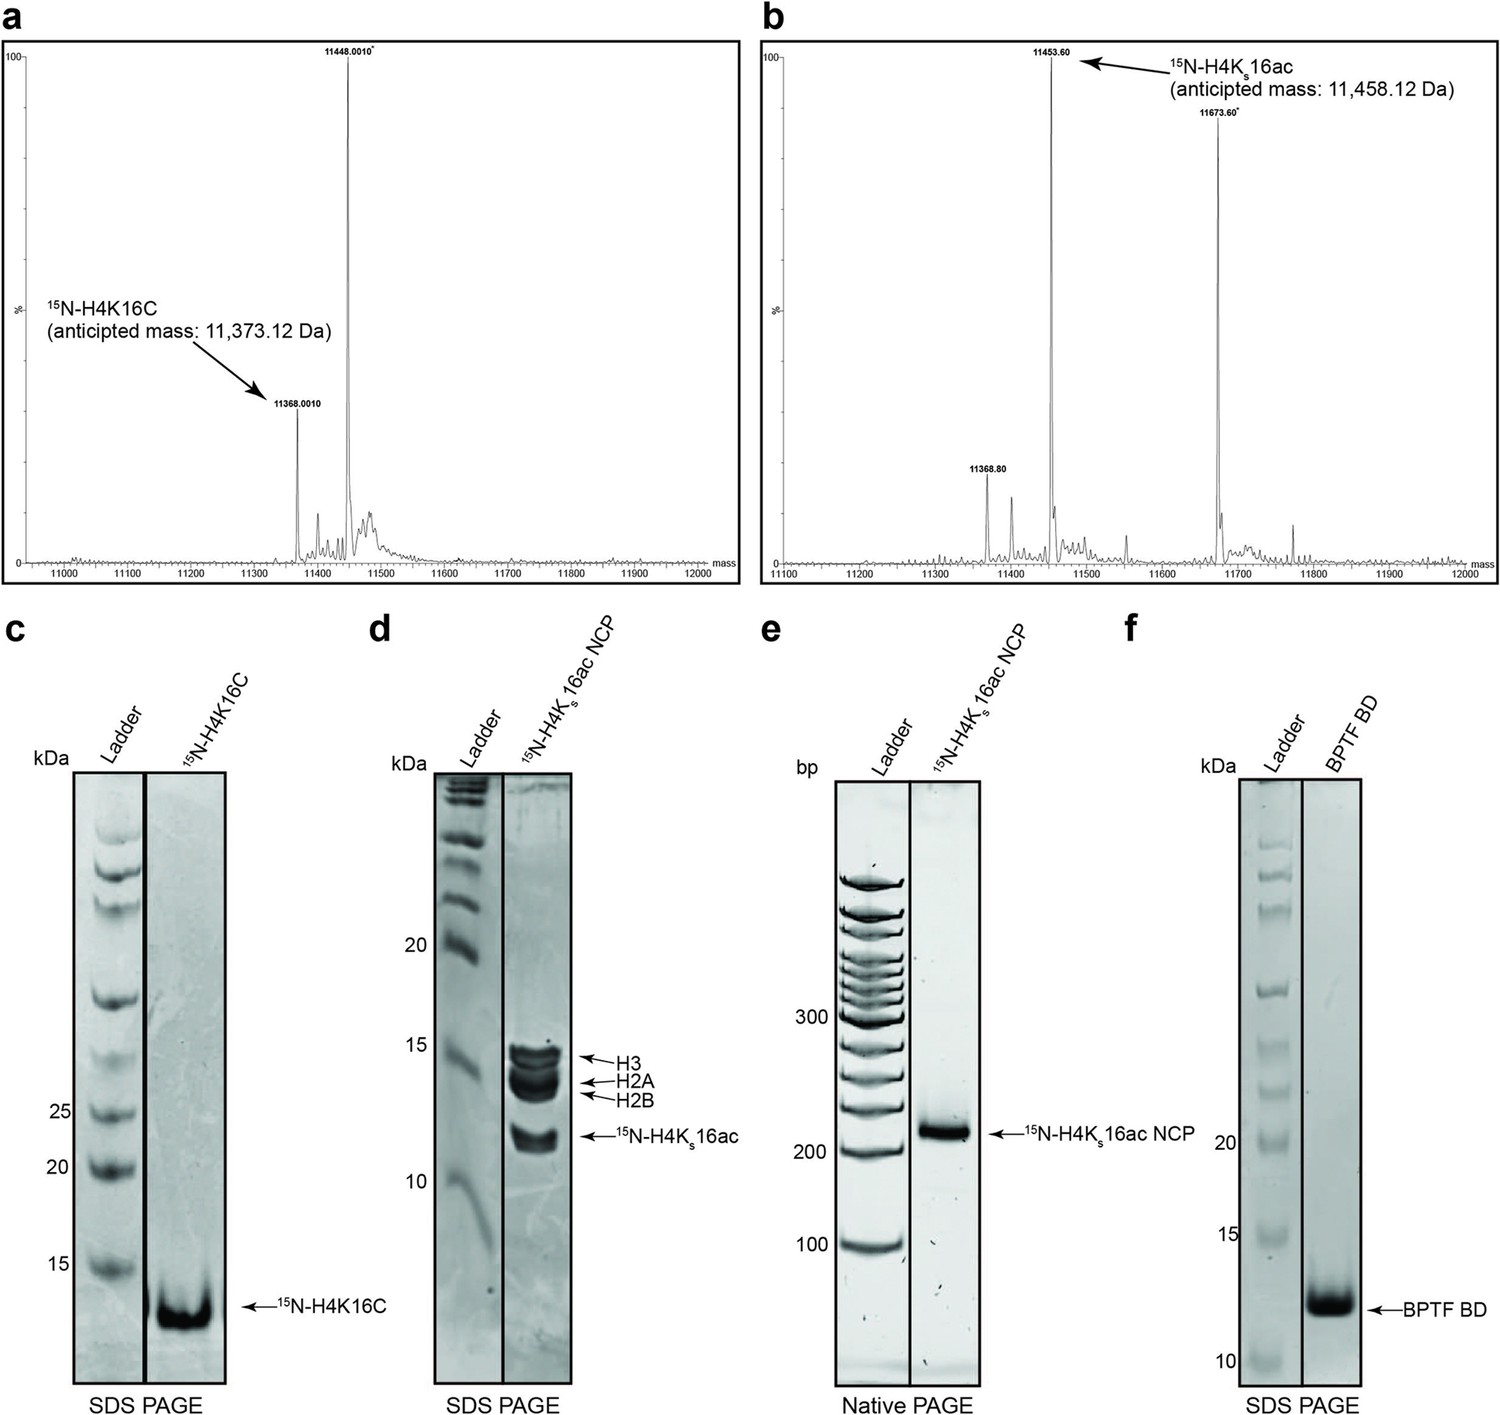
Representative QC (H4KS16ac related).
(a–c) Installation of the acetyl-lysine analogue was validated by MALDI mass spectrometry and purity of protein by SDS-PAGE (see ’Materials and methods’). *denotes contaminants (d) 15N-H4KS16ac containing nucleosome core particle (NCPs) were resolved by reducing SDS-PAGE and Coomassie stained to interrogate histone stoichiometry. (e) The 15N-H4KS16ac containing NCP was resolved by native PAGE and stained with ethidium bromide to demonstrate reconstitution/absence of free DNA. (f) Bromodomain PHD finger transcription factor (BPTF) Bromodomain (BD) purity was assessed by SDS-PAGE.
-
Figure 4—figure supplement 3—source data 1
Full SDS-PAGE image of histone H4K16C protein purification for H4Ks16ac installation.
- https://cdn.elifesciences.org/articles/78866/elife-78866-fig4-figsupp3-data1-v2.zip
-
Figure 4—figure supplement 3—source data 2
Full SDS-PAGE image for 15N-H4Ks16ac-NCP reconstitution, stained with coomassie blue.
- https://cdn.elifesciences.org/articles/78866/elife-78866-fig4-figsupp3-data2-v2.zip
-
Figure 4—figure supplement 3—source data 3
Full native gel image for 15N-H4Ks16ac-NCP reconstitution, stained with ethidium bromide.
- https://cdn.elifesciences.org/articles/78866/elife-78866-fig4-figsupp3-data3-v2.zip
-
Figure 4—figure supplement 3—source data 4
Full SDS-PAGE image for BPTF BD, stained with coomassie blue.
- https://cdn.elifesciences.org/articles/78866/elife-78866-fig4-figsupp3-data4-v2.zip
Figure 4—figure supplement 4
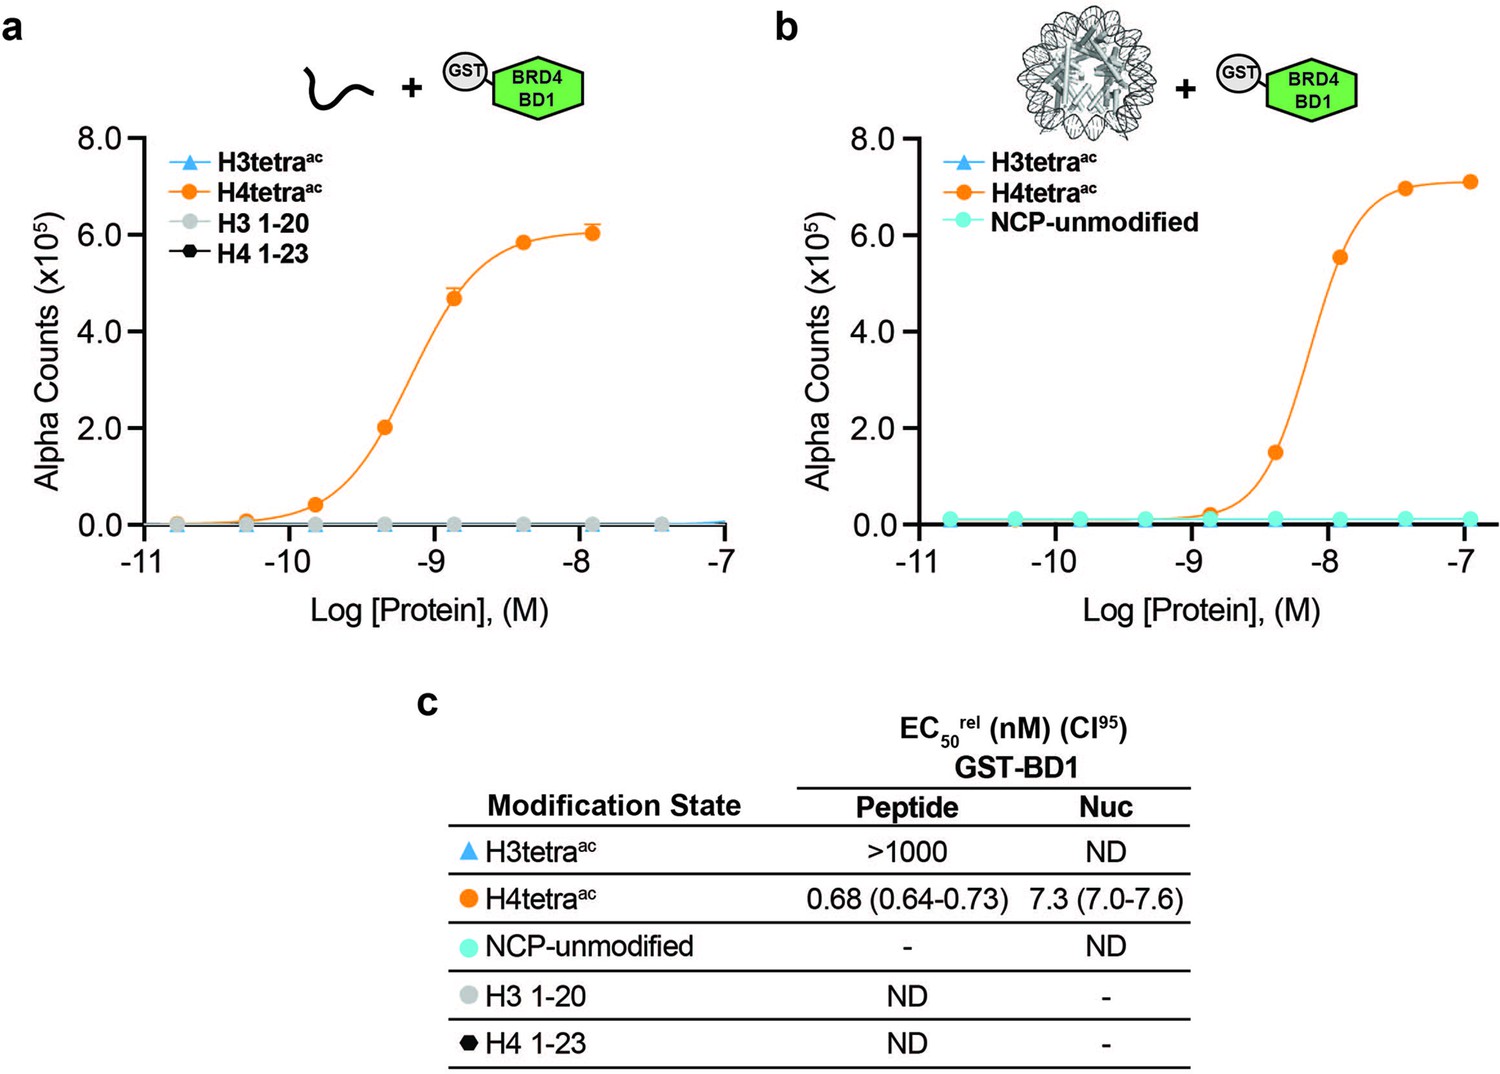
BRD4 GST-BD1 binds acetylated histone H4 tail peptides and NCPs.
(a–b) Alpha counts plotted as a function of GST-BRD4-BD1 Query concentration for peptide (a) or NCP (b) Targets. (c) EC50rel (with CI95) values calculated from dCypher curves in (a) and (b). Targets color coded as per legends. ND, Not detected. -, Not testable.
Figure 5
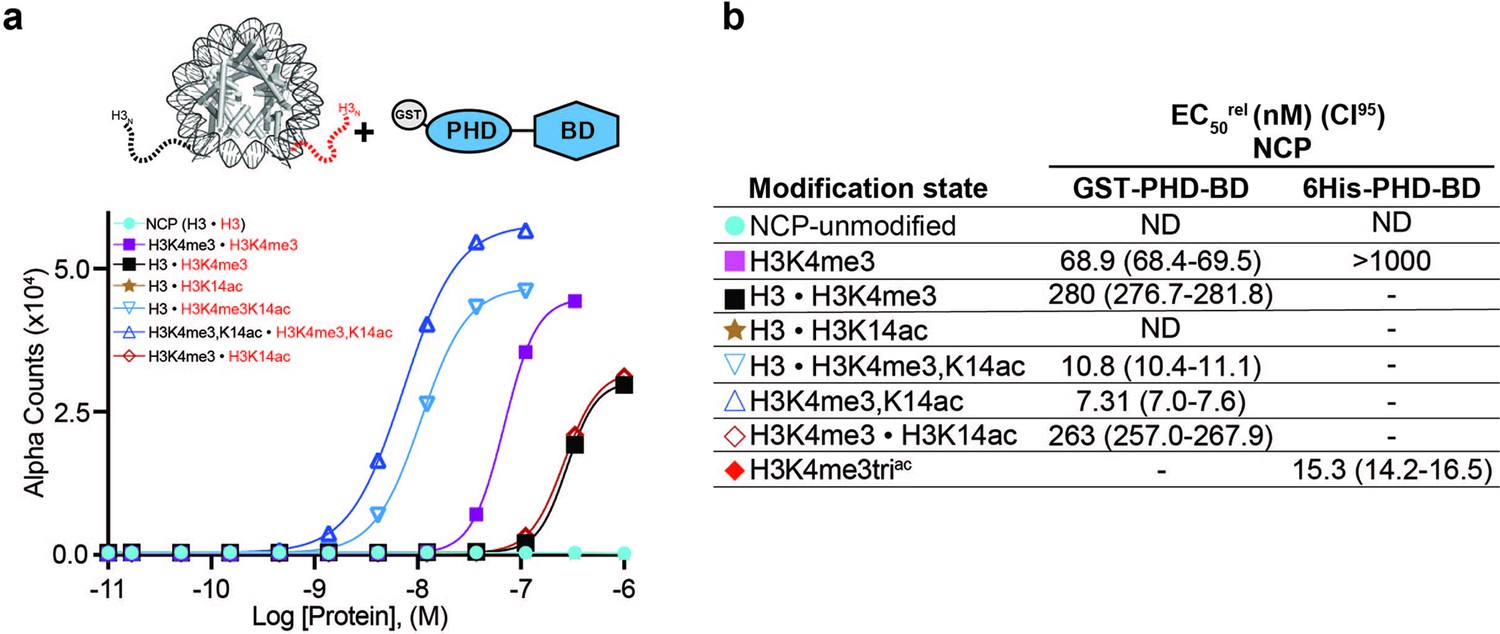
BPTF PHD-BD binds its target PTMs on the H3 tail in cis vs. trans.
(a) dCypher assay Alpha counts plotted as a function of GST-PHD-BD Query concentration to homotypic (e.g. [H3 • H3]) or heterotypic (e.g. [H3 • H3K4me3]) NCP Targets (created as in ’Materials and methods’). (b) Relative EC50 (EC50rel) and 95% confidence interval (CI95) values from dCypher curves (in a; for calculation see ’Materials and methods’). • indicates a heterotypic Target. Limited testing data from a 6His-PHD-BD query added for comparison. Targets are color coded as per legends. ND, Not detected; -, Not tested.
Figure 6 with 1 supplement

The in vitro combinatorial preference of BPTF PHD-BD is recapitulated in vivo.
(a) CUTANA nucleosome spike-ins contain a 5’biotin for immobilization to magnetic beads and a DNA barcode to define post-translational modification (PTM) status/monitor release into the CUT&RUN eluate. A four-member panel was assembled to explore GST-PHD-BD binding (unmodified, H3K4me3, H3tetraac, H3K4me3triac; on 80-N-25 DNA containing a central 147 bp 601 Nucleosome positioning sequence with embedded 22 bp DNA barcode). (b) GST-PHD-BD shows strong preference for spike-in nucleosome containing H3K4me3triac. Table shows relative release of spike-ins (percent barcoded nucleosome/total barcode reads) in Reader CUT&RUN (’Materials and methods’). Antibodies are noted by column; GST-BPTF (PHD-BD) is detected by α-GST to facilitate pAG-MNase recruitment. ‘Nucleosome bandwidth’ is the percentage of total sequence reads taken up by spike-in standards. (c) Heatmap of CUT&RUN signal aligned to the transcription start site (TSS, +/−2 kb) of 18,793 genes in K562 cells. Rows were k-means clustered into four groups (boxed) using ChAsE chromatin analysis tool (Younesy et al., 2016). High and low signal (red and blue, respectively) are ranked by / linked to H3K4me3 (top to bottom). (d) CUT&RUN RPKM normalized tracks at representative loci using Integrative Genomics Viewer (IGV, Broad Institute). Note the co-localization of BTPF (endogenous) or GST-PHD-BD (exogenous) with H3K4me3 and H3K18ac; that H3K18ac alone is insufficient to recruit BTPF or GST-PHD-BD; and that GST-PHD-BD shows robust recruitment at some locations where BPTF is absent (e.g. B4GALT2 promoter; see ‘Discussion’).
Figure 6—figure supplement 1
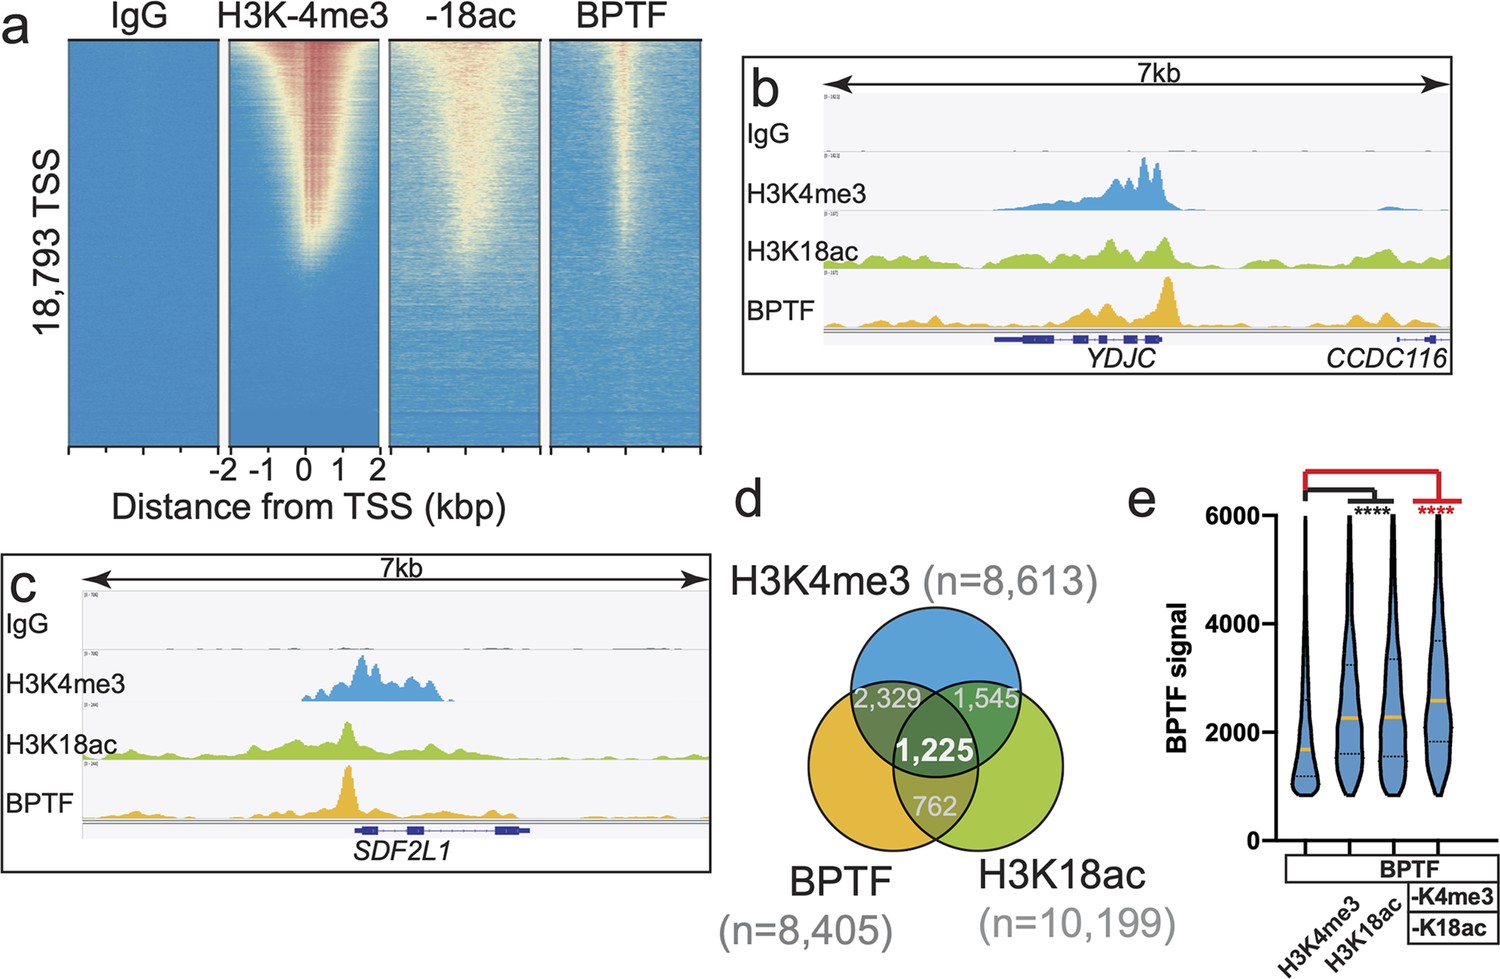
The combinatorial PTM preference of BPTF PHD-BD in vitro is mirrored by its in vivo co-localization.
(a) Heatmap of CUT&RUN signal (see ’Materials and methods’) aligned to the transcription start site (TSS, +/−2 kb) of 18,793 genes in K562 cells. High and low signal (red and blue, respectively) are ranked by / linked to H3K4me3 (top to bottom). (b–c) CUT&RUN RPKM normalized tracks at representative loci using Integrative Genomics Viewer (IGV, Broad Institute). Note the general co-localization of BTPF (endogenous) with H3K4me3 and H3K18ac. (d) Venn overlap for H3K4me3, H3K18ac and BPTF peaks. Peaks were called using SEACR, designed for the Sparse Enrichment Analysis of CUT&RUN data Meers et al., 2019, and intersected using bedtools Quinlan, 2014. To compare data sets, the top peaks (number noted for each) were considered. (e) BPTF signal distribution for SEACR peaks represented as a Violin plot, and derived from Venn diagram groups. Column 1 depicts the signal distribution for all 8,405 BPTF peaks. Other columns depict BPTF peaks that overlap with peaks for H3K4me3, H3K18ac, or both PTMs (as noted). The Fisher exact test was used to determine if BPTF co-occupancy with specific PTMs or combinations were statistically significant (**** denotes p-value <10–4). See Supplementary file 2E for sequencing statistics; all project files available at Gene Expression Omnibus (GEO) accession GSE150617.
Additional files
-
Supplementary file 1
dCypher data.
(A): dCypher data analysis EC50rel (lower CI95 - upper CI95). (B) dCypher analysis select EC50rel comparison. (C) dCypher analysis t-tests. (D) Figure 1C raw data (GST-PHD-BD; peptides). (E) Figure 1D raw data (GST-PHD-BD; nucleosomes). (F) Figure 2B upper raw data (GST-PHD-BD N3007A; nucleosomes). (G) Figure 2B lower raw data (GST-PHD-BD W2891A; nucleosomes). (H) Figure 3B raw data 6His-PHD-BD; nucleosomes. (I) Figure 5A raw data (GST-PHD-BD; heterotypic nucleosomes). (J) Extended Figure 1B raw data (GST-PHD-BD; peptide screen). (K) Extended Figure 1C raw data (GST-PHD-BD; nucleosome screen). (L) Extended Figure 1D raw data (GST-PHD-BD; peptides). (M) Extended Figure 1E raw data (GST-PHD-BD; nucleosomes). (N) Extened Figure 1F raw data (GST-PHD-BD; nucleosomes). (O) Extended Figure 2C raw data (6His-PHD; peptides). (P) Extended Figure 2D raw data (6His-PHD; nucleosomes).(Q) Extended Figure 2E raw data (GST-PHD; nucleosomes). (R) Extended Figure 2F raw data (6His-BD; peptides). (S) Extended Figure 2G raw data (6His-BD; nucleosomes). (T) Extended Figure 3D raw data (Anti-H3K4me3; nucleosomes). (U) Extended Figure 4A raw data (GST-BRD4 BD; peptides). (V) Extended Figure 4B raw data (GST-BRD4 BD; nucleosomes)
- https://cdn.elifesciences.org/articles/78866/elife-78866-supp1-v2.xlsx
-
Supplementary file 2
Resources.
(A) Plasmid nd proteins. (B) dCypher peptides (287 x). (C) dCypher dNucs (59 x) (incl. heterotypics: 5 x). (D) versaNuc peptides (18 x). (E) CUT&RUN antibodies (and sequence stats).
- https://cdn.elifesciences.org/articles/78866/elife-78866-supp2-v2.xlsx
-
MDAR checklist
- https://cdn.elifesciences.org/articles/78866/elife-78866-mdarchecklist1-v2.docx
Download links
A two-part list of links to download the article, or parts of the article, in various formats.
Downloads (link to download the article as PDF)
Open citations (links to open the citations from this article in various online reference manager services)
Cite this article (links to download the citations from this article in formats compatible with various reference manager tools)
Nucleosome conformation dictates the histone code
eLife 13:e78866.
https://doi.org/10.7554/eLife.78866


