A timer gene network is spatially regulated by the terminal system in the Drosophila embryo
- Department of Zoology, University of Cambridge, United Kingdom
- Department of Systems Biology, Harvard Medical School, United States
- Department of Genetics, University of Cambridge, United Kingdom
- Department of Physiology, Development and Neuroscience, University of Cambridge, United Kingdom
- Developmental Biology Unit, EMBL, Germany
Figures
Figure 1 with 1 supplement

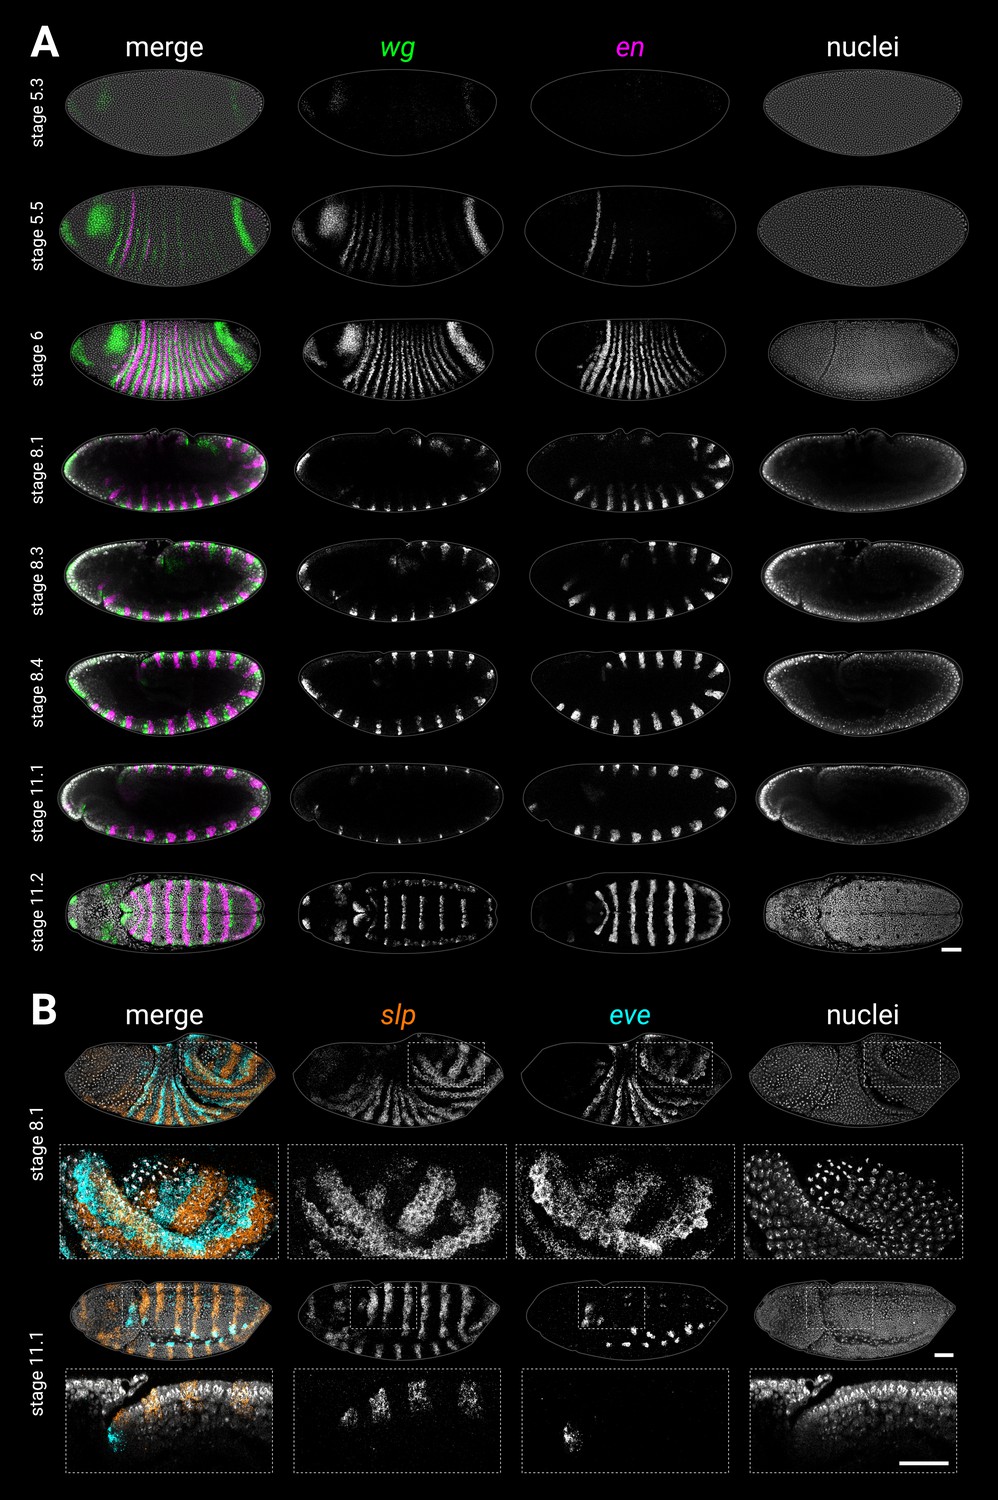
Segmentation of the tail region after gastrulation.
(A) wg and en expression from gastrulation to extended germband. Left column shows merged maximum projections of wg, en, and DAPI (nuclei). Middle column shows merged wg and en expression, either maximum projections (stage 6, stage 11.2), or sagittal sections (stage 8.1 to stage 11.1). Enlarged close-ups of the boxed regions are shown in the right column. Key expression domains are annotated with labels; newly established domains are shown in large font; wgpost = wg posterior domain. Stages 6–11.1 show lateral views, stage 11.2 is a ‘dorsal’ view that actually mainly shows the ventral side of the posterior germband due to germband extension. (B) slp1 (slp) and eve expression during the division of mitotic domain 4 (stage 8.1) and at extended germband (stage 11.1). Both stages show dorsolateral views. Left column shows a merge with DAPI (nuclei); right column shows gene expression alone. Enlarged close-ups of the boxed regions are shown below the whole embryo views; see Appendix 2: ‘Embryo images’ for details of how the close-up for stage 11.1 was re-sliced. Key expression domains are annotated with labels. (C) Schematic diagram showing the expression of key segmentation genes before tail segmentation (stage 6) and after tail segmentation (stage 11). The tail region is shaded in grey; note the expansion of the region due to morphogenesis, and the refinement of the cad domain. PSB16 is shown as a dotted line due to its vestigial nature; en16 is also depicted as narrower than the other domains. Lighter shading for eve domains represents weaker or decaying expression. C1-3, gnathal segments; T1-3, thoracic segments; A1-10, abdominal segments; Ma, mandibular segment; Mx, maxillary segment; Lb, labial segment. All embryos are anterior left, dorsal up. Scale bars = 50 μm; grey lines show embryo outlines.
Figure 1—figure supplement 1
Single-channel images.
(A) Individual wg, en, and DAPI (nuclei) channels from the two-channel and three-channel merges shown in Figure 1A, plus two additional embryos (stage 5.2 and stage 5.4) showing wg and en expression at earlier stages. (B) Individual slp, eve, and DAPI (nuclei) channels from the two-channel and three-channel merges shown in Figure 1B. Embryo orientations as described for Figure 1. Scale bars = 50 μm; grey lines show embryo outlines.
Figure 2 with 4 supplements
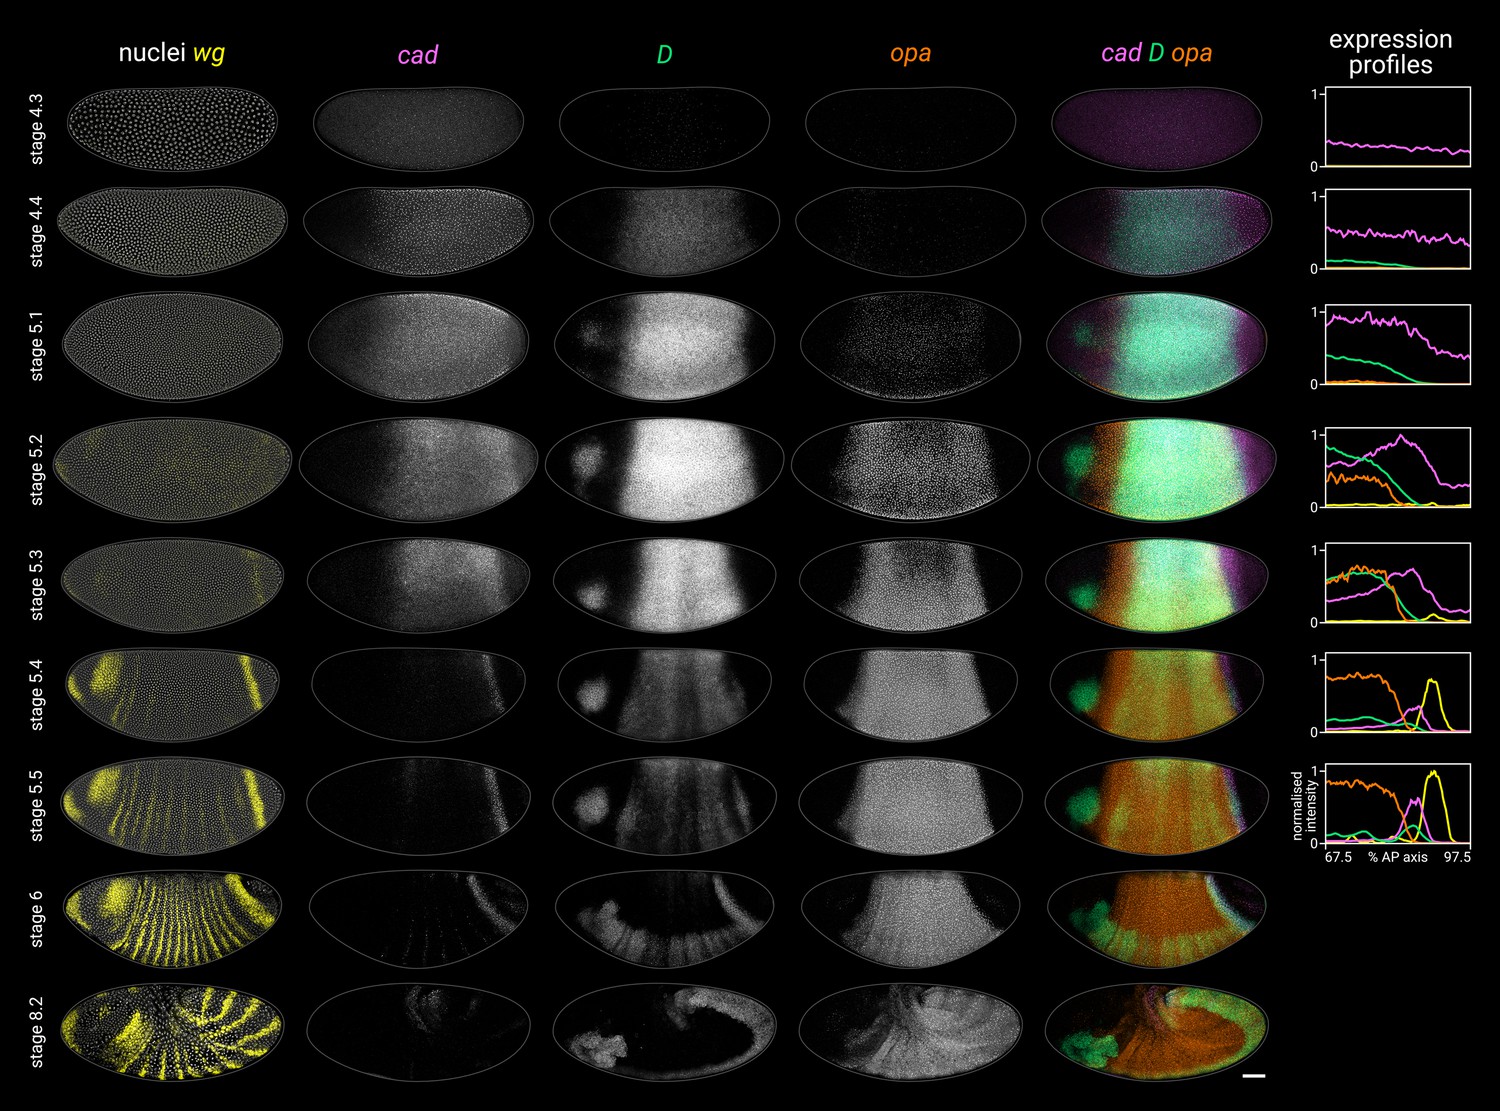
Timer gene expression dynamics in wild-type embryos.
Column 1 shows a two-channel wg and DAPI (nuclei) merge for embryos of gradually increasing age; columns 2–4 show cad, D, and opa channels from the same embryos; column 5 shows a three-channel cad/D/opa merge. The plots at the right show quantitative expression traces (67.5–97.5% AP axis; all measurements from the anterior pole) for all four genes, extracted from the embryos pictured to the left. The stage 4.3, stage 4.4, and stage 5.1 embryos are from a different scanning session compared to the rest of the figure. All embryos are anterior left, dorsal up. Stages 4.3–6 show lateral views; stage 8.2 is dorsolateral. Scale bar = 50 μm; grey lines show embryo outlines.
-
Figure 2—source data 1
Expression trace source data.
- https://cdn.elifesciences.org/articles/78902/elife-78902-fig2-data1-v2.zip
Figure 2—figure supplement 1
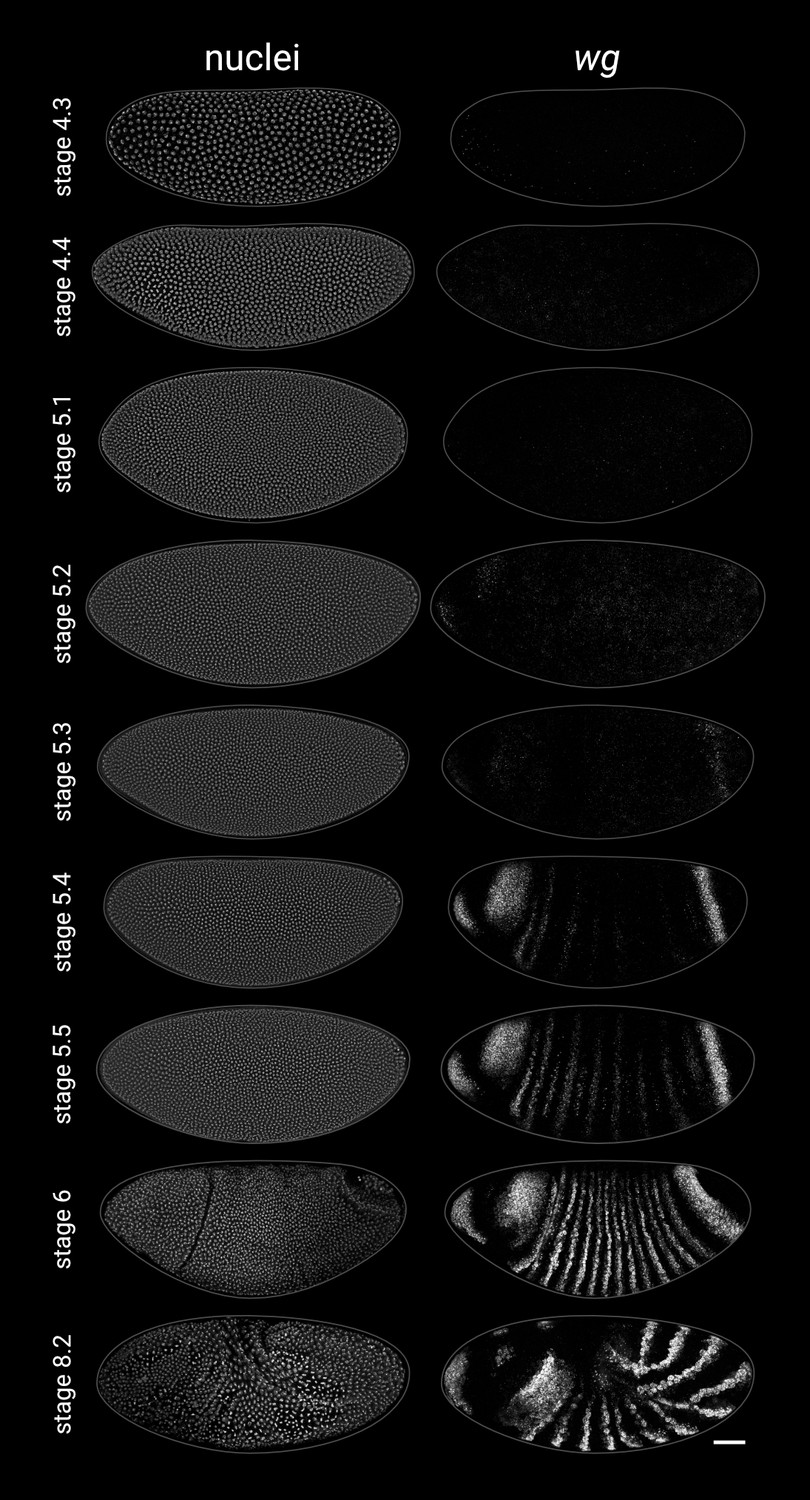
Additional single-channel images.
Individual DAPI (nuclei) and wg channels from the two-channel merges shown in the leftmost column of Figure 2. All embryos are anterior left, dorsal up. Stages 4.3–6 show lateral views, stage 8.2 is a dorsolateral view. Scale bar = 50 μm; grey lines show embryo outlines.
Figure 2—figure supplement 2
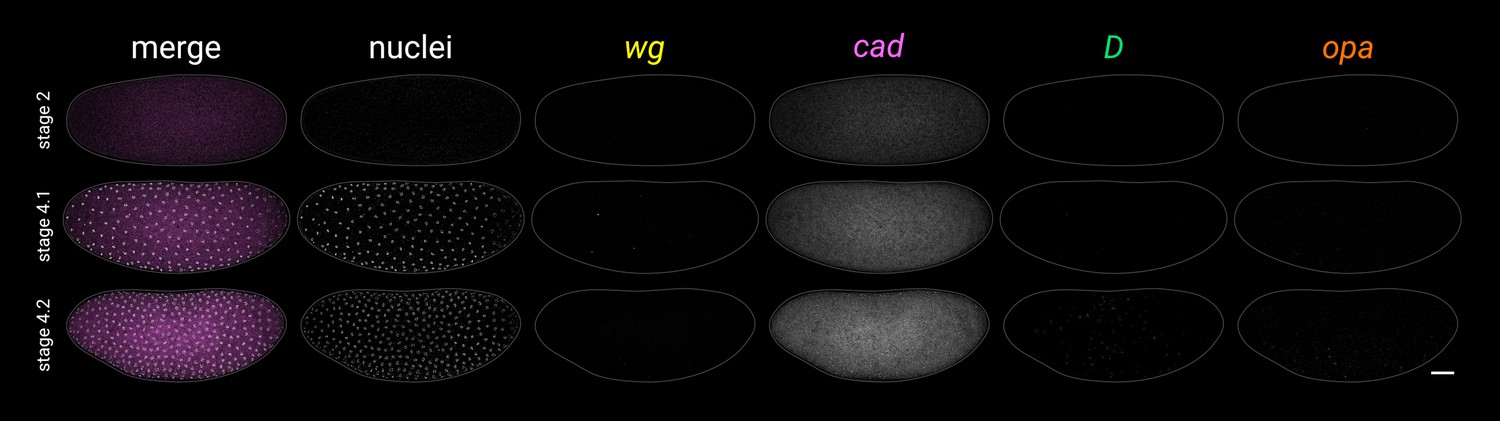
Additional early stage embryos.
Timer gene expression and DAPI (nuclei) staining in young wild-type embryos; note the weak, patchy D expression at stage 4.2. All embryos are anterior left, dorsal up, lateral view. Scale bar = 50 μm; grey lines show embryo outlines.
Figure 2—figure supplement 3
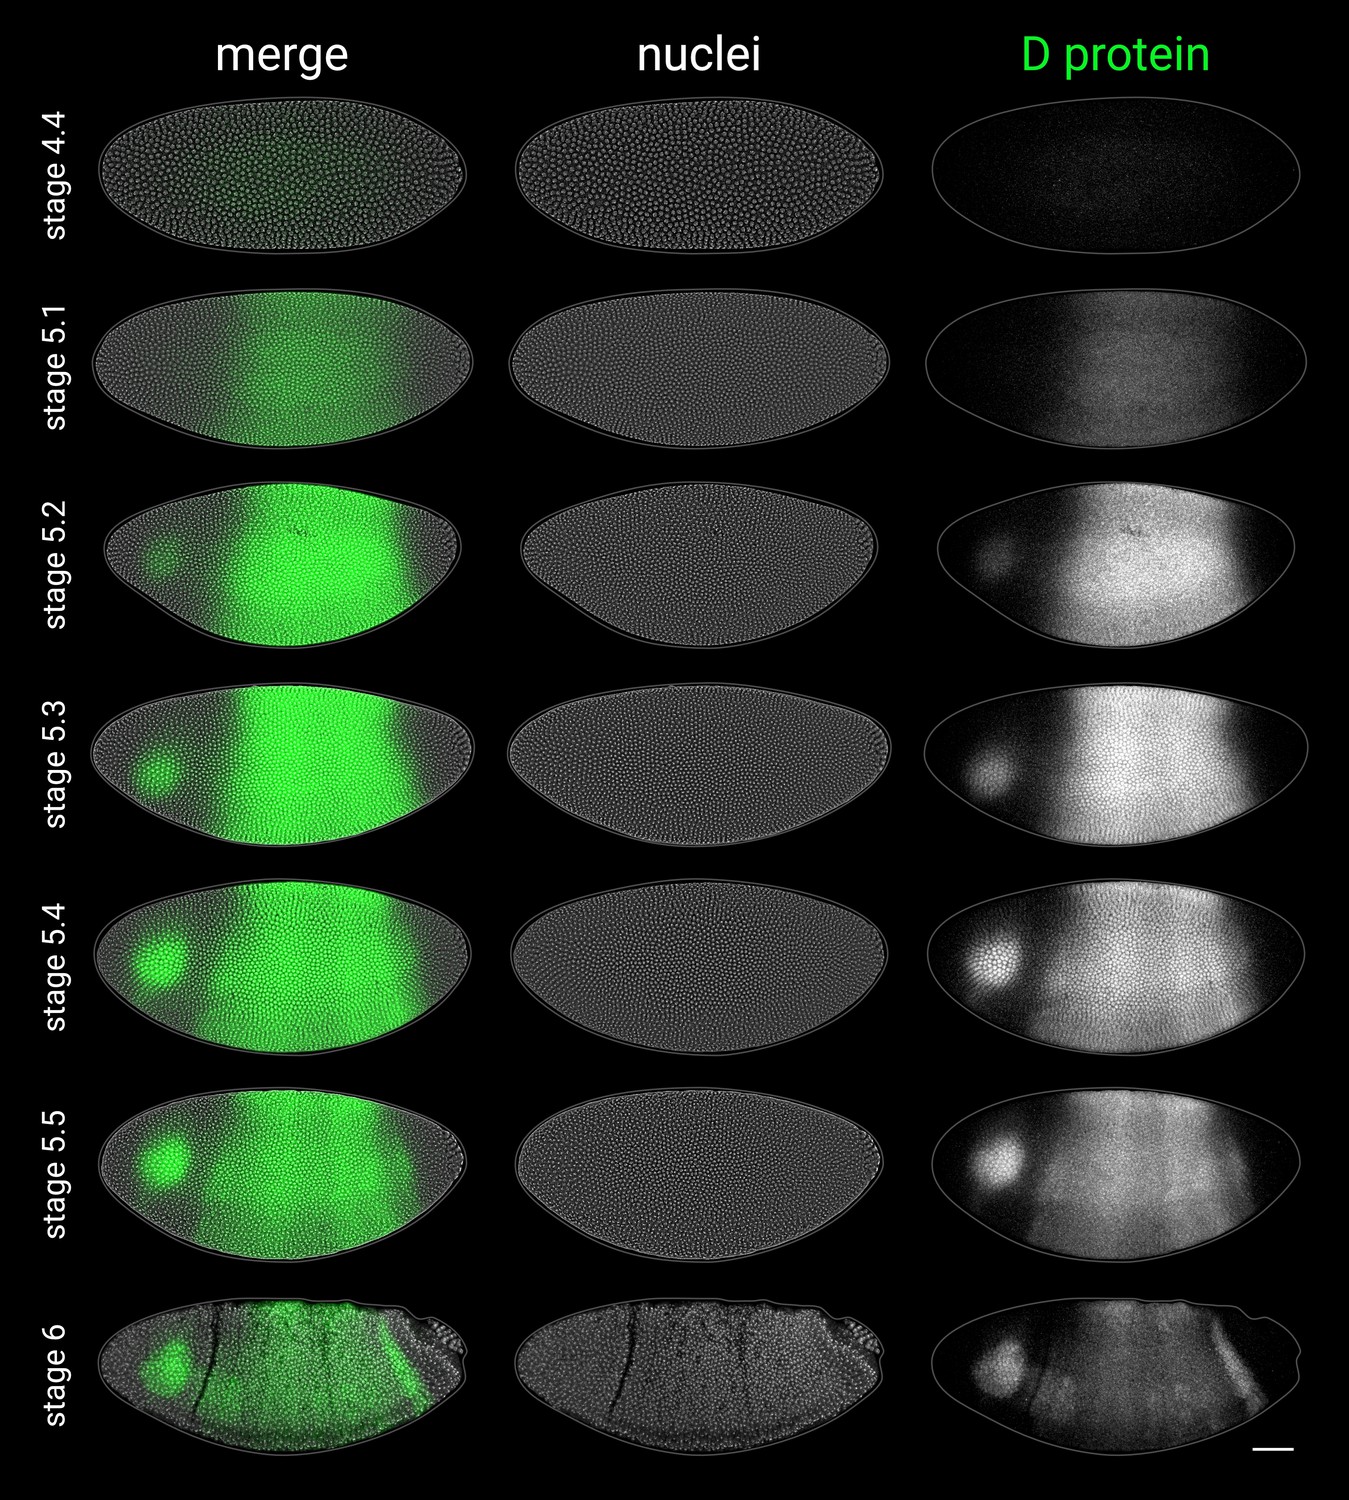
D antibody staining in embryos from stage 4 to stage 6.
As the D antibody gave high background staining in the yolk, the D protein channel shows a mean z-projection of a thin 3D ‘shell’ tracking the embryo surface (see Appendix 2—figure 1F–H), which significantly improved the signal:background ratio. All embryos are anterior left, dorsal up, lateral view. Scale bar = 50 μm; grey lines show embryo outlines.
Figure 2—figure supplement 4
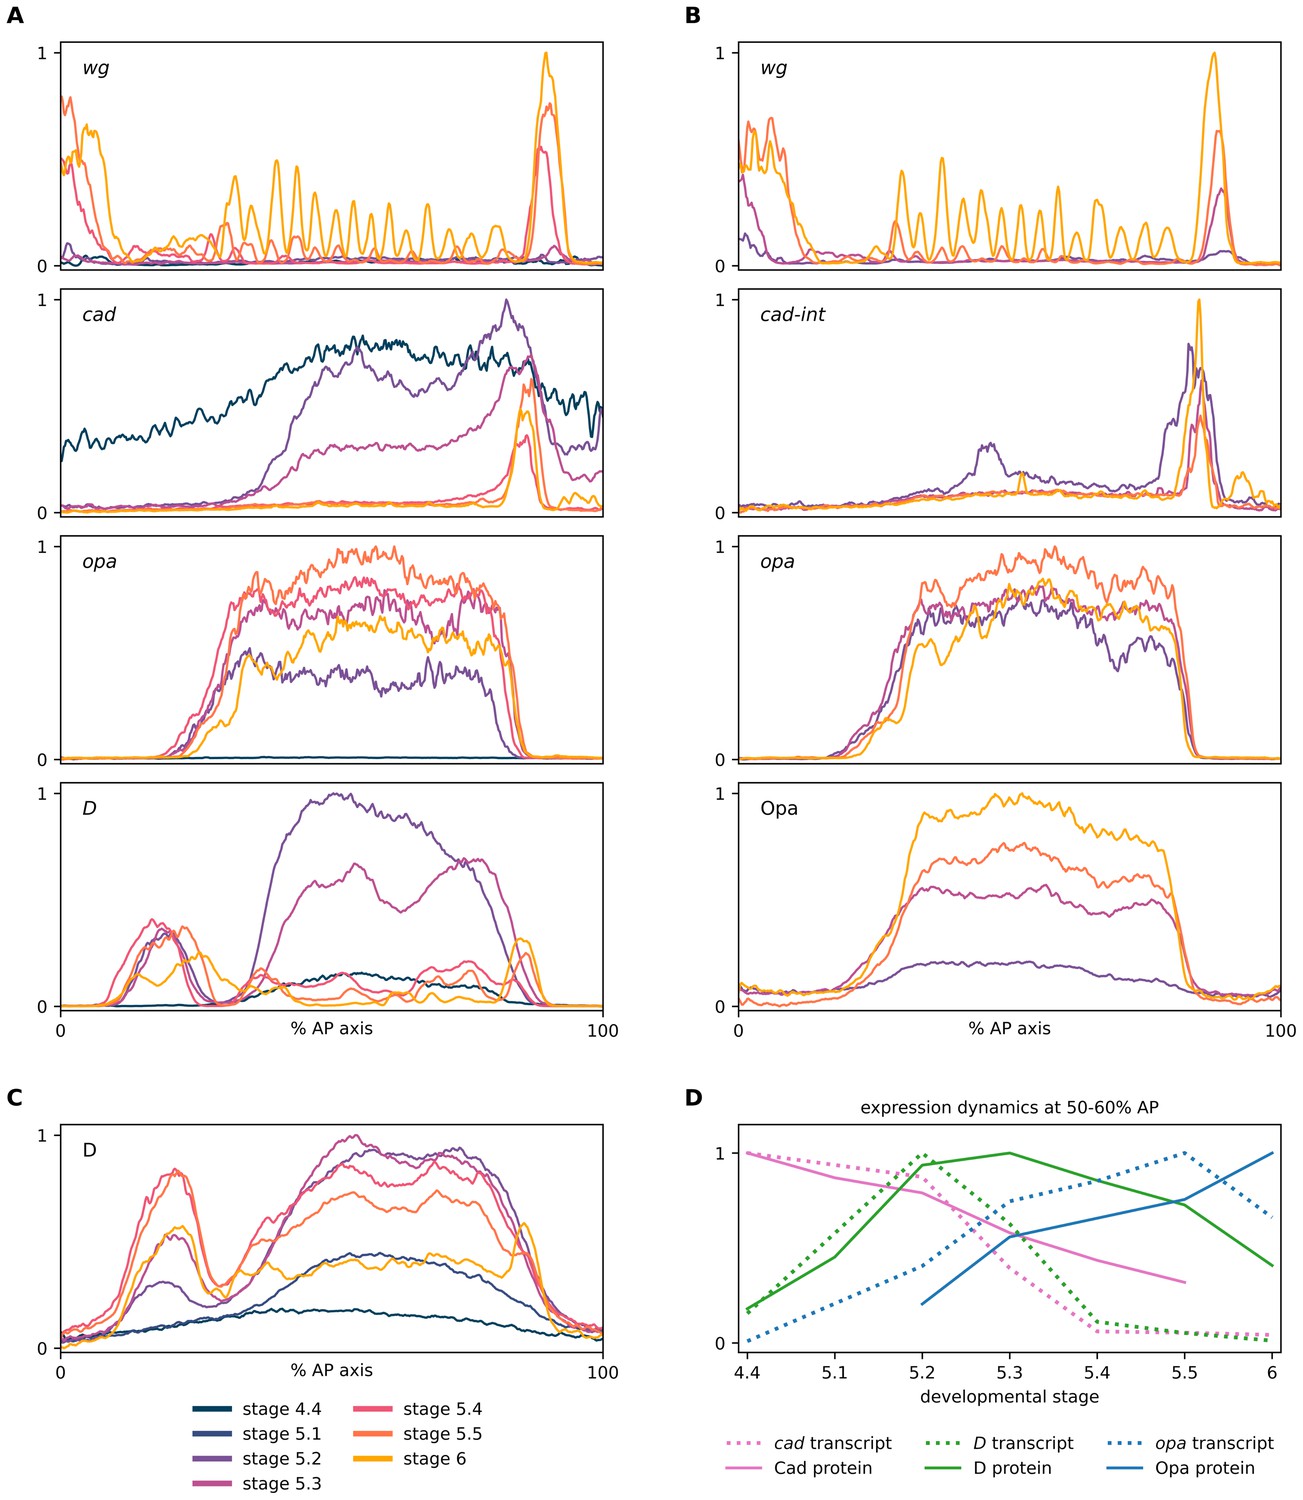
Expression dynamics of timer gene transcripts and proteins.
(A–C) Quantitative expression traces (0–100% AP axis) from individual embryos of different ages, to convey the spatiotemporal dynamics of timer gene expression within the early embryo. The line colour of a given stage is the same across all plots (see legend at bottom left of figure). All traces in a given plot are from embryos from the same tube, imaged with the same microscope settings in the same imaging session. (A) Expression traces from a wg/cad/opa/D HCR (see example source embryos in Figure 2). (B) Expression traces from a wg/cad-Intron/opa/Opa combined HCR and antibody stain (see example source embryos in Figure 3). (C) Expression traces from a D antibody stain (see example source embryos in Figure 2—figure supplement 3). (D) A rough approximation of timer gene expression dynamics at 50–60% AP axis, using normalised intensity measurements from the traces in (A) (cad, D and opa transcripts), (B) (Opa protein), (C) (D protein), and Figure 2B from Surkova et al., 2008 (Cad protein). Note the transcript/protein time lags for expression peaks and troughs.
-
Figure 2—figure supplement 4—source data 1
Expression trace source data.
- https://cdn.elifesciences.org/articles/78902/elife-78902-fig2-figsupp4-data1-v2.zip
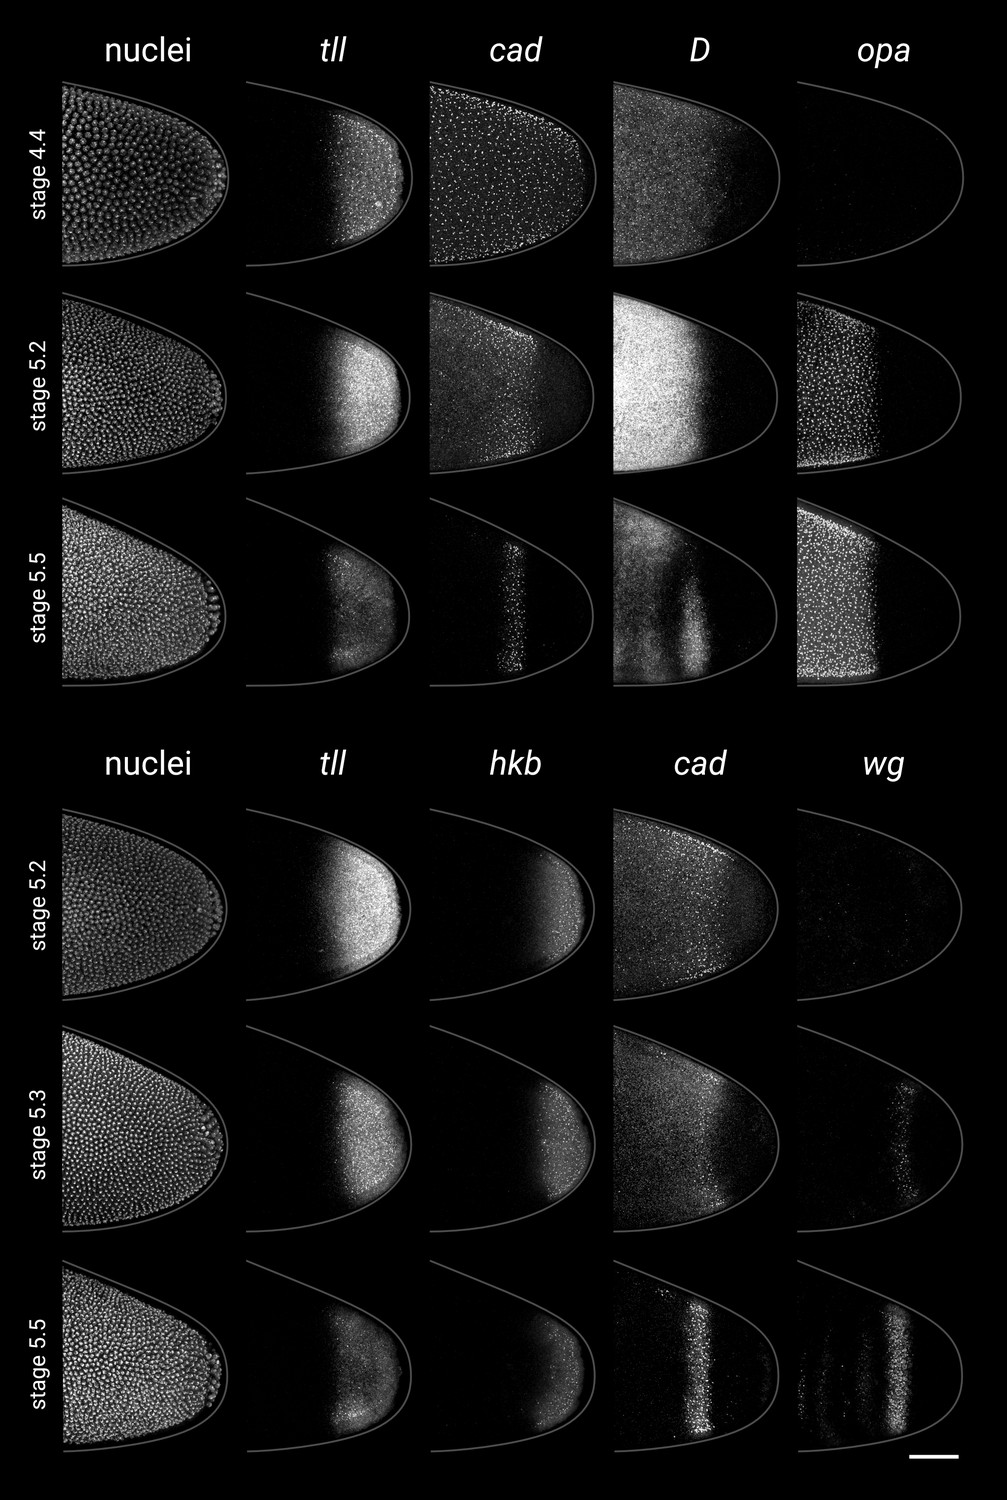
Figure 3 with 1 supplement
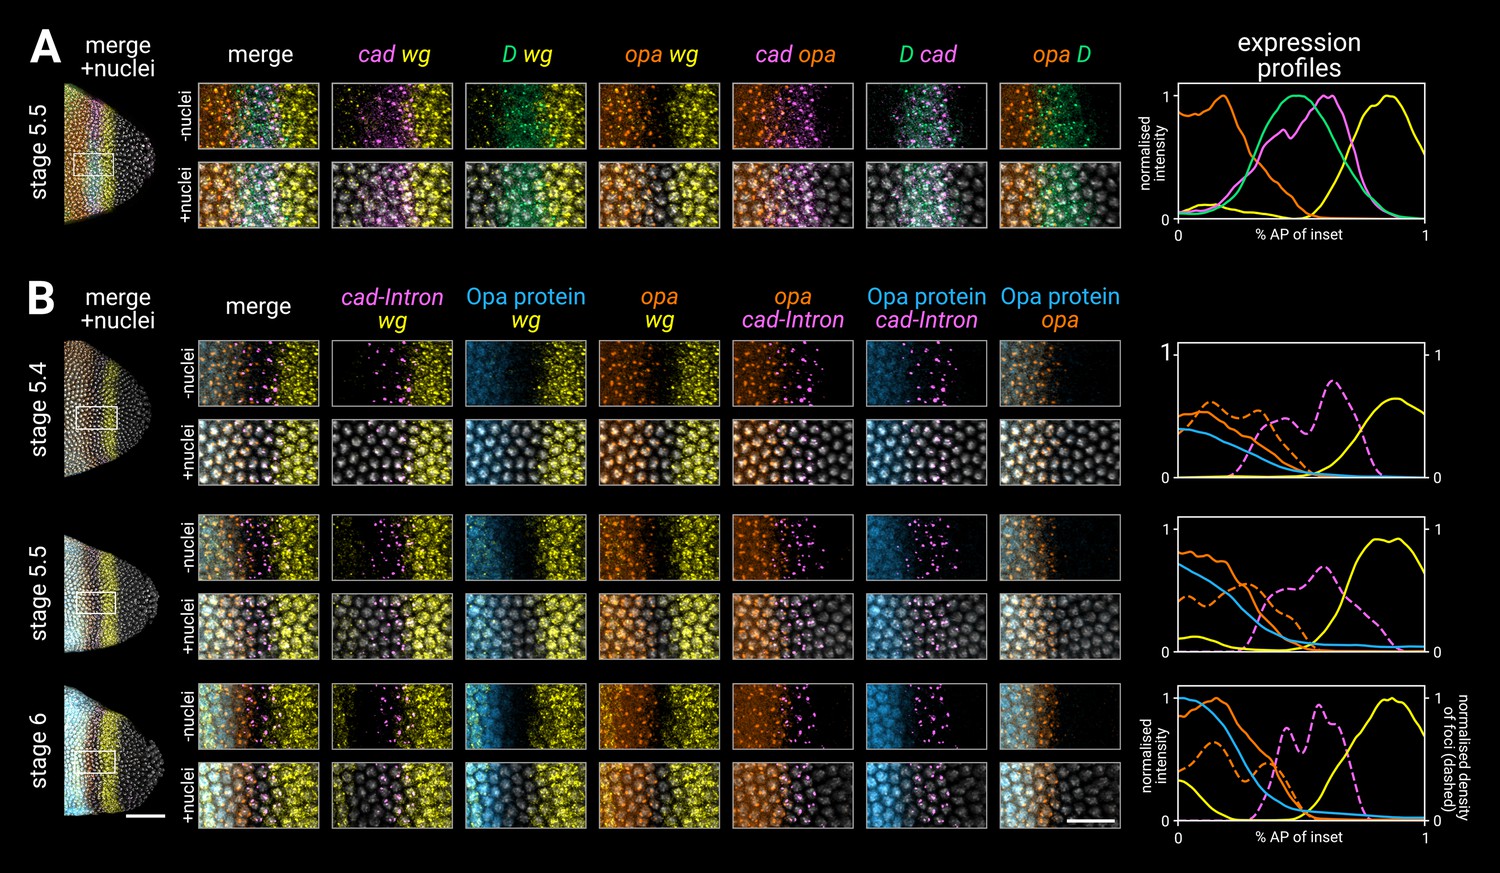
Timer gene expression in the tail region of wild-type embryos at high resolution.
(A, B) Leftmost column shows the posterior ends of the selected embryos, each with a boxed region of interest in the tail; middle columns show high-resolution close-ups of the boxed region without and with DAPI signal (‘-nuclei’ vs. ‘+nuclei’); rightmost column shows quantitative expression traces along the x-axis of the boxed region. (A) Timer gene expression, as in Figure 2. (B) wg and opa expression (as in A), combined with a cad intronic probe (cad-Intron, showing intranuclear transcription foci) and an antibody stain for Opa protein. Solid lines in the expression plots show the average intensity of wg, opa, and Opa protein; dashed lines show the normalised density of cad and opa transcription foci. Note the staggered AP distributions of Opa protein, opa transcript, and opa transcription foci, the shrinking gap between the posterior wg domain and the opa/Opa signal, and the refinement of the cad-Intron domain over time. All embryos are anterior left, dorsal up, lateral view. Scale bars = 50 μm (embryo posteriors), 20 μm (boxed close-ups). For the high-resolution close-ups, the curvature of the tissue was straightened prior to z-projection.
Figure 3—figure supplement 1
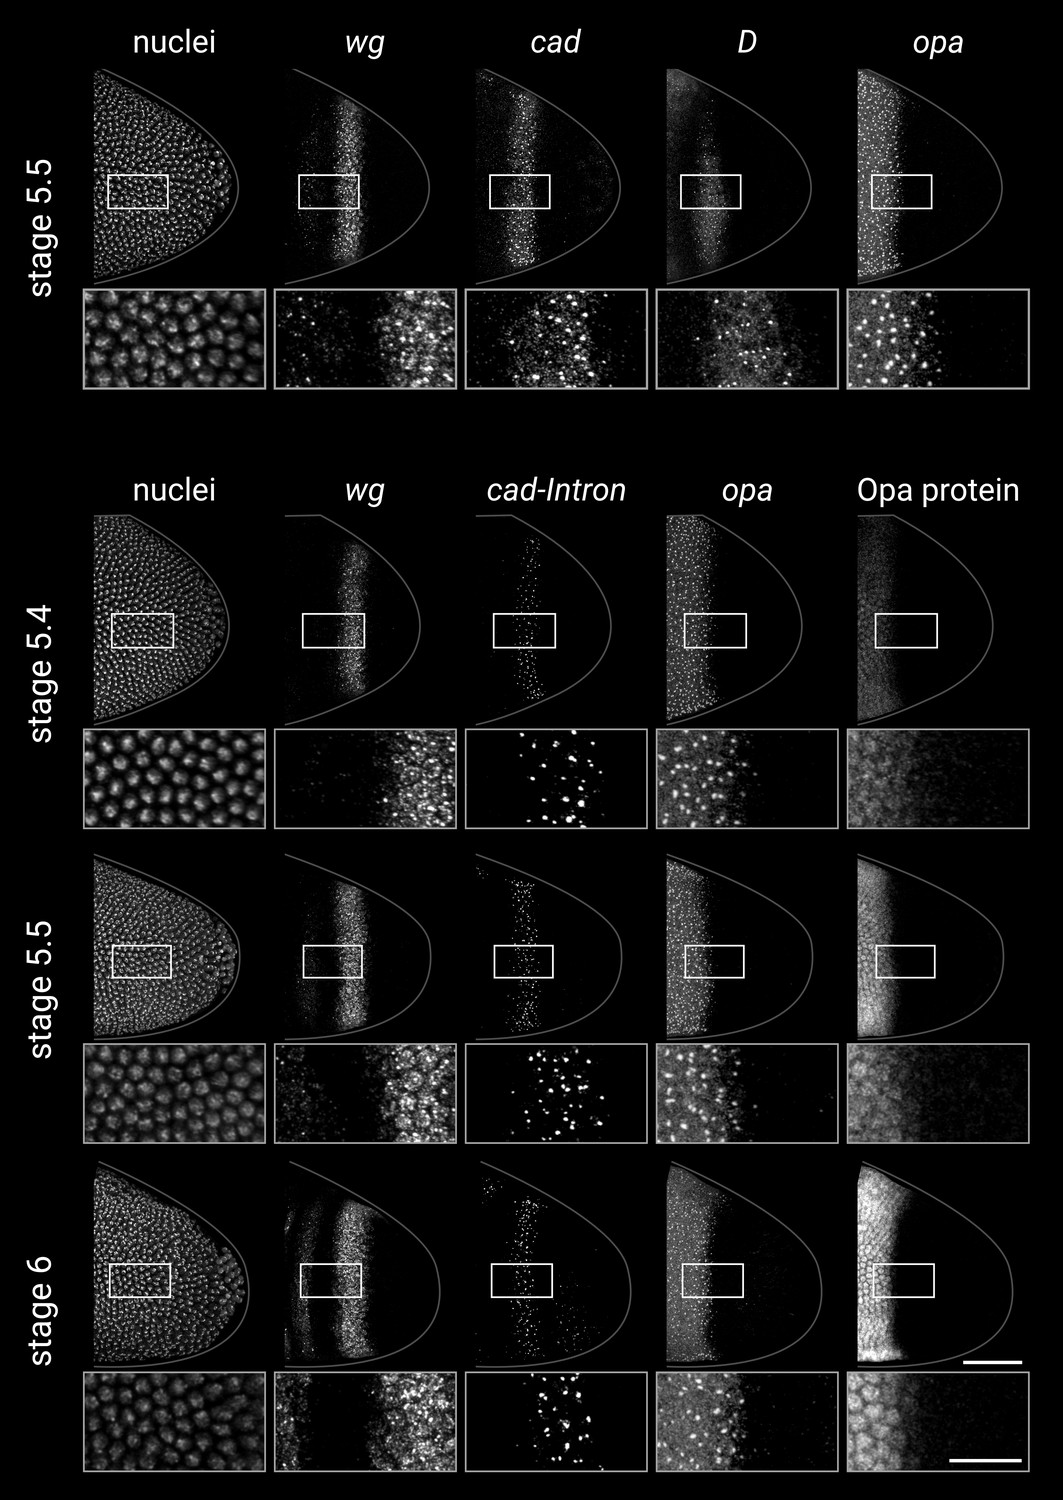
Single-channel images.
Individual channels from the two-channel and multi-channel merges shown in Figure 3. All embryos are anterior left, dorsal up, lateral view. Scale bars = 50 μm (embryo posteriors) or 20 μm (boxed close-ups); grey lines show embryo outlines.
Figure 4 with 6 supplements
Timer gene expression in timer gene mutants.
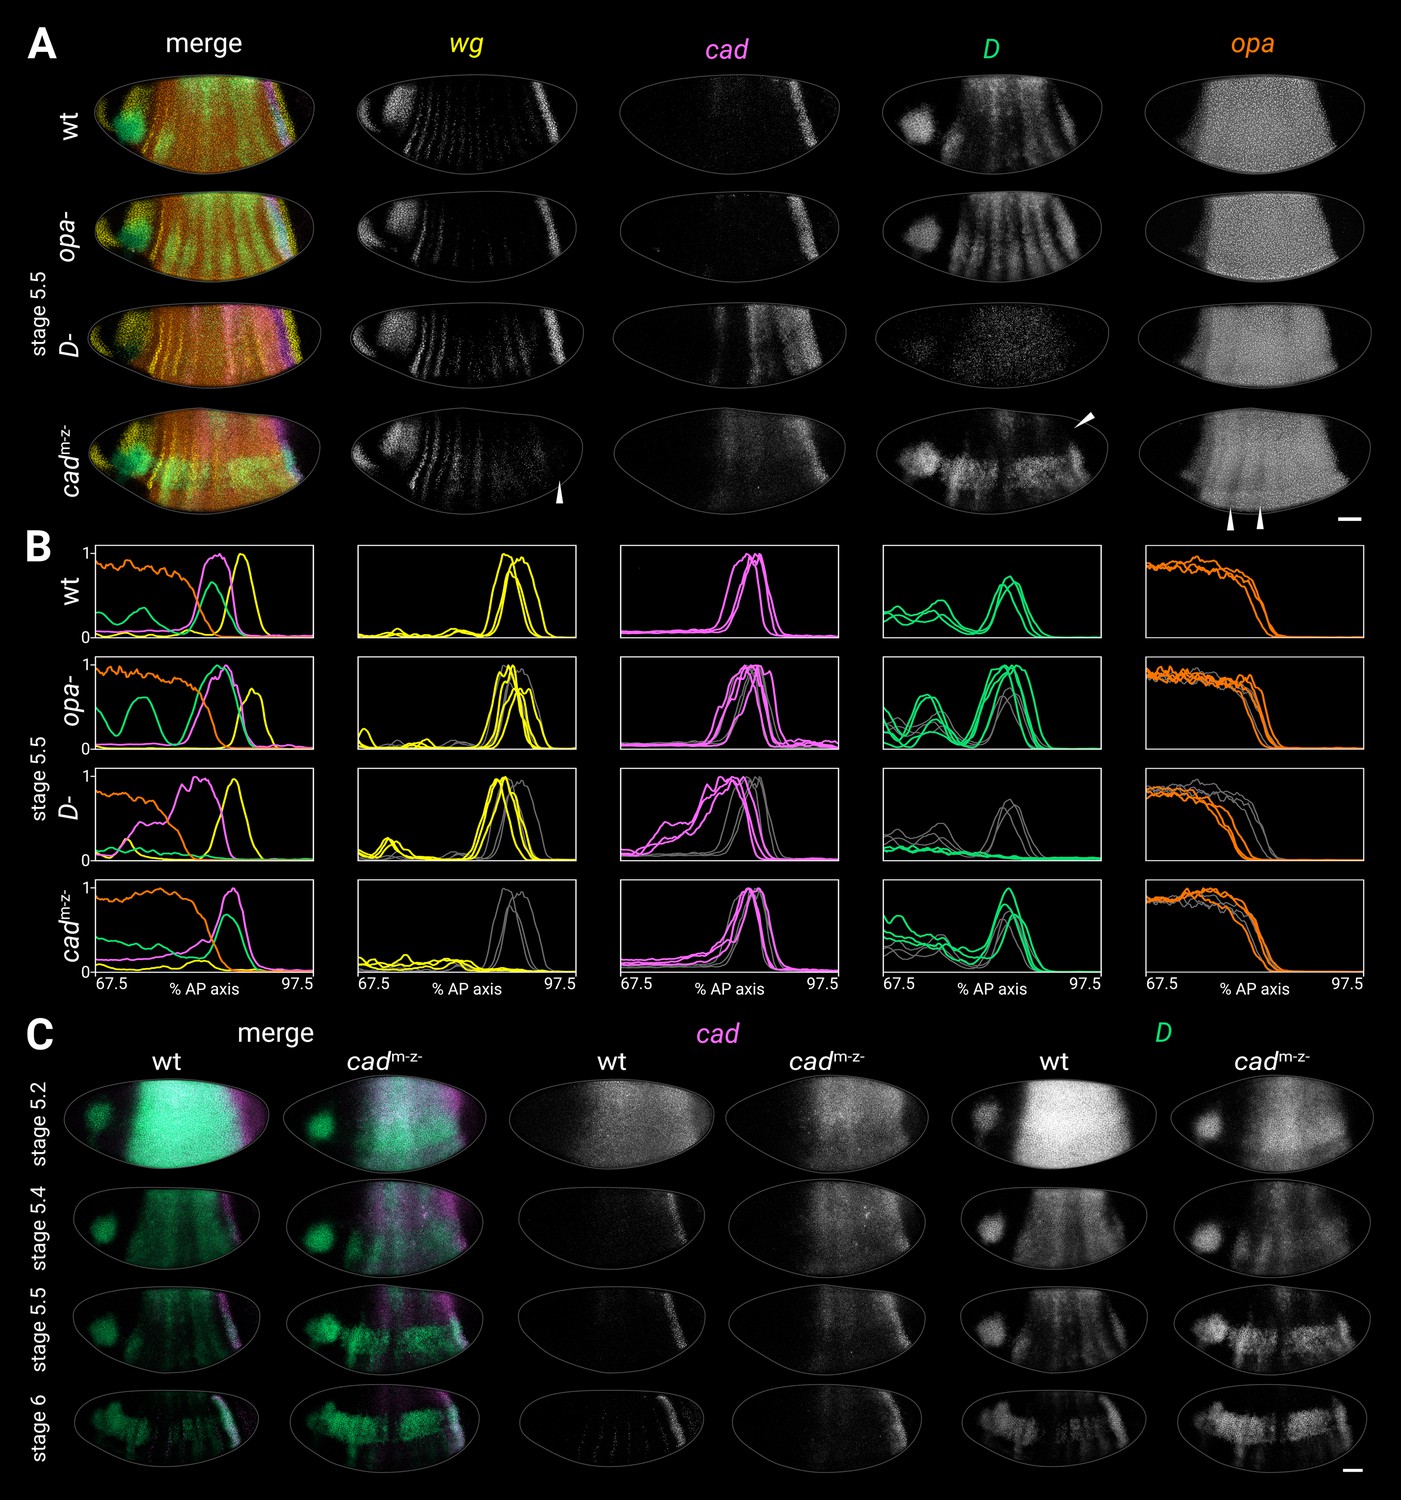
(A) Timer gene expression in wild-type, opa- mutants, D- mutants, and cadm-z- mutants at stage 5.5. The leftmost column shows a four-channel merge and the other columns show individual channels. In the cadm-z- embryo, note the absence of the wg posterior domain (arrowhead in wg channel), the dorsal loss of the D tail domain (arrowhead in D channel), and the AP modulation of the opa trunk domain (arrowheads in opa channel). The brightness and contrast of the D channel were adjusted for the D- embryo to reveal the very weak residual signal. (B) Quantitative expression traces (67.5–97.5% AP axis) from the individual embryos in (A) (multi-channel traces in leftmost column) or multiple stage 5.5 embryos (single-channel traces in other columns). All traces are individually normalised; mutant traces are overlaid on wild-type traces (grey) for ease of comparison. (C) cad and D expression in wild-type and cadm-z- mutant embryos of gradually increasing age; leftmost columns show a two-channel merge. In the cadm-z- embryos, note that cad transcript takes longer to clear from the trunk, while D is initially expressed at lower intensity and its neuroectodermal expression domain emerges earlier. All embryos are anterior left, dorsal up, lateral view. Scale bar = 50 μm; grey lines show embryo outlines.
-
Figure 4—source data 1
Expression trace source data.
- https://cdn.elifesciences.org/articles/78902/elife-78902-fig4-data1-v2.zip
Figure 4—figure supplement 1
Timer gene expression traces from timer gene mutants, relative to wild-type.
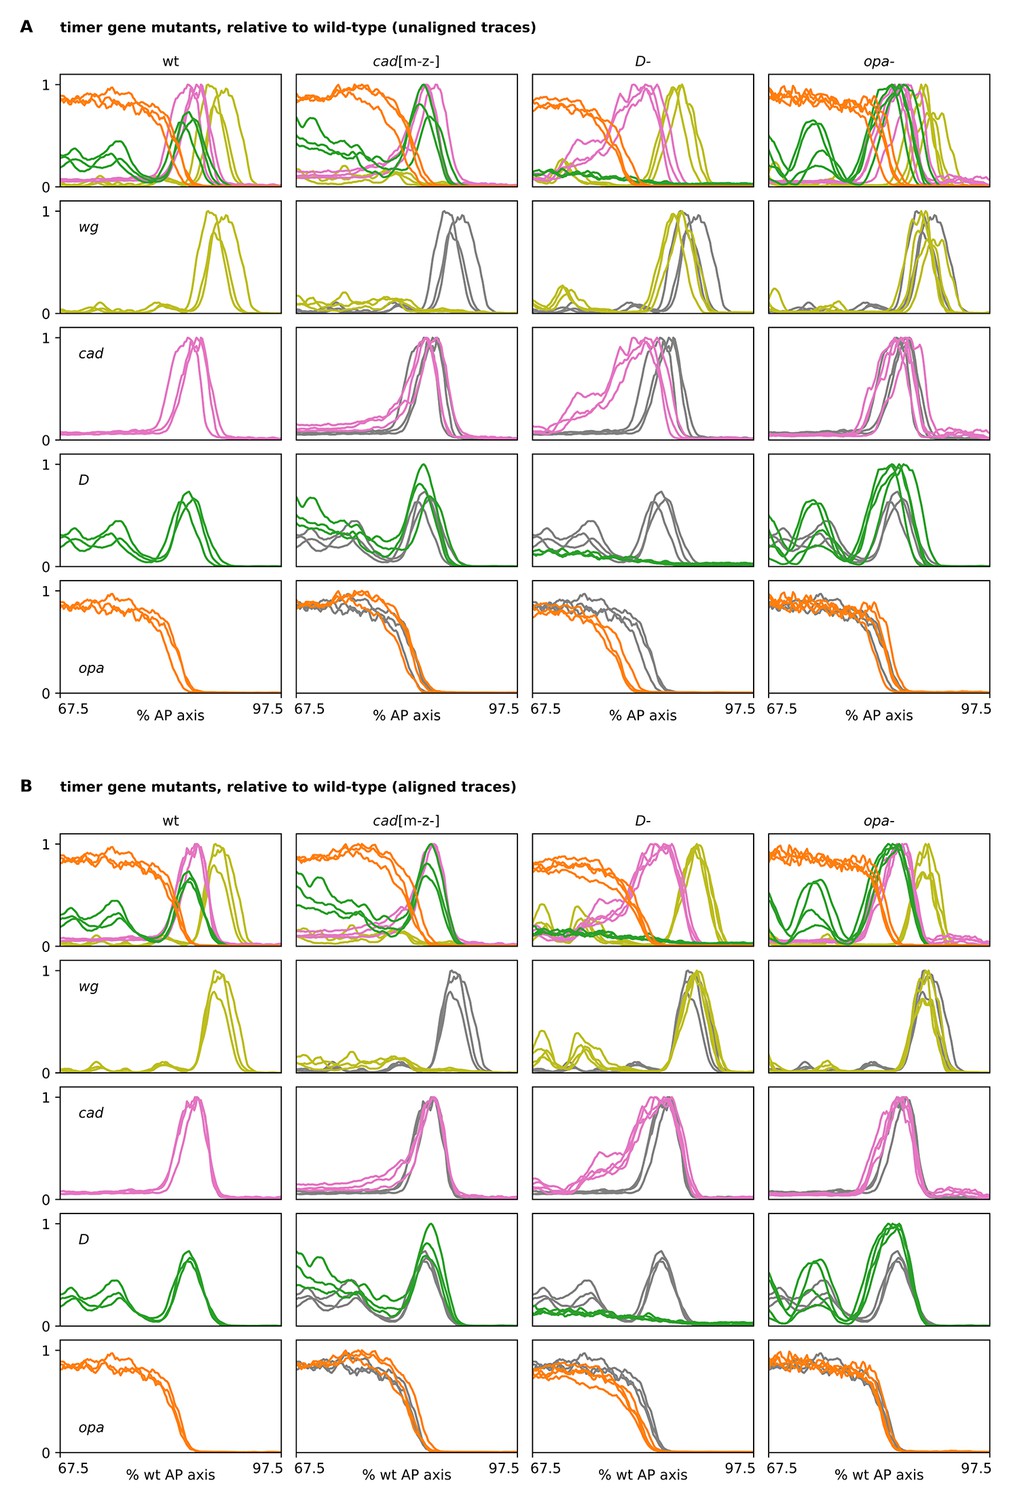
(A, B) Plots showing quantitative expression traces (67.5–97.5% AP axis) from multiple stage 5.5 embryos, individually normalised to the range 0–1. Leftmost column shows traces from wild-type embryos (coloured lines); remaining columns show traces from cadm-z-, D- or opa- mutants (coloured lines) overlaid on the same wild-type traces shown in the leftmost column (grey lines). (A) Traces without any alignment step; locations of borders/domains represent their absolute position along the AP axis. Note the loss of the wg posterior domain in cadm-z- mutants, the slight anterior shift and expansion of the fate map in D- mutants, and the stronger D tail domain in opa- mutants. (B) All traces have been aligned with each other so that the cad posterior border from each embryo lines up with the others. Note the broadened cad domain in D- mutants and the broadened D tail domain in opa- mutants. Note also the slightly increased distance between opa and wg in D- mutants. Source data is the same as Figure 4.
Figure 4—figure supplement 2
Full-length opa expression traces from timer gene mutants.
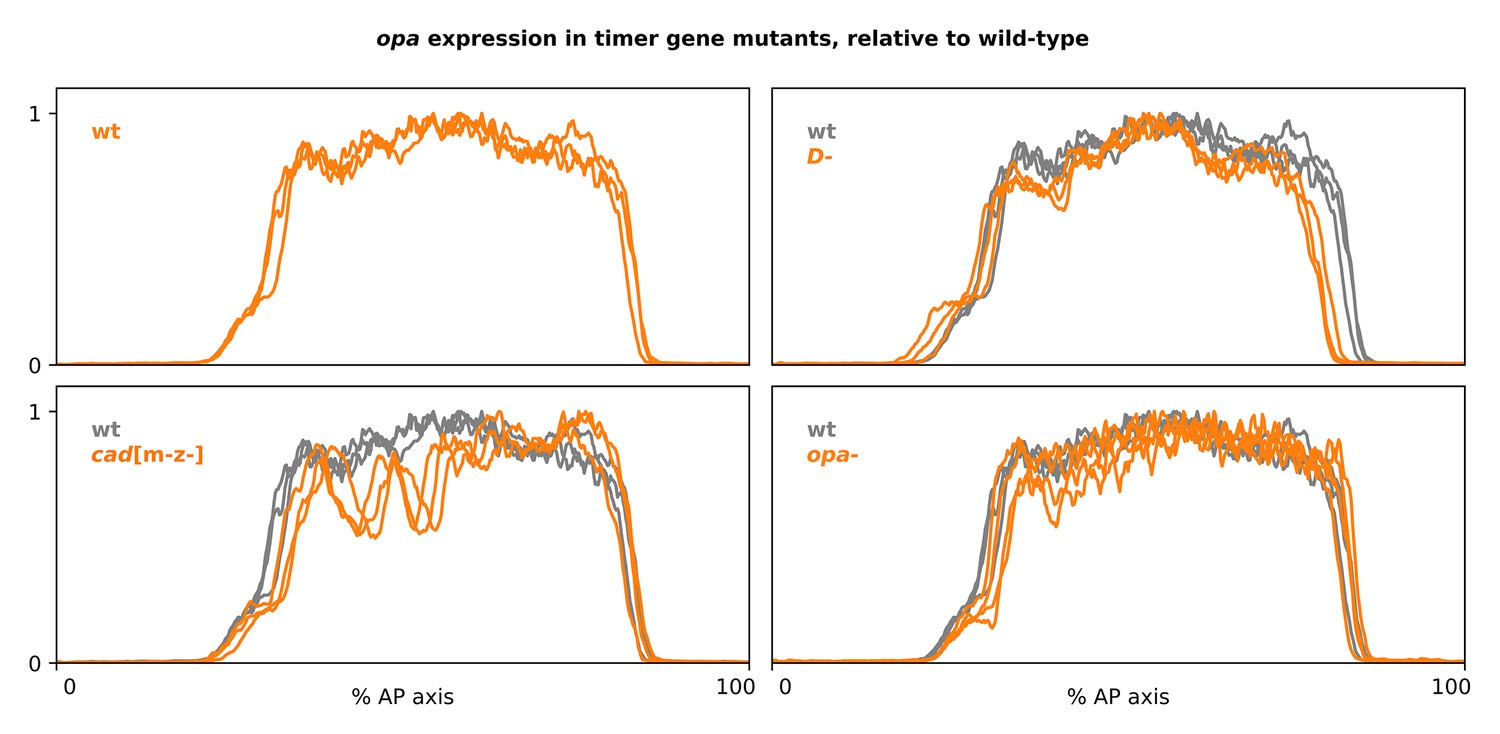
Plots showing quantitative expression traces (0–100% AP axis) from multiple stage 5.5 embryos, individually normalised to the range 0–1. Top-left plot shows opa expression in wild-type embryos (orange lines); other plots show opa expression from cadm-z-, D-, or opa- mutants (orange lines) overlaid on the same wild-type traces shown in the top-left plot (grey lines). Note the marked AP modulation of opa expression in the cadm-z- mutants, and the anteriorly shifted position of the opa posterior border in D- mutants. Source data is the same as Figure 4.
Figure 4—figure supplement 3
Additional characterisation of cadm-z-, cadm-z+, and cadm+z- mutants.
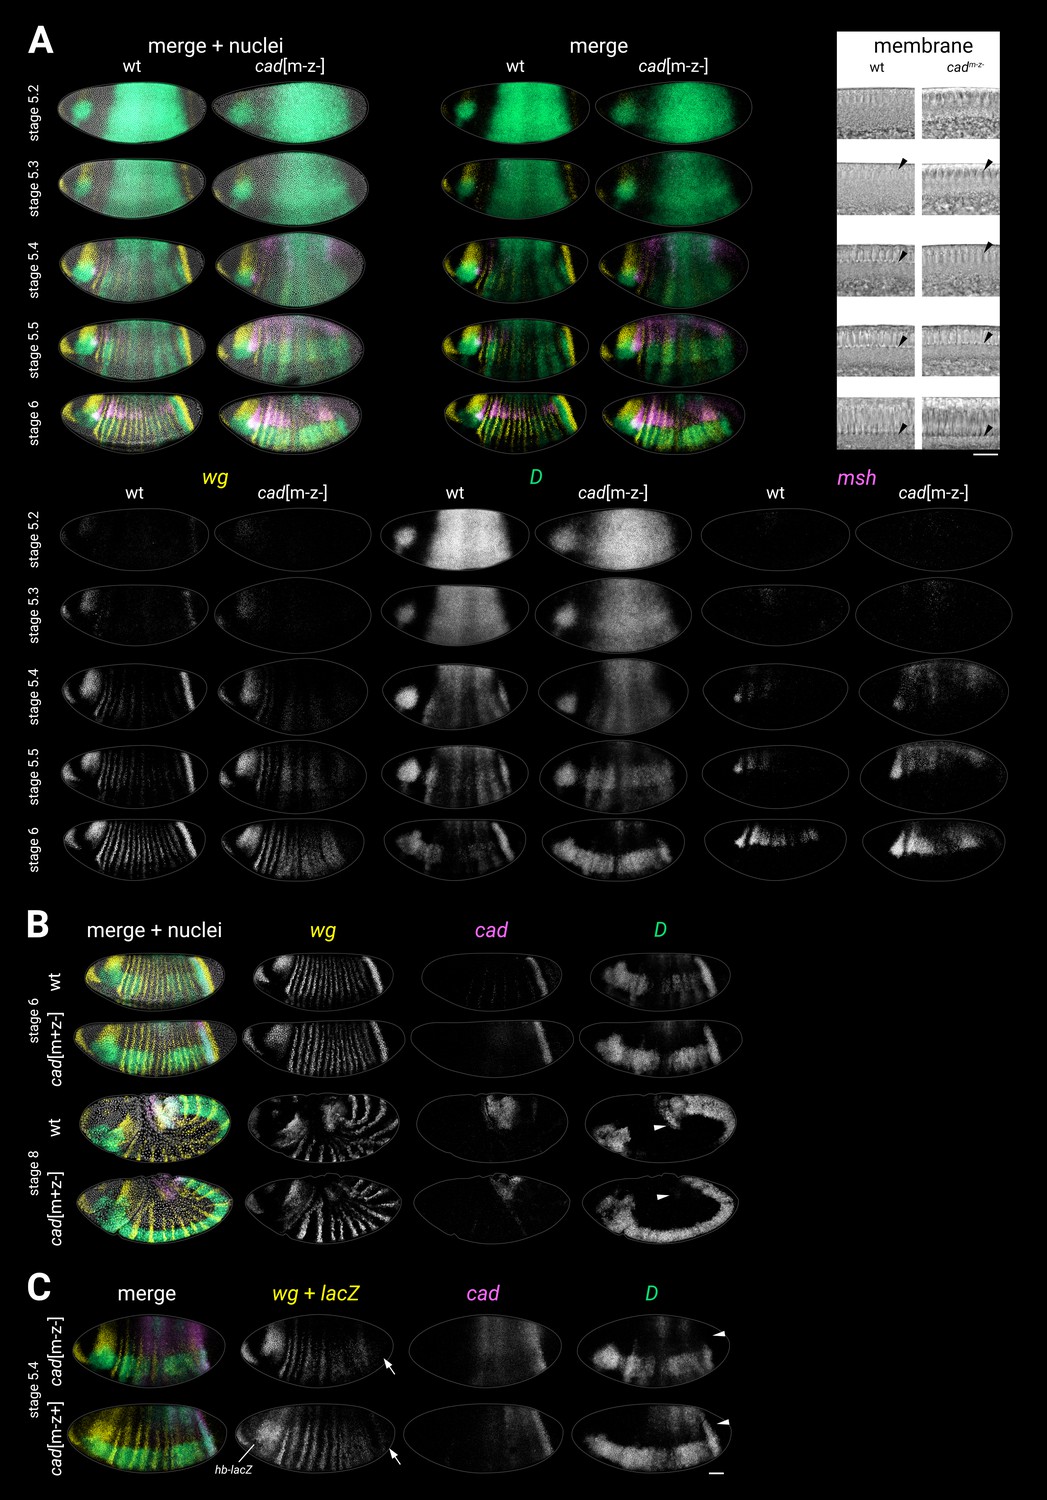
(A) wg, D, and msh expression in wild-type and cadm-z- mutants. Transmitted light images of a sagittal section through the dorsal membrane surface (used for embryo staging) are shown at top right; black arrowheads mark the invagination of the plasma membrane. Note the early/ectopic expression of msh in the cadm-z- mutants, especially in the posterior of the embryo. (B) wg, cad, and D expression in wild-type and cadm+z- (zygotic) mutants. Note the normal D expression in the cadm+z- mutant at stage 6 but the absence of the D tail domain in the cadm+z- mutant at stage 8 (white arrowheads). (C) wg, cad, and D expression in a cadm-z- mutant (top) compared to a paternally rescued cadm-z+ mutant (bottom, note the lacZ expression in the head from the hb-lacZ marked balancer). Note that the D tail domain is rescued in the cadm-z+ mutant (white arrowheads). The posterior wg expression domain is also partially rescued (white arrows), as is the segmental pattern. cad and D expression resembles the cadm-z- mutant. All embryos are anterior left, dorsal up. All embryos except the dorsolateral stage 8 wild-type embryo in (B) are lateral views. Scale bars = 50 μm (whole embryos) or 20 μm (membrane close-ups); grey lines show embryo outlines.
Figure 4—figure supplement 4
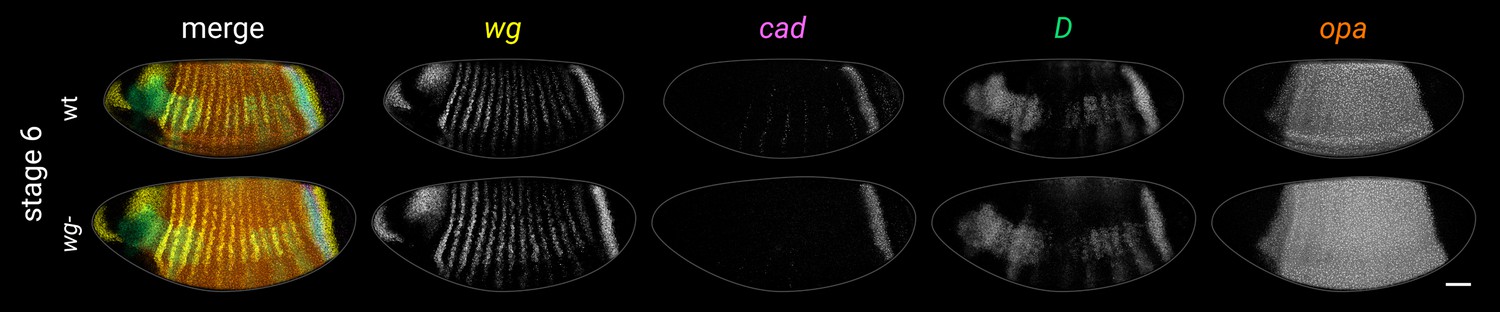
Timer gene expression in wg- mutants at stage 6.
Left column shows a multi-channel merge; other columns show individual channels. (Note that the wg- embryo pictured is slightly younger than the wild-type embryo and so does not show the same pattern of weak pair-rule cad stripes in the trunk. Older wg- embryos express these stripes as normal.) Both embryos are anterior left, dorsal up, lateral view. Scale bar = 50 μm; grey lines show embryo outlines.
Figure 4—figure supplement 5
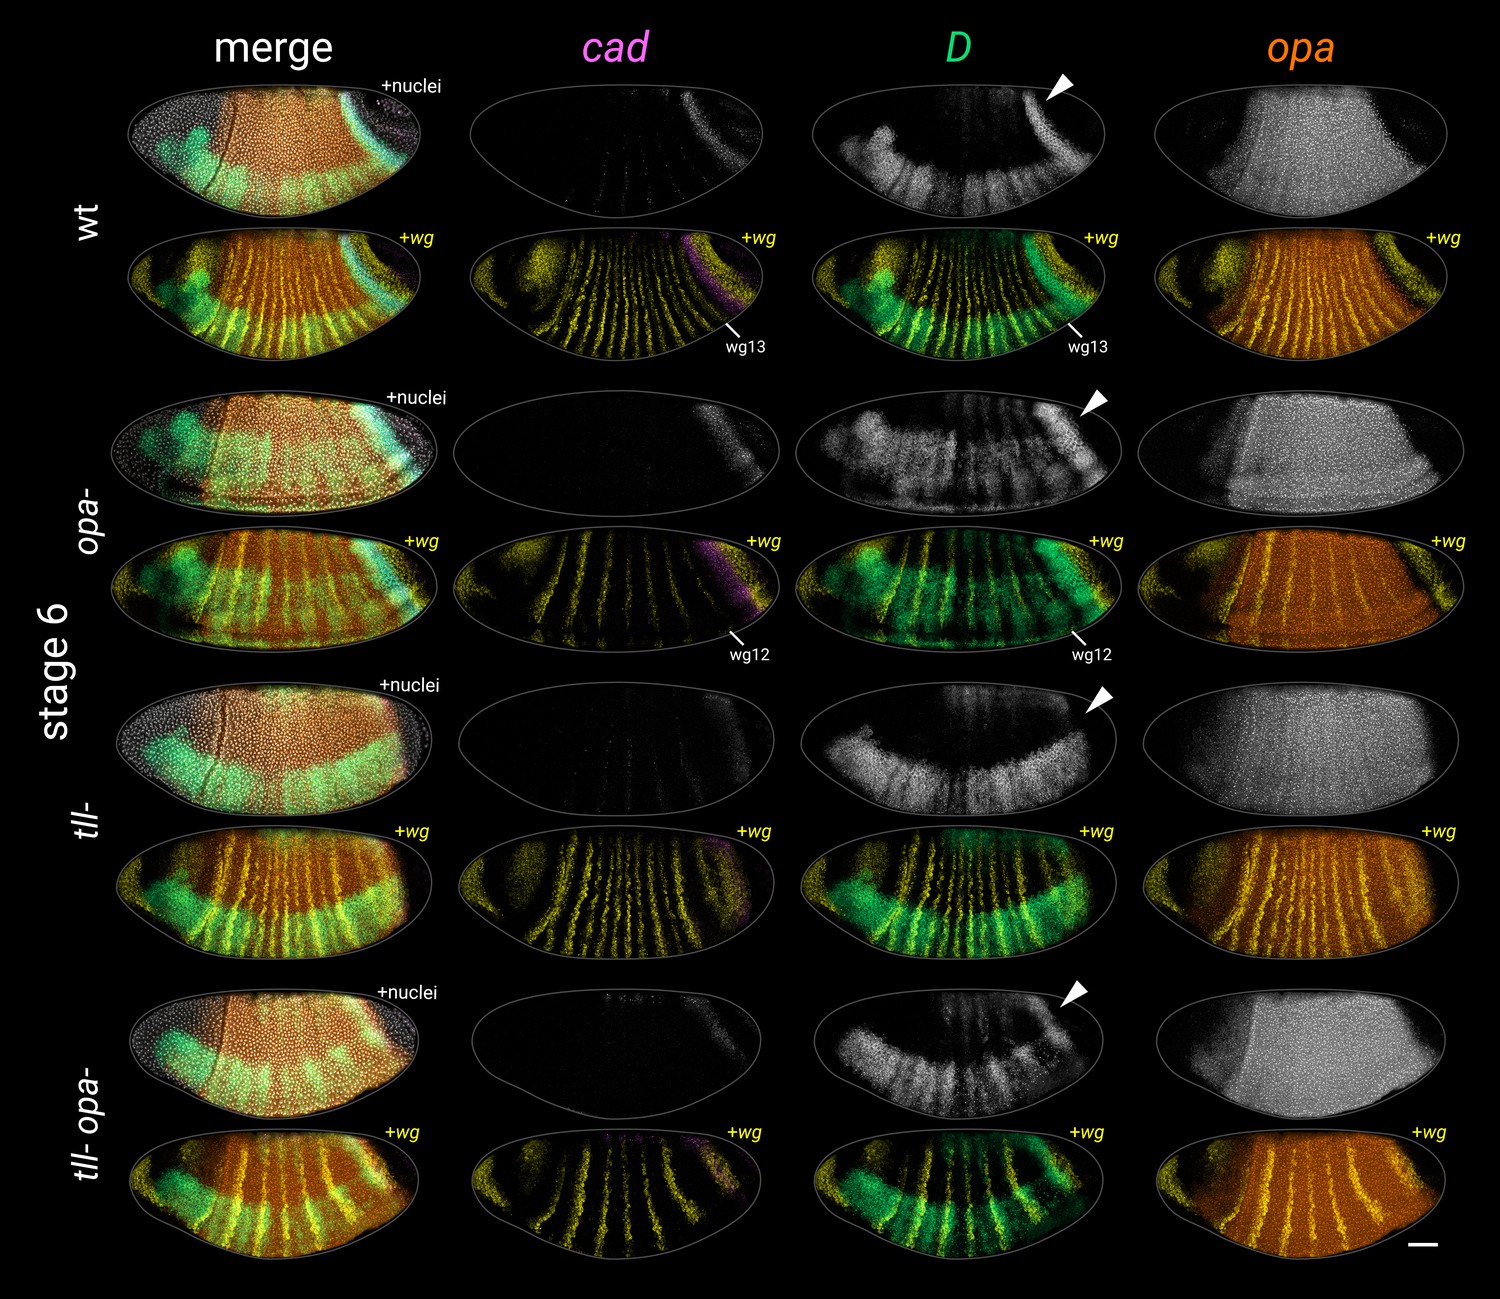
Timer gene expression in opa-, tll-, and tll- opa- embryos at stage 6.
Individual cad, D, and opa channels are shown for each genotype, as well as two-channel merges with wg. Multi-channel merges with and without the DAPI (nuclei) channel are also shown in the left column. White arrowheads point to the D tail domain – note that it is expanded in the opa- mutant, absent in the tll- mutant, and ‘rescued’ (though posteriorly shifted) in the tll- opa- mutant. Note also that the cad tail domain is slightly broader than normal at this stage in the opa- mutant, weak/fading in the tll- mutant, and partially rescued (though again, posteriorly shifted) in the tll- opa- mutant. All embryos are anterior left, dorsal up, lateral or ventrolateral views. Scale bar = 50 μm; grey lines show embryo outlines.
Figure 4—figure supplement 6
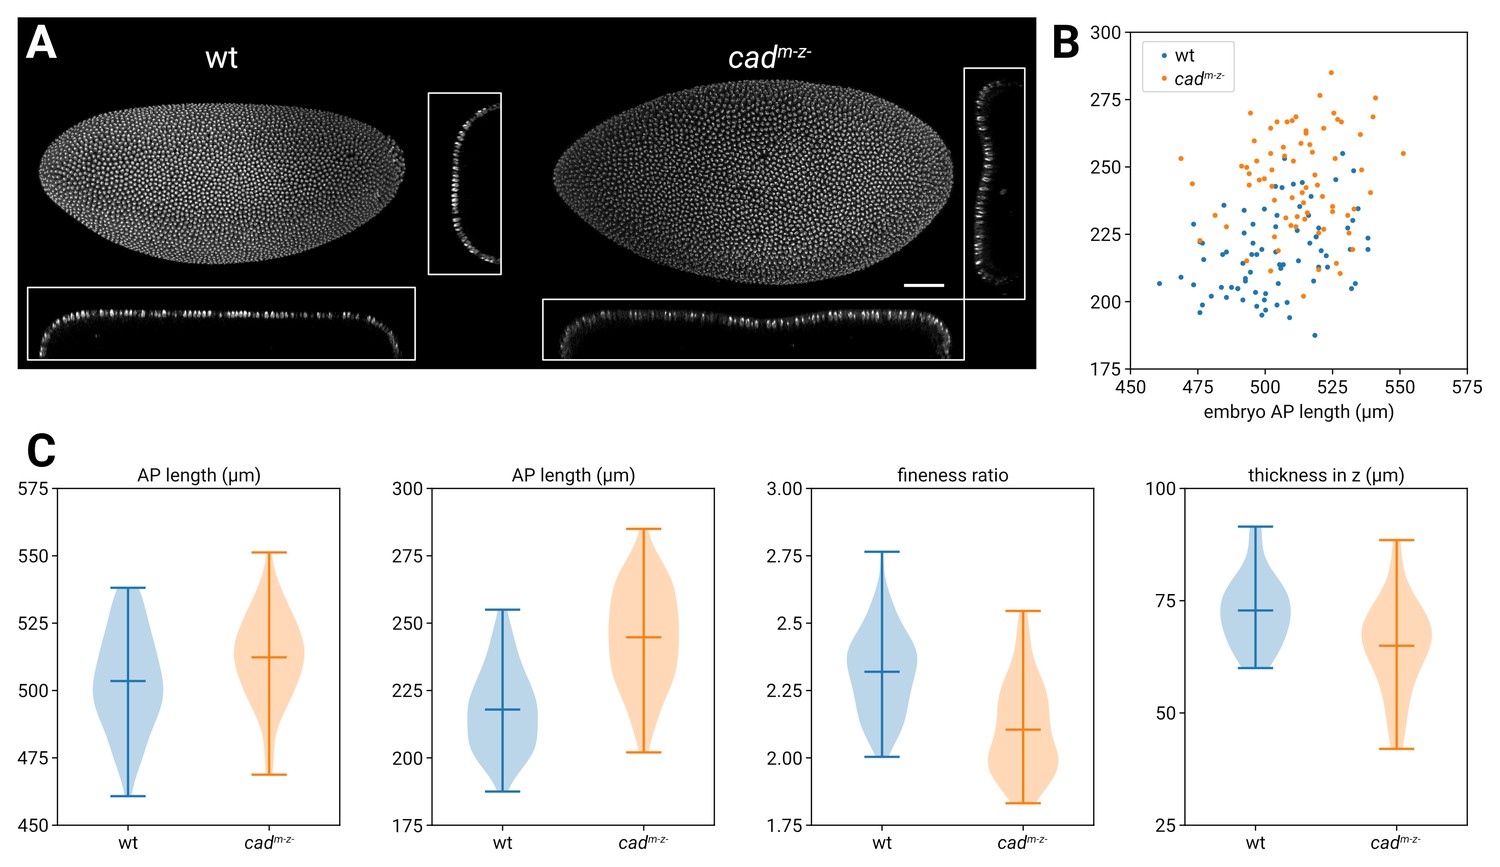
Morphological differences between wild-type and cadm-z- blastoderms.
(A) DAPI (nuclei) staining from a wild-type vs. a cadm-z- embryo. The cadm-z- embryo is bigger and broader in the xy maximum projection, and shows a dimple in the surface in the xy (frontal) and zy (transverse) sections. (B) Scatter plot showing the AP (x-axis) and DV (y-axis) lengths of the embryo masks for n=78 wild-type embryos and n=73 cadm-z- embryos; note that the cadm-z- measurements are on average larger, particularly in DV. (C) Violin plots comparing the AP length, DV length, and fineness ratio (AP length/DV length) for the embryos in (B). The rightmost violin plot compares the thickness in the z-axis (top surface of the embryo to mid-yolk) for a separate set of n=29 wild-type embryos and n=29 cadm-z- embryos. Horizontal lines on the violin plots mark minimum, mean, and maximum values. Measurements were taken from embryos sourced from a variety of different imaging sessions and there should be no systematic differences in mounting technique. The means of all measurements shown in the violin plots are significantly different (two-tailed t-test). AP length: wild-type mean 503.5 μm, cadm-z- mean 512.3 μm; t=−3.12, p=0.002. DV length: wild-type mean 217.9 μm, cadm-z- mean 244.8 μm; t=−9.76, p=1.0x10⁻¹⁷. Fineness ratio: wild-type mean 2.32, cadm-z- mean 2.10; t=8.11, p=1.7x10⁻¹³. Thickness in z: wild-type mean 72.8 μm, cadm-z- mean 65.0 μm; t=3.27, p=0.002. Scale bar = 50 μm.
-
Figure 4—figure supplement 6—source data 1
Measurements of wild-type and cadm-z- blastoderms.
- https://cdn.elifesciences.org/articles/78902/elife-78902-fig4-figsupp6-data1-v2.zip
Figure 5 with 6 supplements
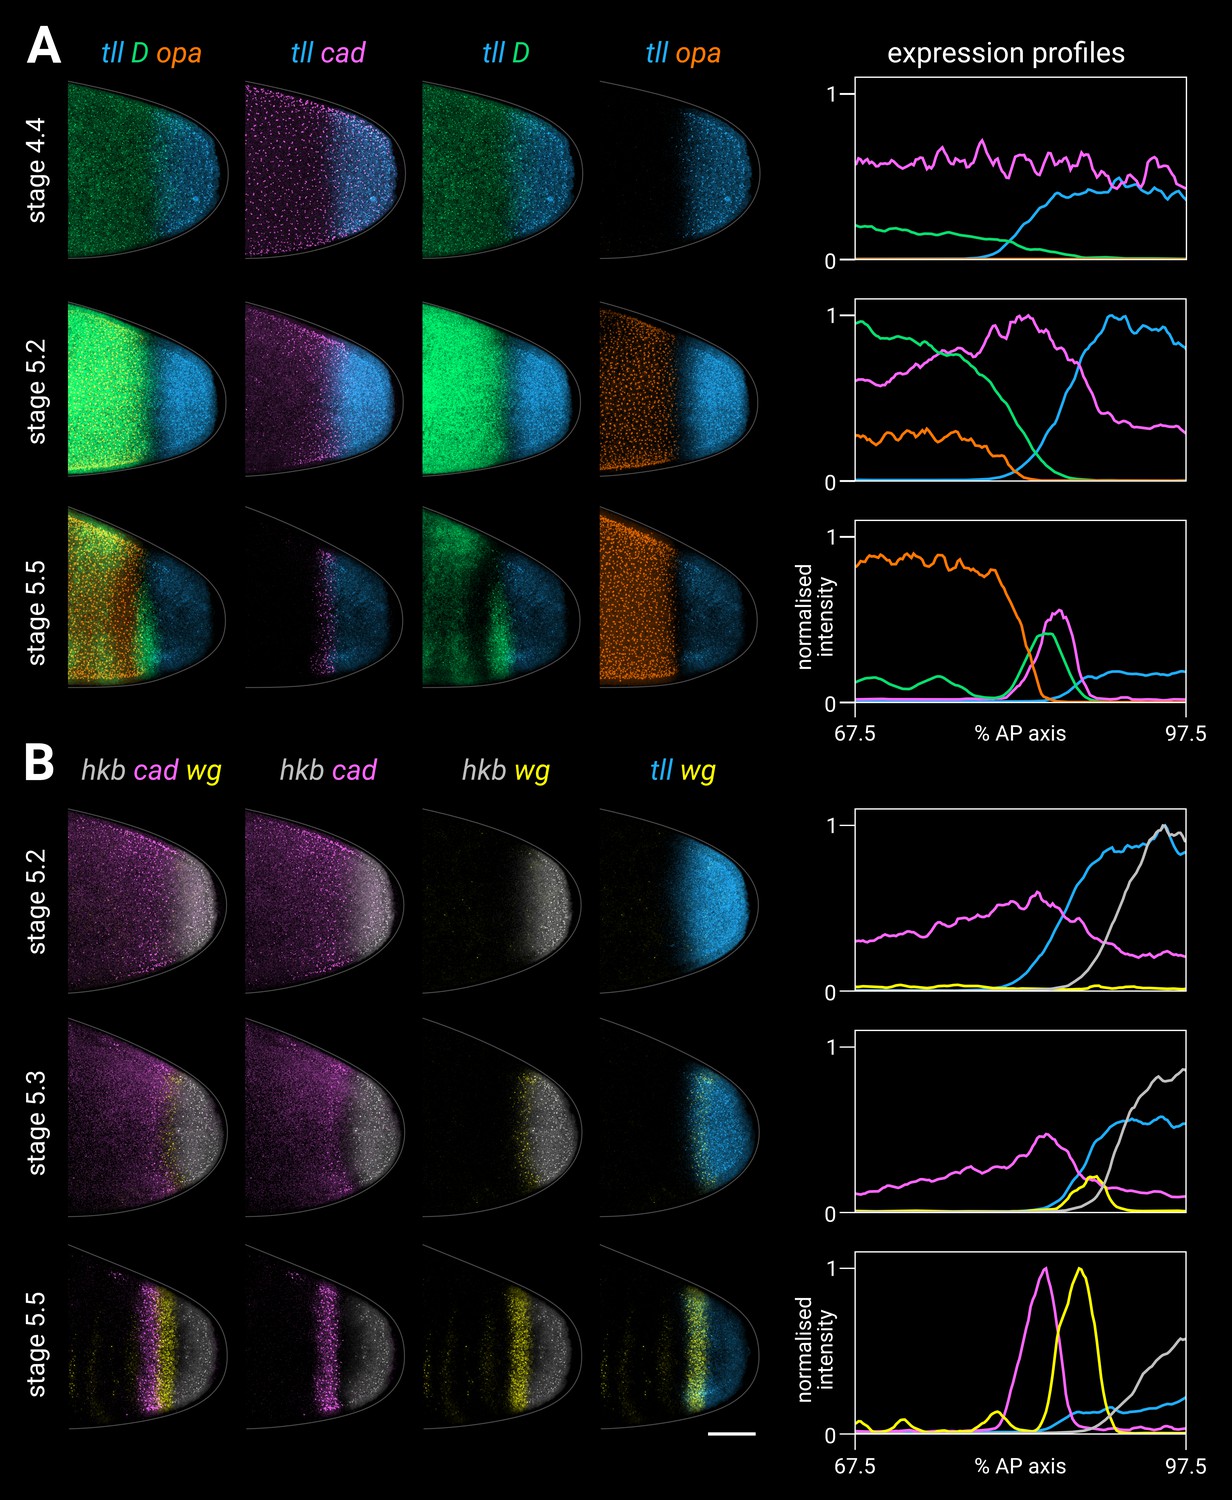
Timer gene expression relative to posterior terminal gene expression in wild-type embryos.
(A, B) Timer and terminal gene expression in embryos of increasing age; only the posterior end of each embryo is shown. Left four columns show either three-channel or two-channel merges; right column shows quantitative expression traces (67.5–97.5% AP axis) of all four genes in the stain. (A) Timer gene expression relative to tll; note the posterior regression and changing intensity of the tll domain and the different spatial relationships with opa, D, and cad. (B) cad and wg expression relative to hkb and tll; note how the posterior wg domain emerges within the tll-positive gap that opens up between cad and hkb. All embryos are anterior left, dorsal up, lateral view. Scale bar = 50 μm; grey lines show embryo outlines.
-
Figure 5—source data 1
Expression trace source data.
- https://cdn.elifesciences.org/articles/78902/elife-78902-fig5-data1-v2.zip
-
Figure 5—source data 2
Measurements of the size of the posterior tll expression domain at stage 5.2 vs. 5.5.
- https://cdn.elifesciences.org/articles/78902/elife-78902-fig5-data2-v2.zip
Figure 5—figure supplement 1
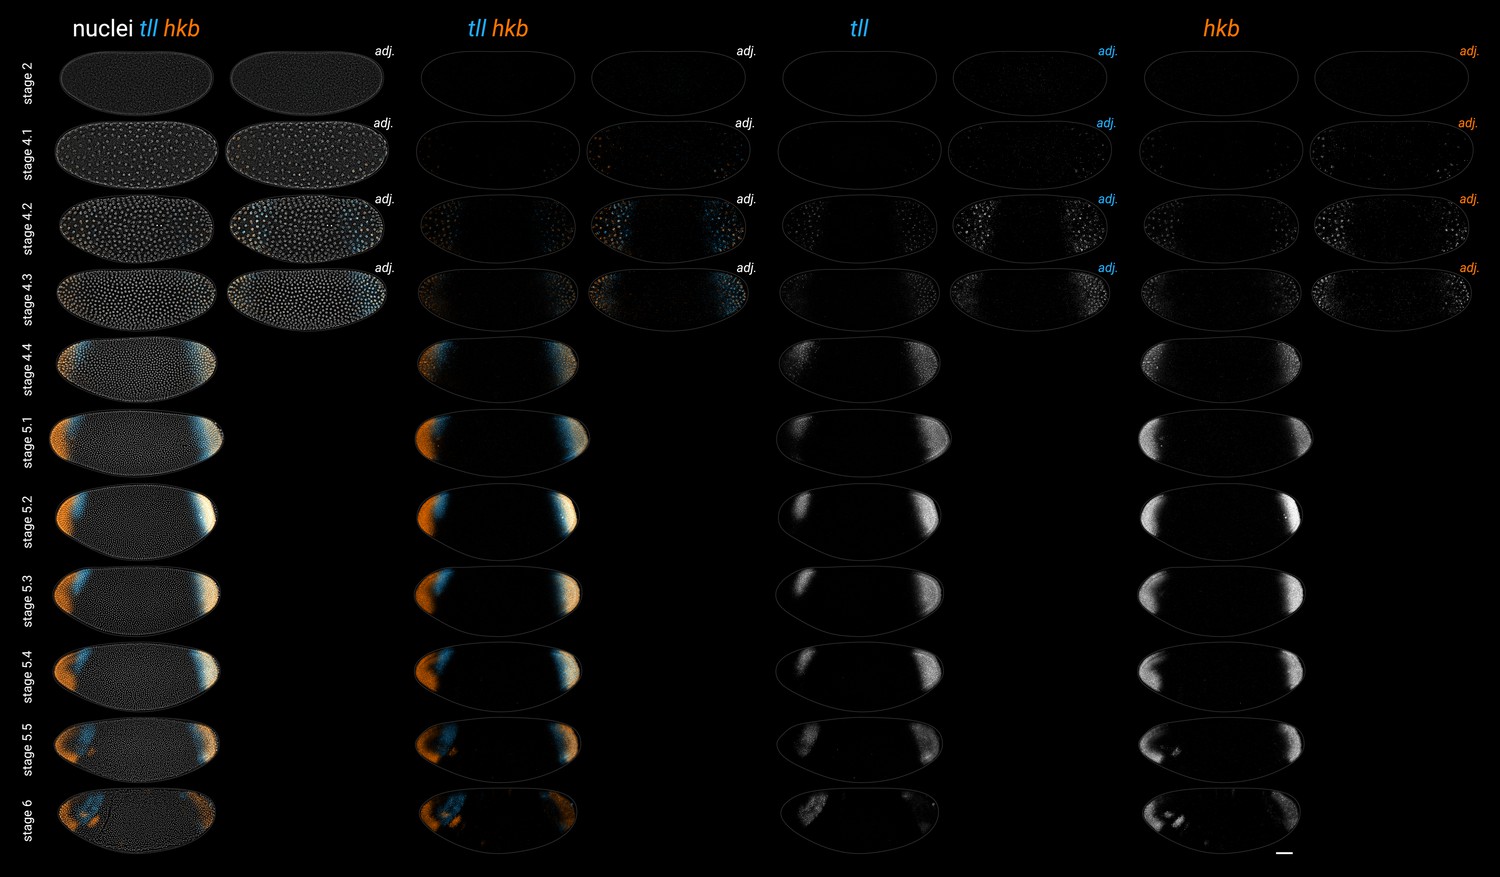
Expression of tll and hkb in wild-type embryos from stage 2 to stage 6.
The adjusted (‘adj.’) images for the stage 2–4.3 embryos have altered brightness and contrast to better show the early expression of tll and hkb. All embryos are anterior left, dorsal up, lateral view. Scale bar = 50 μm; grey lines show embryo outlines.
Figure 5—figure supplement 2
Single-channel images.
Individual channels from the two-channel and three-channel merges shown in Figure 5. All embryos are anterior left, dorsal up, lateral view. Scale bar = 50 μm; grey lines show embryo outlines.
Figure 5—figure supplement 3
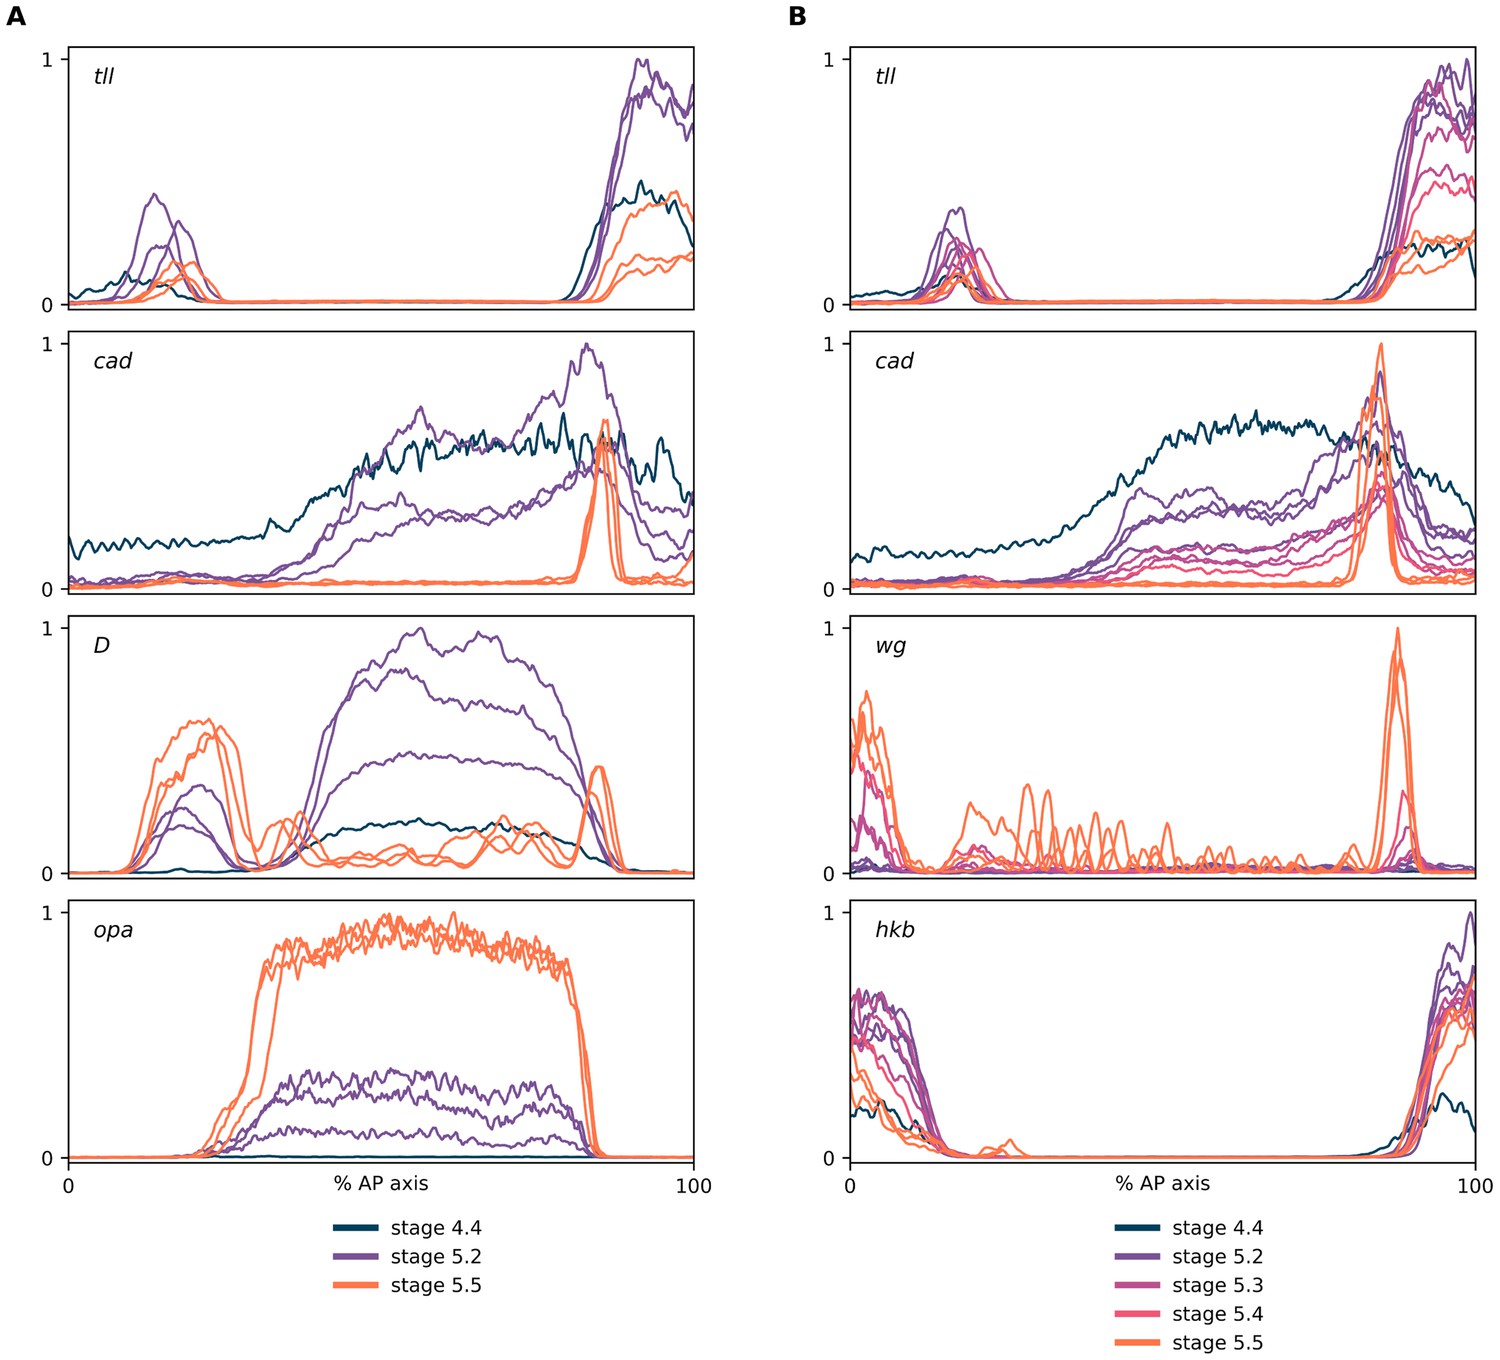
Expression dynamics of tll and hkb transcripts.
(A, B) Quantitative expression traces (0–100% AP axis) from individual embryos of different ages, to convey the spatiotemporal dynamics of gene expression within the early embryo. All traces in a given plot are from embryos from the same tube imaged with the same microscope settings in the same imaging session. The stage corresponding to each line colour is shown in the legends below the plots (colours are consistent between plots). (A) Expression traces from a tll/cad/D/opa HCR (see example source embryos in Figure 5A). Note the posterior retraction of the tll boundary between stages as well as the rise and fall in tll expression levels. (B) Expression traces from a tll/cad/wg/hkb HCR (see example source embryos in Figure 5B). Note the greater posterior retraction of the tll border compared to hkb, and the more pronounced fall in expression levels over stage 5.
-
Figure 5—figure supplement 3—source data 1
Expression trace source data.
- https://cdn.elifesciences.org/articles/78902/elife-78902-fig5-figsupp3-data1-v2.zip
Figure 5—figure supplement 4
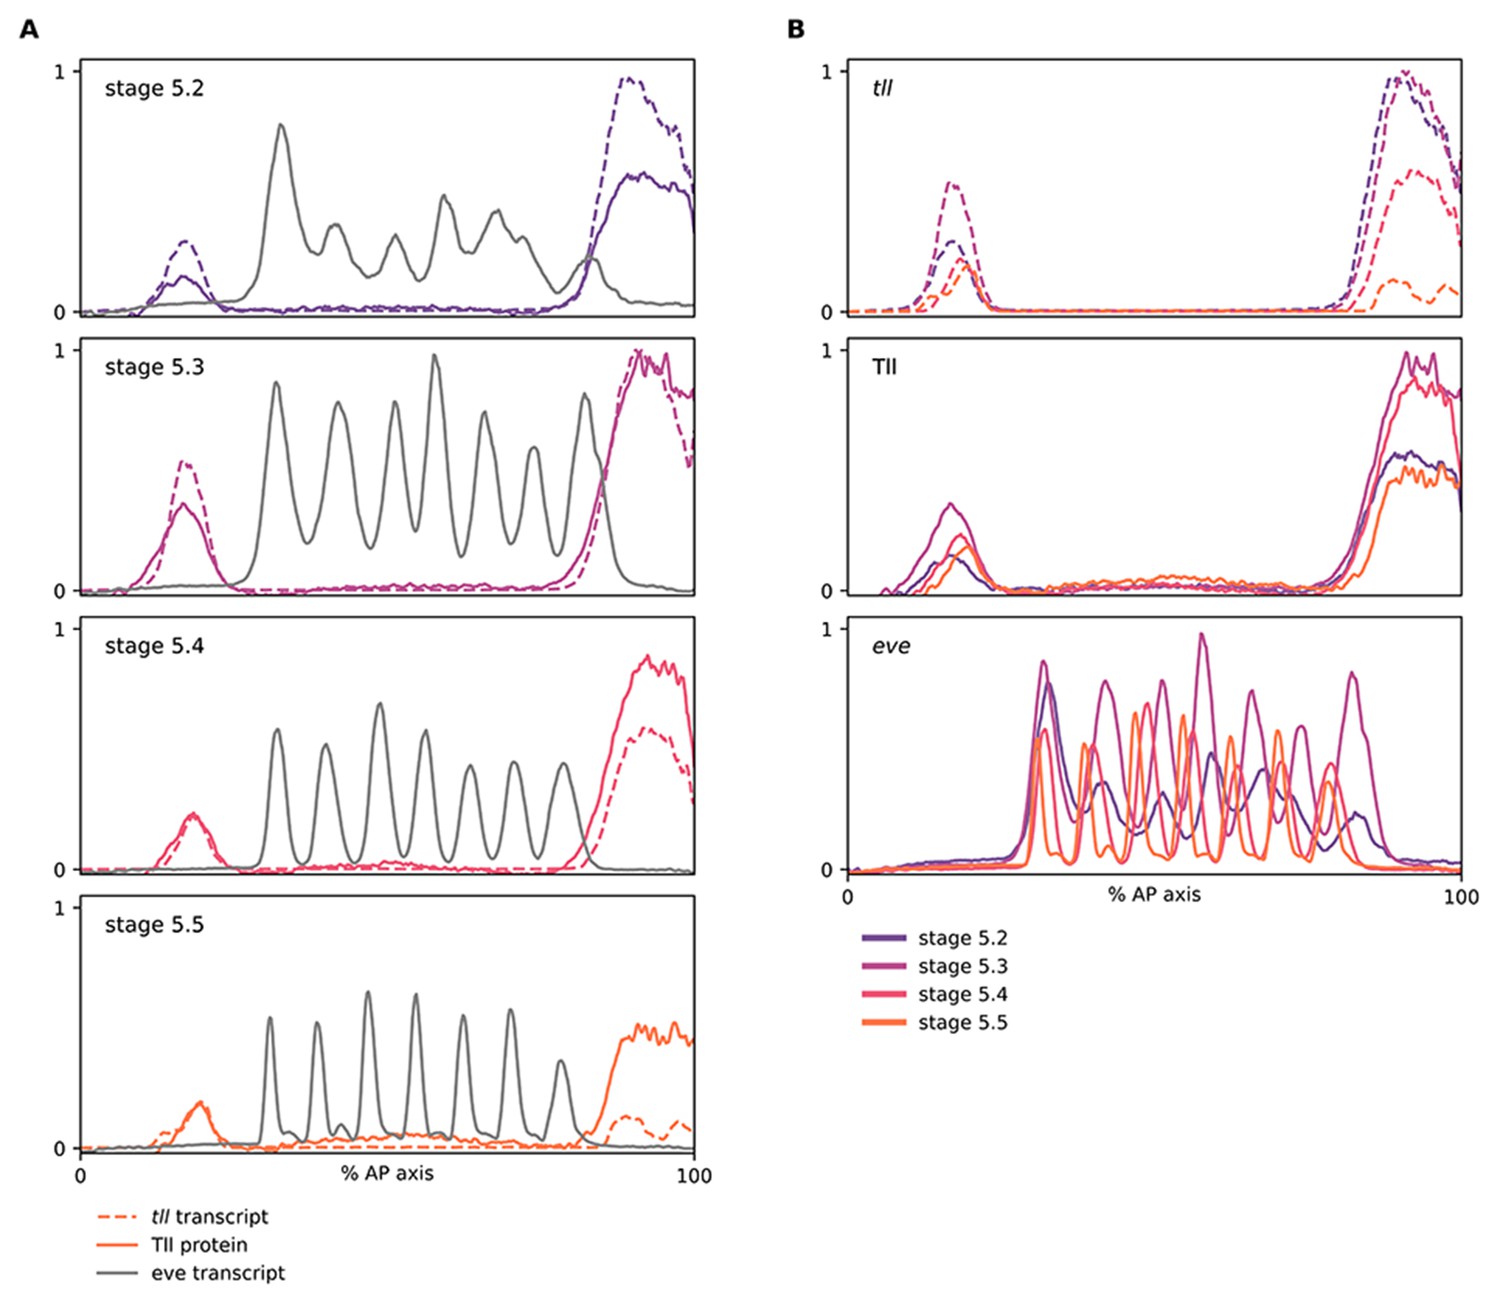
Relative expression dynamics of Tll protein and tll transcript.
(A, B) Quantitative expression traces (0–100% AP axis) from individual embryos of different ages, to convey the relative expression (A) or spatiotemporal dynamics (B) of gene expression within the early embryo (an example source embryo is shown in Figure 5—figure supplement 6A). All traces in a given plot are from embryos from the same tube imaged in the same imaging session with the same microscope settings. Legends for gene products (A) or embryo stages (B) are shown below the plots. (A) tll/Tll/eve traces from individual embryos of different ages; note the time lag for Tll protein levels compared to tll transcript, as well as the relative positions of their posterior domain borders at stages 5.4 and 5.5. (B) the same data as in (A), except that plots are grouped by gene product rather than by embryo. Note the different temporal dynamics of Tll protein compared to tll transcript, and the posterior retraction of both posterior domain borders. The eve channel was used for embryo staging; note that the stripes in older embryos are more refined and have shifted anteriorly across the blastoderm.
-
Figure 5—figure supplement 4—source data 1
Expression trace source data.
- https://cdn.elifesciences.org/articles/78902/elife-78902-fig5-figsupp4-data1-v2.zip
Figure 5—figure supplement 5
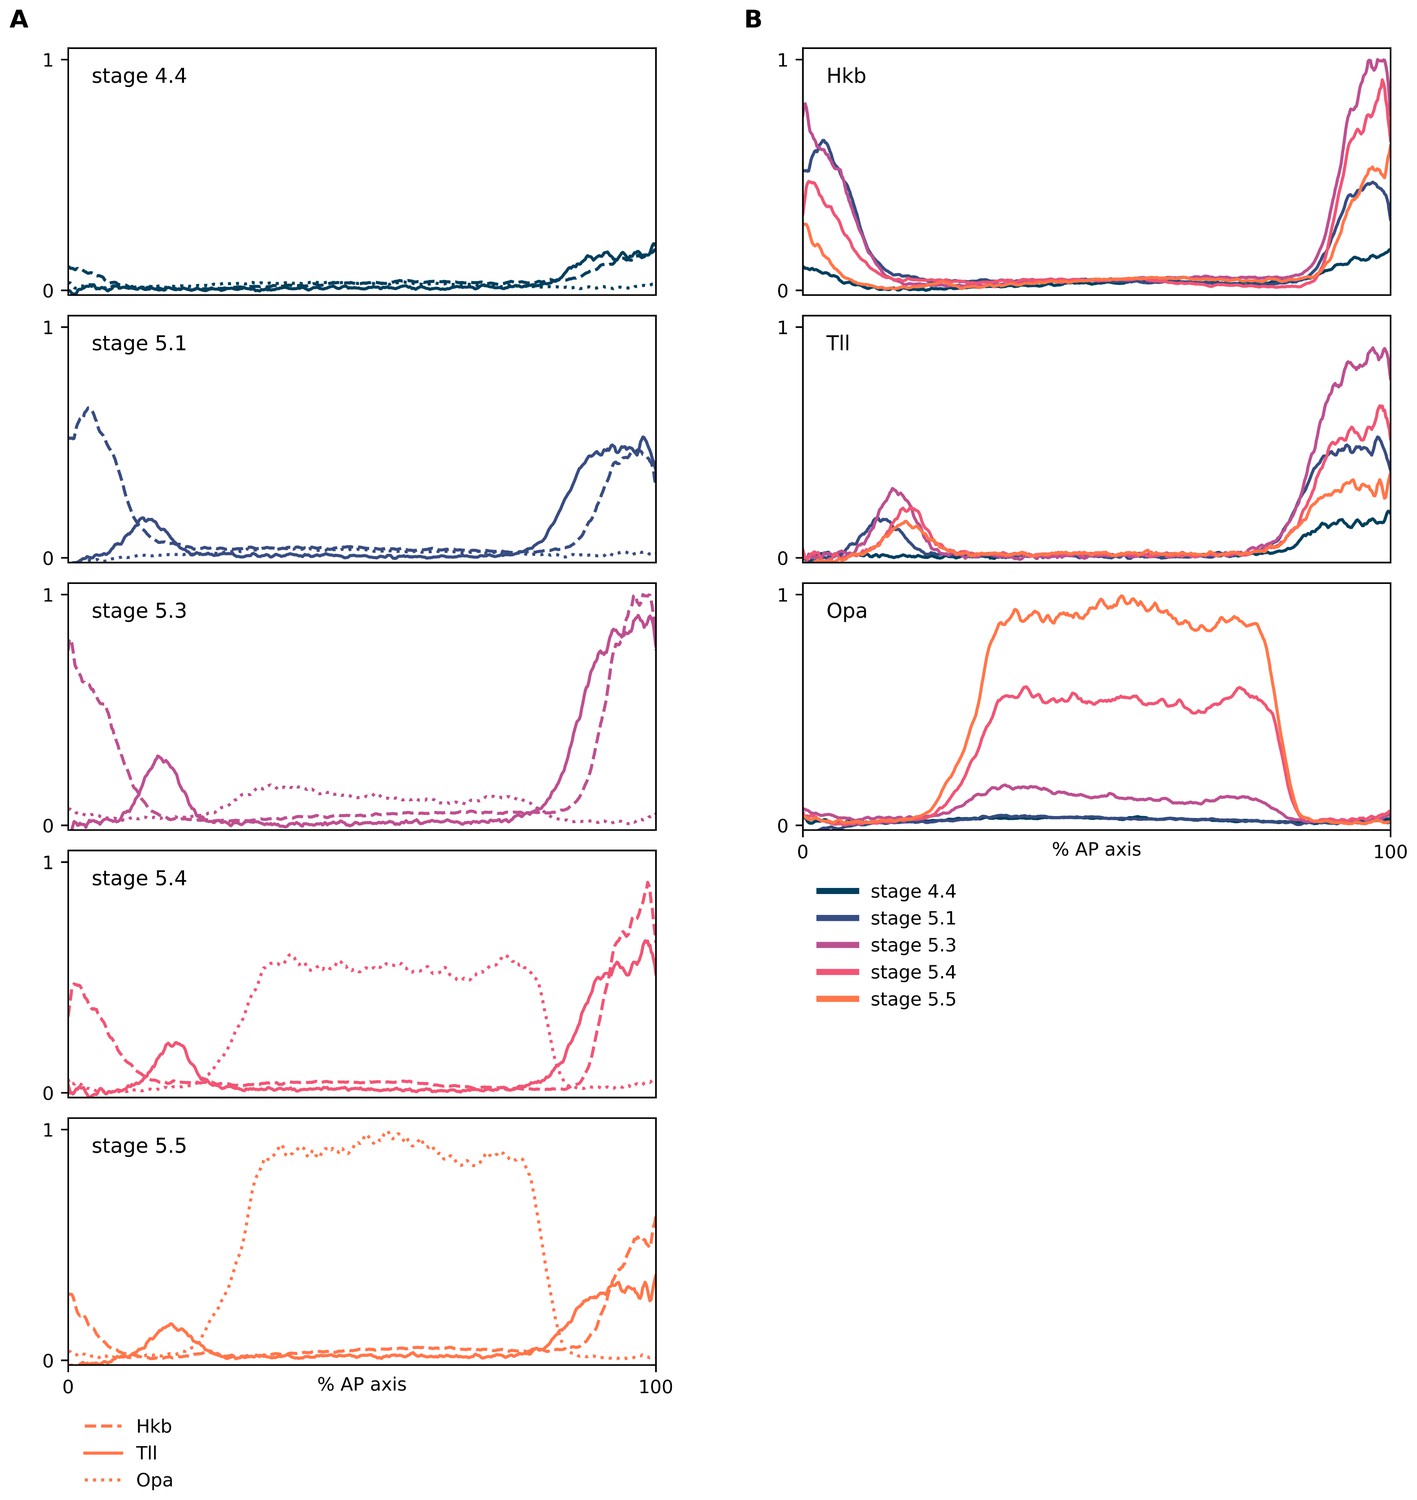
Relative expression dynamics of Hkb, Tll, and Opa proteins.
(A, B) Quantitative expression traces (0–100% AP axis) from individual embryos of different ages, to convey the relative expression (A) or spatiotemporal dynamics (B) of Hkb, Tll, and Opa protein expression within the early embryo (an example source embryo is shown in Figure 5—figure supplement 6B). All traces in a given plot are from embryos from the same tube imaged in the same imaging session with the same microscope settings. Legends for gene products (A) or embryo stages (B) are shown below the plots. (A) Hkb/Tll/Opa expression from individual embryos of different ages; note the nested domain of Tll and Hkb and the correlation between the Tll and Opa borders. (B) The same data as in (A), except that plots are grouped by protein rather than by embryo. In all plots, the Opa channel has been linearly unmixed from the Hkb channel to remove bleedthrough signal from Hkb in the poles of the embryo.
-
Figure 5—figure supplement 5—source data 1
Expression trace source data.
- https://cdn.elifesciences.org/articles/78902/elife-78902-fig5-figsupp5-data1-v2.zip
Figure 5—figure supplement 6
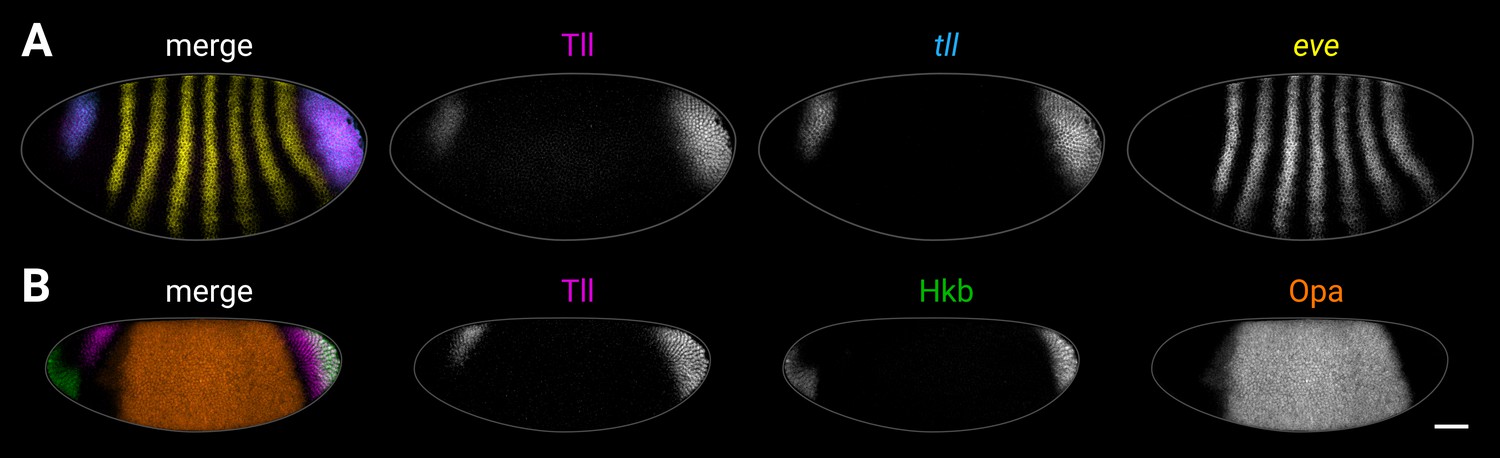
Examples of source imaging data for supplementary plots.
(A, B) Examples of individual embryos from the imaging datasets used to extract the expression traces shown in Figure 5—figure supplement 4 (A) and Figure 5—figure supplement 5 (B). (A) Tll antibody/tll HCR/eve HCR. (B) Tll/Hkb/Opa antibody stain. Both embryos are anterior left, dorsal up, lateral view. Scale bar = 50 μm; grey lines show embryo outlines.
Figure 6 with 2 supplements

Timer gene expression in terminal system mutants.
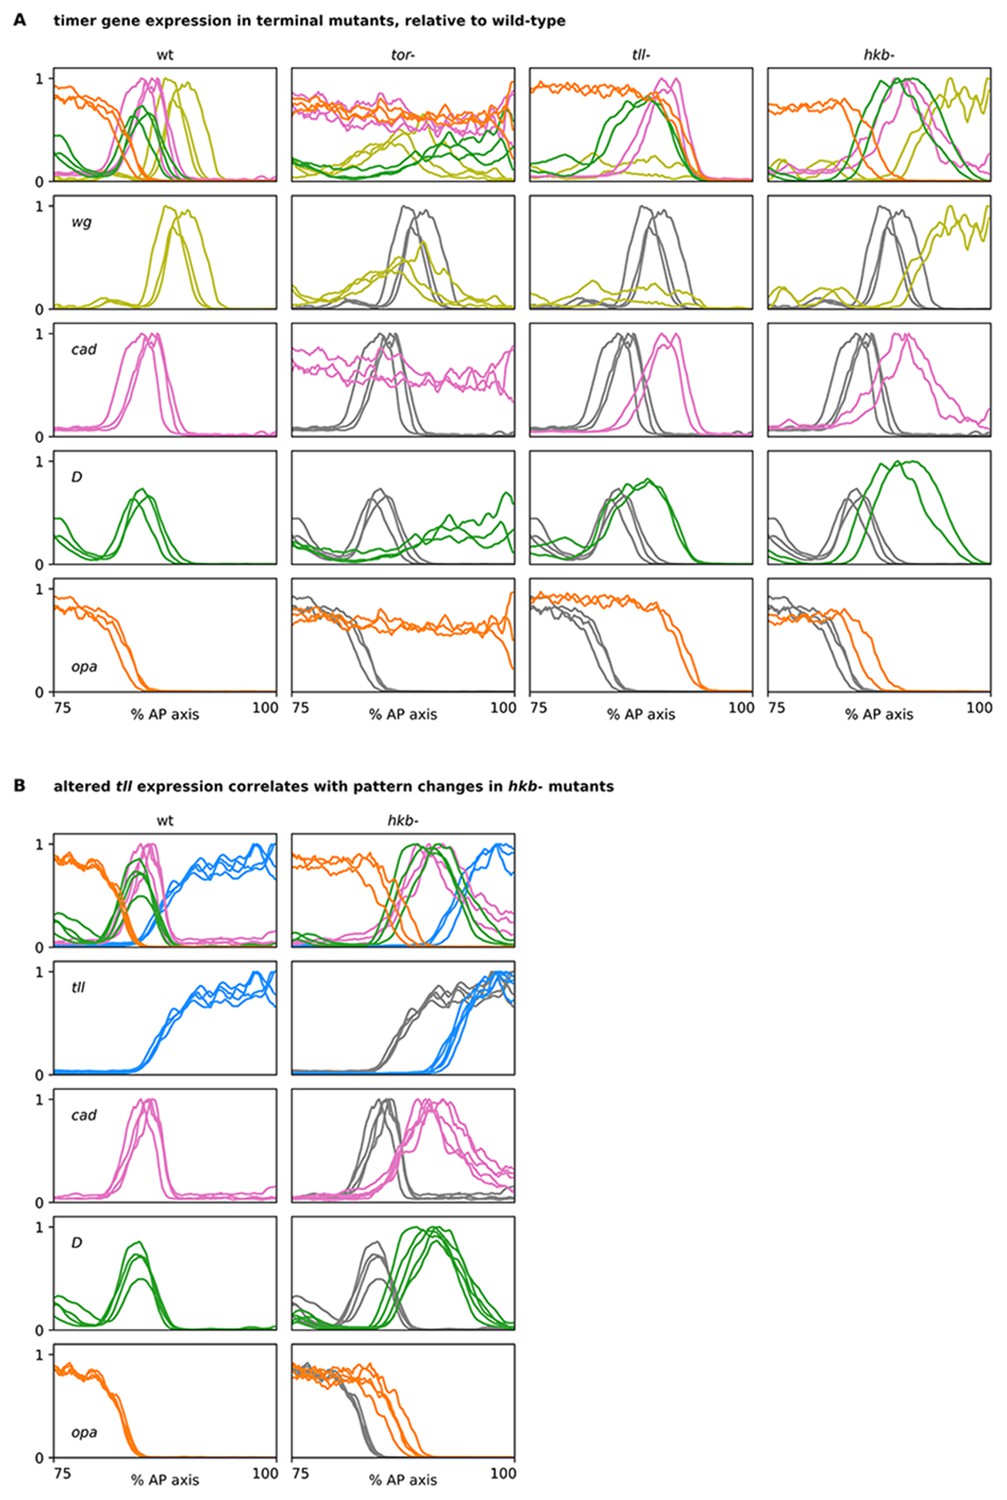
(A–F) Gene expression in wild-type and mutant embryos of increasing ages. The leftmost column shows a four-channel merge; the middle columns show individual channels; the rightmost column shows quantitative expression traces (75–100% AP axis) from the embryos shown to the left. (A) Timer gene expression in wild-type. The AP axis is truncated in the expression plot for the stage 6 embryo (diagonally shaded area) due to proctodaeal invagination. (B) Timer gene expression in tor- mutants. Note how the timer gene expression expands all the way to the posterior pole (excluding the pole cells). The broad posterior wg domain seen at stage 5.4–5.5 is mispatterned segmental expression; the posterior wg domain seen in wild-type embryos is absent. (C) Timer gene expression in tll- mutants, relative to wg expression. Note that the cad, D, and opa domains share a similar posterior border, the cad domain fades over time, and the wg posterior domain is absent. (Some mispatterned segmental wg expression is seen near the posterior of the embryo, similar to tor- mutants.) (D) Timer gene expression in tll- mutants, relative to hkb expression. Note that the posterior borders of cad, D, and opa all abut the hkb expression domain. (E) Timer gene expression in hkb- mutants, relative to wg expression. Note that cad is not repressed from the posterior pole until stage 5.5, and the posterior wg domain extends to the posterior pole. (F) Timer gene expression in hkb- mutants, relative to tll expression. Note that the tll domain is small, and it preserves normal relationships with the cad, D, and opa domains. (G, H) Single-channel quantitative expression traces (75–100% AP axis) from multiple wild-type and mutant stage 5.5 embryos. Note the absence of spatial patterning in tor- mutants and the posteriorly shifted expression boundaries in tll- and hkb- mutants. In (A–F) all embryos are anterior left, dorsal up, lateral view; scale bar = 50 μm; grey lines show embryo outlines. In (G,H) all traces are individually normalised; mutant traces are overlaid on wild-type traces (grey) for ease of comparison.
-
Figure 6—source data 1
Expression trace source data.
- https://cdn.elifesciences.org/articles/78902/elife-78902-fig6-data1-v2.zip
Figure 6—figure supplement 1
Timer gene expression traces from terminal system mutants, relative to wild-type.
(A, B) Plots showing quantitative expression traces (75–100% AP axis) from multiple stage 5.5 embryos, individually normalised to the range 0–1. Leftmost column shows traces from wild-type embryos (coloured lines); remaining columns show traces from tor-, tll-, or hkb- mutants (coloured lines) overlaid on the same wild-type traces shown in the leftmost column (grey lines). (A) In tor- mutants, note the loss of spatial patterning. In tll- mutants, note the posterior shifts of the cad, D, and opa posterior boundaries and the loss of the posterior wg domain. In hkb- mutants, note the posterior shifts of all boundaries and the extension of the posterior wg domain to the posterior pole. (B) Note the posterior shift of the tll boundary in hkb- mutants, in addition to the posterior shifts of the cad, D, and opa boundaries also seen in for the hkb- mutants in (A). Source data is the same as Figure 6.
Figure 6—figure supplement 2
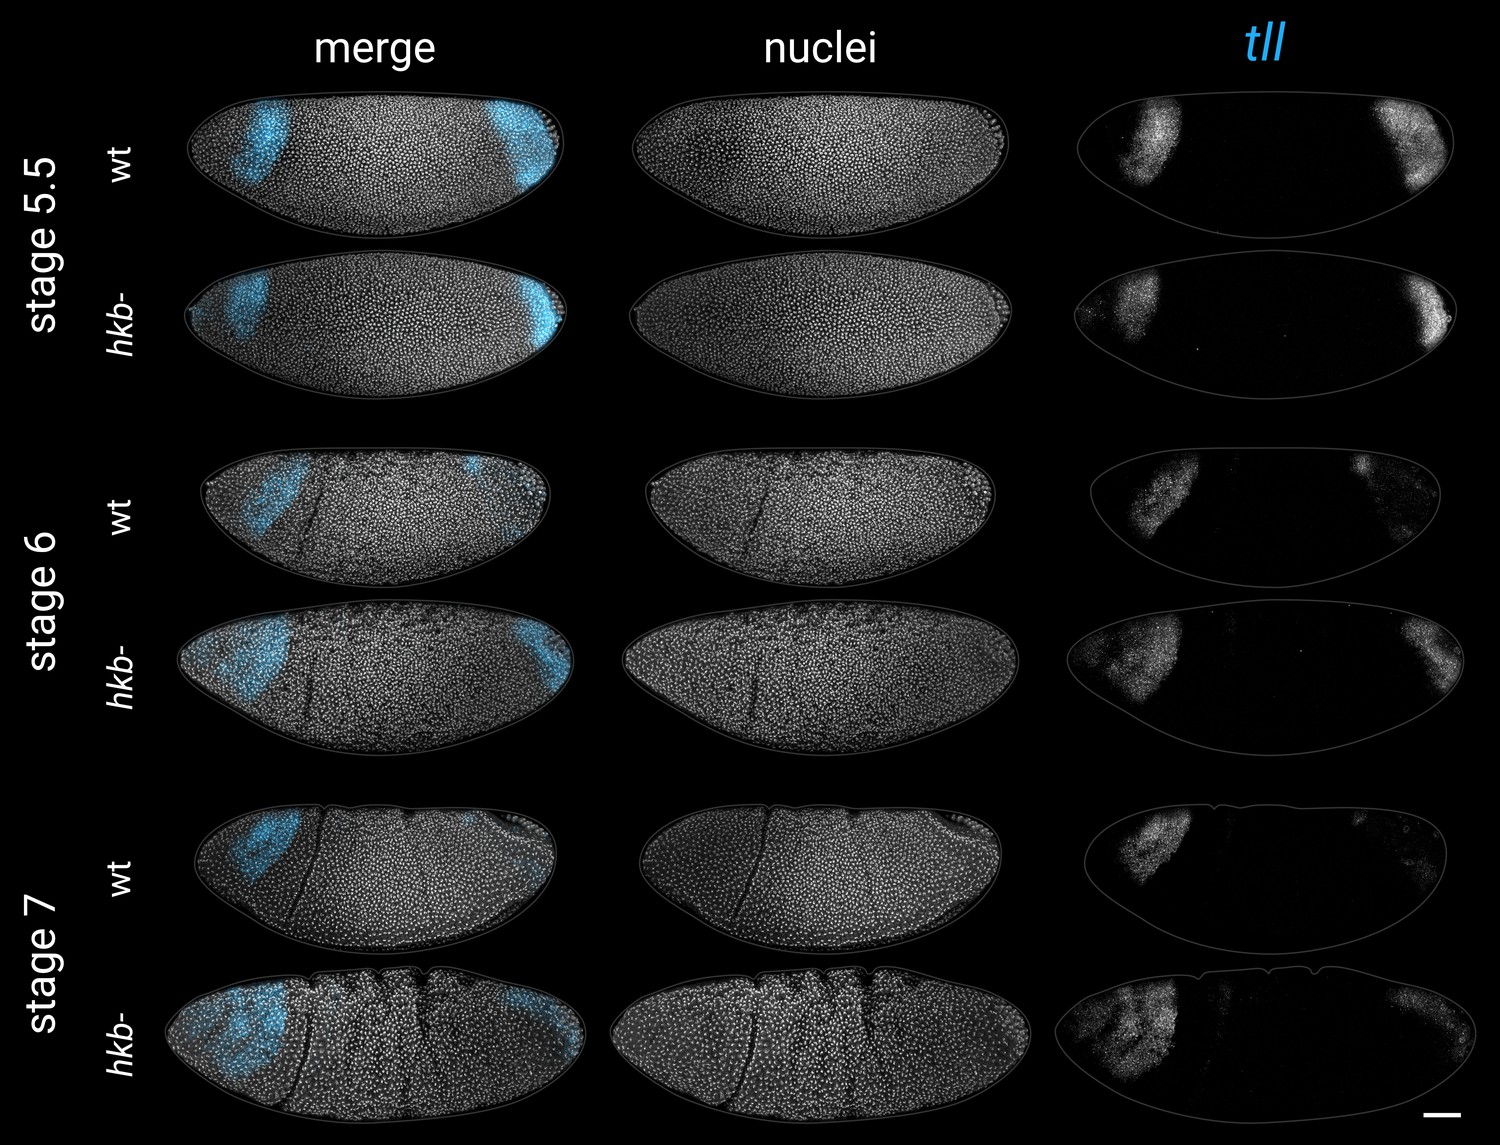
Expression of tll in wild-type and hkb- embryos from stage 5.5 to stage 7.
Note that the posterior domain persists for longer in the hkb- mutants, and ectopic expression appears at the anterior pole. All embryos are anterior left, dorsal up, lateral views. Scale bar = 50 μm; grey lines show embryo outlines.
Figure 7 with 4 supplements
Spatial regulation of fkh, and timer gene expression in fkh- mutants.
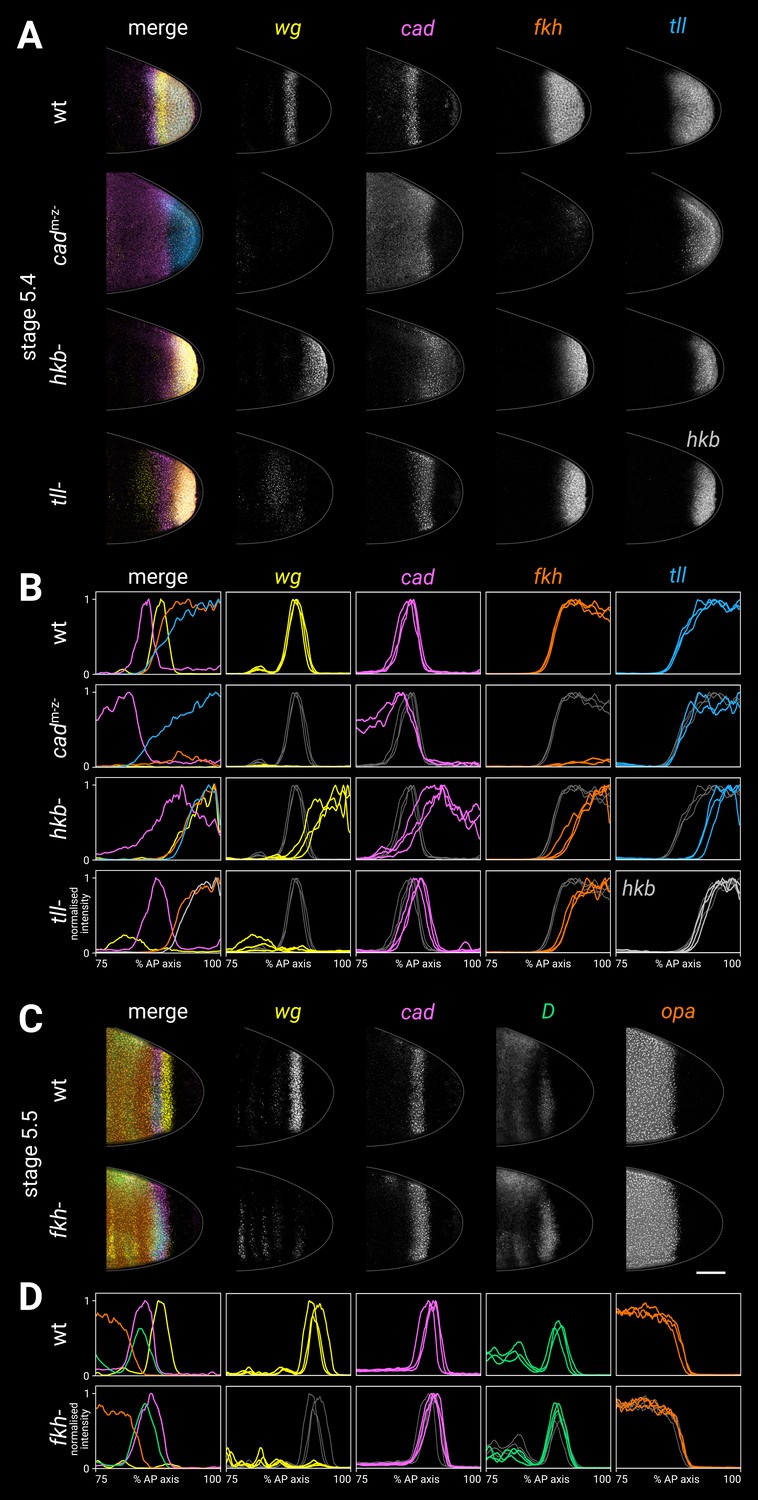
(A, B) Terminal gene expression (wg, cad, fkh, and tll/hkb) in wild-type and mutant embryos. In cadm-z-, note the loss of wg and fkh expression. In hkb-, note the posterior fate map shift and the delayed repression of posterior cad. In tll-, note the loss of the posterior wg domain, the posteriorly shifted cad domain, and the reduced size of the fkh domain. (C, D) Timer gene expression in wild-type and fkh- mutant embryos. Note the extremely reduced posterior wg domain in fkh-. (A, C) Individual stage 5.4 (A) or stage 5.5 (C) embryos; the leftmost column shows a four-channel merge, other columns show individual channels. All embryos are anterior left, dorsal up, lateral view. Scale bar = 50 μm; grey lines show embryo outlines. (B, D) Quantitative expression traces (75–100% AP axis); the leftmost column shows multi-channel traces from the individual embryos in (A, C), other columns show single-channel traces from multiple stage 5.4–5 embryos (B) or stage 5.5 embryos (D). All traces are individually normalised; mutant traces are overlaid on wild-type traces (grey) for ease of comparison.
-
Figure 7—source data 1
Expression trace source data.
- https://cdn.elifesciences.org/articles/78902/elife-78902-fig7-data1-v2.zip
Figure 7—figure supplement 1
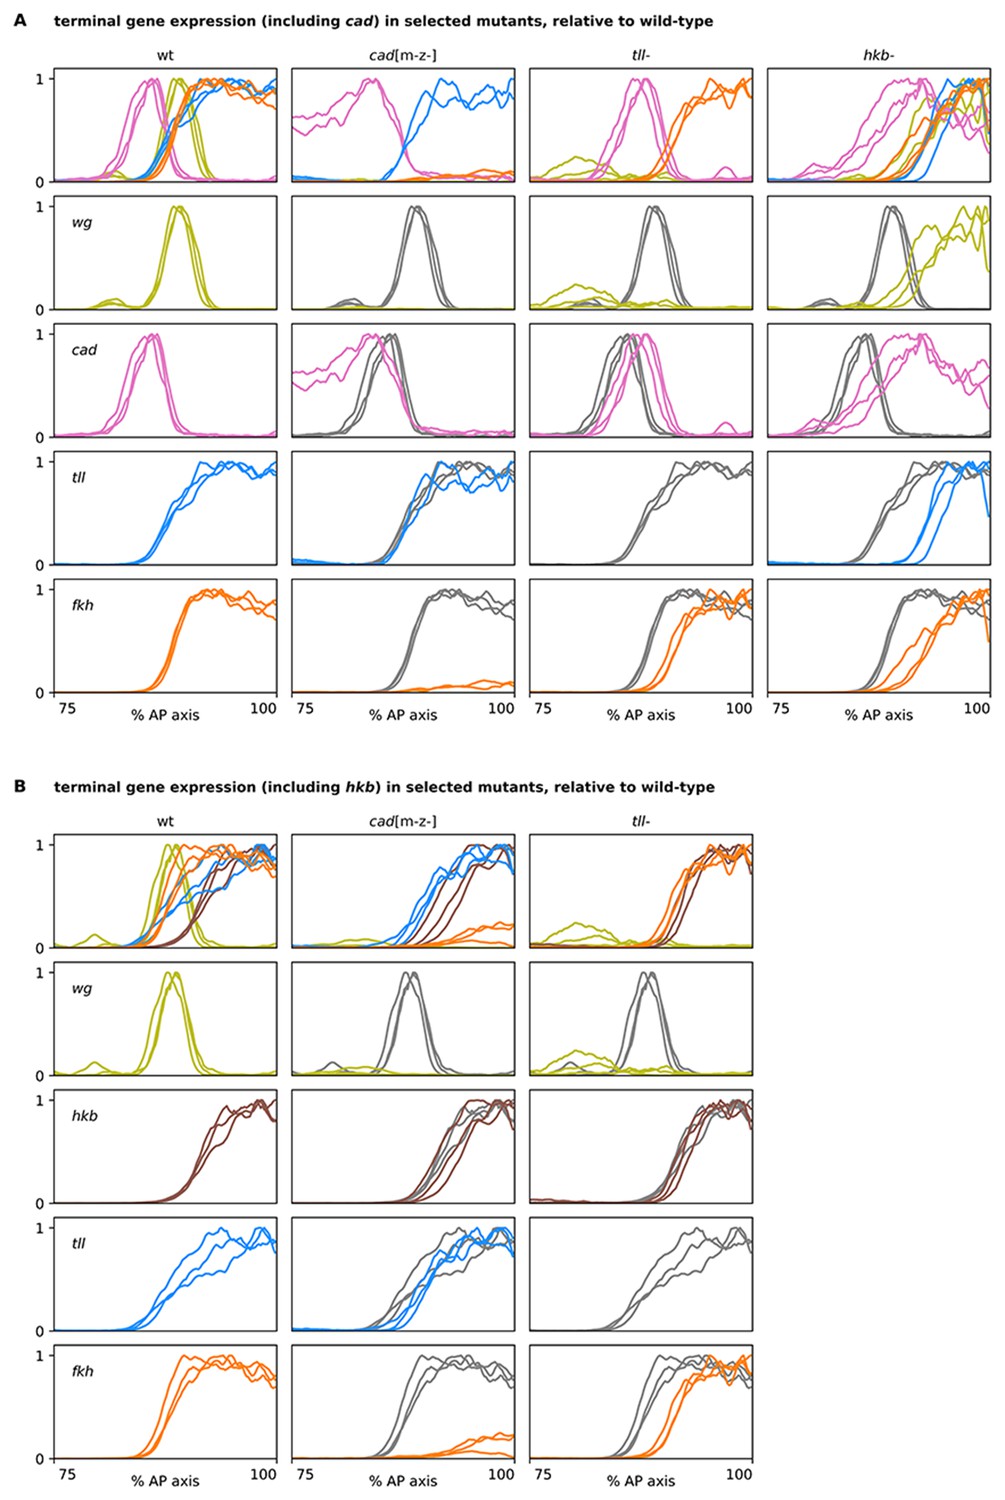
Terminal gene expression traces from cadm-z-, tll-, and hkb- mutants, relative to wild-type.
(A, B) Plots showing quantitative expression traces (75–100% AP axis) from multiple stage 5.4 and stage 5.5 embryos, individually normalised to the range 0–1. Leftmost column shows traces from wild-type embryos (coloured lines); remaining columns show traces from cadm-z-, tll-, or hkb- mutants (coloured lines) overlaid on the same wild-type traces shown in the leftmost column (grey lines). (A) In cadm-z- mutants, note the severe reduction in fkh levels, the loss of the posterior wg domain, and the persistence of cad expression in the trunk. In tll- mutants, note the reduced size of the fkh domain and the posterior shift of the cad domain. In hkb- mutants, note the reduced sizes of the tll and fkh domains, the posterior shifts of the wg and cad domains, and the total (wg) or partial (cad) derepression of expression in the posterior of the embryo. (B) A similar combination of genes is shown, with hkb in place of cad. Note that the size of the hkb domain is unaffected in either cadm-z- or tll- mutants. The tll- traces in both (A) and (B) are taken from a single wg/cad/hkb/fkh stain. Source data is the same as Figure 7.
Figure 7—figure supplement 2
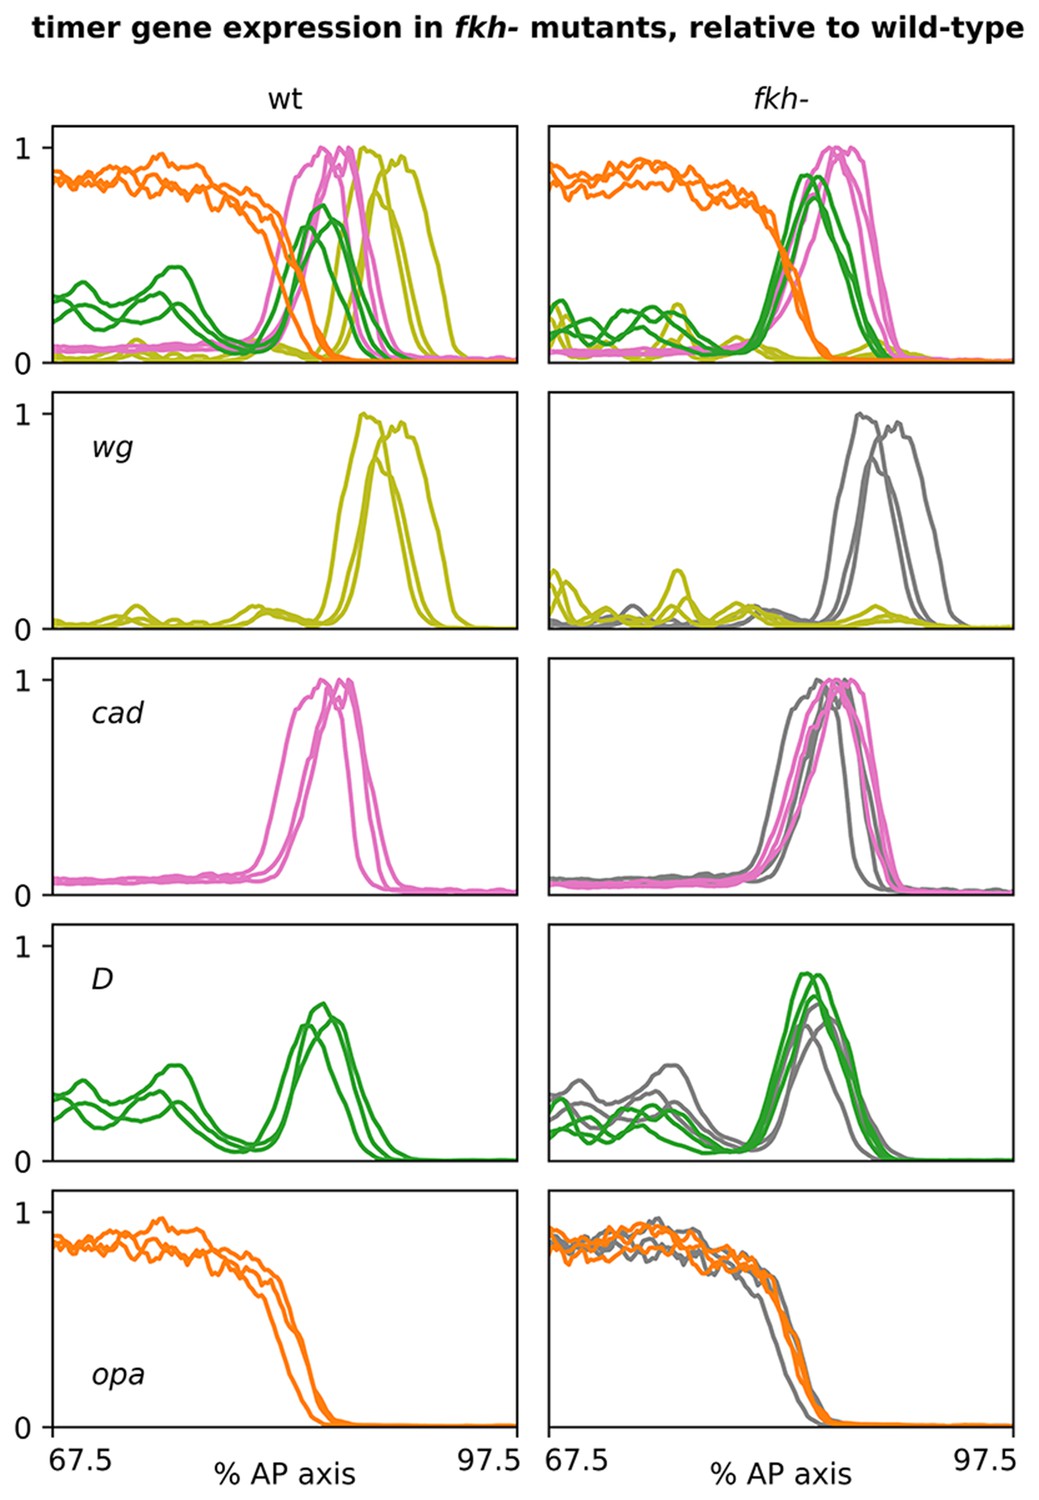
Timer gene expression traces from fkh- mutants, relative to wild-type.
Plots showing quantitative expression traces (67.5–97.5% AP axis) from multiple stage 5.5 embryos, individually normalised to the range 0–1. Left column shows traces from wild-type embryos (coloured lines); right column shows traces from fkh- mutants (coloured lines) overlaid on the same wild-type traces shown on the left (grey lines). Note the loss of the wg posterior domain in fkh- mutants. Source data is the same as Figure 7.
Figure 7—figure supplement 3
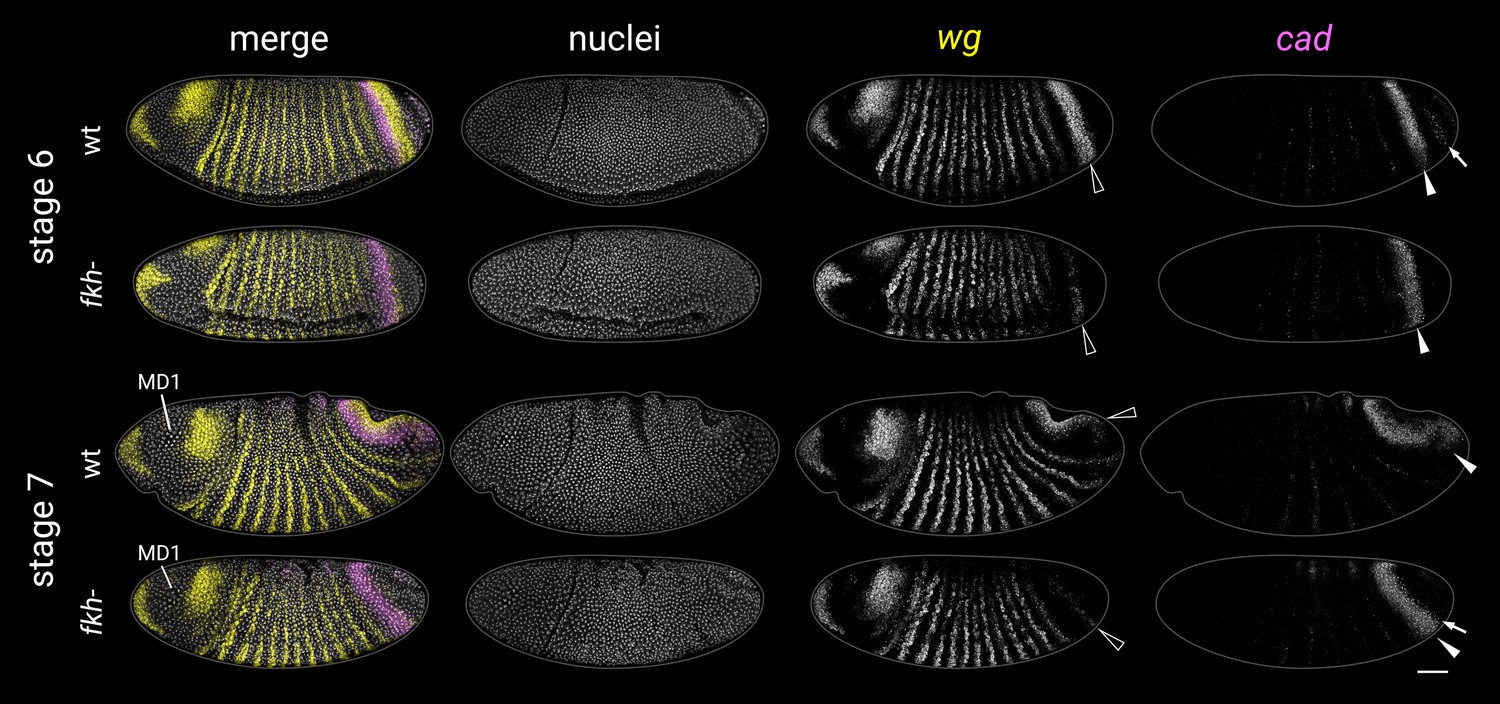
wg and cad expression in fkh- mutants at stages 6 and 7.
Black arrowheads mark the posterior wg domain (severely reduced in fkh- mutants). White arrowheads mark the cad tail domain. In the stage 6 wild-type embryo, note the additional cad domain posteriorly abutting the posterior wg domain (white arrow). This domain (corresponding to presumptive Malpighian tubules and proximal posterior midgut; Harbecke and Janning, 1989) is absent in stage 6 fkh- mutants. In fkh- mutants, new cad expression instead appears later, at the posterior edge of the tail domain (white arrow in the stage 7 embryo, pointing at prominent transcriptional foci). MD1, mitotic domain 1 (used for embryo staging). All embryos are anterior left, dorsal up, lateral or ventrolateral views. Scale bar = 50 μm; grey lines show embryo outlines.
Figure 7—figure supplement 4
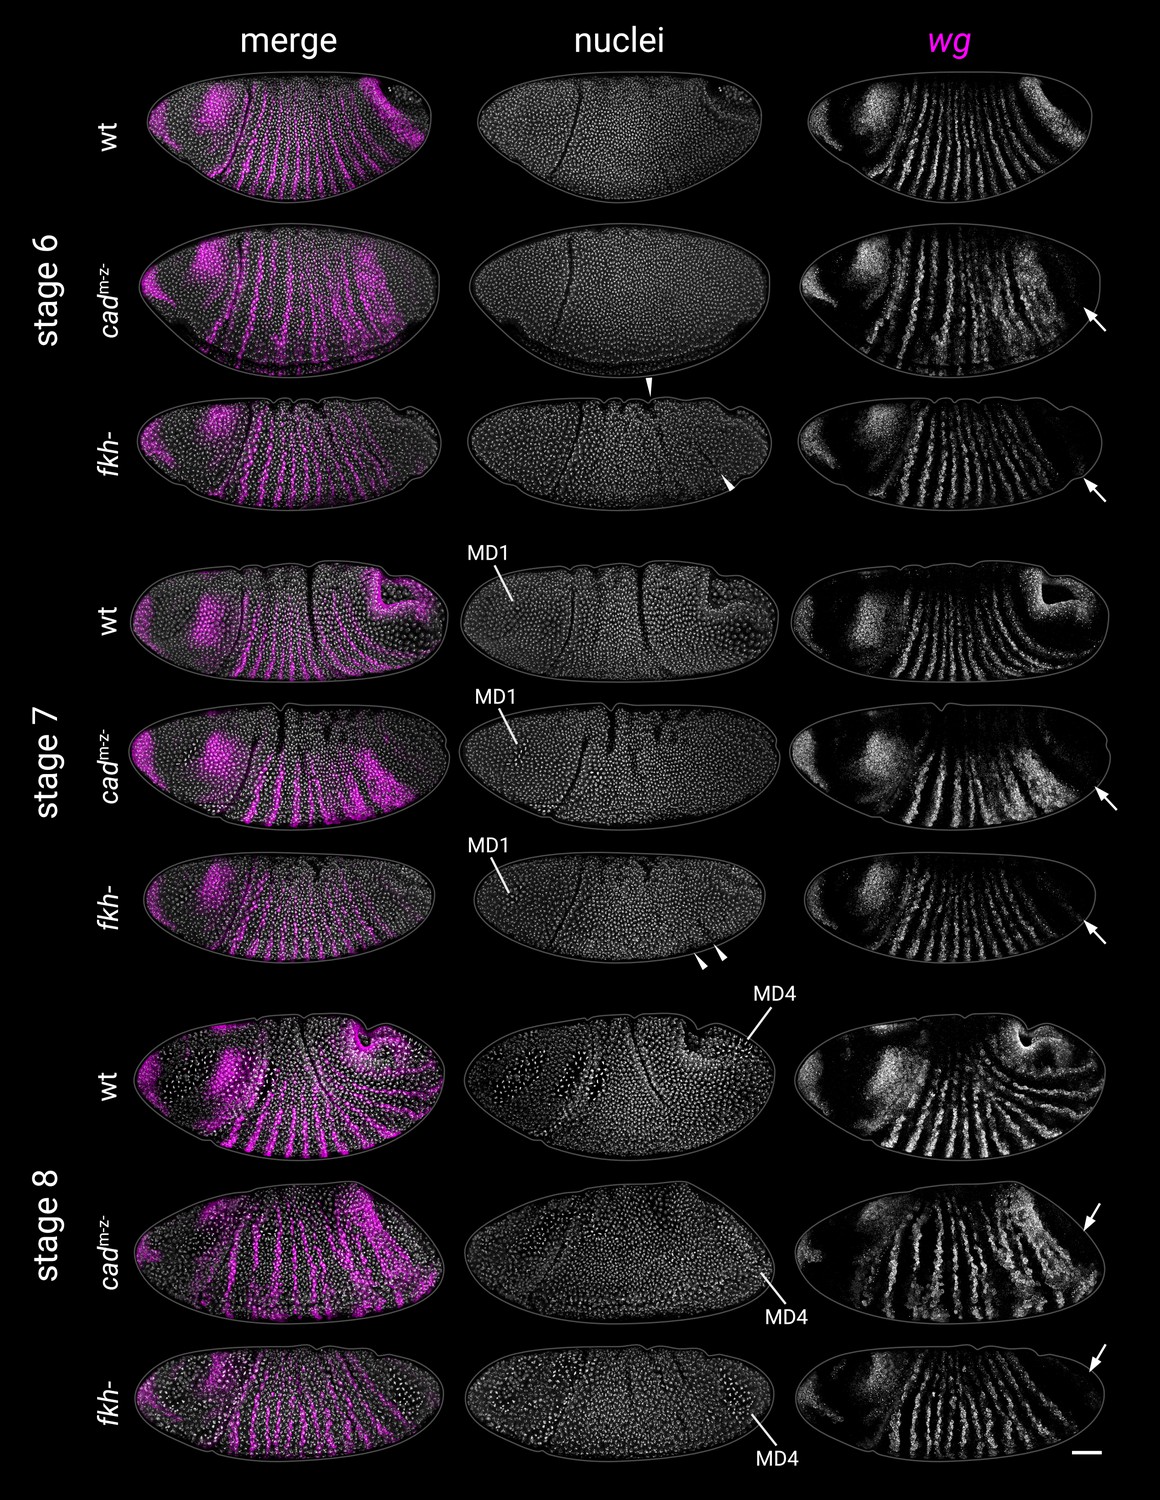
Abnormal morphogenesis in cadm-z- and fkh- mutants.
wg expression and DAPI (nuclei) staining from wild-type, cadm-z- mutant, and fkh- mutant embryos at stages 6, 7, and 8. Embryos were staged by the presence of mitotic domain 1 (MD1, stage 7) or mitotic domain 4 (MD4, stage 8). Note the delayed proctodaeal invagination seen in both cadm-z- and fkh- mutants relative to wild-type embryos. Note also the epithelial buckling in fkh- mutants (arrowheads at stages 6 and 7), reminiscent of folded gastrulation (fog-) mutants (Sweeton et al., 1991). Both cadm-z- and fkh- mutants also mostly lack the posterior wg domain (arrows). All embryos are anterior left, dorsal up, lateral or dorsolateral views. Scale bar = 50 μm; grey lines show embryo outlines.
Figure 8 with 1 supplement
Inferred regulatory network for posterior terminal patterning and output of resulting model.
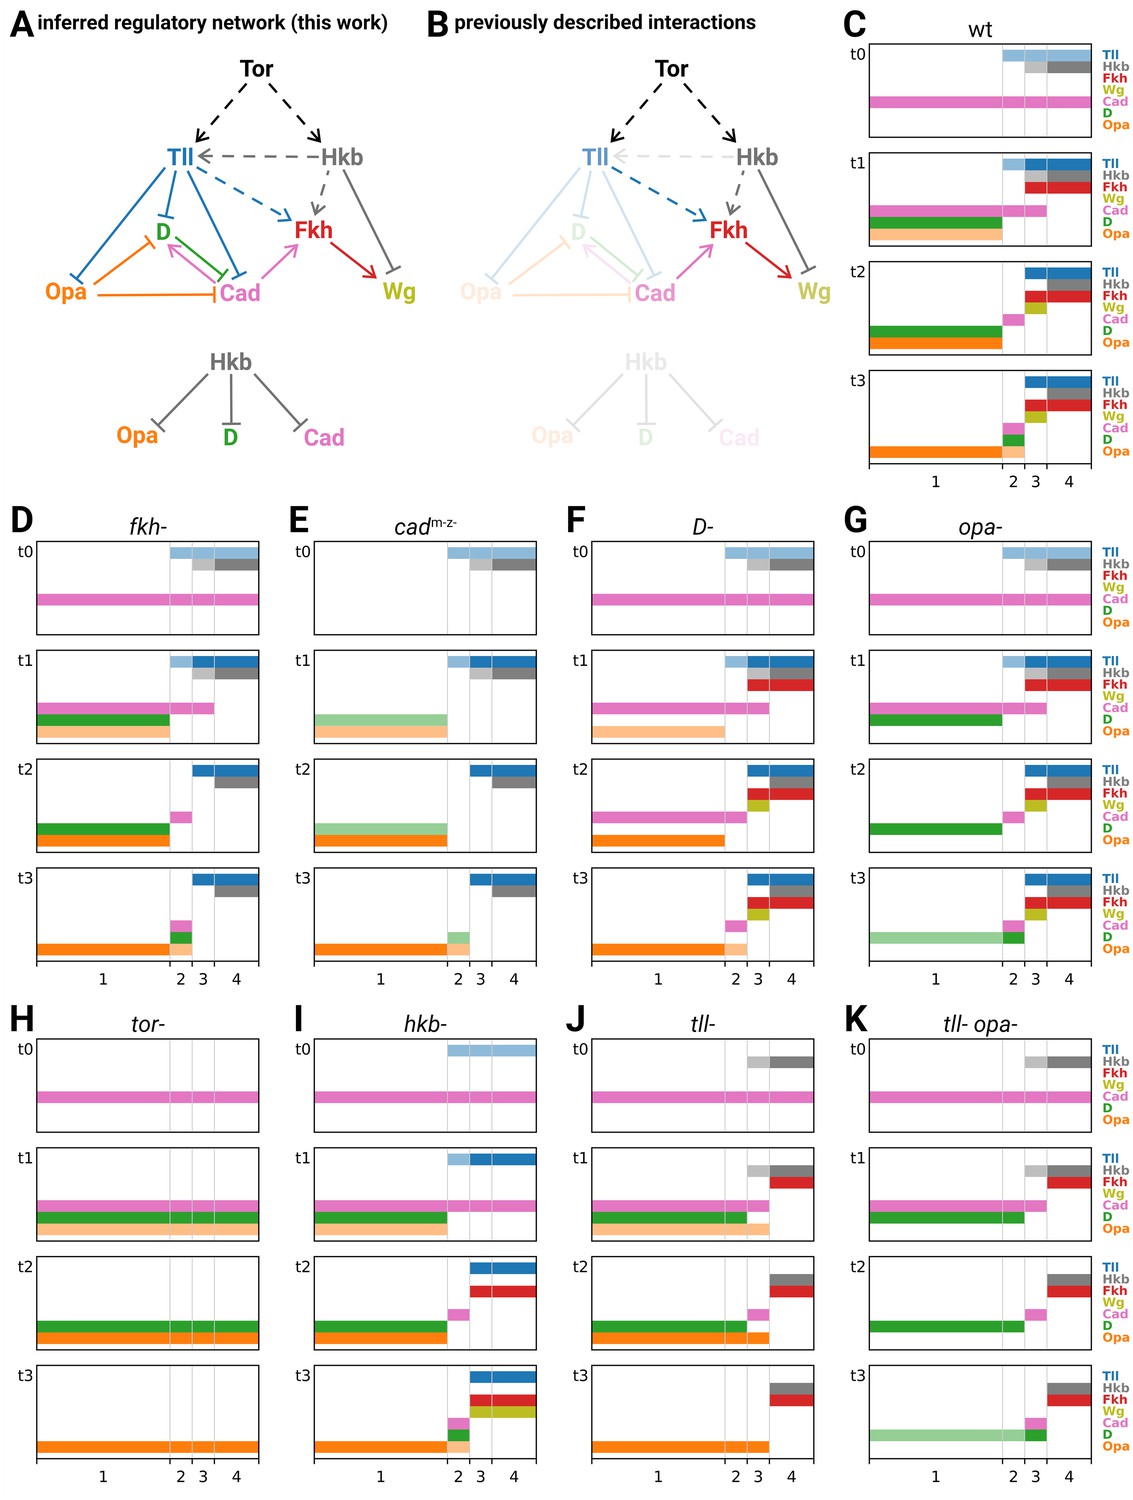
(A) Arrow diagram showing the regulatory interactions we have inferred from the experiments described in this work. Pointed arrowheads indicate activation; flat arrowheads indicate repression. Solid lines indicate interactions that are presumed to be direct; dashed lines indicate interactions that are presumed to be indirect. The diagram is laid out so that the factors are arranged in approximately the same order left to right as their expression along the AP axis, and causation mainly flows from top to bottom (with exceptions for Opa and Cad). To avoid arrow crossovers, the repression of Opa, D, and Cad by Hkb is shown separately from the main network. (B) The same network as in (A), highlighting the interactions described in the existing literature. (C–K) Simulation output for a logical model of posterior terminal patterning, for wild-type and eight mutant genotypes (see main text for details). Each set of plots shows the expression patterns of the logical variables Tll, Hkb, Fkh, Wg, Cad, D, and Opa (y-axis) across AP regions 1–4 (x-axis), at timepoints t0–t3. For Tll, Hkb, D, and Opa, a light colour shade represents weak expression and a dark colour shade represents strong expression. Mutant genotypes never express the relevant protein; tor- mutants were simulated as tll- hkb- double mutants.
Figure 8—figure supplement 1
Simulation of a hypothetical timer gene network for sequential segmentation.
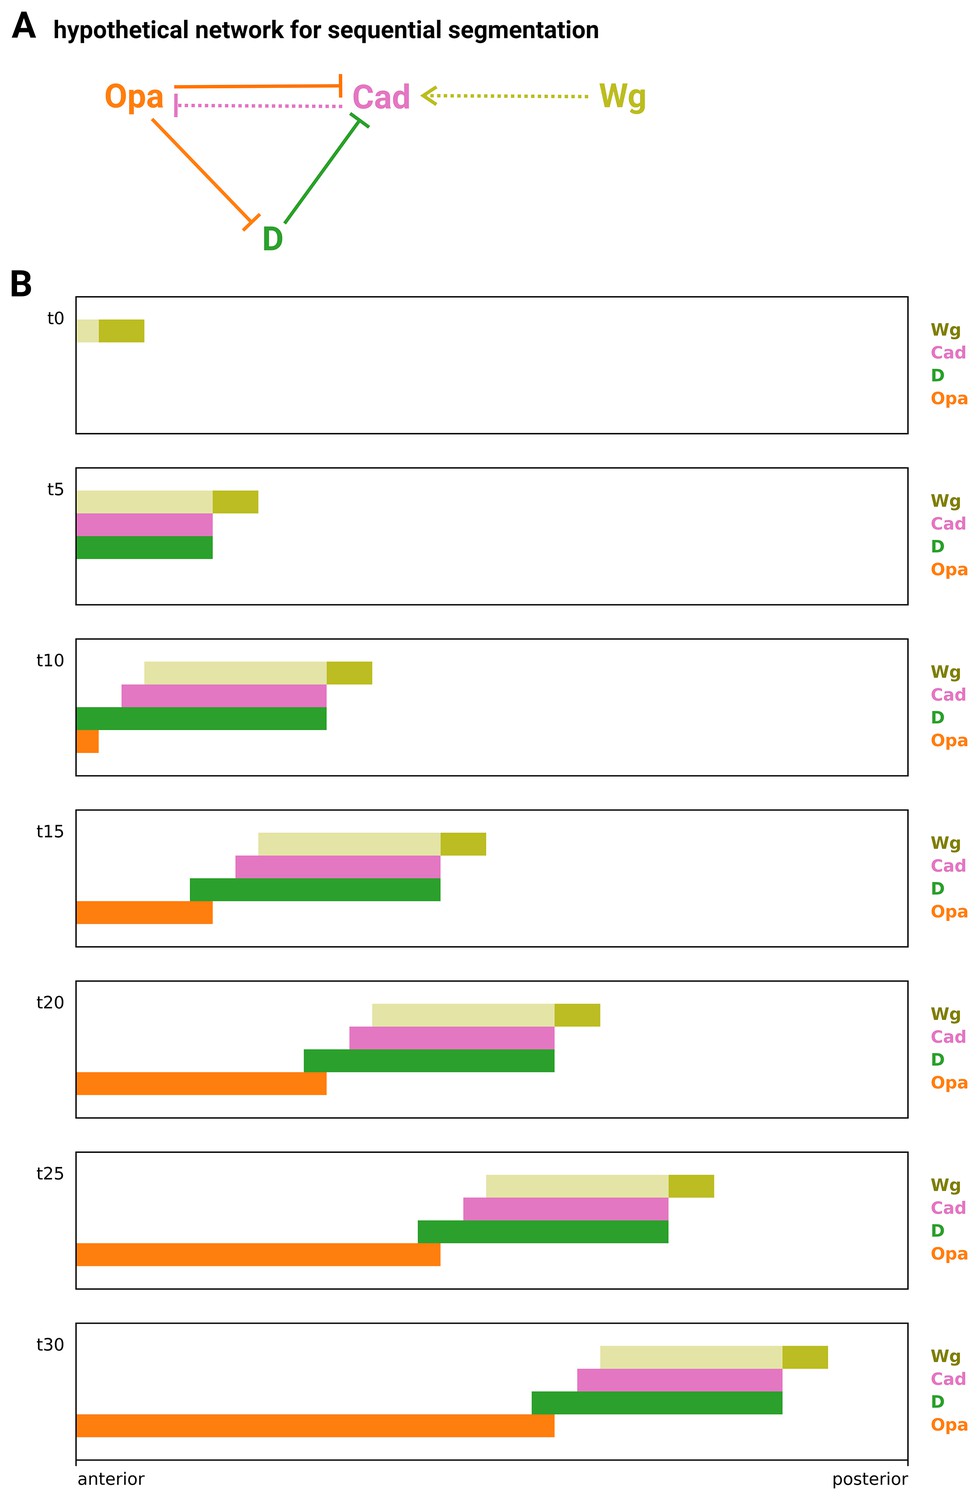
(A) Arrow diagram showing a hypothetical timer gene network for sequential segmentation. Pointed arrowheads represent activation; flat arrowheads represent repression. Solid arrows are interactions taken from the Drosophila timer gene network in Figure 8A; dotted arrows are two additional interactions that might be present in sequentially segmenting species. The arrow from Wg to Cad supposes that Wg signalling from a posterior signalling centre activates cad expression, even in the presence of D. (Note that both Sox and Zic transcription factors can have different regulatory effects in the presence or absence of Wnt signalling, via molecular interactions with β-catenin and TCF; Pourebrahim et al., 2011; Murgan et al., 2015; Mukherjee et al., 2022.) The arrow from Cad to Opa completes an ‘AC-DC circuit’ network motif (Panovska-Griffiths et al., 2013; Perez-Carrasco et al., 2018) between the timer genes. (B) Simulation output from a model of the network in (A) operating in a scenario of posterior Wg signalling and AP axial growth. Each plot shows axial expression of the logical variables Wg, Cad, D, and Opa at a different timepoint in the simulation (t0–t30). The position of the Wg signalling centre (dark yellow rectangle) marks the posterior of the elongating AP axis; the spatial extent of Wg signalling is also shown (light yellow rectangle). Close to the posterior Wg signalling centre, Cad is activated by Wg, in turn activating D and keeping Opa repressed. Further away from the signalling centre, repression of Cad by D kicks in. Cad turns off, repression of Opa is lifted, and Opa in turn represses both Cad and D. Combined with the axial elongation of the tissue, this scenario produces posteriorly shifting wavefront dynamics (the transition between Cad/D and Opa expression moves posteriorly across the axis over time), similar to those found in Tribolium (Clark and Peel, 2018).
Appendix 1—figure 1
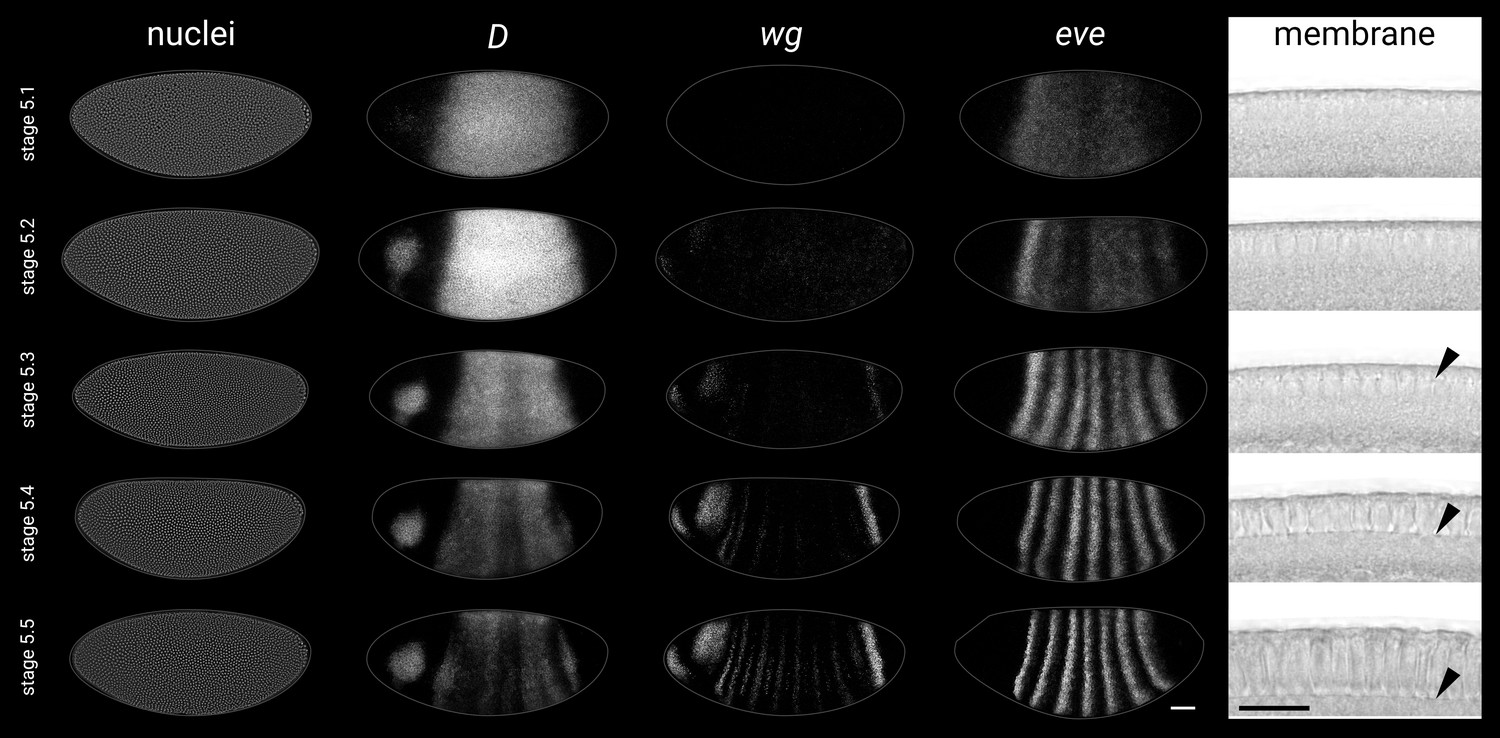
Substaging scheme for stage 5 embryos.
Representative gene expression patterns and blastoderm morphology for each of the five substages in our substaging scheme for stage 5 (nuclear cycle 14). See Appendix 1—table 1 for details. Rightmost column shows transmitted light images of a sagittal view of the dorsal blastoderm surface; black arrowheads point to the invaginating plasma membrane. All embryos are anterior left, dorsal up, lateral view. Scale bars = 50 μm (whole embryos), 20 μm (membrane close-ups); grey lines show embryo outlines. Note that the five images in each row are not all sourced from the same embryo.
Appendix 2—figure 1
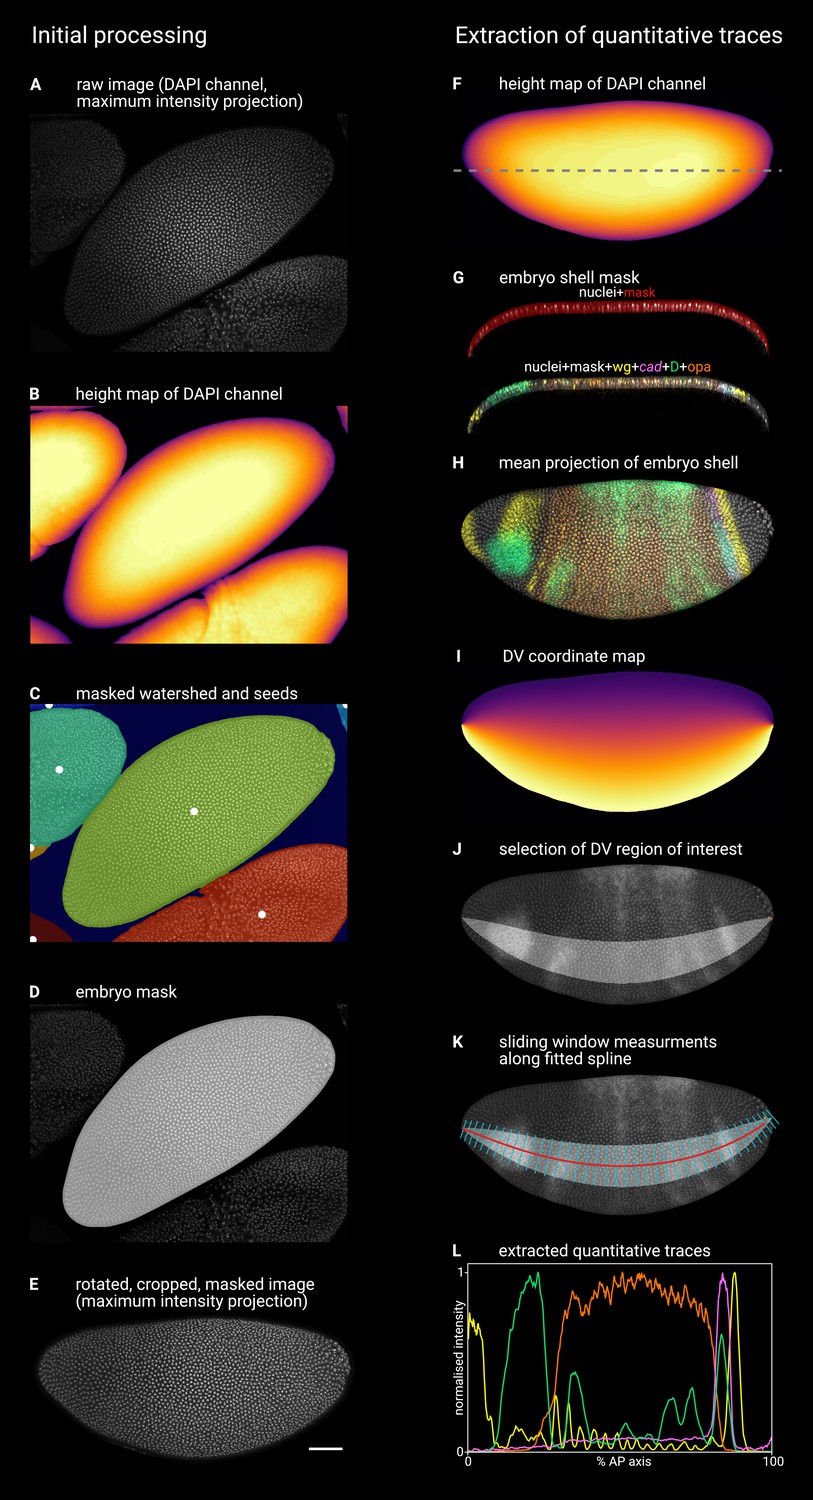
Illustration of image processing steps.
Timer gene expression in timer gene mutants. Left column illustrates the initial processing of raw confocal data to generate single embryo stacks; right column illustrates the extraction of quantitative expression intensity traces from the processed stacks (see text for additional details and explanation). (A) Maximum z-projection of the DAPI (nuclei) channel of the raw multi-channel stack. (B) Height map generated from the smoothed DAPI (nuclei) channel, where the colour of the pixel (yellow = high, black = low) indicates the height of the embryo surface. (C) Watershed segmentation of the (inverted) height map, in which local peaks (white dots) indicate the watershed seeds, each segmented region is overlaid by a different colour, and the low-lying background area is masked (dark blue). (D) The 2D mask for the focal embryo (light grey), overlaid on the maximum z-projection of the DAPI (nuclei) channel. (E) A maximum z-projection of the DAPI (nuclei) channel after image rotation, cropping, masking, and manual flipping. (F) Height map of the embryo z-stack, as in (B). Dashed line marks the location of the xz plane shown in (G). (G) An xz (frontal) section through the embryo, showing the embryo ‘shell mask’ overlaid on the DAPI (nuclei) channel (top) or on a merge of all five imaging channels (bottom). Note that the vast majority of the transcriptional signal is contained within the shell mask. (H) A 5-channel merge showing a mean z-projection of the 3D region defined by the embryo shell mask. (I) A map of the DV coordinates assigned to the embryo z-projection by interpolating between the dorsal and ventral boundaries of the embryo mask. (J) A region of interest (light grey area) defined by a specific range of DV coordinates. The range spans 30% of the DV axis and is selected to intersect with the round D domain in the head. Note the manually input coordinate (orange dot at the posterior of the embryo) marking the beginning of the pole cell region. (K) The red line shows a 2D projection of a 3D spline fitted to the centre of the DV region of interest (x and y coordinates) and the corresponding values from the height map (z coordinates). The cyan lines are normal to the spline in x and y. Expression traces are extracted from the image by running a sliding window (width = 1% of the length of the spline in 3D, anterior and posterior boundaries normal to the spline, dorsal and ventral boundaries defined by the DV region of interest) along the spline and recording the mean intensity of each image channel. (L) The quantitative expression traces extracted from the image, after normalising each trace to the 0–1 range.
-
Appendix 2—figure 1—source data 1
Sample image stack and image analysis scripts.
- https://cdn.elifesciences.org/articles/78902/elife-78902-app2-fig1-data1-v2.zip
-
Appendix 2—figure 1—source data 2
List of source image files for all figures.
- https://cdn.elifesciences.org/articles/78902/elife-78902-app2-fig1-data2-v2.zip
Tables
Key resources table
| Reagent type (species) or resource | Designation | Source or reference | Identifiers | Additional information |
|---|---|---|---|---|
| Gene (Drosophila melanogaster) | caudal (cad) | FlyBase | FLYB:FBgn0000251 | |
| Gene (D. melanogaster) | Dichaete (D) | FlyBase | FLYB:FBgn0000411 | |
| Gene (D. melanogaster) | engrailed (en) | FlyBase | FLYB:FBgn0000577 | |
| Gene (D. melanogaster) | even-skipped (eve) | FlyBase | FLYB:FBgn0000606 | |
| Gene (D. melanogaster) | forkhead (fkh) | FlyBase | FLYB:FBgn0000659 | |
| Gene (D. melanogaster) | huckebein (hkb) | FlyBase | FLYB:FBgn0261434 | |
| Gene (D. melanogaster) | muscle segment homeobox (msh) | FlyBase | FLYB:FBgn0000492 | |
| Gene (D. melanogaster) | odd-paired (opa) | FlyBase | FLYB:FBgn0003002 | |
| Gene (D. melanogaster) | sloppy-paired (slp) | FlyBase | FLYB:FBgn0003430 | |
| Gene (D. melanogaster) | tailless (tll) | FlyBase | FLYB:FBgn0003720 | |
| Gene (D. melanogaster) | torso (tor) | FlyBase | FLYB:FBgn0003733 | |
| Gene (D. melanogaster) | wingless (wg) | FlyBase | FLYB:FBgn0284084 | |
| Strain, strain background (D. melanogaster) | Oregon-R | Bloomington Drosophila Stock Center | BDSC:5; RRID:BDSC_5 | ‘Wild-type’ |
| Strain, strain background (Escherichia coli) | One Shot BL21 Star (DE3) | Thermo Fisher Scientific | C601003 | Chemically competent cells |
| Genetic reagent (D. melanogaster) | cad[3] | Bloomington Drosophila Stock Center | BDSC:5316; FLYB:FBal0001531; RRID:BDSC_5316 | Gift from H. Skaer |
| Genetic reagent (D. melanogaster) | cad[2] FRT40A | Bloomington Drosophila Stock Center | BDSC:7091; FLYB:FBal0001530; FLYB:FBti0002071; RRID:BDSC_7091 | |
| Genetic reagent (D. melanogaster) | D[r72] | Bloomington Drosophila Stock Center | BDSC:8858 FLYB:FBal0086878; RRID:BDSC_8858 | Gift from S. Russell |
| Genetic reagent (D. melanogaster) | fkh[6] | Bloomington Drosophila Stock Center | BDSC:545; FLYB:FBal0004012; RRID:BDSC_545 | Gift from K. Roeper |
| Genetic reagent (D. melanogaster) | hkb[A321R1] | Bloomington Drosophila Stock Center | BDSC:2059; FLYB:FBal0031495; RRID:BDSC_2059 | |
| Genetic reagent (D. melanogaster) | opa[8] | Bloomington Drosophila Stock Center | BDSC:5335; FLYB:FBal0013272; RRID:BDSC_5335 | |
| Genetic reagent (D. melanogaster) | Df(3R)Exel6217 | Bloomington Drosophila Stock Center | BDSC:7695; FLYB:FBab0038272; RRID:BDSC_7695 | Deficiency covering the tll locus |
| Genetic reagent (D. melanogaster) | tor[XR1] | Sprenger et al., 1989 | FLYB:FBal0016988 | Gift from T. Johnson |
| Genetic reagent (D. melanogaster) | wg[l-8] | Bloomington Drosophila Stock Center | BDSC:5351; FLYB:FBal0018500; RRID:BDSC_5351 | |
| Genetic reagent (D. melanogaster) | CyO, hb-lacZ | Bloomington Drosophila Stock Center | BDSC:6650; FLYB:FBba0000025; FLYB:FBti0002621; RRID:BDSC_6650 | |
| Genetic reagent (D. melanogaster) | TM6C, twi-lacZ | Bloomington Drosophila Stock Center | BDSC:7251; FLYB:FBba0000071; FLYB:FBti0010595; RRID:BDSC_7251 | |
| Genetic reagent (D. melanogaster) | TM3, hb-lacZ | Bloomington Drosophila Stock Center | BDSC:78357; FLYB:FBba0000047; FLYB:FBti0010581; RRID:BDSC_78357 | Gift from S. Russell |
| Genetic reagent (D. melanogaster) | hsFLP | Bloomington Drosophila Stock Center | BDSC:6; FLYB:FBti0002044; RRID:BDSC_6 | |
| Genetic reagent (D. melanogaster) | ovoD1 FRT40A | Bloomington Drosophila Stock Center | BDSC:2121; FLYB:FBtp0000359; FLYB:FBti0002071; RRID:BDSC_2121 | No longer listed in BDSC |
| Antibody | Anti-D (rabbit polyclonal) | Soriano and Russell, 1998 | (1:10) | |
| Antibody | Anti-Hkb (rat polyclonal) | Ashyraliyev et al., 2009 | (1:100) | |
| Antibody | Anti-Opa (guinea-pig polyclonal) | This paper | (1:5000) | |
| Antibody | Anti-Tll (rabbit polyclonal) | Kosman et al., 1998 | (1:100) | |
| Antibody | Anti-guinea pig Alexa Fluor 647 (goat polyclonal) | Invitrogen | Cat#:A-21450; RRID:AB_2735091 | (1:1000) |
| Antibody | Anti-rabbit Alexa Fluor 488 (goat polyclonal) | Invitrogen | Cat#:A-11034; RRID:AB_2576217 | (1:1000) |
| Antibody | Anti-rabbit Alexa Fluor 555 (goat polyclonal) | Invitrogen | Cat#:A-21429; RRID:AB_2535850 | (1:1000) |
| Antibody | Anti-rat Alexa Fluor 488 (goat polyclonal) | Invitrogen | Cat#:A-11006; RRID:AB_2534074 | (1:1000) |
| Recombinant DNA reagent | FI01113 (clone) | Drosophila Genomics Resource Center | DGRC:1623347; RRID:DGRC_1623347 | opa cDNA |
| Recombinant DNA reagent | Gateway pDONR221 (plasmid) | Thermo Fisher Scientific | Cat#:12536017 | |
| Recombinant DNA reagent | Gateway pET-DEST42 (plasmid) | Thermo Fisher Scientific | Cat#:12276010 | |
| Sequence-based reagent | cad | Molecular Instruments | HCR v3.0 probes | Designed to target NCBI:NM_134301.4 |
| Sequence-based reagent | cad-Intron | Molecular Instruments | HCR v3.0 probes | Designed to target NCBI:NT_033779.5: 20771910–20781798 |
| Sequence-based reagent | D | Molecular Instruments | HCR v3.0 probes | Designed to target NCBI:NM_001274901.1 |
| Sequence-based reagent | en | Molecular Instruments | HCR v3.0 probes | Designed to target NCBI:NM_078976.4 |
| Sequence-based reagent | eve | Molecular Instruments | HCR v3.0 probes | Designed to target NCBI:NM_078946.4 |
| Sequence-based reagent | fkh | Molecular Instruments | HCR v3.0 probes | Designed to target NCBI:NM_001300645.1 |
| Sequence-based reagent | hkb | Molecular Instruments | HCR v3.0 probes | Designed to target NCBI:NM_079497.4 |
| Sequence-based reagent | msh | Molecular Instruments | HCR v3.0 probes | Designed to target NCBI:NM_057976.3 |
| Sequence-based reagent | opa | Molecular Instruments | HCR v3.0 probes | Designed to target NCBI:NM_079504.4 |
| Sequence-based reagent | slp | Molecular Instruments | HCR v3.0 probes | Designed to target NCBI:NM_057382.3 |
| Sequence-based reagent | tll | Molecular Instruments | HCR v3.0 probes | Designed to target NCBI:NM_079857.4 |
| Sequence-based reagent | wg | Molecular Instruments | HCR v3.0 probes | Designed to target NCBI:NM_078778.5 |
| Sequence-based reagent | lacZ | Molecular Instruments | HCR v3.0 probes | Designed to target NCBI:NC_000913.3: c366305-363231 |
| Sequence-based reagent | B1-5 Alexa Fluor 488 | Molecular Instruments | HCR amplifiers | Amplifiers coordinated with probes |
| Sequence-based reagent | B1-5 Alexa Fluor 514 | Molecular Instruments | HCR amplifiers | Amplifiers coordinated with probes |
| Sequence-based reagent | B1-5 Alexa Fluor 546 | Molecular Instruments | HCR amplifiers | Amplifiers coordinated with probes |
| Sequence-based reagent | B1-5 Alexa Fluor 594 | Molecular Instruments | HCR amplifiers | Amplifiers coordinated with probes |
| Sequence-based reagent | B1-5 Alexa Fluor 647 | Molecular Instruments | HCR amplifiers | Amplifiers coordinated with probes |
| Sequence-based reagent | opaDM-F | This paper | PCR primers | AAAAAGCAGGCTTCGAAGGA GATAGAACCATGAACGCCTT CATTGAGC |
| Sequence-based reagent | opaA-R | This paper | PCR primers | AGAAAGCTGGGTTGTCGTAG CCGTGGGATG |
| Sequence-based reagent | attB1adap-F | This paper | PCR primers | GGGGACAAGTTTGTACAAAA AAGCAGGCT |
| Sequence-based reagent | attB2adap-R | This paper | PCR primers | GGGGACCACTTTGTACAAGA AAGCTGGGT |
| Commercial assay or kit | Gatweway BP Clonase II | Thermo Fisher Scientific | Cat#:11789020 | |
| Commercial assay or kit | Gateway LR Clonase II | Thermo Fisher Scientific | Cat#:11791020 | |
| Peptide, recombinant protein | Phusion Plus DNA Polymerase | Thermo Fisher Scientific | Cat#:F630S | |
| Chemical compound, drug | Overnight Express Instant TB Medium | Novagen | Cat#:71491-3 | |
| Chemical compound, drug | Ni-NTA Agarose | QIAGEN | Cat#:30210 | |
| Other | Normal Goat Serum blocking solution | Vector Laboratories | Cat#:S-1000-20 | |
| Other | DAPI stain | Invitrogen Scientific | Cat#:D1306 | (1 ng/μL) |
| Other | #1.5 coverslips | Corning | Cat#:2980-224 | |
| Other | SlowFade Gold AntiFade Mountant | Thermo Fisher Scientific | Cat#:S36940 |
Appendix 1—table 1
Embryo staging and substaging criteria used in this work.
Bownes stages 4, 5, 8, and 11 (Bownes, 1975) are further divided into substages, as described, based on the expression patterns of wg, en, D, and eve, or the progression of cellularisation. For each stage 5 substage, the corresponding ‘temporal equivalence class(es)’ (Surkova et al., 2008) or ‘phase’ (Schroeder et al., 2011) are also listed for comparison. Note that the subdivision of a continuous developmental process into discrete timeclasses is convenient for analysis but biologically somewhat arbitrary; there are no sharp boundaries between the substages we have defined.
| Stage | Criteria | Surkova | Schroeder |
|---|---|---|---|
| 1–3 | Same as Bownes, 1975. | ||
| 4.1 | Syncytial blastoderm nuclear cycle 10 (judged by number/density of nuclei). | ||
| 4.2 | Syncytial blastoderm nuclear cycle 11 (judged by number/density of nuclei). | ||
| 4.3 | Syncytial blastoderm nuclear cycle 12 (judged by number/density of nuclei). | ||
| 4.4 | Syncytial blastoderm nuclear cycle 13 (judged by number/density of nuclei). | ||
| 5.1 | wg: not present. D: broad trunk domain, head domain not well established (mainly nuclear dots). eve: broad trunk expression, may have some AP modulation. Blastoderm morphology: round, early-looking nuclei. | T1 | Phase 1 |
| 5.2 | wg: head and posterior domain expression just starting (mainly nuclear dots). D: head domain established, trunk domain still uniform. eve: not yet a regular 7 stripe pattern. Blastoderm morphology: no invagination of plasma membrane. | T2–3 | Phase 2 |
| 5.3 | wg: head and posterior domains established; wg0 and wg1 forming. D: broad trunk domain becoming fainter in the middle. No tail domain. eve: regular 7 stripe pattern but stripes still fuzzy and broad. Blastoderm morphology: plasma membrane invaginating. | T4–5 | Phase 2 |
| 5.4 | wg: wg0 and wg1 well established; trunk stripes (mainly odd-numbered) just appearing. D: tail domain appearing laterally with similar intensity to trunk expression; anterior and posterior halves of the trunk domain well-separated; trunk expression becoming more modulated. eve: 7 well separated but still symmetrical stripes. Blastoderm morphology: membranes have reached the bottom of the nuclei. | T6–7 | Phase 3 |
| 5.5 | wg: segmental pattern clearly developing (both odd-numbered and even-numbered stripes), though may not be fully established. D: tail domain more established and separated from the trunk; trunk expression starting to fade; neuroectoderm expression just appearing, including a bright anterior-ventral stripe. eve: anterior stripes narrowing to two-cell wide late element expression; posterior stripes becoming AP graded as they transition to the late element. Blastoderm morphology: elongated nuclei. | T8 | Phase 4 |
| 6 | wg: regular segmental stripes. D: tail domain strong; trunk expression (except dorsal saddle) fading; neuroectoderm expression developing but not yet uniform across the AP axis. eve: all 7 stripes have narrowed, faint secondary stripes present. Blastoderm morphology: signs of gastrulation and/or cephalic furrow formation; by late stage 6 pole cells moving dorsally and dorsal crumpling present. | ||
| 7 | Same as Bownes, 1975. | ||
| 8.1 | Mitotic domain 4 dividing. | ||
| 8.2 | wg14 absent/weak, en15 absent. | ||
| 8.3 | wg14 present, en15 absent/weak. | ||
| 8.4 | wg14 present, en15 present. | ||
| 9 | Same as Bownes, 1975. | ||
| 10 | Same as Bownes, 1975. | ||
| 11.1 | wg15 present, en16 absent. | ||
| 11.2 | wg15 present, en16 present. | ||
| 12+ | Same as Bownes, 1975. |
Appendix 3—table 1
Evidence for proposed cross-regulatory interactions between Tll, Hkb, Fkh, Wg, Cad, D, and Opa.
For every pairwise combination of input factor (Tll, Hkb, Fkh, Cad, D, or Opa) and potential target gene (tll, hkb, fkh, wg, cad, D, or opa), the inferred regulatory interaction (activation/repression/none/undetermined) is listed, accompanied by a summary of the relevant experimental evidence and lines of reasoning.
| Input | Target | Interaction | Evidence and discussion |
|---|---|---|---|
| Tll | tll | None | Tll is a dedicated repressor (Morán and Jiménez, 2006) so is unlikely to autoactivate, and sustained expression in wild-type (Figure 5—figure supplement 1) precludes strong autorepression. Indirect activation is a possibility, but one would need to look at a tll- allele that still makes transcript to assess whether tll transcription is affected in tll- mutants. |
| Tll | hkb | None | hkb is transcribed within the Tll domain (Figure 5—figure supplement 1), therefore Tll does not repress hkb. The hkb expression domain is a similar size in wild-type and tll- embryos (Figure 7B), therefore Tll is not required to (indirectly) activate hkb. |
| Tll | fkh | (Indirect) activation | fkh is transcribed across the Tll domain in wild-type and hkb- embryos (Figure 7A and B; Figure 7—figure supplement 1A), and the fkh domain is reduced (to the size of the hkb domain) in tll- embryos (Figure 7A and B; Figure 7—figure supplement 1B). Activation from Tll is presumed to be indirect as Tll is a dedicated repressor (Morán and Jiménez, 2006). |
| Tll | wg | None | wg is transcribed within the Tll domain in wild-type embryos (Figure 5B) and in hkb- mutants (Figure 7A and B; Figure 7—figure supplement 1A), therefore Tll does not repress wg. Tll is necessary for wg expression (wg expression is lost in tll- mutants and is posteriorly shifted in hkb- mutants, correlating with the altered Tll domain; Figure 7A and B; Figure 7—figure supplement 1A), but this activation seems to be indirect (via Fkh) as Tll is a dedicated repressor (Morán and Jiménez, 2006), and the presence of Tll-positive, Hkb-negative territory is not sufficient to activate wg in fkh- or cadm-z- genotypes (Figure 7; Figure 7—figure supplement 1B). |
| Tll | cad | (Weak) repression | cad transcription overlaps the graded anterior edge of the Tll domain throughout most of the blastoderm stage in wild-type embryos (Figure 5), indicating that Tll does not strongly repress cad. However, cad is still repressed in (Tll-positive, Fkh-positive) posterior tissue in hkb- mutants (Figure 6E–G), suggesting that cad must be repressed by either Tll or Fkh (or both). As cad expression is largely normal in fkh- mutants (Figure 7C and D), it seems likely that Tll does indeed repress cad, albeit more weakly than Tll represses other targets such as D and opa. Investigation of cad expression in fkh- hkb- double mutants would be informative for isolating the role of Tll in cad regulation. |
| Tll | D | Repression | The graded posterior border of the D domain is anticorrelated with Tll levels in wild-type embryos, and the D tail domain appears only after tll expression in this region decline (Figure 5A). The D posterior boundary shifts posteriorly in tll- mutants, and also in hkb- mutants, apparently because the tll domain is reduced (Figure 6C–H). D expression is normal in fkh- mutants (Figure 7C and D), indicating that the repressive effect of Tll is not mediated by Fkh. It is currently unclear whether the D tail domain has the same regulatory logic / sensitivity to Tll as does the D trunk domain; investigation of D enhancer regions will be informative. |
| Tll | opa | Repression | opa is excluded from the Tll domain in wild-type (Figure 5A), and the posteriorly shifting opa boundary (Figure 3B) correlates with the posteriorly shifting dynamics of the Tll domain (Figure 5—figure supplement 3; Figure 5—figure supplement 4). The opa boundary is shifted posteriorly in tll- mutants, and also in hkb- mutants, apparently because the tll domain is reduced (Figure 6C–H). opa expression is normal in fkh- mutants (Figure 7C and D), indicating that the repressive effect of Tll is not mediated by Fkh. |
| Hkb | tll | (Indirect) activation | tll is coexpressed with Hkb (Figure 5—figure supplement 1), therefore Hkb does not repress tll. The tll domain is reduced in hkb- mutants (Figure 6F and H), but as Hkb is a repressor (Goldstein et al., 1999) and tll expression is affected anterior to the Hkb domain, this hkb-dependent activation of tll is presumably indirect. tll expression also persists longer in hkb- mutants (Figure 6—figure supplement 2), but again the Hkb-dependent effect on tll (in this case, late repression) is presumably indirect. |
| Hkb | hkb | None | Hkb is a repressor (Goldstein et al., 1999) so is unlikely to autoactivate. Sustained hkb expression in wild-type embryos (Figure 5—figure supplement 1) precludes strong autorepression. Indirect activation is a possibility, but one would need to look at a hkb- allele that still makes transcript to assess whether hkb transcription is affected in hkb- mutants. |
| Hkb | fkh | (Indirect) activation | fkh is transcribed across the Hkb domain (Figure 7—figure supplement 1B), therefore Hkb does not repress fkh. fkh is still expressed within the hkb domain in tll- mutants (Figure 7A and B), indicating that Hkb can activate fkh independently of Tll. As Hkb is a repressor (Goldstein et al., 1999), this activation is presumably indirect. |
| Hkb | wg | Repression | The wg posterior boundary abuts the Hkb anterior boundary in wild-type embryos (Figure 5B), and wg expression extends to the posterior pole in hkb- mutants (Figure 6E and G; Figure 7A and B). |
| Hkb | cad | Repression | cad is not expressed within the Hkb domain from early stage 5 in wild-type embryos (Figure 5; Figure 5—figure supplement 2), and clearance of cad expression from the posterior pole is delayed in hkb- mutants (Figure 6E; Figure 7A and B). cad remains repressed from the Hkb domain in tll- mutants (Figure 6C, D and G; Figure 7A and B), indicating that Hkb represses cad independently of Tll. In addition, cad expression is largely normal in fkh- mutants throughout blastoderm stages (Figure 7C and D), suggesting that cad repression is not mediated by Fkh. Examining cad expression in tll- fkh- double mutants would be helpful to confirm whether Hkb represses cad independently of both Tll and Fkh. |
| Hkb | D | Repression | D expression is excluded from the Hkb domain in tll- mutants (Figure 6D). Examining D expression in tll- fkh- double mutants would be helpful to confirm whether this repression is independent of Fkh. |
| Hkb | opa | Repression | opa expression is excluded from the Hkb domain in tll- mutants (Figure 6D). Examining opa expression in tll- fkh- double mutants would be helpful to confirm whether this repression is independent of Fkh. |
| Fkh | tll | None | tll expression precedes Fkh expression in wild-type (Figure 5—figure supplement 1; Weigel et al., 1989; extended imaging dataset), therefore Fkh is not required to activate tll. Tll and Fkh are co-expressed throughout stage 5 (Figure 7A and B; extended imaging dataset), indicating that Fkh does not repress tll. In addition, although we did not examine tll expression in fkh- mutants, tll-dependent patterning of D and opa appears normal in fkh- mutants (Figure 7C and D), indicating that tll expression is unlikely to be perturbed. It would be useful to examine tll expression in fkh- mutants to confirm this. |
| Fkh | hkb | None | hkb expression precedes Fkh expression in wild-type (Figure 5—figure supplement 1; Weigel et al., 1989; extended imaging dataset), therefore Fkh is not required to activate hkb. Hkb and Fkh are coexpressed throughout stage 5 (Figure 7—figure supplement 1B; extended imaging dataset), indicating that Fkh does not repress hkb. It would be useful to examine hkb expression in fkh- mutants to confirm it looks normal. |
| Fkh | fkh | None | Sustained Fkh expression in wild-type embryos (Figure 7A; Weigel et al., 1989; extended imaging dataset) suggests autorepression is unlikely. It would be useful to examine fkh expression in fkh- mutants to assess whether autoactivation occurs. |
| Fkh | wg | Activation | wg is only expressed in Fkh-positive, Hkb-negative territory in wild-type embryos (Figure 5B), and wg expression is strongly reduced in fkh- mutants (Figure 7C and D; Figure 7—figure supplement 3; Figure 7—figure supplement 4) and also cadm-z- mutants (Figure 4A and B; Figure 7A; Figure 4—figure supplement 3A), which have reduced fkh expression (Figure 7A and B). |
| Fkh | cad | Undetermined | The posterior cad boundary consistently abuts the anterior fkh boundary, for example in wild-type embryos, tll- mutants, and hkb- mutants (Figure 7A and B). However, cad expression is largely normal in fkh- mutants throughout stage 5 (Figure 7C and D), with a possible posterior expansion after gastrulation (Figure 7—figure supplement 3). Because we think that Tll both represses cad and (indirectly) activates fkh, it is unclear whether Fkh indeed has no effect on cad, or alternatively whether Fkh and Tll repress cad redundantly. Misexpression of Fkh in the tail region would be informative. |
| Fkh | D | Undetermined | Unclear, as Fkh is only ever expressed in territories expressing D repressors Tll or Hkb (Figure 7A and B). Misexpression of Fkh in segmental territories would be informative. |
| Fkh | opa | Undetermined | Unclear, as Fkh is only ever expressed in territories expressing opa repressors Tll or Hkb (Figure 7A and B). Misexpression of Fkh in segmental territories would be informative. |
| Cad | tll | None | The tll domain emerges from Cad-positive territory (Figure 5A), therefore Cad does not repress tll. tll is expressed normally in cadm-z- mutants (Figure 7A and B), therefore Cad is not required to activate tll. |
| Cad | hkb | None | The hkb domain emerges from Cad-positive territory (Figure 2; Figure 5B), therefore Cad does not repress hkb. hkb is expressed normally in cadm-z- mutants (Figure 7—figure supplement 1B), therefore Cad is not required to activate hkb. |
| Cad | fkh | None | fkh expression is strongly reduced in cadm-z- mutants, even though tll and hkb expression is largely normal (Figure 7A and B; Figure 7—figure supplement 1). |
| Cad | wg | Activation | Although the wg posterior domain is lost in cadm-z- mutants (Figure 4A and B; Figure 4—figure supplement 3A), this phenotype is likely mediated by the loss of fkh expression in these embryos (Figure 7A and B), because the wg posterior domain is also lost in fkh- mutants (Figure 7C and D; Figure 7—figure supplement 3; Figure 7—figure supplement 4) and these have normal cad expression (Figure 7C and D). In addition, wg expression persists posterior to the cad domain throughout germband extension in wild-type, after broad blastoderm Cad expression has decayed (Figure 2). |
| Cad | cad | None | The persistent expression of cad in the tail in both wild-type embryos and cadm-z- mutants (Figure 4C) is inconsistent with both direct autorepression and direct autoactivation. We interpret the delayed clearance of cad from the trunk in cadm-z- mutants (Figure 4C) as due to the lower levels of D in this genotype (Figure 4C), rather than due to direct autoregulation. |
| Cad | D | Activation | D expression emerges within Cad-positive territory in both the trunk and the tail in wild-type embryos (Figure 2), indicating that Cad does not repress D. Reduced D levels in the trunk of cadm-z- embryos (Figure 4C), dorsal loss of D tail expression in cadm-z- embryos (Figure 4; Figure 4—figure supplement 3A), and late loss of D tail expression in cadm+z- embryos (Figure 4—figure supplement 3B) all indicate that Cad activates D. However, additional activators of D must exist, given that D expression is reduced rather than completely lost in cadm-z- embryos. |
| Cad | opa | None | opa is transcribed strongly across the trunk while Cad levels are still high in wild-type embryos (Figure 2; Figure 2—figure supplement 4), and opa expression later invades the cad tail domain from the anterior (Figure 3B), indicating that Cad does not repress opa. opa is expressed largely normally in cadm-z- mutants (Figure 4A; Figure 4—figure supplement 2; though note the AP modulation), indicating that Cad is not required to activate opa. |
| D | tll | Undetermined | There is a subtle anterior shift and expansion of the posterior terminal fate map in D- mutants (Figure 4A and B; Figure 4—figure supplement 2), which can be most easily explained by supposing that D represses tll. Although we did not examine tll expression in D- mutants, tll and D are expressed in opposing gradients during stage 4.4 (nuclear cycle 13) in wild-type embryos (Figure 5A), and it seems plausible that mutual repression between tll and D could help to scale the AP pattern. Investigation of tll expression in D- mutants and misexpression of D in the posterior of the embryo would both be informative experiments. |
| D | hkb | Undetermined | Unclear, as domains of D and hkb expression are distinct (Figure 5). Misexpression of D in the posterior of the embryo would be informative. |
| D | fkh | Undetermined | Unclear, as domains of D and fkh expression are distinct (Figure 2; Figure 7A and B). Although we did not examine fkh expression in D- mutants, the wg posterior domain is activated normally in D- mutants (Figure 4A and B) suggesting that fkh expression is unlikely to be strongly affected. Misexpression of D in the posterior of the embryo would be informative. |
| D | wg | Undetermined | Unclear, as domains of D and wg expression are distinct (Figure 2). The wg posterior domain looks essentially normal in D- mutants (Figure 4A and B). Misexpression of D in the posterior of the embryo would be informative. |
| D | cad | Repression | cad expression ceases in the trunk as D levels increase in wild-type embryos (Figure 2; Figure 2—figure supplement 3; Figure 2—figure supplement 4), while cad expression persists in some parts of the trunk in D- mutants (Figure 4A). The anterior border of the cad tail domain correlates with the earlier position of the posterior border of the D trunk domain in wild-type, hkb- mutants, tll- mutants, and tll- opa- mutants (Figure 2; Figure 6; Figure 4—figure supplement 5; extended imaging dataset). |
| D | D | Undetermined | We were unable to assess possible autoregulatory effects, as D transcript levels were strongly reduced in the D- mutants we examined (Figure 4A), presumably due to nonsense-mediated decay. |
| D | opa | None | opa expression emerges from D-positive territory in the trunk in wild-type (Figure 2; Figure 2—figure supplement 3; Figure 2—figure supplement 4), and opa expression is largely normal in D- mutants (Figure 4A; Figure 4—figure supplement 2), indicating that D neither represses nor activates opa. The opa posterior border is shifted slightly anteriorly in D- mutants (Figure 4—figure supplement 2), but this is likely to be an indirect effect mediated by Tll, or possibly by Cad. |
| Opa | tll | Undetermined | Unclear, as the domains of opa and tll expression are distinct (Figure 5A). Misexpression of Opa in the posterior of the embryo would be informative. |
| Opa | hkb | Undetermined | Unclear, as domains of opa and hkb expression are distinct (Figure 5). Misexpression of Opa in the posterior of the embryo would be informative. |
| Opa | fkh | Undetermined | Unclear, as domains of opa and fkh expression are distinct (Figure 5; Figure 7A and B). Misexpression of Opa in the posterior of the embryo would be informative. |
| Opa | wg | Undetermined | Unclear, as domains of opa and (posterior) wg expression are distinct (Figure 2). Interestingly, Opa activates the segmental wg stripes in the trunk (Benedyk et al., 1994), but Opa/Zic is a Wnt antagonist in other developmental contexts (Pourebrahim et al., 2011; Fujimi et al., 2012; Murgan et al., 2015). Misexpression of Opa in the posterior of the embryo would be informative. |
| Opa | cad | Repression | The anterior border of the cad tail domain retracts in wild-type embryos as Opa levels increase (Figure 3B), suggesting that Opa represses cad. Repression of cad by Opa is also suggested by the late repression of the ectopic cad expression present in the trunk of D- mutants (Figure 4A; extended imaging dataset), and by the late repression of the cad posterior domain in tll- mutants, which overlaps with opa expression (Figure 6C and G; Figure 4—figure supplement 5). |
| Opa | D | Repression | In wild-type embryos, D expression in the trunk decreases as Opa levels increase (Figure 2; Figure 2—figure supplement 4), and the anterior border of the D tail domain lines up with the Opa posterior border (Figure 3A). In opa- mutants, D expression in the trunk persists for longer and D expression in the tail is strengthened (Figure 4A and B; Figure 4—figure supplement 5), indicating that Opa represses D. In addition, a D tail domain does not emerge in tll- mutants, which misexpress opa anterior to the Hkb domain (Figure 6C, D and G), but a tail-like D domain does emerge in tll- opa- double mutants (Figure 4—figure supplement 5). |
| Opa | opa | None | Sustained opa expression in wild-type embryos (Figure 2; Figure 2—figure supplement 4) and normal expression of opa in opa- mutants (Figure 4A; Figure 4—figure supplement 2; Figure 4—figure supplement 5) indicate that strong autoregulatory effects are unlikely, at least within our period of interest. |
Appendix 4—table 1
Cross-references for simulation output and corresponding expression data.
For each simulated genotype, the ‘prediction/observation’ column lists noteworthy behaviours of the system that were both predicted by the model and observed in real embryos. The relevant simulation timepoint(s) are listed, along with figure references for the corresponding expression data, and the stages of the embryos/expression traces shown. wt = wild-type.
| Genotype | t | Prediction/observation | Corresponding data | Stage(s) |
|---|---|---|---|---|
| wt | t0 | cad expressed ubiquitously. | Figure 2; Figure 2—figure supplement 2; Figure 2—figure supplement 4; Figure 5—figure supplement 3 | 4.4 |
| wt | t0 | Nested domains of tll and hkb already established. | Figure 5—figure supplement 1 | 4.4 |
| wt | t0 | Expression of other factors either absent or just beginning. | Figure 2 | 4.4 |
| wt | t1 | fkh expressed where tll (and hkb) expression is strong. | Figure 7A and B; Figure 7—figure supplement 1 | 5.4 |
| wt | t1 | cad clearing from posterior pole. | Figure 2; Figure 2—figure supplement 4; Figure 5—figure supplement 3 | 5.2 |
| wt | t1 | D and opa expressed in trunk, complementary to tll. | Figure 5A | 5.2 |
| wt | t1 | Posterior wg not yet established. | Figure 5B | 5.2 |
| wt | t2 | tll domain retracts/narrows over time. | Figure 5; Figure 5—figure supplement 3; Figure 5—figure supplement 4; Figure 5—figure supplement 5 | 5.2–5.5 |
| wt | t2 | wg expressed in tll-positive, hkb-negative territory. | Figure 5B | 5.4 |
| wt | t2 | cad clears from trunk and tll domain, expressed in between D/opa to the anterior and tll/wg to the posterior. | Figure 2; Figure 3A; Figure 5 | 5.4–5.5 |
| wt | t2 | A gap opens up between the tll and D/opa domains. | Figure 5A | 5.2–5.5 |
| wt | t2 | A gap opens up between the hkb and cad domains. | Figure 5B | 5.3–5.5 |
| wt | t2 | opa/Opa expression builds up in the trunk over time. | Figure 2; Figure 3; Figure 2—figure supplement 4; Figure 5—figure supplement 3; Figure 5—figure supplement 3 | 5.1–5.6 |
| wt | t3 | D expression clears from the trunk. | Figure 2; Figure 2—figure supplement 3; Figure 2—figure supplement 4 | 6 |
| wt | t3 | D expression appears in the tail, coexpressed with cad. | Figure 2; Figure 2—figure supplement 3; Figure 2—figure supplement 4 | 5.5–6 |
| wt | t3 | New opa expression appears within the tail, overlapping cad. | Figure 3B | 5.5–6 |
| fkh- | t2–t3 | Posterior wg domain absent, patterning otherwise normal. | Figure 7C and D | 5.5 |
| cadm-z- | t1 | Early D expression is weaker than wt. | Figure 4C | 5.2 |
| cadm-z- | t1–t3 | fkh expression severely reduced. | Figure 7A and B | 5.4 |
| cadm-z- | t2–t3 | Posterior wg domain absent. | Figure 4A and B; Figure 7A and B; Figure 4—figure supplement 3 | 5.2–6 |
| cadm-z- | t3 | Tail D expression reduced compared to wt. | Figure 4; Figure 4—figure supplement 3 | 5.4–6 |
| cadm-z- | t0–t3 | tll, hkb, and opa expression normal. | Figure 4; Figure 7A and B; Figure 4—figure supplement 2; Figure 7—figure supplement 1 | 5.4–5.5 |
| D- | t2 | cad expression persists longer in the trunk. | Figure 4A and B | 5.5 |
| opa- | t3 | Weak D expression persists longer in the trunk. | Figure 4A; Figure 4—figure supplement 5 | 5.5–6 |
| tor- | t1–t3 | Expression of cad, D, and opa extends to the posterior pole. | Figure 6B and G | 5.2–5.5 |
| tor- | t2 | cad expression clears from the embryo at the normal time. | Figure 6B | 5.4 |
| tor- | t3 | D expression clears from the embryo at the normal time. | Figure 6B | 5.5 |
| tor- | t2–t3 | The posterior wg domain is absent. | Figure 6B | 5.2–5.5 |
| hkb- | t2–t3 | The posterior wg domain extends to the posterior pole. | Figure 6E, G; Figure 7A and B | 5.4–5.5 |
| hkb- | t1 | cad expression persists longer in the posterior of the embryo. | Figure 6E, G; Figure 7A and B | 5.4 |
| tll- | t1–t3 | The size of the fkh domain is reduced. | Figure 7A and B | 5.4 |
| tll- | t1–t3 | cad, D and opa expression is posteriorly expanded. | Figure 6C, D and G; Figure 4—figure supplement 5 | 5.3–6 |
| tll- | t1–t3 | cad and opa share a posterior border, D is slightly more anterior. | Figure 6C and D; Figure 6—figure supplement 1 | 5.3–5.5 |
| tll- | t2 | A transient cad stripe is expressed anterior to the hkb domain. | Figure 6C and D; Figure 4—figure supplement 5 | 5.3–6 |
| tll- | t3 | The cad stripe is repressed and there is no posterior D domain. | Figure 6C; Figure 4—figure supplement 5 | 6 |
| tll- opa- | t3 | There is persistent posterior cad expression and a posterior D domain, unlike in tll-. | Figure 4—figure supplement 5 | 6 |
Additional files
-
MDAR checklist
- https://cdn.elifesciences.org/articles/78902/elife-78902-mdarchecklist1-v2.docx
-
Appendix 2—figure 1—source data 1
Sample image stack and image analysis scripts.
- https://cdn.elifesciences.org/articles/78902/elife-78902-app2-fig1-data1-v2.zip
-
Appendix 2—figure 1—source data 2
List of source image files for all figures.
- https://cdn.elifesciences.org/articles/78902/elife-78902-app2-fig1-data2-v2.zip
Download links
A two-part list of links to download the article, or parts of the article, in various formats.
Downloads (link to download the article as PDF)
Open citations (links to open the citations from this article in various online reference manager services)
Cite this article (links to download the citations from this article in formats compatible with various reference manager tools)
A timer gene network is spatially regulated by the terminal system in the Drosophila embryo
eLife 11:e78902.
https://doi.org/10.7554/eLife.78902


