A neurogenic signature involving monoamine Oxidase-A controls human thermogenic adipose tissue development
- Morningside Graduate School of Biomedical Sciences, University of Massachusetts Medical School, United States
- Program in Molecular Medicine, University of Massachusetts Medical School, United States
- Department of Surgery, University of Massachusetts Medical School, United States
- Diabetes Center of Excellence, University of Massachusetts Medical Center, United States
Figures
Figure 1 with 1 supplement
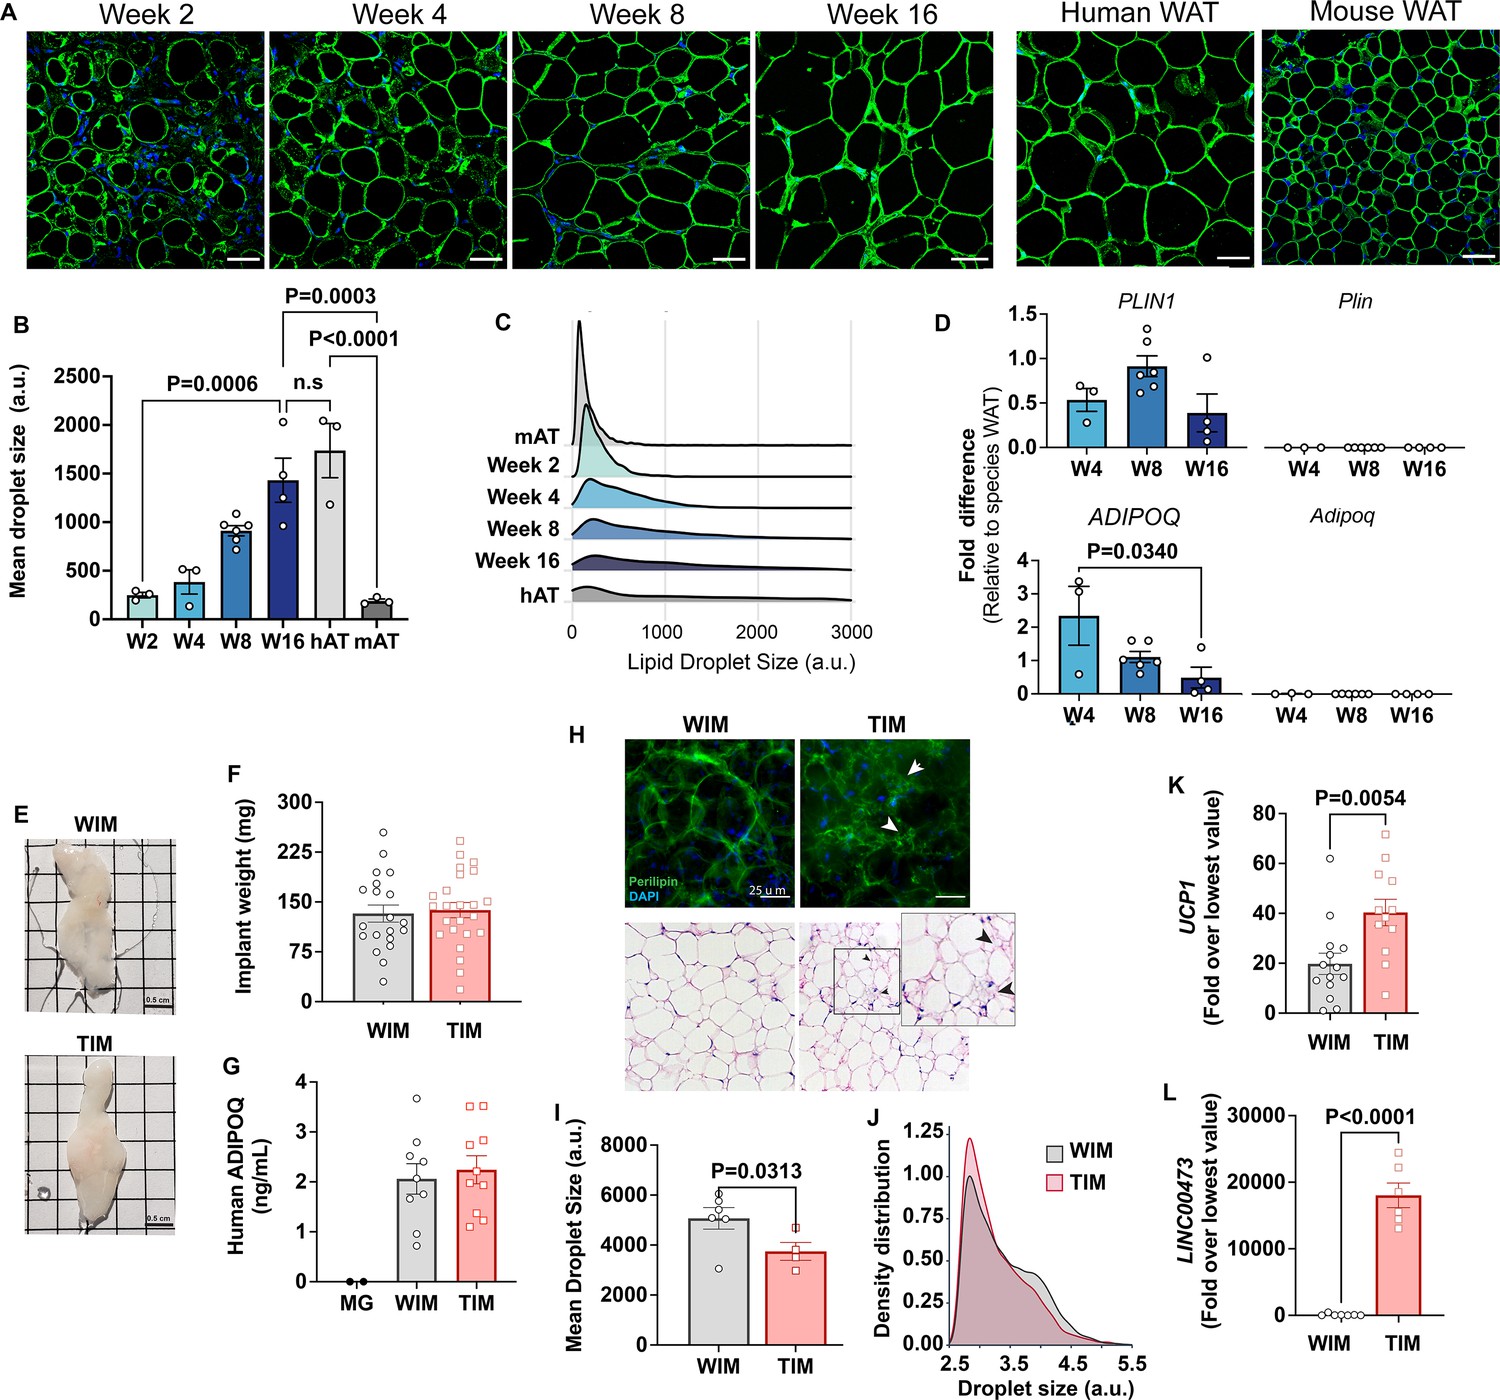
Characteristics of adipocytes during development of WIM and TIM.
(A) Representative images of PLIN1 (green) and DAPI (blue) staining of WIM at the indicated weeks after implantation, and of inguinal mouse and subcutaneous human adipose tissue, scale bar = 50 µm. (B) Quantification of droplet size of PLIN1-stained implants and tissues. Each symbol represents the mean area of all cells within three random fields of a single implant or tissue section. Bars represent the means and SEM of n=3 n=3, n=6, n=4, implants at weeks 2, 4, 8, and 16 respectively, and n=3 for independent human or mouse adipose tissue samples. Statistical significance of the differences between samples was calculated using one-way ANOVA with Tukey’s adjustment for multiple comparisons, and exact p-values are shown. (C) Density distribution plot of droplet size of developing implants and control tissue. Each density distribution represents the combined density of all samples for each group (n=3–6). (D) RT-PCR of excised implants using species- specific probes for genes indicated. Values were normalized to those obtained from human or mouse adipose tissue samples exemplified in A. Symbols are the means of technical duplicates for each implant, and bars are the means and SEM of n=3, n=6 and n=4 implants at weeks 4, 8, and 16, respectively. Statistical significance of the differences between samples was calculated using one-way ANOVA with Tukey’s adjustment for multiple comparisons, and exact p-values are shown. (E) Representative images of white implants (WIM) and thermogenic implants (TIM) at 8 weeks of development, grid size = 0.5 cm. (F) Weight in mg of each excised implant from bi-laterally implanted mice. Bars are the mean and SEM of n=20 and n=24 implants for WIM and TIM, respectively. (G) Circulating human-specific adiponectin (ng/ml) from bilaterally implanted mice. Symbols are the mean of technical duplicates for n=2, n=9, and n=10 mice implanted with Matrigel alone (MG), WIM or TIM, respectively. (H) Whole mounts of WIM and TIM at 8 weeks after implantation stained for PLIN1 (top panels), or with H&E. Arrowheads highlight clusters of dense, multilocular droplets in TIM. (I) Mean droplet size (arbitrary units) in WIM and TIM. Symbol represent the mean areas of all cells from two independent sections from each implant. Bars represent the mean and SEM of n=6 and n=4 WIM and TIM implants, respectively. Statistical significance of the difference was calculated using unpaired, one-tailed Student t-test and resulting p-value is shown. (J) Density distribution plot of droplet size of WIM and TIM. Each density distribution represents the average density of all samples for each group. (K, L) RT-PCR of excised implants using human-specific probes for the genes indicated. Symbols are the means of technical duplicates for each implant, and bars are the means and SEM of n=14 and n=12 for UCP1, and n=7 and n=6 for LINC00473, in WIM and TIM, respectively. Values were normalized to the lowest expression level in the entire data set of n=26 implants. Statistical significance of the differences was calculated using unpaired, two-tailed Student t-tests, and exact p-values are shown.
Figure 1—figure supplement 1
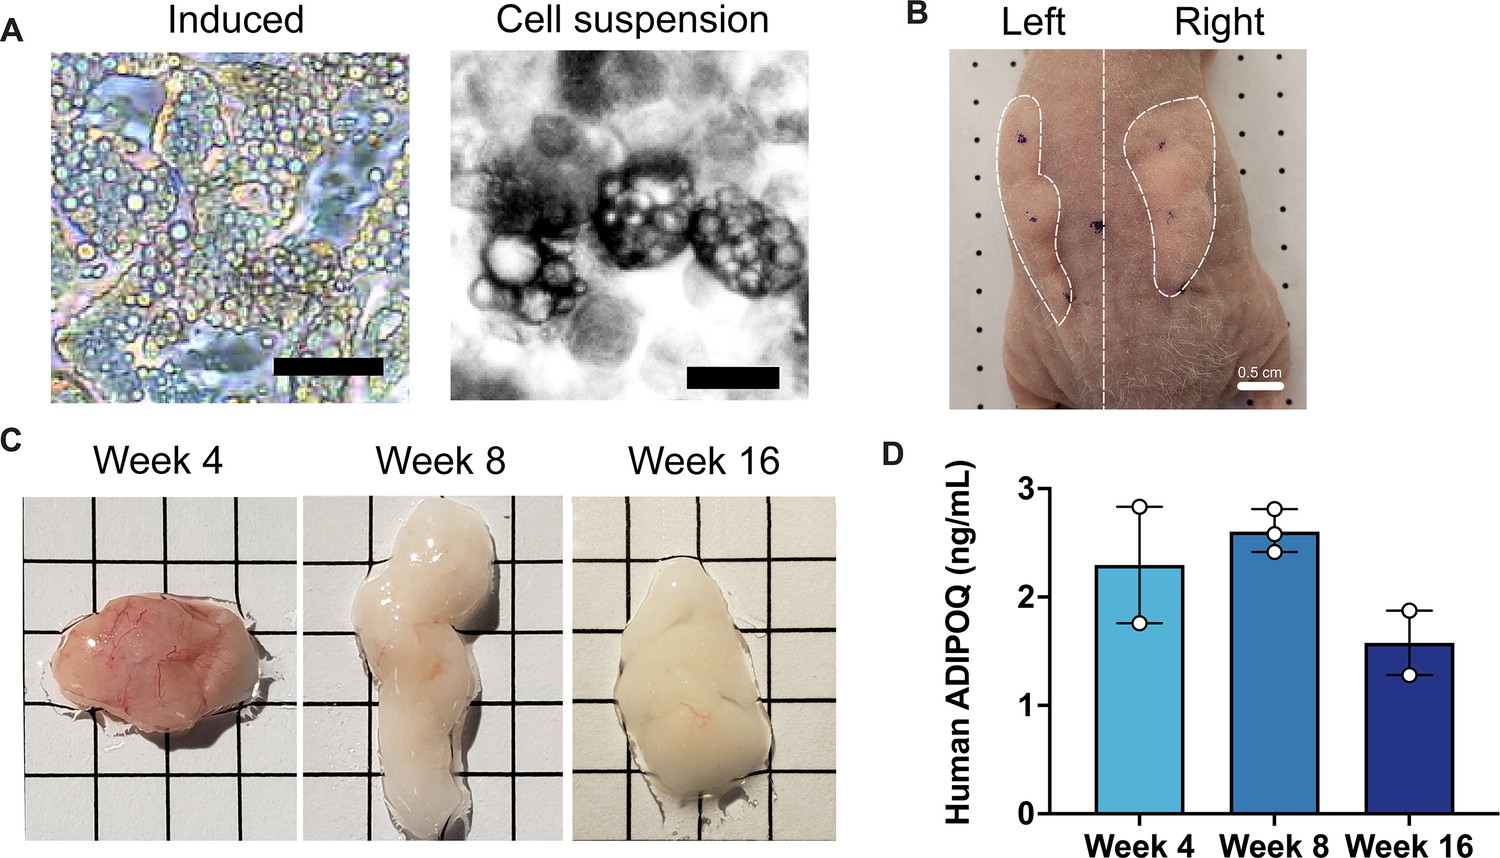
Development of implants from cultured adipocytes in mice.
(A) Representative images of differentiated adipocytes and single cell suspension used for implantation, scale bar = 25 µm. (B) Representative image of bilateral flank implantation, scalebar = 0.5 cm. (C) Excised implants at 4, 8, and 16 weeks of development, grid size = 0.5 cm. (D) Circulating human adiponectin at indicated weeks after implantation. Symbols represent the mean of technical duplicates for each individual mouse, bars represent the mean and range of n=2, n=3, and n=2 mice for weeks 4, 8, and 16, respectively.
Figure 2 with 1 supplement
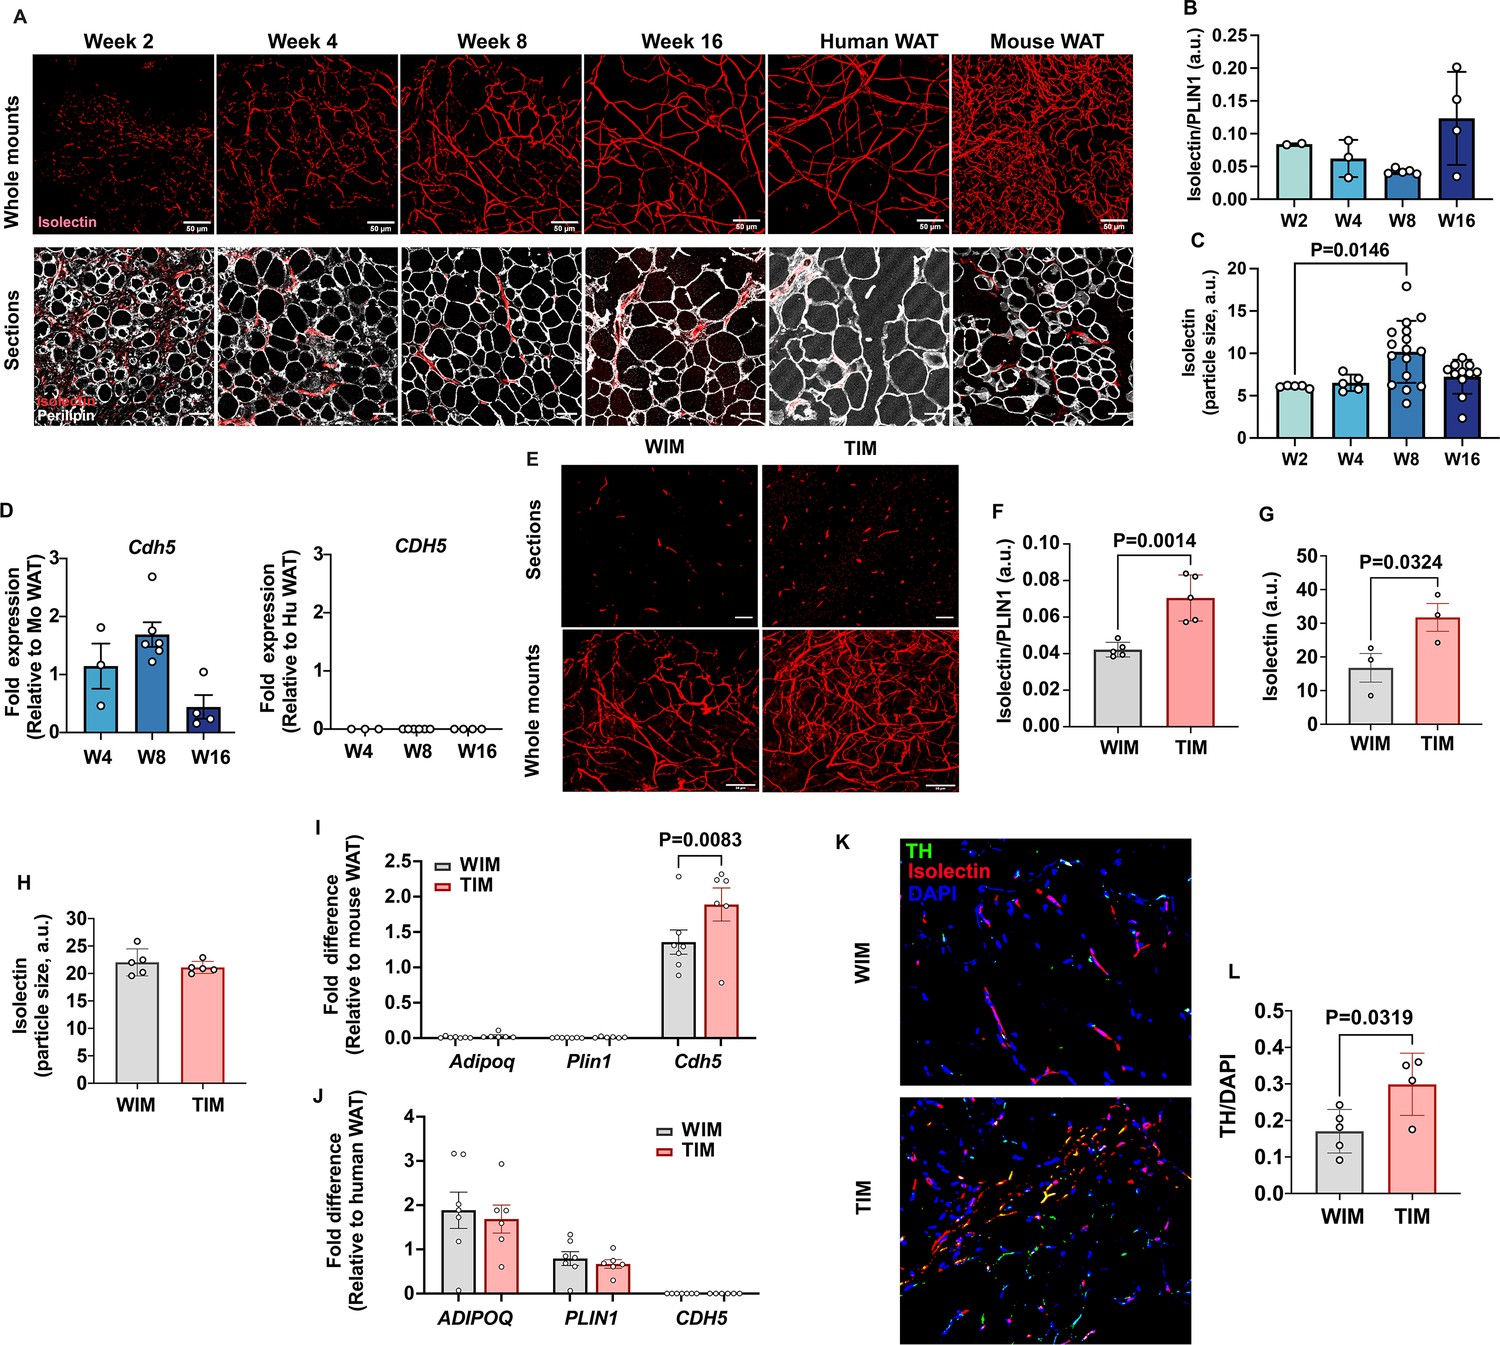
Vascular development of WIM and TIM.
(A) Representative images of isolectin staining of WIM at the indicated weeks after implantation, and of inguinal mouse and subcutaneous human adipose tissue, scale bar = 50 µm. (B) Total isolectin staining in implants. Each symbol represents the sum of the areas of particles stained by isolectin, normalized to the total area stained by Plin1, of three random fields from a single implant. Bars represent the means and SEM of n=2, n=3, n=5, n=4, implants at weeks 2, 4, 8, and 16, respectively. C. Mean size of isolectin-stained particles. Each symbol represents the mean area of particles stained by isolectin in three random fields per implant. Bars represent the means and SEM of n=5, n=5, n=16, n=11, implants at weeks 2, 4, 8, and 16, respectively. Significance of the differences between samples was calculated using one-way ANOVA with Tukey’s adjustment for multiple comparisons, and exact P-values are shown. (D) RT-PCR of excised implants using species-specific probes for CDH5/Cdh5. Values were normalized to those obtained from mouse adipose tissue samples. Symbols are the means of technical duplicates for each implant, and bars are the means and SEM of n=3, n=6, and n=4 implants at weeks 4, 8, and 16 respectively. (E) Representative images of thin sections (upper panels) and whole mounts (lower panels) of WIM and TIM after 8 weeks of implantation, stained with isolectin. (F, G) Total isolectin staining of thin sections and whole mounts, assessed as in (B). Bars represent the means and SEM of n=5, implants for thin sections, and n=3 for whole mounts of WIM and IM, respectively. Significance of the differences between samples was calculated using unpaired two-tailed Student t-tests. (H) Mean size of isolectin-stained particles in WIM and TIM, analyzed as in (C). Bars represent the means and SEM of n=5, implants. (I, J) RT-PCR of excised implants using mouse-specific (I) and human-specific (J) probes for the genes indicated. Values were normalized to those obtained from mouse and human adipose tissue samples. Symbols are the means of technical duplicates for each implant, and bars are the means and SEM of n=7, and n=6 WIN and TIM implants respectively. Significance of the differences between WIM and TIM for each gene was calculated using one-way ANOVA with the Holm-Sidak adjustment for multiple comparisons, and exact p-values are shown. (K) Representative images of thin sections WIM and TIM after 8 weeks of implantation, stained for isolectin (red), tyrosine hydroxylase (TH, green) and DAPI (blue). (L) Total TH staining, where bars represent the means and SEM of n=5, and n=4 sections of WIM and TIM, respectively. Significance of the differences between samples was calculated using un-paired two-tailed Student t-test and the exact p-value is shown.
Figure 2—figure supplement 1
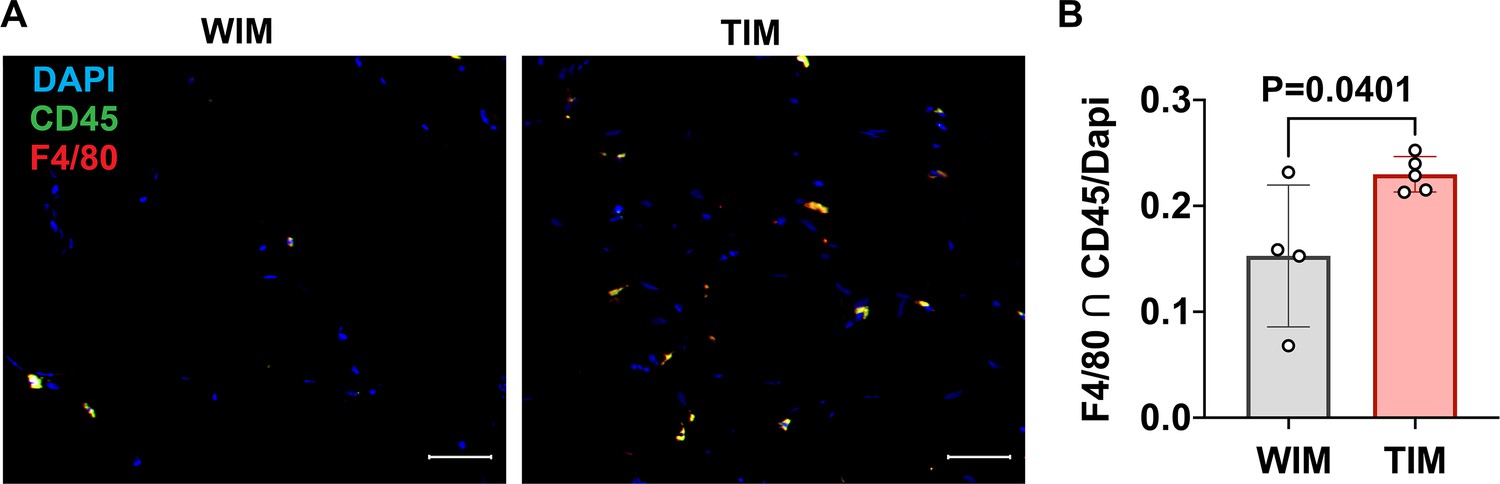
Density of macrophages in WIM and TIM.
(A) Representative images of thin sections WIM and TIM after 8 weeks of implantation, stained for F4/80 (red), CD45 (green) and DAPI (blue). (B) Macrophage staining, where symbols are the mean of three independent sections per implant, and bars represent the means and SEM of n=4 and n=5, WIM and TIM implants, respectively. Data represents the cells stained with both CD45 and F4/80, normalized to DAPI to account for section size. Significance of the differences was calculated using un-paired 2-tailed Student t-test and the exact p-value is shown.
Figure 3

Capacity of thermogenic adipocytes to autonomously maintain their phenotype, and their effect on host adipose depots.
(A) Experimental paradigm for in vitro experiments. (B) Phase images of cultured adipocytes during chronic stimulation and withdrawal. (C) Quantification of droplet size, where symbols are the mean and SEM of all droplets in single images from each of n=3 independent culture wells. (D, E) RT-PCR with human-specific probes for UCP1 (D) and LINC00473 (E), where symbols are the mean and error bars the SEM of n=3 independent culture wells assayed in technical duplicate. Values are expressed as the fold difference relative to the lowest value in the dataset. For (C), (D) and (E), statistical significance of differences at each time point between the withdrawal and the non-induced group, was measured using two-way ANOVA with Dunnet’s multiple comparison test, and exact p-values are shown. (F) Weight of excised inguinal (iWAT) and interscapular (iBAT) after 8 weeks of implantation with WIM or TIM. Symbols correspond to the summed weight of two inguinal or the single interscapular pad per mouse and bars the mean and SEM of n=7 mice. (G) Representative images of excised fat pads. Top panels, iWAT; bottom panels iBAT. H. RT-PCR of Ucp1, where each symbol is the mean of technical duplicates, and bars represent the mean and SEM of n=6–7 pads. Data are expressed as the fold difference relative to the lowest value in the set, with scales for iWAT and iBAT on the left and right Y axes, respectively. Statistical significance of differences was measured using non-paired, two-tailed Student t-tests and exact P-values are shown.
Figure 4

Distinct gene expression signatures of adipocytes and stromal cells in WIM and TIM.
(A) Overview of analysis paradigm. (B) Dimensional reduction plot of data from Burl et al., 2018, using Uniform Manifold Approximation and Projection (UMAP), where ASC = adipose stem cells, Diff. ASC = differentiating adipose stem cells, VEC = vascular endothelial cells, VSMC = Vascular smooth muscle cells, LYMPH = Lymphocytes, DCs = Dendritic cells, MAC = macrophages, NEUT = Neutrophils, OTHER = unidentified cluster. (C) Predicted proportion of cells present in WIM and TIM. Symbols correspond to data from an individual implant and bars the mean and SEM of n=4 and n=3 WIM and TIM respectively. (D) Volcano plot of genes mapping to the mouse genome which are differentially expressed between WIM and TIM. (E) Pathway (REACTOME) enrichment analysis of mouse genes differentially expressed between WIM and TIM. (F) Mouse genes differentially expressed between WIM and TIM mapped onto the UMAP representation shown in (A), with cells expressing the indicated genes highlighted in red. (G) Volcano plot of genes mapping to the human genome differentially expressed between WIM and TIM. (H,I) Pathway (REACTOME) enrichment analyses of human genes more highly expressed in TIM (H) or WIM (I).
Figure 5
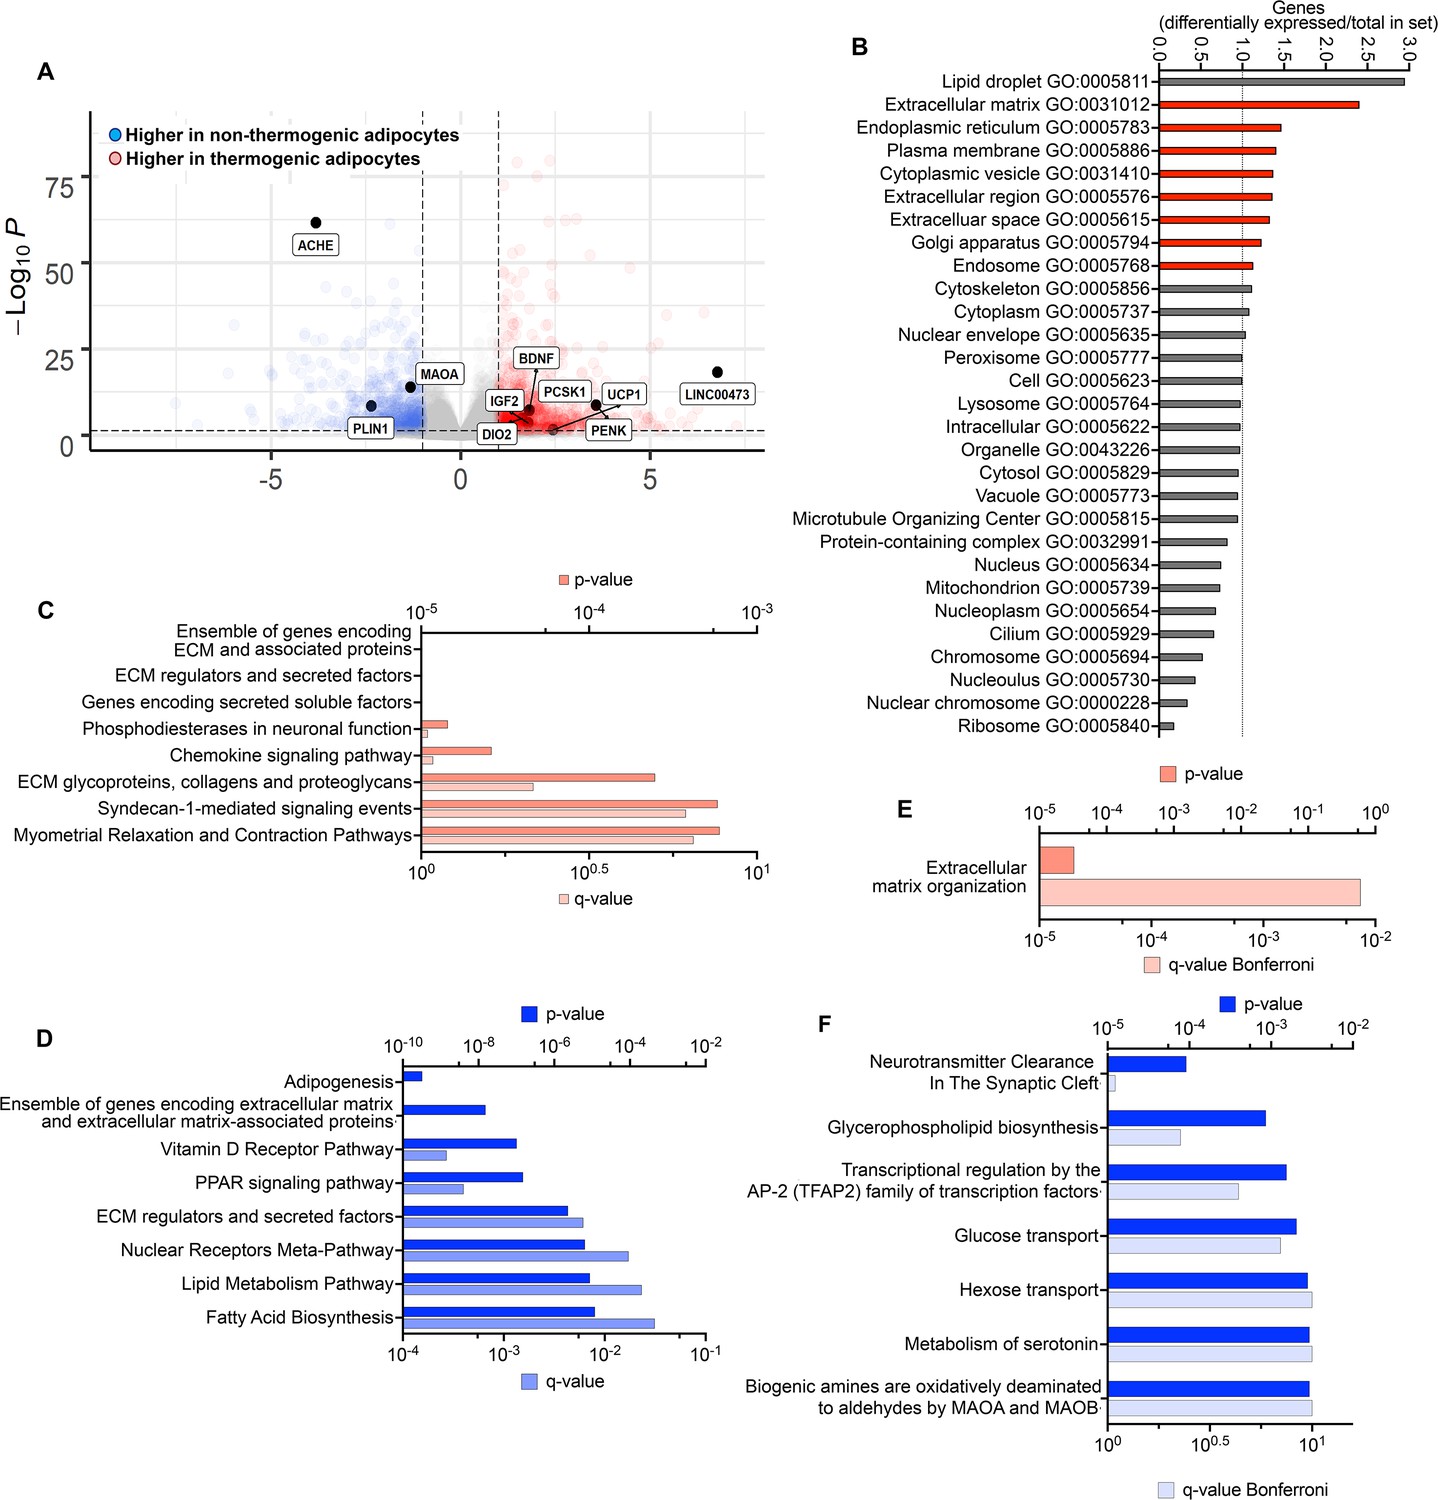
Differentially expressed genes persisting through tissue development.
(A) Volcano plot of genes differentially expressed between non-thermogenic and thermogenic adipocytes prior to implantation. Highlighted are selected genes characteristic of human thermogenic adipocytes and genes involved in the control of neurotransmission. (B) Enrichment of GO categories by genes differentially expressed between non-thermogenic and thermogenic adipocytes, with categories for secretory proteins highlighted in red. (C, D) Pathway (REACTOME) enrichment analyses of genes more highly expressed in thermogenic (C) or non-thermogenic (D) adipocytes. E. Pathway analysis of genes more highly expressed in thermogenic adipocytes that remained more highly expressed in TIM. F. Pathway analysis of genes more highly expressed in non-thermogenic adipocytes that remained more highly expressed in WIM.
Figure 6 with 1 supplement
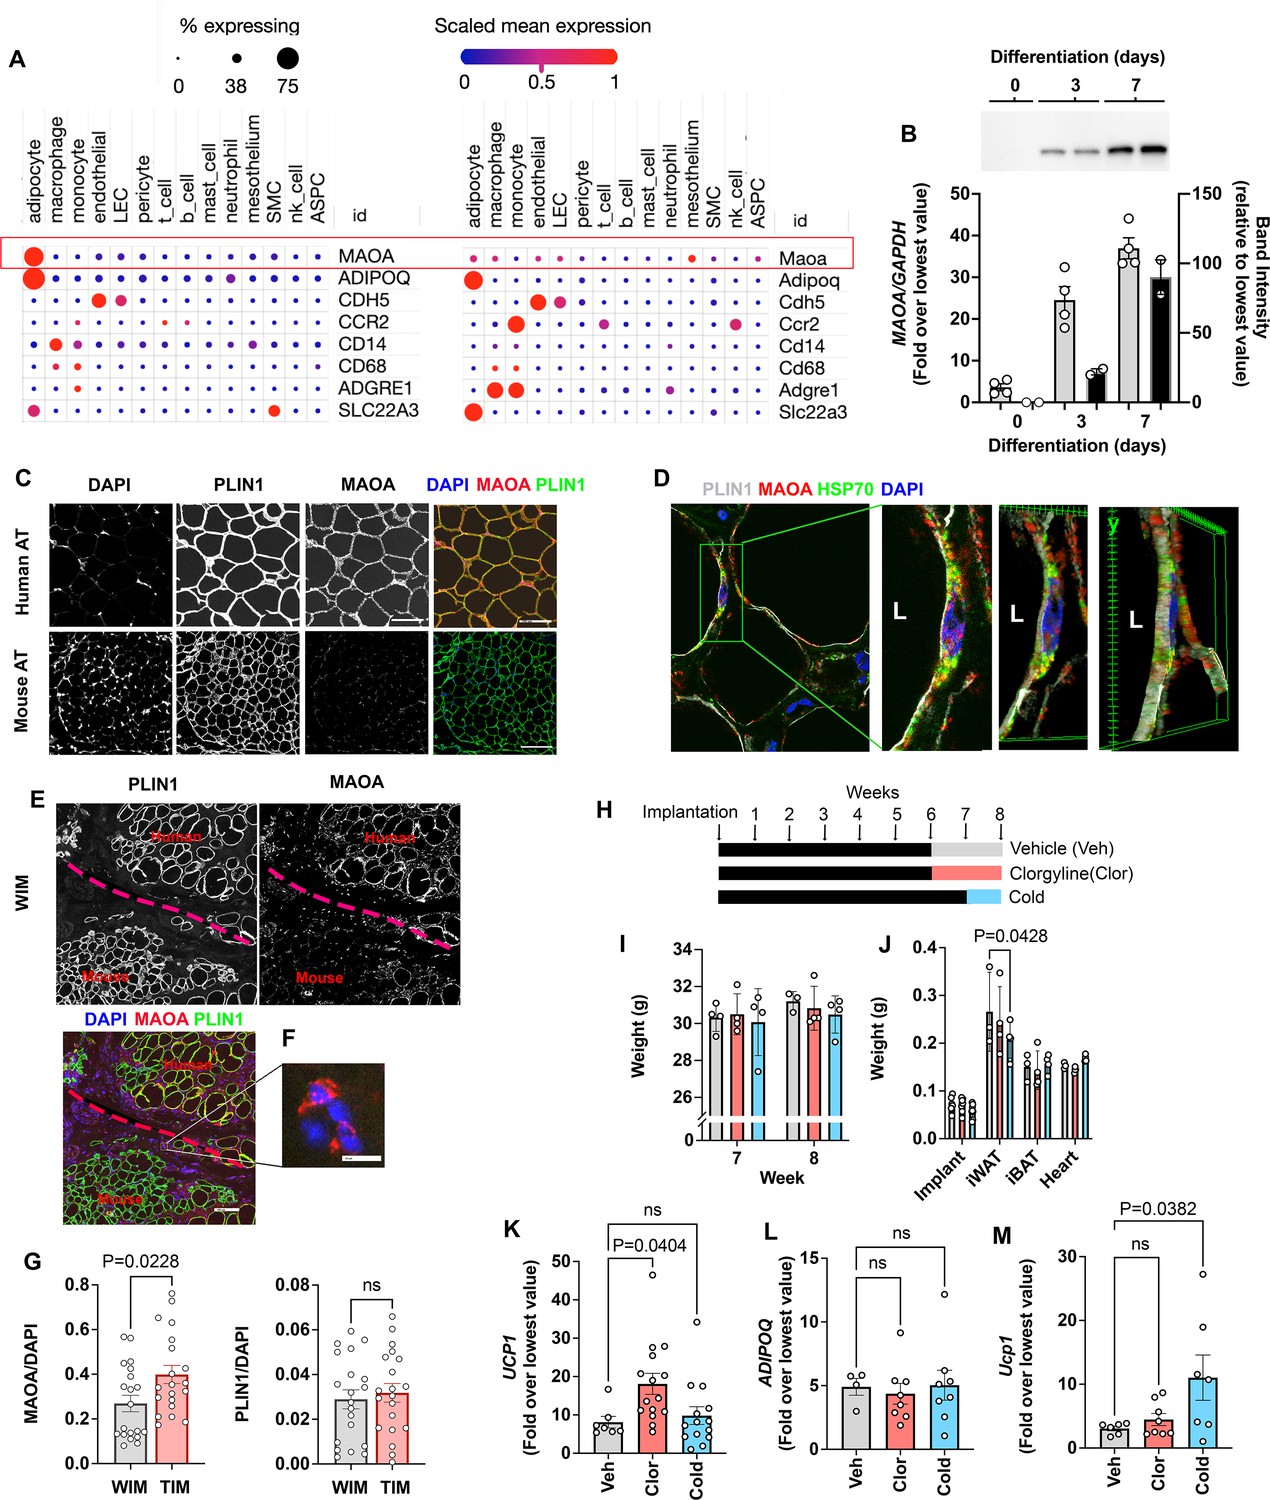
Species specific expression of MAOA in adipocytes.
(A) Dot plots of indicated genes generated using data from Emont et al., 2022, available here (B) RT-PCR and western blotting at indicated days following induction of differentiation in human adipocytes. Samples were prepared from two independent wells and subjected to western blotting with an antibody to MAOA that recognizes the mouse and human proteins (CellSignaling #75330). The intensity of the single detected band was quantified, and values plotted in the right Y axis. RT-PCR results are plotted in the left Y axis. Symbols represent the fold difference over the lowest value in the dataset and bars the mean and SEM of n=4 independent cultures. (C) Representative images of human and mouse subcutaneous adipose tissue stained with antibodies to MAOA (CellSignaling #75330 for mouse, CellSignaling #73030 for human), and PLIN1, and counterstained with DAPI. Bars = 100 um. (D) Confocal images of human adipose tissue stained with antibodies to PLIN1, MAOA (CellSignaling #73030), and mtHSP70 and counterstained with DAPI. Projection of 15 images taken at 0.5 µm intervals (bar=10 um) and indicated segment in 3D projections illustrating localization of nucleus, mitochondria and MAOA to the region between the lipid droplet and the cell periphery (bars = 3 um). (E) WIM and vicinal mouse adipose tissue, stained for PLIN1, MAOA (CellSignaling #75330), and DAPI, with red dotted line indicating boundary between hybrid tissue and endogenous adipose tissue. Bar = 100um. (F) Immune cell showing staining for MAOA. Bar = 10 µm. (G) Intensity of MAOA (left panel) and PLIN1 (right panel) relative to DAPI in 5 independently analyzed regions from each of n=4 WIM and n=4 TIM thin sections, as described in Materials and methods. Statistical significance of the differences was assessed using two-tailed student t-tests, and exact values are shown. (H) Experimental timeline for exposure on mice harboring WIM to clorgyline or cold. (I) Weight of mice at 7- and 8 weeks (J) Weights of dissected tissues at 8 weeks. (K) RT-PCR for human UCP1. (L) RT-PCR for human ADIPOQ. For (K and L), bars represent the mean and S.E.M and symbols correspond to each independent implant (n=7–8 implants). M. RT-PCR for mouse Ucp1 in excised inguinal adipose tissue (n=7–8 fat pads). Bars represent the mean and S.E.M and symbols correspond to each independent fat pad. (I-M) Statistical significance of the differences was assessed using one-way ANOVA with Dunett’s multiple comparison correction, and exact values are shown.
-
Figure 6—source data 1
Uncropped, labeled western blot.
- https://cdn.elifesciences.org/articles/78945/elife-78945-fig6-data1-v3.zip
Figure 6—figure supplement 1
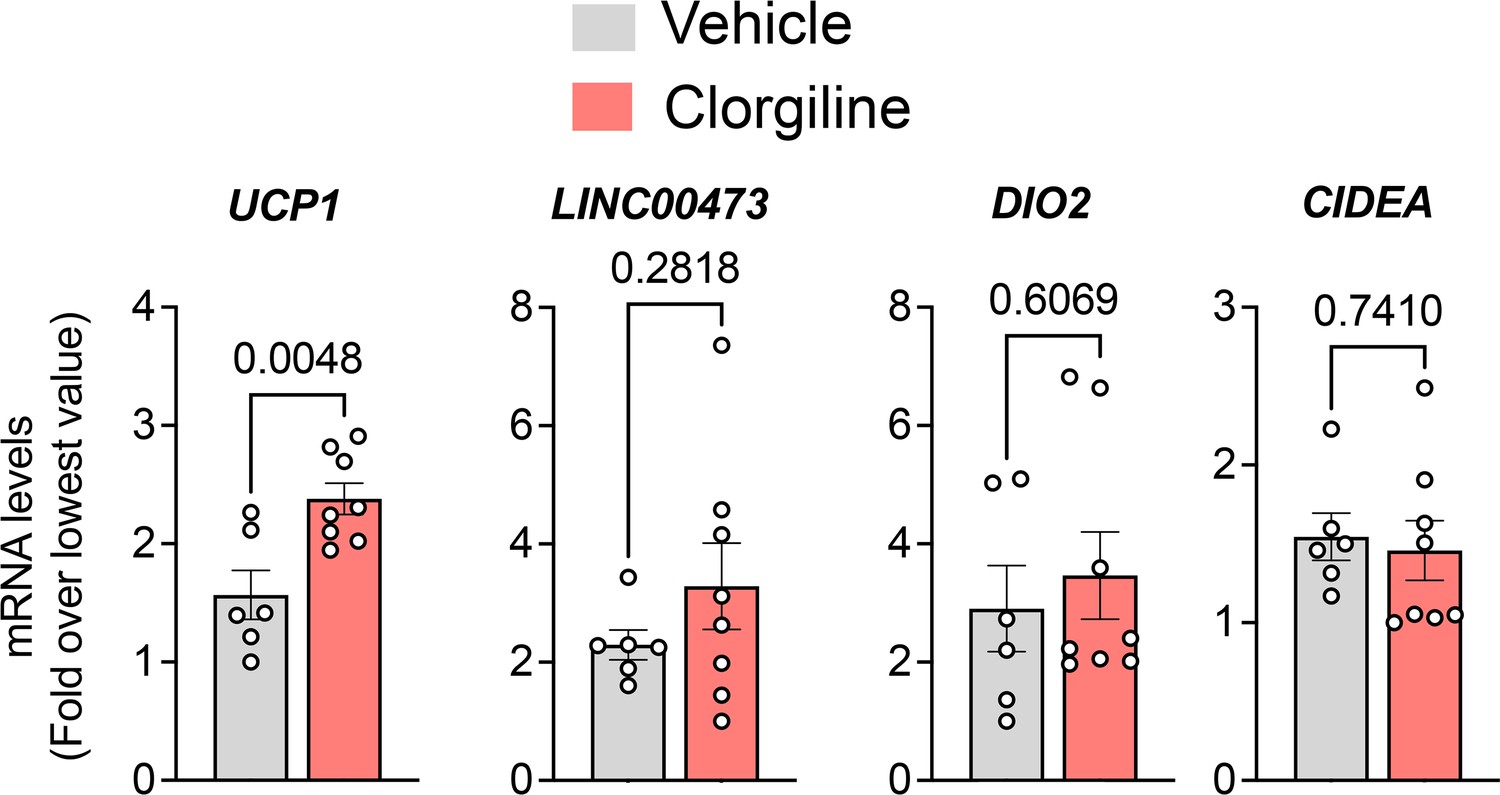
RT-PCR for additional thermogenic genes.
Bars represent the mean and S.E.M and symbols correspond to each measurement from n=3–4 implants assayed in duplicate.
Tables
Key resources table
| Reagent type (species) or resource | Designation | Source or reference | Identifiers | Additional information |
|---|---|---|---|---|
| Cell line (Homo sapiens) | Adipose tissue progenitor cell | Corvera Laboratory | Mesenchymal progenitor cells | Cells used in this paper are generated from small fragments of surgically excised male or female human adipose tissue cultured in MatriGel, in the presence of normocin, penicillin and streptomycin. Cultures are recovered using dispase, expanded by two passages using trypsin, and frozen. Cells are then thawed and used for in experiments with no further passaging. Cells are not transformed, nor cultured beyond three passages and are therefore not routinely tested for mycoplasma nor subject to further authentication. Adipose tissue from which the primary cells are derived is obtained in accordance with the UMass Chan Institutional Review Board IRB ID 14734_13 |
| Antibody | Anti-Perilipin-1 (Rabbit monoclonal) | Cell Signalling | #9349 | IF(1:500), |
| Antibody | Anti-MAOA (Rabbit monoclonal) | Cell Signalling | #73030 | IF(1:500) WB (1:500) |
| Antibody | Anti-MAOA (Rabbit monoclonal) | Cell Signalling | #75330 | IF(1:500) WB (1:500) |
| Antibody | Anti-Tyrosine hydroxylase (Rabbit polyclonal) | Millipore Sigma | #AB152 | IF (1:500) |
| Antibody | Anti-CD45 (Mouse monoclonal) | Abcam | #282747 | IF (1:500) |
| Antibody | Anti-F4/80 (Rat monoclonal) | Abcam | #6640 | IF (1:500) |
| Commercial assay, kit | Adiponectin ELISA | Invitrogen | #KHP0041 | Serum diluted 1:50 |
| Other | Isolectin GS-IB4 AlexaFluor-647 conjugate | Invitrogen | #I32450 | Staining, 1:200 |
| Other | Ulex Europaeus Agglutinin I DyLight 594 | Vector Laboratories | #DL-1067–1 | Staining, 1:200 |
| Other | DAPI stain | Invitrogen | #D1306 | Counterstaining 1 µg/mL |
Additional files
-
Supplementary file 1
Top 50 Differentially expressed mouse genes between WIM and TIM.
- https://cdn.elifesciences.org/articles/78945/elife-78945-supp1-v3.xlsx
-
Supplementary file 2
Differential expression of human genes between WIM and TIM.
- https://cdn.elifesciences.org/articles/78945/elife-78945-supp2-v3.xlsx
-
Supplementary file 3
Top 50 genes differentially expressed between non-thermogenic and thermogenic adipocytes prior to implantation.
- https://cdn.elifesciences.org/articles/78945/elife-78945-supp3-v3.xlsx
-
Supplementary file 4
Genes differentially expressed between non-thermogenic and thermogenic adipocytes that are maintained differentially expressed in WIM and TIM.
- https://cdn.elifesciences.org/articles/78945/elife-78945-supp4-v3.xlsx
-
Transparent reporting form
- https://cdn.elifesciences.org/articles/78945/elife-78945-transrepform1-v3.docx
Download links
A two-part list of links to download the article, or parts of the article, in various formats.
Downloads (link to download the article as PDF)
Open citations (links to open the citations from this article in various online reference manager services)
Cite this article (links to download the citations from this article in formats compatible with various reference manager tools)
A neurogenic signature involving monoamine Oxidase-A controls human thermogenic adipose tissue development
eLife 11:e78945.
https://doi.org/10.7554/eLife.78945


