Conformational fingerprinting of allosteric modulators in metabotropic glutamate receptor 2
- Department of Molecular Biosciences, Northwestern University, United States
Figures
Figure 1 with 3 supplements
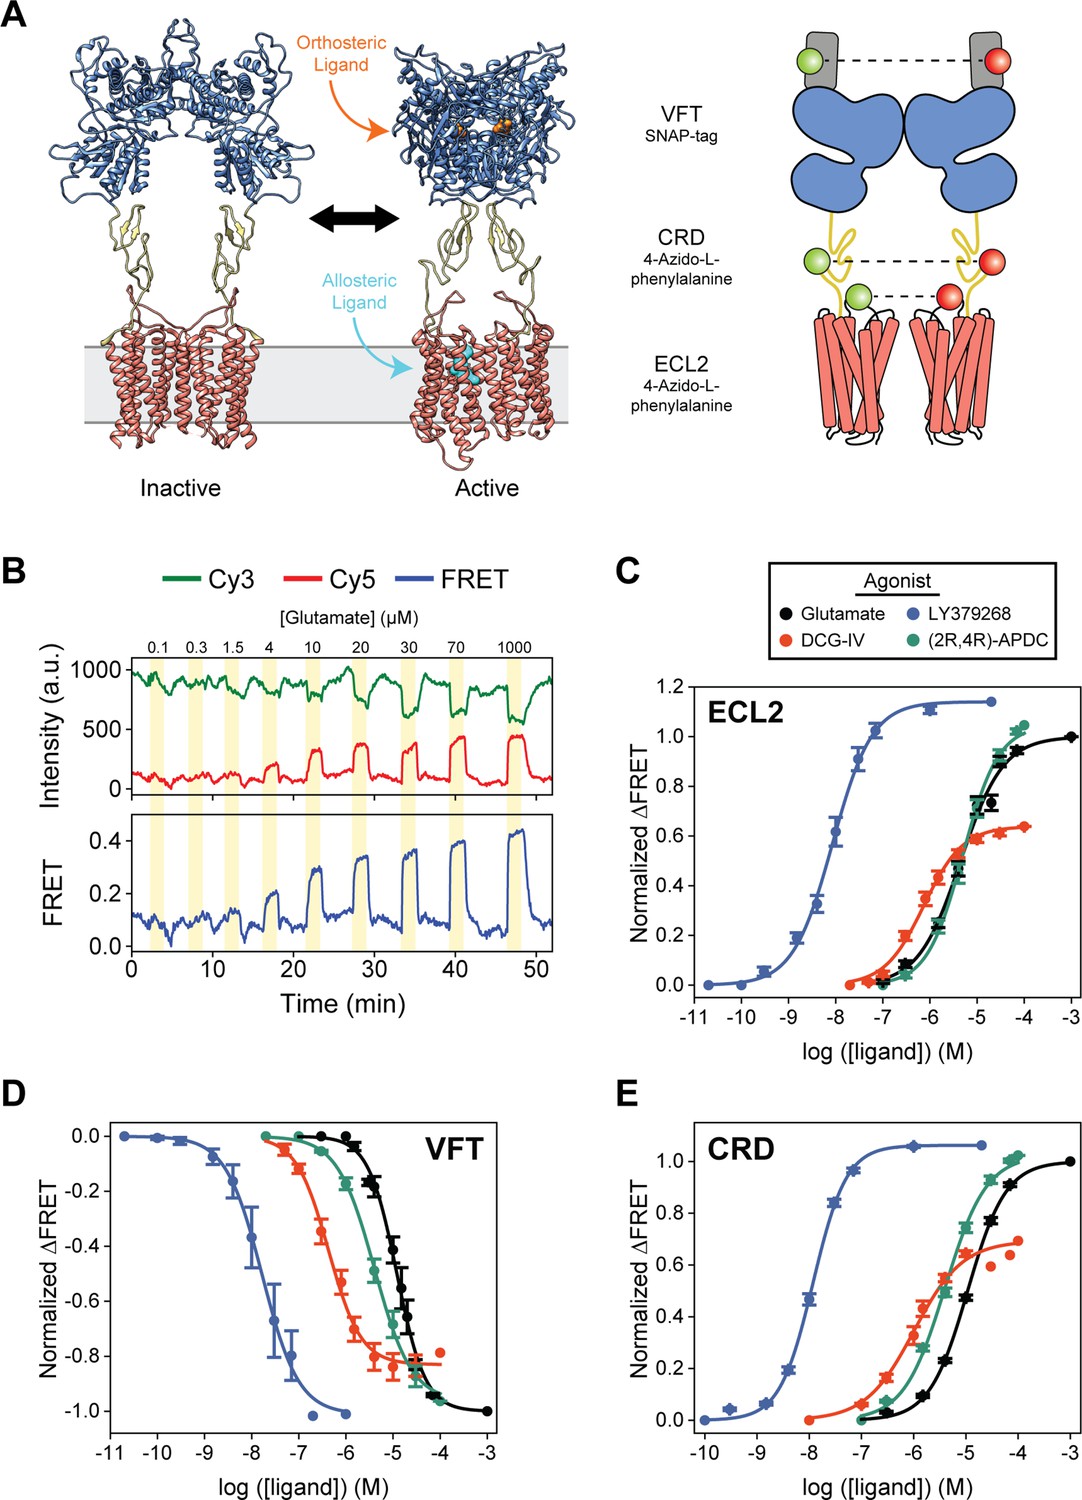
Agonist-induced structural change measured at each domain using conformational fluorescence resonance energy transfer (FRET) sensors.
(A) Full-length cryo-EM structures of inactive (7EPA) and fully active (7E9G) metabotropic glutamate receptor 2 (mGluR2; human) and schematic illustrating fluorophore placement for each inter-domain sensor. (B) Representative normalized live-cell FRET trace from glutamate titration experiment on HEK293T cells expressing azi-extracellular loop 2 (azi-ECL2). Data was acquired at 4.5 s time resolution. Dose-response curves from live-cell FRET orthosteric agonist titration experiments using (C) azi-ECL2, (D) N-terminal SNAP-tag labeled mGluR2 (SNAP-m2), and (E) azi-cysteine-rich domain (azi-CRD). Data is acquired from individual cells and normalized to 1 mM glutamate response. Data represents mean ± SEM of responses from individual cells from at least three independent experiments. Total number of cells examined, mean half-maximum effective concentration (EC50), mean max response, and errors are listed in Tables 1–2.
-
Figure 1—source data 1
Source data for Figure 1.
- https://cdn.elifesciences.org/articles/78982/elife-78982-fig1-data1-v2.xlsx
Figure 1—figure supplement 1
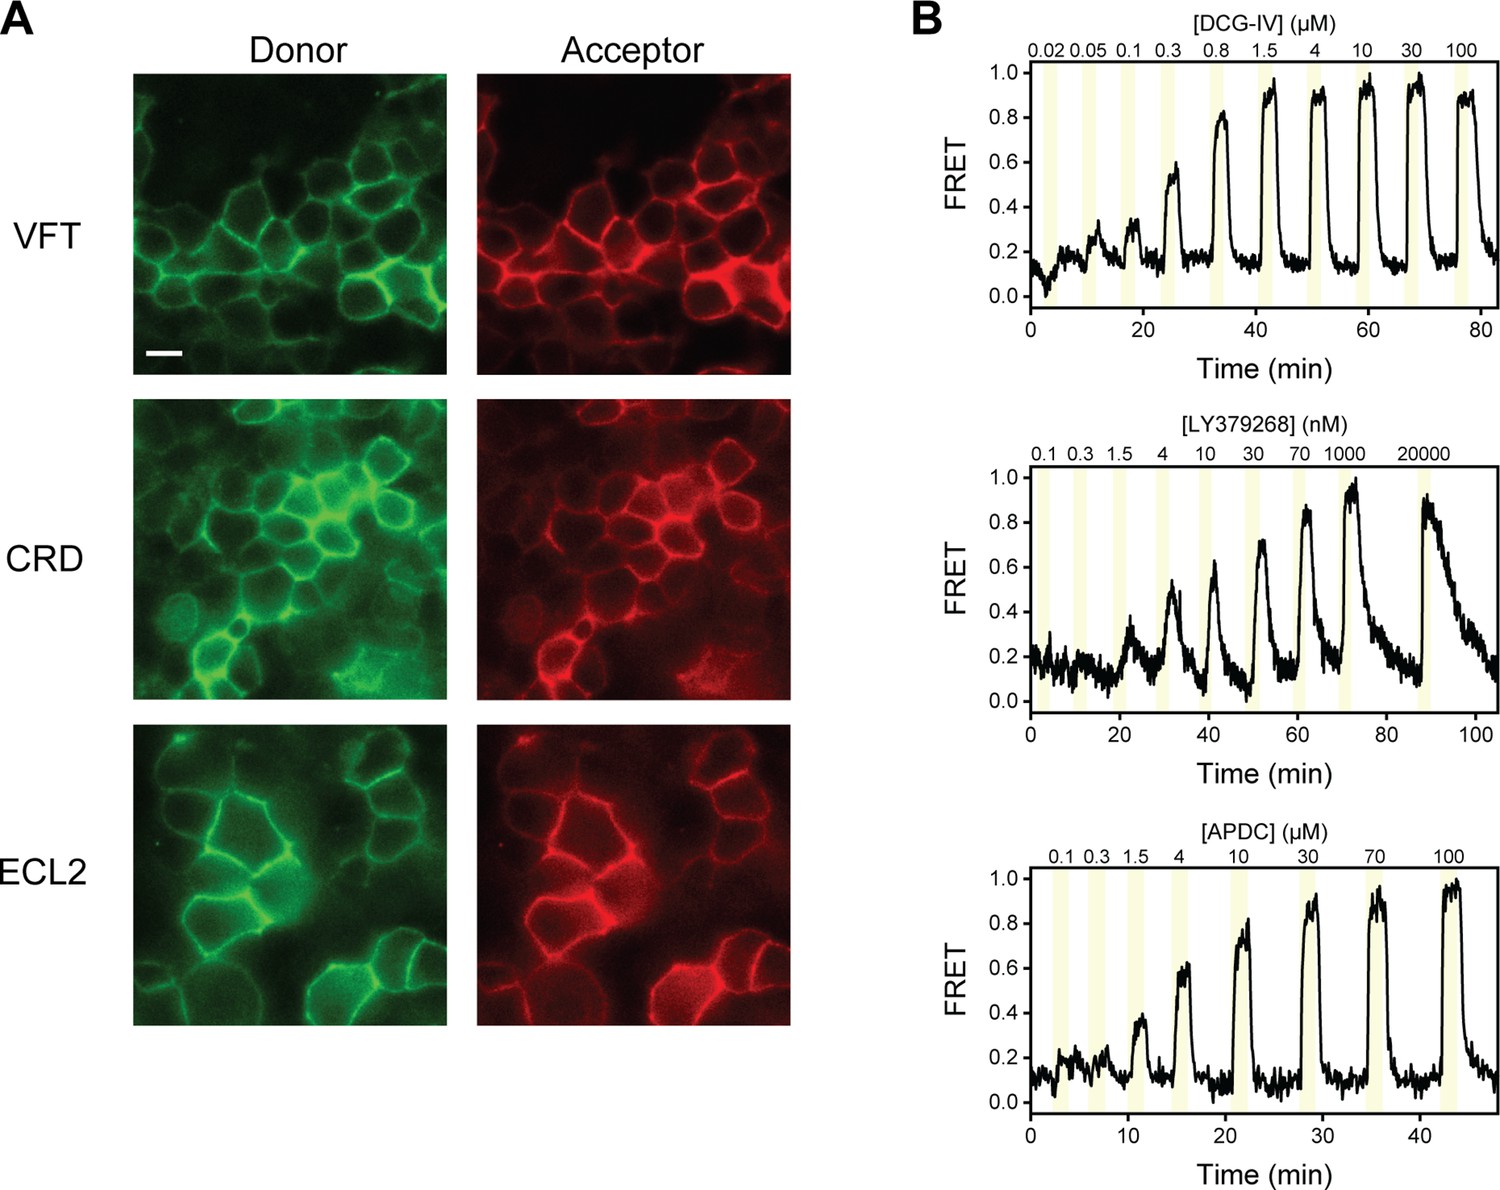
Representative images and fluorescence resonance energy transfer (FRET) traces from live-cell FRET experiments.
(A) Representative image of HEK293T cells expressing N-terminal SNAP-tag labeled metabotropic glutamate receptor 2 (SNAP-m2), azi-cysteine-rich domain (azi-CRD), or azi-extracellular loop 2 (azi-ECL2) labeled with donor (left) and acceptor (right) fluorophores used for live-cell FRET experiments. Scale bar, 10 μM. (B) Representative normalized live-cell FRET traces of DCG-IV, LY379268, and (2R,4R)-APDC titration experiments on HEK293T cells expressing azi-ECL2. Data was acquired at 4.5 s time resolution.
Figure 1—figure supplement 2
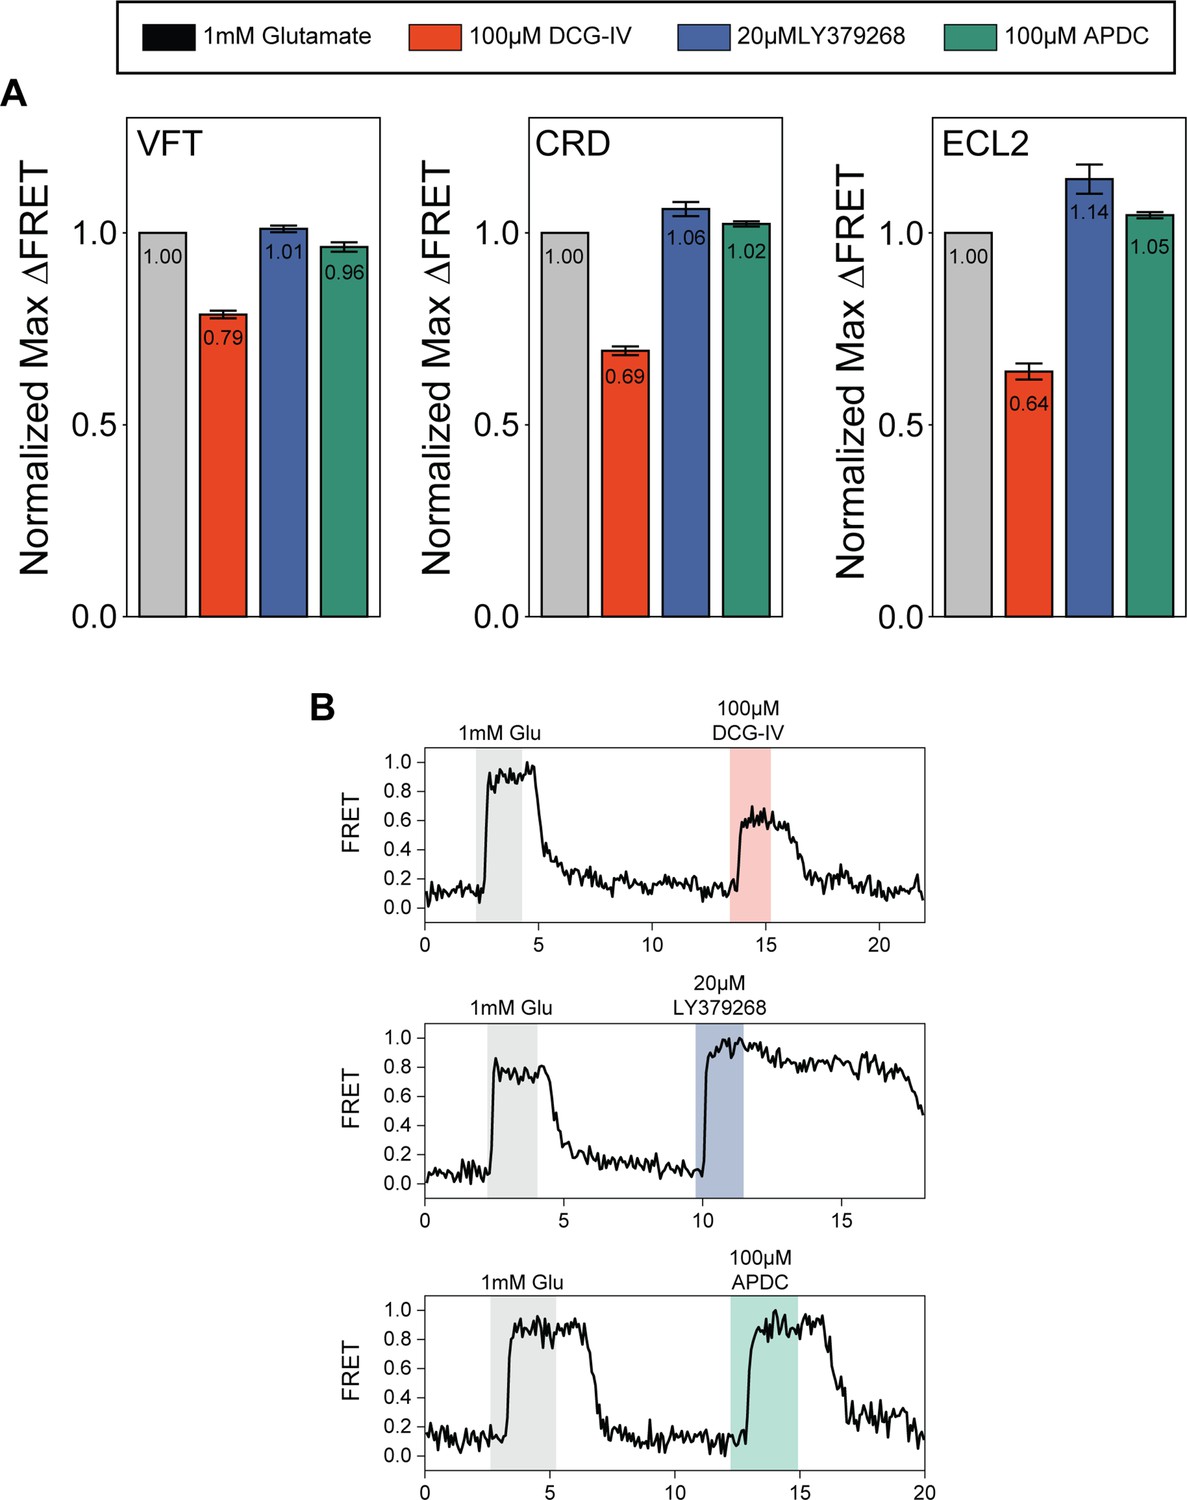
Quantification of orthosteric agonist efficacy.
(A) Normalized maximal agonist-induced fluorescence resonance energy transfer (FRET) change for metabotropic glutamate receptor 2 (mGluR2) N-terminal SNAP-tag (SNAP-m2), azi-cysteine-rich domain (azi-CRD), and azi-extracellular loop 2 (azi-ECL2) sensors. Data represents mean ± SEM of responses from individual cells from at least three independent experiments. Total number of cells examined for normalization experiments, mean max response, and errors are listed in Table 2. (B) Representative normalized live-cell FRET traces from DCG-IV, LY379268, and (2R,4R)-APDC normalization experiments of azi-ECL2. Data is normalized to 1 mM glutamate response and collected at 4.5 s time resolution.
Figure 1—figure supplement 3

Orthosteric agonists examined by functional calcium imaging.
(A) Dose-response curves for metabotropic glutamate receptor 2 (mGluR2)-induced calcium flux during orthosteric agonist titrations. (B) Normalized maximal agonist-induced intracellular calcium levels. Glutamate dose-response curves for calcium flux induced by (C) azi-cysteine-rich domain (azi-CRD) and (D) azi-extracellular loop 2 (azi-ECL2). Data is normalized to 1 mM glutamate response. Data represents mean ± SEM of results from three independent experiments.
Figure 2 with 5 supplements
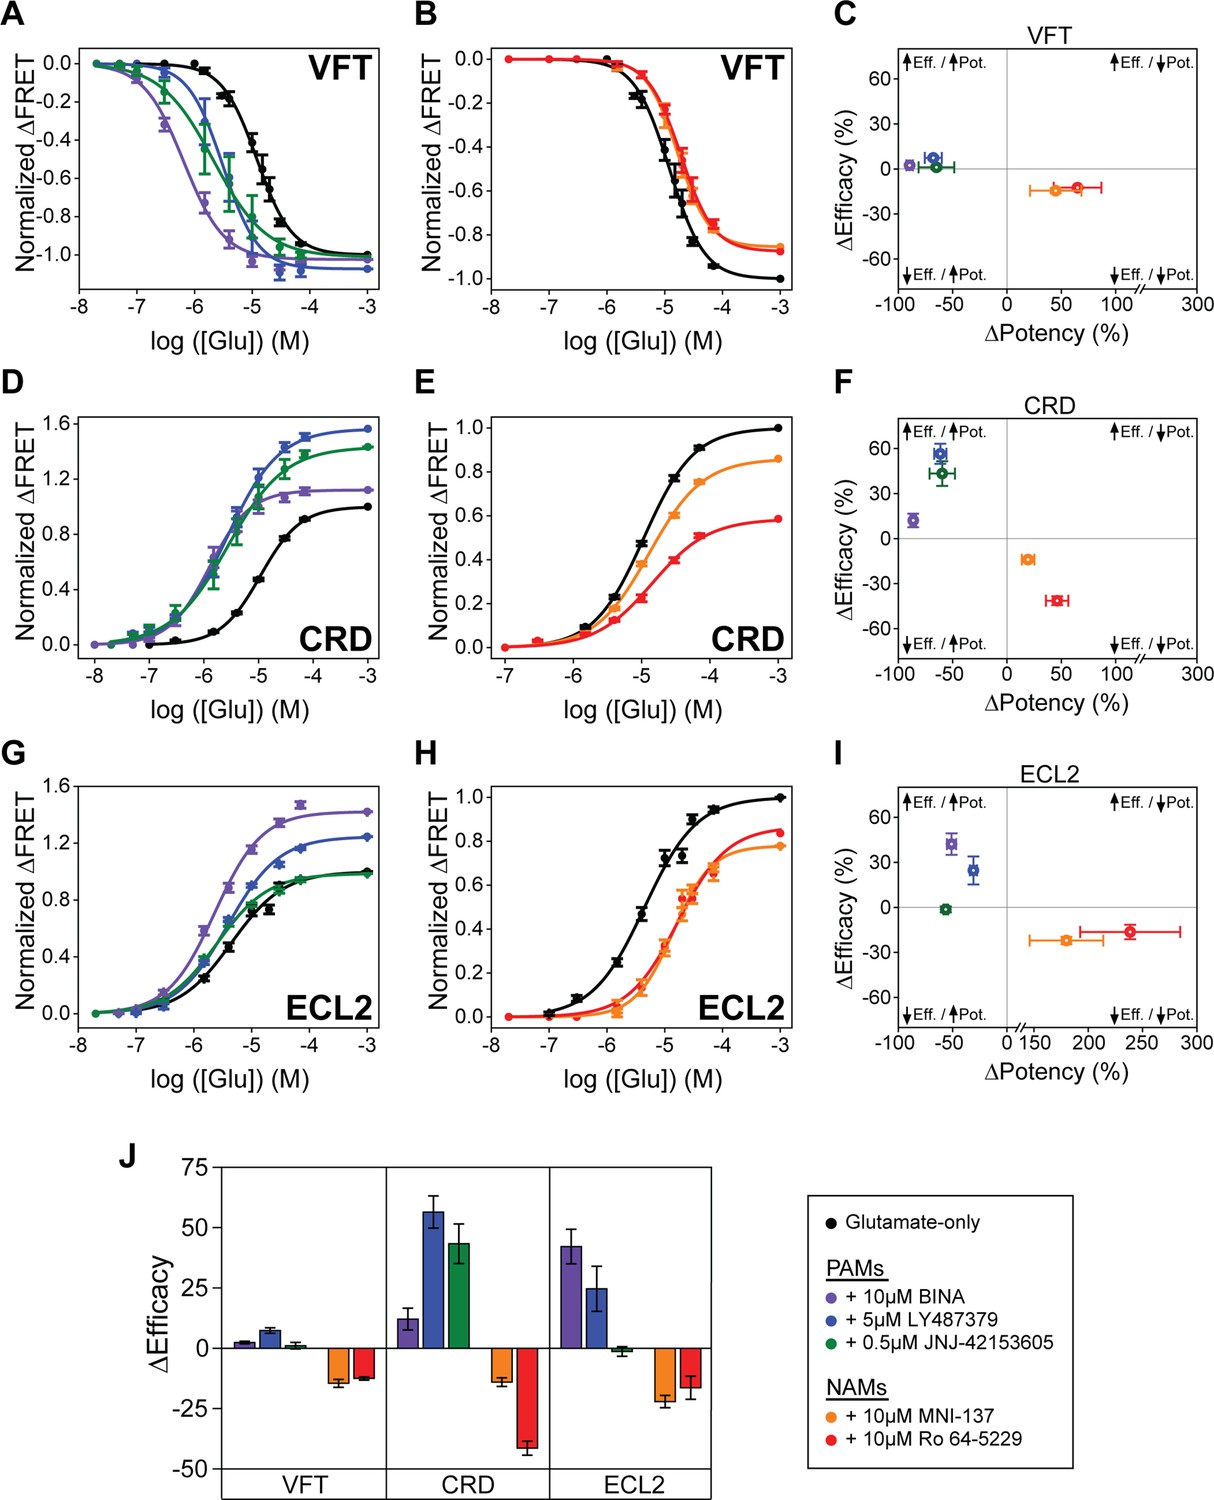
Positive and negative allosteric modulation of metabotropic glutamate receptor 2 (mGluR2) structural domains.
N-terminal SNAP-tag labeled mGluR2; hereafter (SNAP-m2) glutamate dose-response curves in the presence of (A) positive allosteric modulators (PAMs) or (B) NAMs. (C) Changes in glutamate potency and efficacy for SNAP-m2. The azi-cysteine-rich domain (azi-CRD) glutamate dose-response curves in the presence of (D) PAMs or (E) NAMs. (F) Changes in glutamate potency and efficacy for azi-CRD. The azi-extracellular loop 2 (azi-ECL2) glutamate dose-response curves in the presence of (G) PAMs or (H) NAMs. (I) Changes in glutamate potency and efficacy for azi-ECL2. (J) Changes in glutamate efficacy in response to PAMs and NAMs as measured by each conformational sensor. ΔPotency defined as (([modulator + glutamate]EC50 – [glutamate] EC50)/[glutamate] EC50) × 100. ΔEfficacy defined as ([1 mM glutamate + modulator] – [1 mM glutamate]) × 100. Data is acquired from individual cells and normalized to 1 mM glutamate response. Data represents mean ± SEM of responses from individual cells from at least three independent experiments. Total number of cells examined for titration and normalization experiments, mean half-maximum effective concentration (EC50), mean max response, and errors are listed in Tables 1–2.
-
Figure 2—source data 1
Source data for Figure 2.
- https://cdn.elifesciences.org/articles/78982/elife-78982-fig2-data1-v2.xlsx
Figure 2—figure supplement 1

Max normalization of Δ fluorescence resonance energy transfer (ΔFRET) for N-terminal SNAP-tag labeled metabotropic glutamate receptor 2 (SNAP-m2).
(A–E) Representative normalized live-cell FRET traces of SNAP-m2 normalization experiments for all positive and negative allosteric modulators tested. Data was acquired at 4 s time resolution.
Figure 2—figure supplement 2
Max normalization of Δfluorescence resonance energy transfer (ΔFRET) for azi-cysteine-rich domain (azi-CRD).
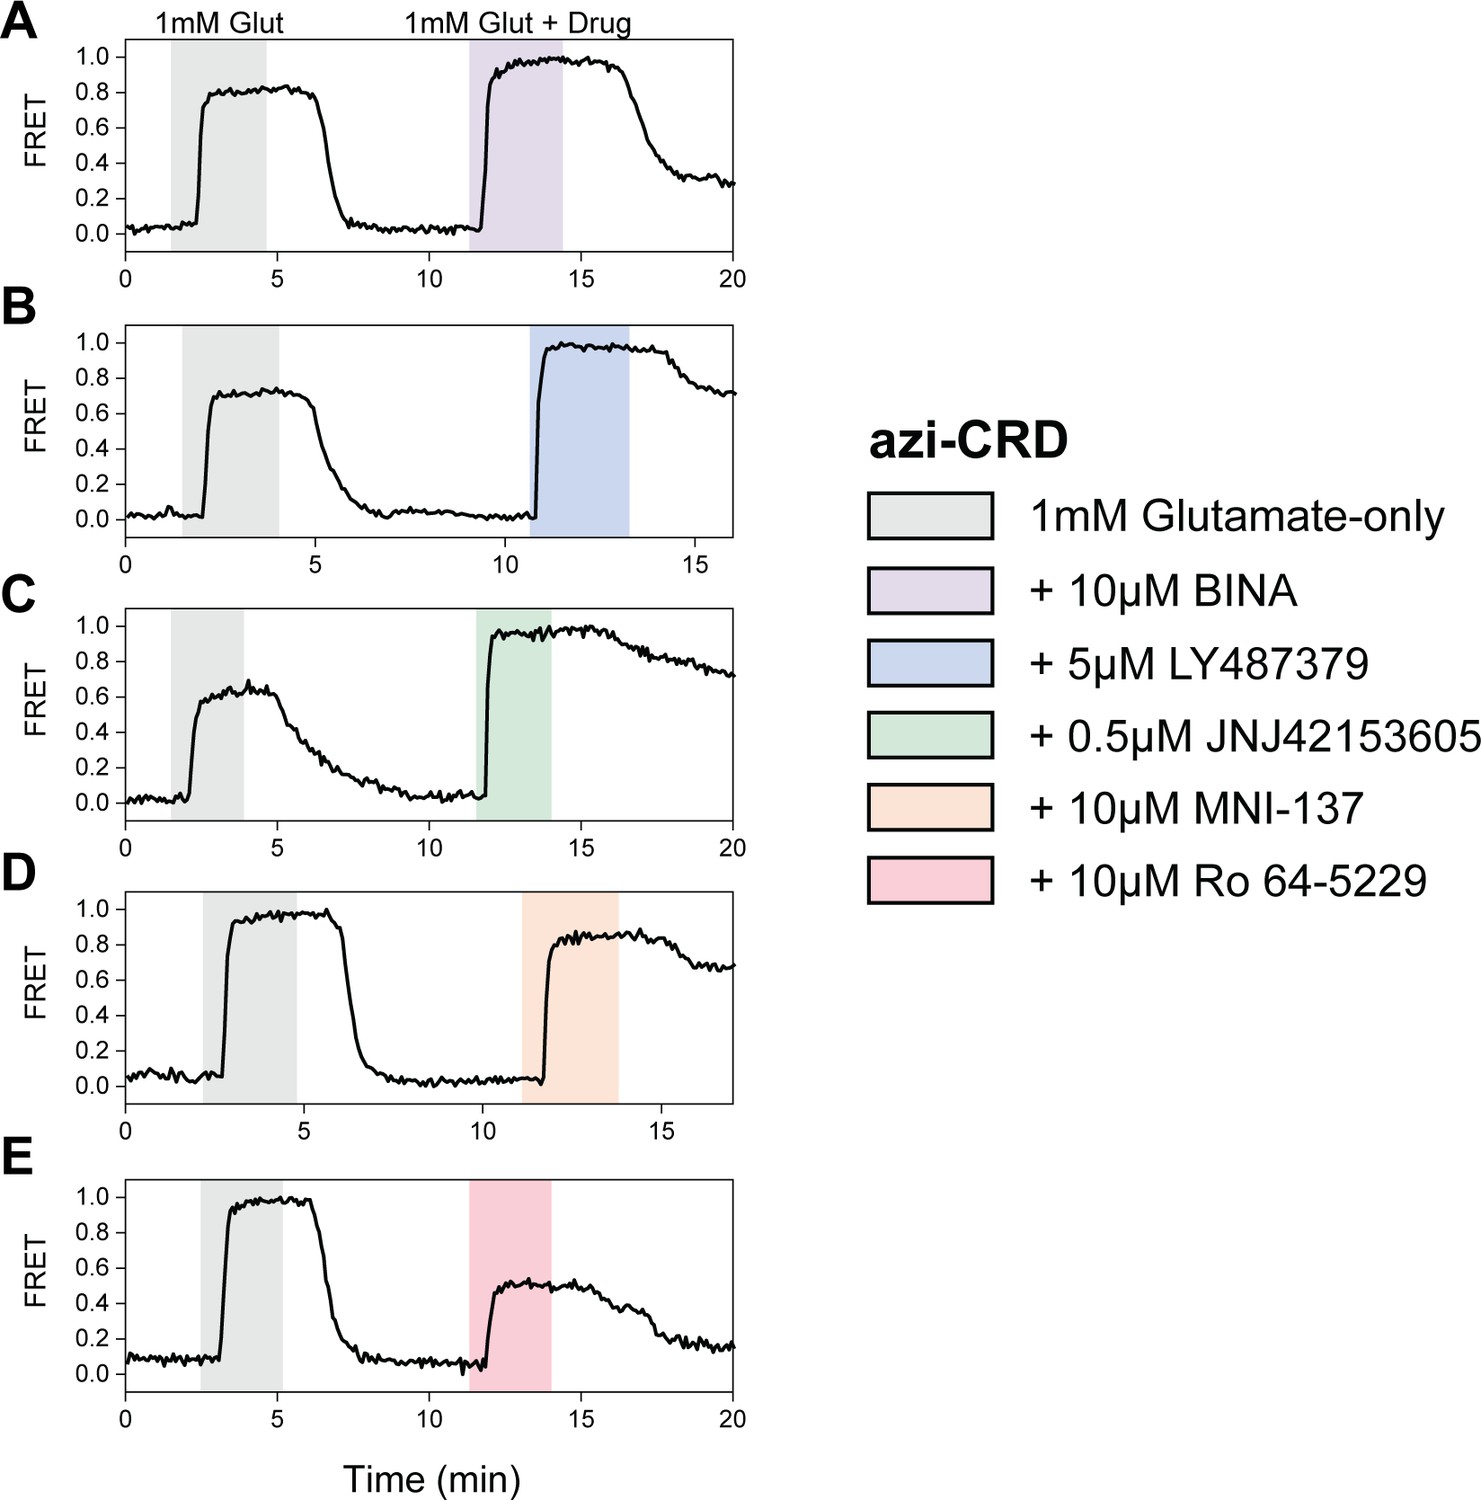
(A–E) Representative normalized live-cell FRET traces of azi-CRD normalization experiments for all positive and negative allosteric modulators tested. Data was acquired at 4.5 s time resolution.
Figure 2—figure supplement 3
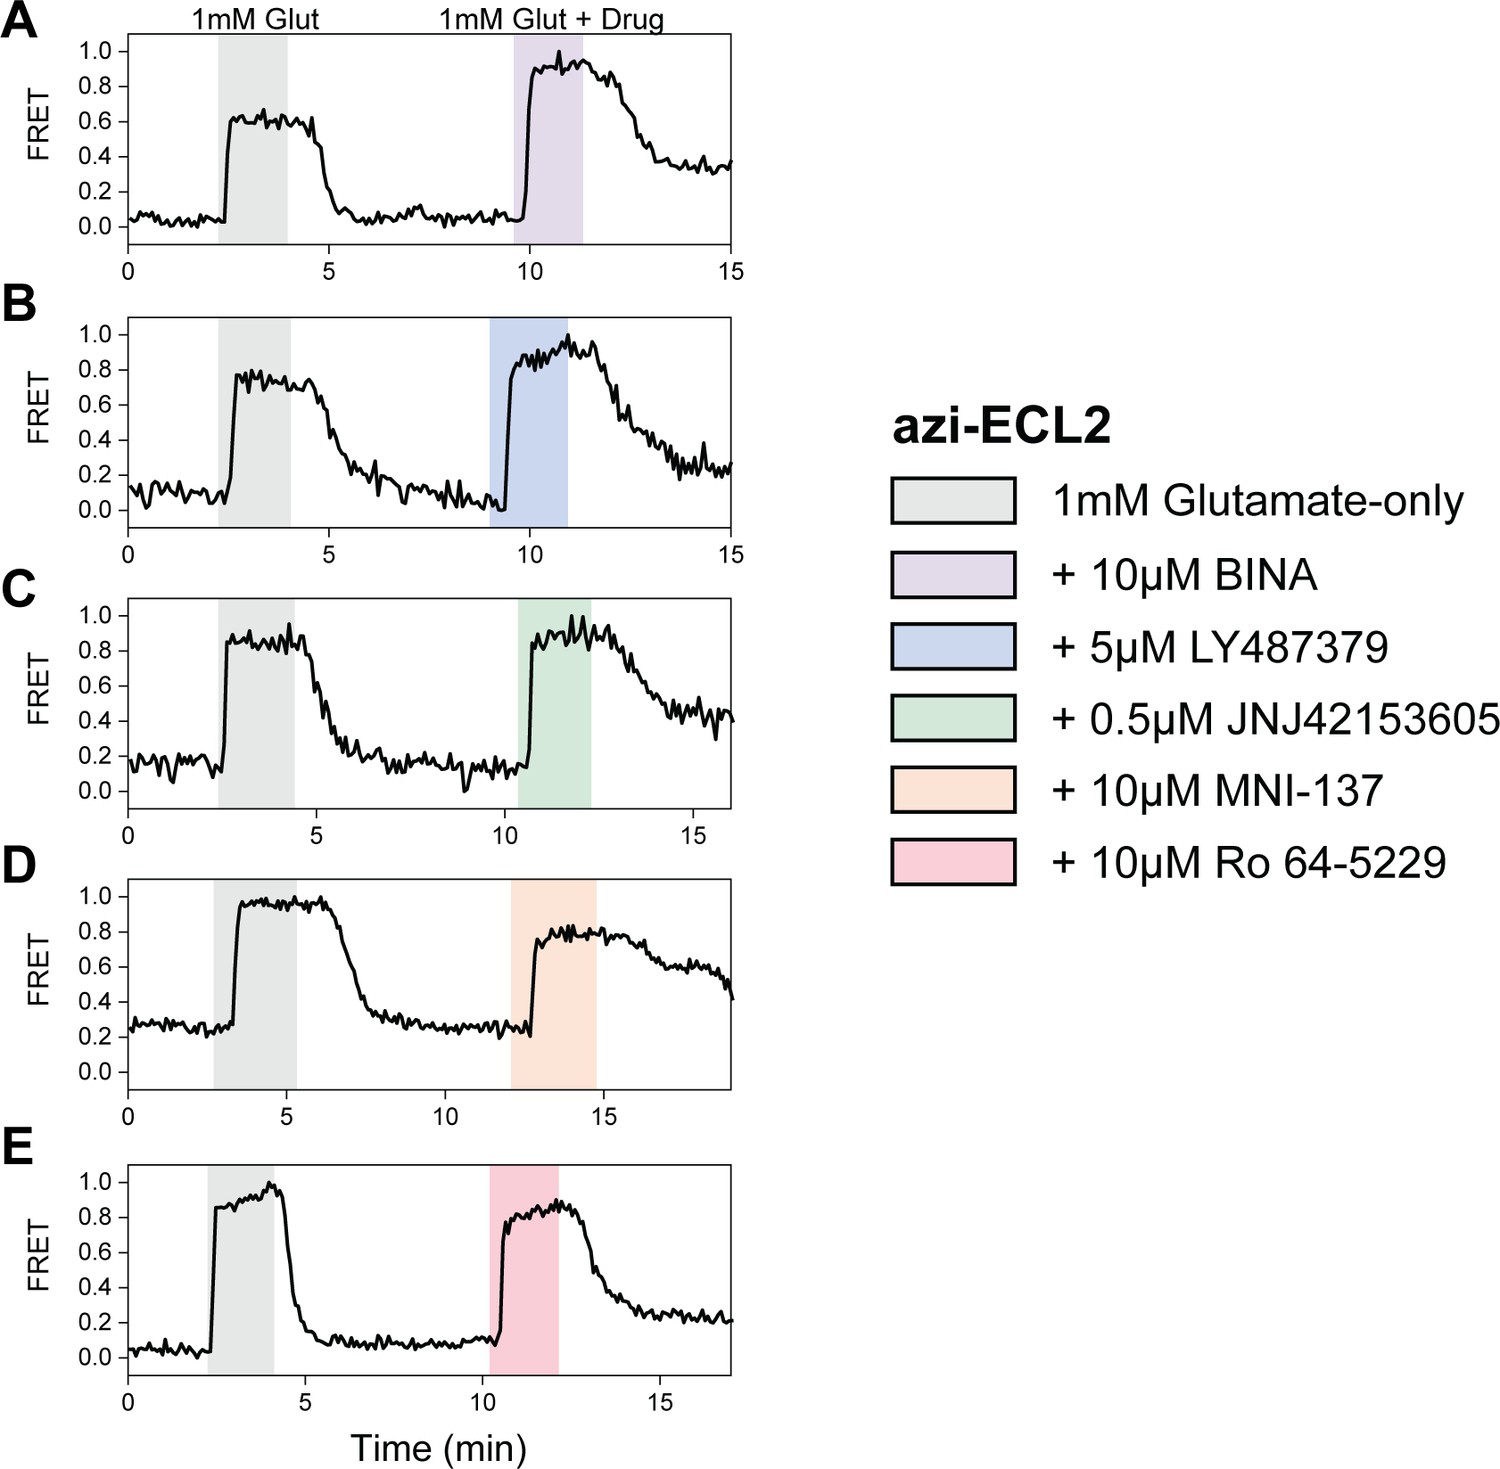
Max normalization of Δfluorescence resonance energy transfer (ΔFRET) for azi-ECL2.
(A–E) Representative normalized live-cell FRET traces of azi-ECL2 normalization experiments for all positive and negative allosteric modulators tested. Data was acquired at 4.5 s time resolution.
Figure 2—figure supplement 4
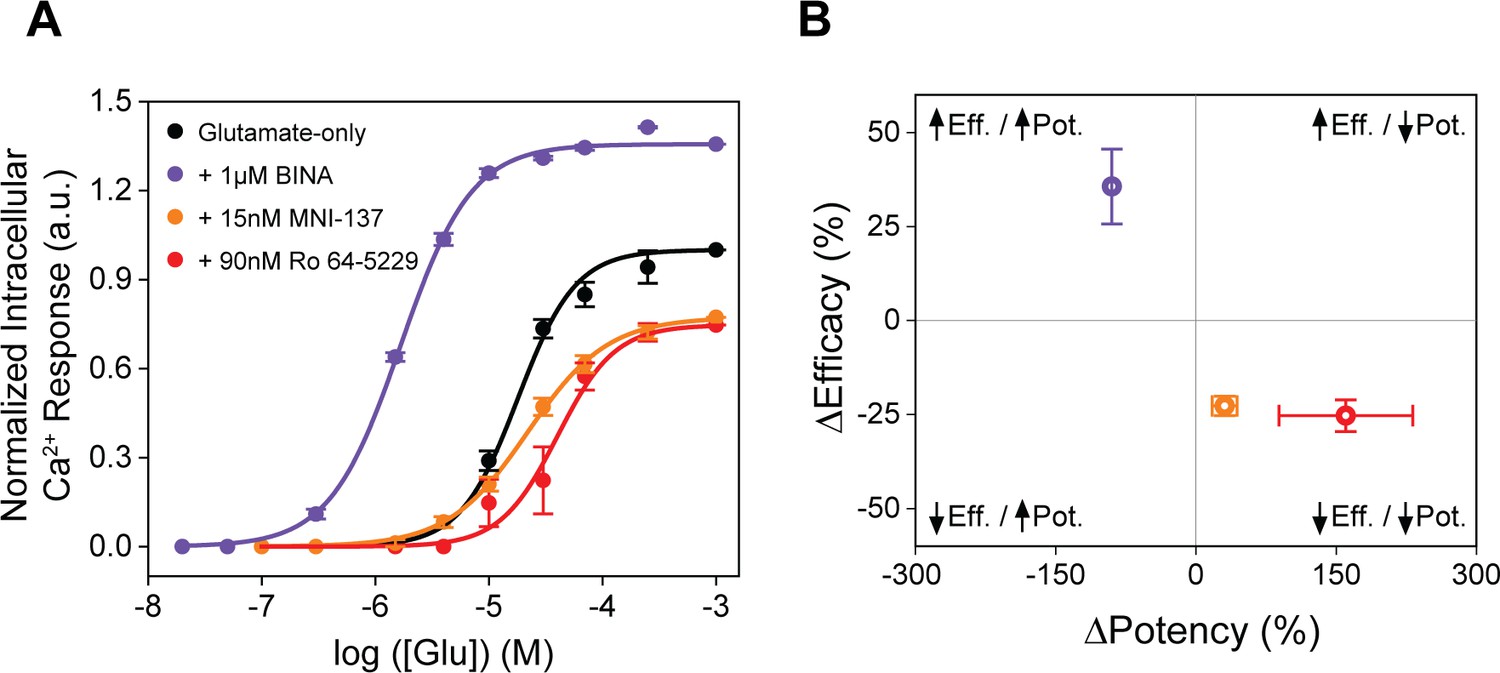
Allosteric modulators examined by functional calcium imaging.
(A) Glutamate dose-response curves with and without allosteric modulators for metabotropic glutamate receptor 2 (mGluR2)-induced calcium flux. (B) Changes in glutamate potency and efficacy in response to allosteric modulator treatment, measured by intracellular calcium levels. ΔPotency defined as (([modulator + glutamate]EC50 – [glutamate] EC50)/[glutamate] EC50) × 100. ΔEfficacy defined as ([1 mM glutamate + modulator] – [1 mM glutamate]) × 100. Data is normalized to 1 mM glutamate response. Data represents mean ± SEM of results from three independent experiments.
Figure 2—figure supplement 5
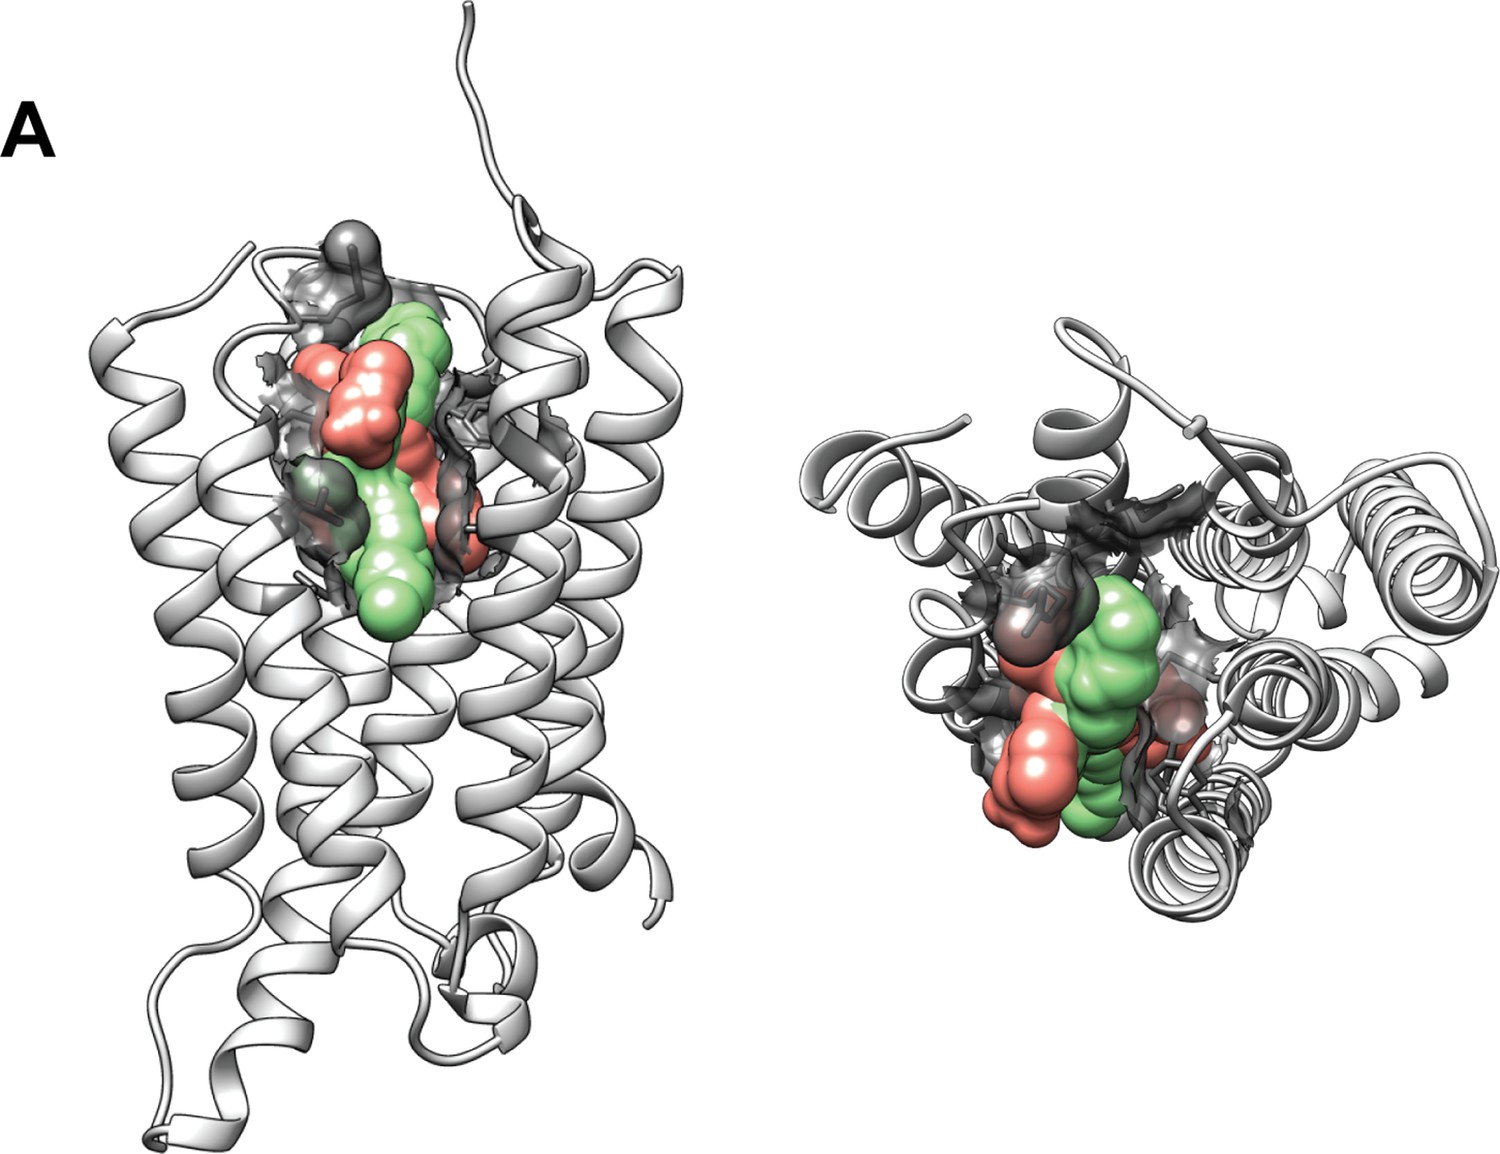
Structural representation of allosteric modulator binding pocket.
The 7 transmembrane (7TM) domain (white) is from positive allosteric modulator (PAM) bound subunit of metabotropic glutamate receptor 2 (mGluR2; PDB:7MTS). Lateral view (left) and top view (right). Residues found to interact with PAM in structure (PDB: 7MTS) and from mutagenesis studies are shown with surface representations (gray). Ligands bound are superimposed volumes of PAMs (green; PDB: 7MTR, 7MTS, 7E9G) and NAMs (pink; PDB: 7EPE, 7EPF) solved in complex with metabotropic glutamate receptor 2 (mGluR2).
Figure 3 with 2 supplements
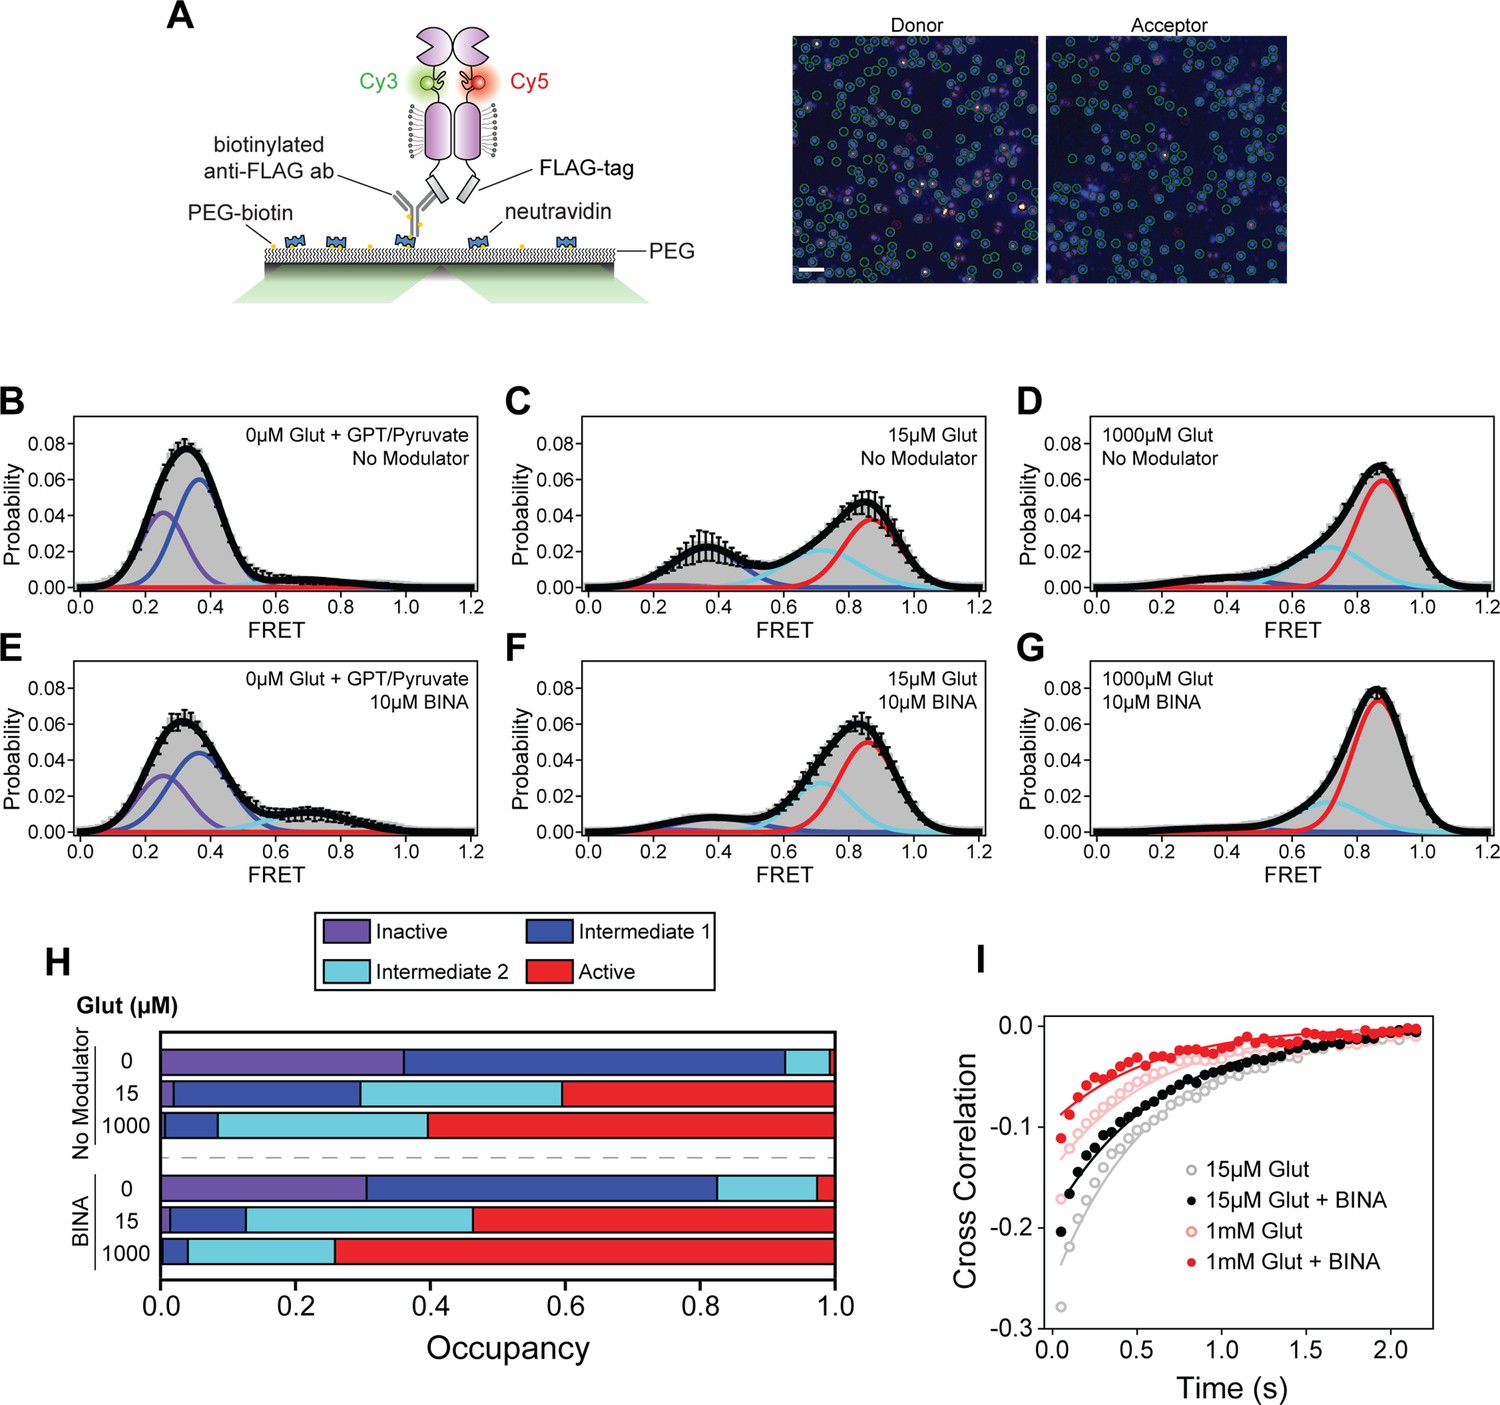
Single-molecule fluorescence resonance energy transfer (smFRET) analysis of BINA effects on cysteine-rich domain (CRD) conformational dynamics.
(A) Schematic of SiMPull assay (left) and representative image of donor and acceptor channels during data acquisition (right). Green circles indicate molecules selected by software for analysis. Scale bar, 3 μm. smFRET population histograms of azi-CRD in the presence of 0 μM, 15 μM, and 1 mM glutamate without (B–D) or with (E–G) 10 μM BINA. Histograms were fitted (black) to four Gaussian distributions centered around 0.24 (inactive; purple), 0.38 (intermediate 1; blue), 0.70 (intermediate 2; cyan), and 0.87 (active; red) FRET. Error bars represent SEM. Histograms (B–G) were generated from 332, 366, 253, 252, 418, and 367 individual particles, respectively. (H) Mean occupancy of four conformational states of azi-CRD in varying ligand conditions. Values represent area under each FRET peak from smFRET histogram as a fraction of total area. Mean and SEM values are reported in Table 3. (I) Mean cross-correlation of donor and acceptor intensities in the presence of intermediate (15 μM) and saturating (1 mM) glutamate with and without 10 μM BINA. Data was acquired at 50 ms time resolution. All data represents mean from three independent experiments.
-
Figure 3—source data 1
Source data for Figure 3.
- https://cdn.elifesciences.org/articles/78982/elife-78982-fig3-data1-v2.xlsx
Figure 3—figure supplement 1
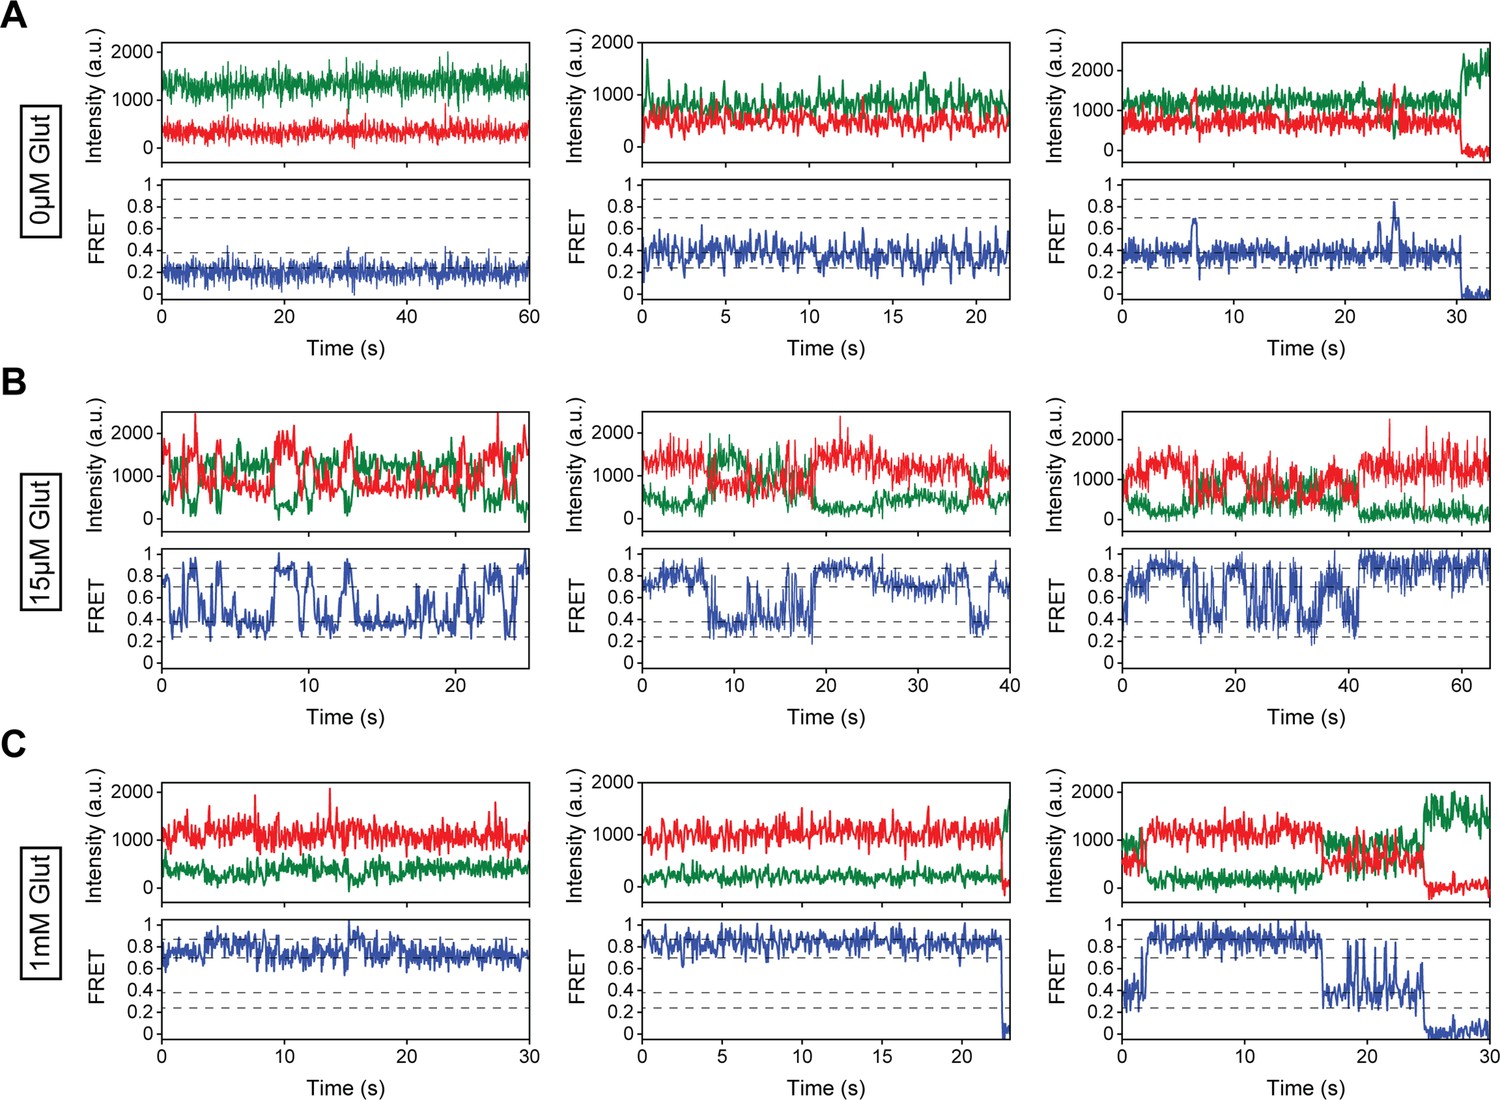
Representative single-molecule fluorescence resonance energy transfer (smFRET) traces for modulator-free conditions.
(A–C) Representative smFRET traces of azi-cysteine-rich domain (azi-CRD) in the presence of (A) 0 μM, (B) 15 μM, and (C) 1 mM glutamate showing donor (green) and acceptor (red) and corresponding FRET (blue). Dashed lines represent four distinct FRET states. Data was acquired at 50 ms time resolution.
Figure 3—figure supplement 2
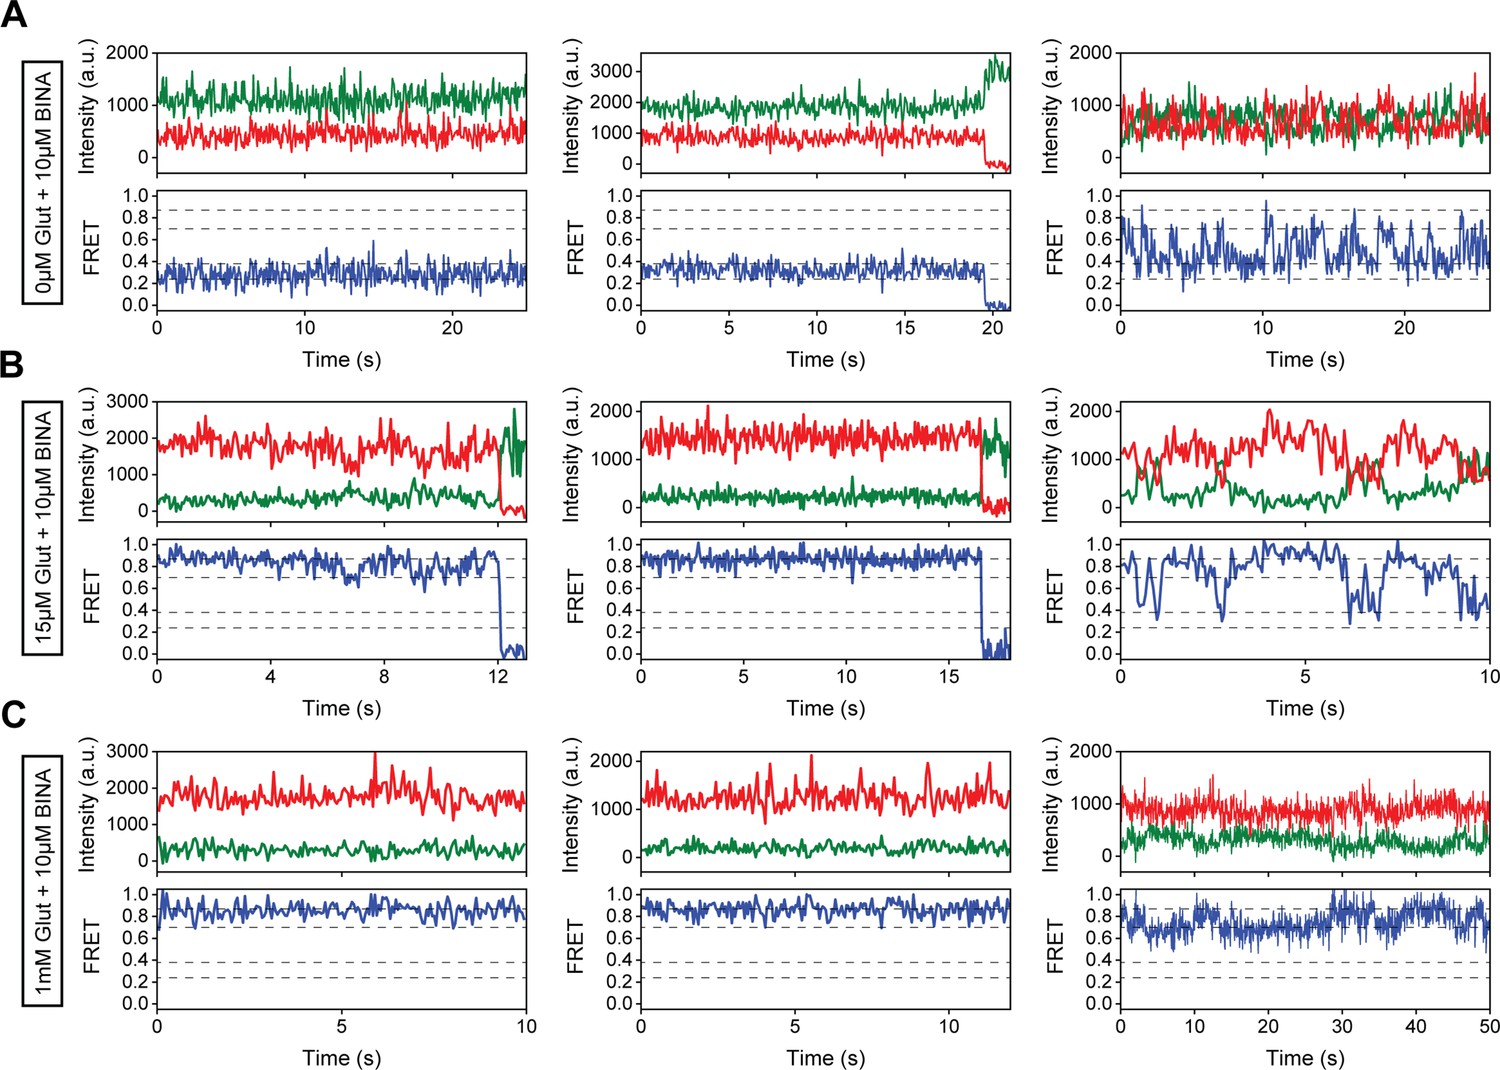
Representative single-molecule fluorescence resonance energy transfer (smFRET) traces for 10 μM BINA conditions.
(A–C) Representative smFRET traces of azi-cysteine-rich domain (azi-CRD) in the presence of 10 μM BINA and (A) 0 μM, (B) 15 μM, and (C) 1 mM glutamate showing donor (green) and acceptor (red) and corresponding FRET (blue). Dashed lines represent four distinct FRET states. Data was acquired at 50 ms time resolution.
Figure 4 with 2 supplements
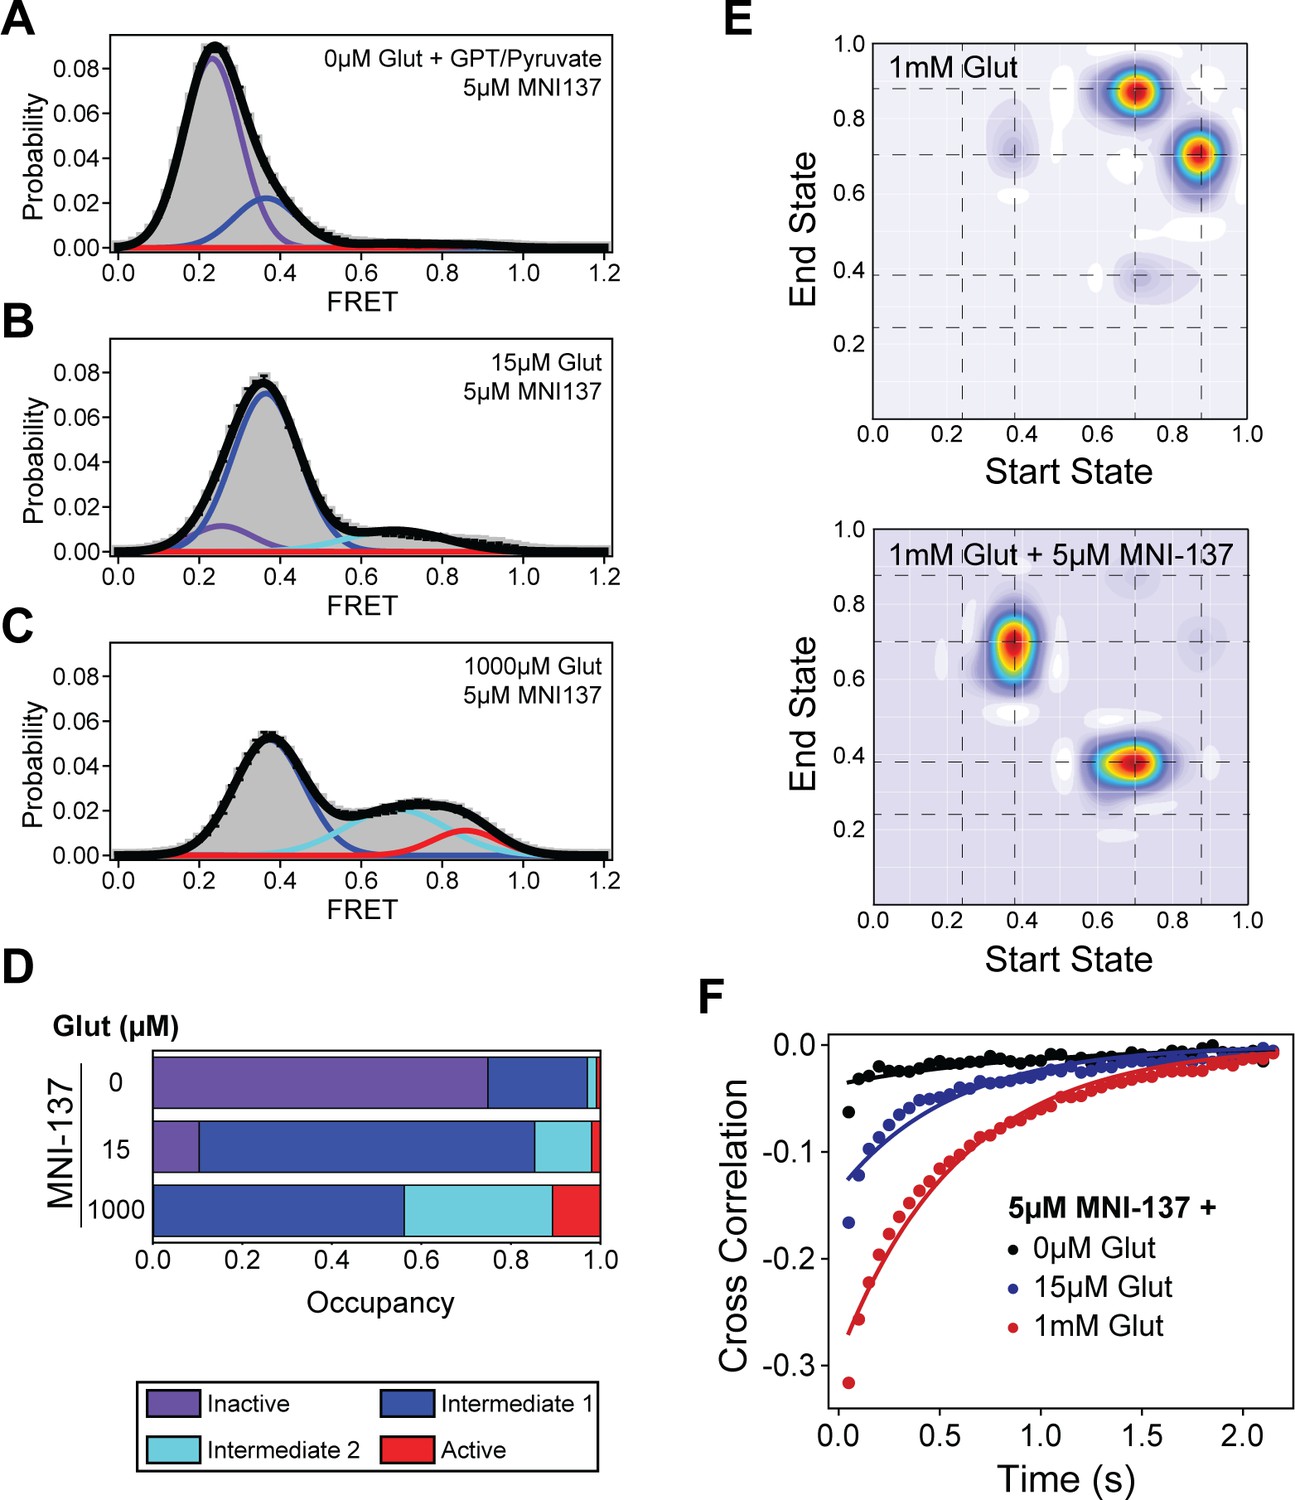
Single-molecule fluorescence resonance energy transfer (smFRET) analysis of MNI-137 effects on cysteine-rich domain (CRD) conformational dynamics.
(A–C) smFRET population histograms of azi-CRD sensor in the presence of 0 μM (372 particles), 15 μM (560 particles), and 1 mM (479 particles) glutamate and 5 μM MNI-137. Histograms were fitted (black) to four Gaussian distributions centered around 0.24 (inactive; purple), 0.38 (intermediate 1; blue), 0.70 (intermediate 2; cyan), and 0.87 (active; red) FRET. Error bars represent SEM. (D) Mean occupancy of four conformational states of azi-CRD in varying ligand conditions. Values represent area under each FRET peak from smFRET histogram as a fraction of total area. Mean and SEM values are reported in Table 3. (E) Transition density plots of azi-CRD at 1 mM glutamate with and without MNI-137. Dashed lines represent four distinct FRET states. (F) Mean cross-correlation of donor and acceptor intensities in the presence of 0 μM, 15 μM, and 1 mM glutamate and 5 μM MNI-137. Data was acquired at 50 ms time resolution. Data represents mean from three independent experiments.
-
Figure 4—source data 1
Source data for Figure 4.
- https://cdn.elifesciences.org/articles/78982/elife-78982-fig4-data1-v2.xlsx
Figure 4—figure supplement 1
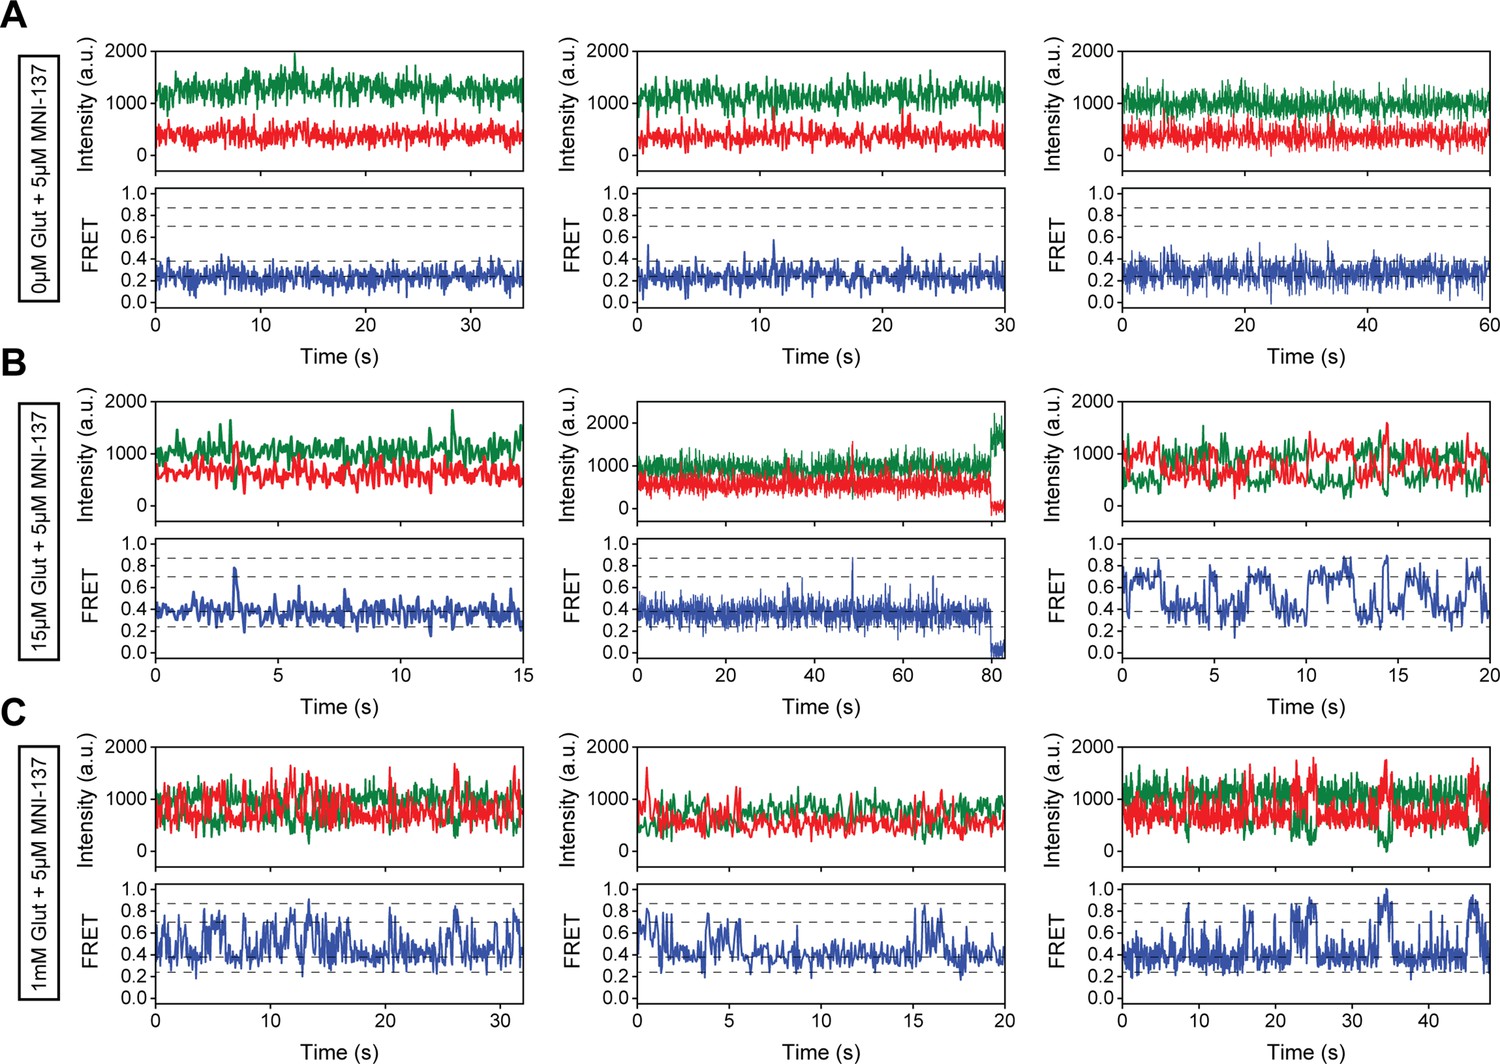
Representative single-molecule fluorescence resonance energy transfer (smFRET) traces for 5 μM MNI-137 conditions.
(A–C) Representative smFRET traces of azi-cysteine-rich domain (azi-CRD) in the presence of 5 μM MNI-137 and (A) 0 μM, (B) 15 μM, and (C) 1 mM glutamate showing donor (green) and acceptor (red) and corresponding FRET (blue). Dashed lines represent four distinct FRET states. Data was acquired at 50 ms time resolution.
Figure 4—figure supplement 2
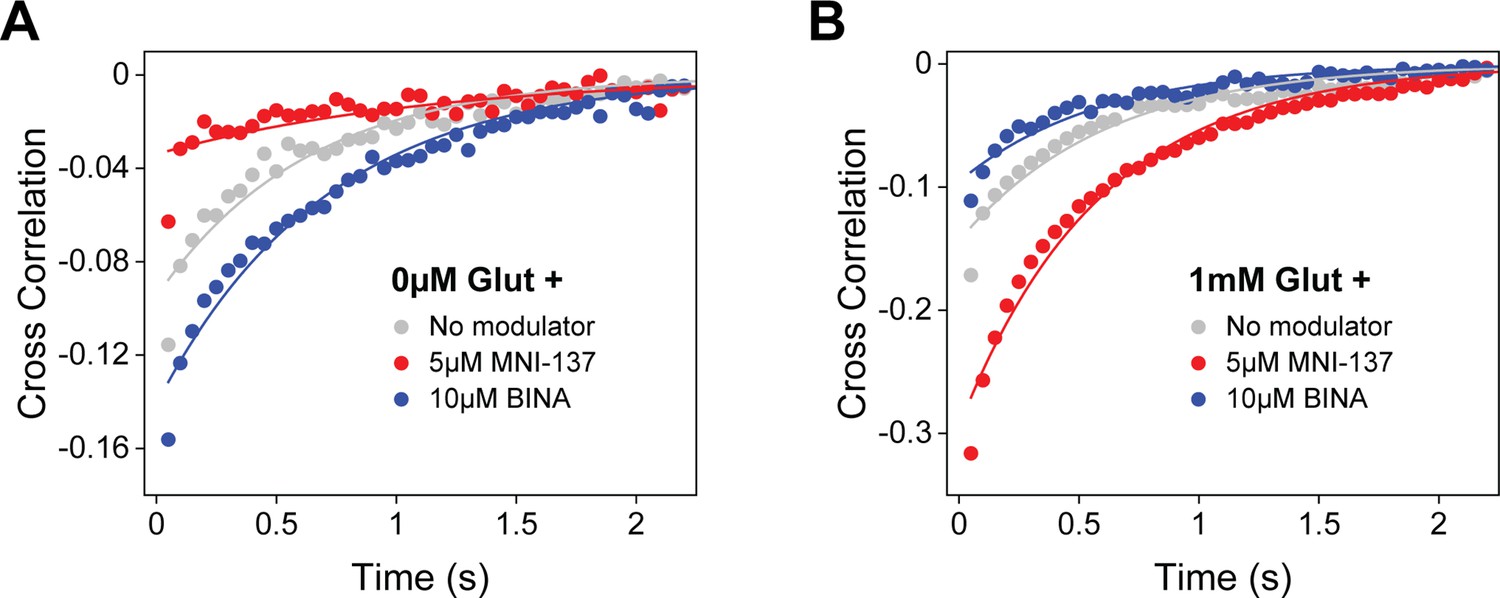
Allosteric modulator effects on azi-cysteine-rich domain (azi-CRD) cross correlation.
(A) Cross-correlation of azi-CRD donor and acceptor intensities in the presence of 0 μM glutamate alone and with 5 μM MNI-137 or 10 μM BINA. (B) Cross-correlation of azi-CRD donor and acceptor intensities in the presence of 1 mM glutamate alone and with 5 μM MNI-137 or 10 μM BINA. Data was acquired at 50 ms time resolution.
Tables
Table 1
Live-cell fluorescence resonance energy transfer (FRET) titration experiment data and statistics.
| Sensor | Ligand | N | Mean half-maximum effective concentration (EC50) | SEM | Hill slope | Standard error |
|---|---|---|---|---|---|---|
| SNAP-m2 | Glutamate | 9 | 11.9 | 1.5 | –1.44 | 0.08 |
| SNAP-m2 | DCG-IV | 6 | 0.4 | 0.1 | –1.26 | 0.11 |
| SNAP-m2 | LY379268 | 6 | 30.6 | 9.3 | –1.12 | 0.07 |
| SNAP-m2 | (2R,4R)-APDC | 6 | 6.9 | 3.1 | –1.10 | 0.05 |
| SNAP-m2 | Glutamate + 10 μM BINA | 23 | 1.2 | 0.4 | –1.24 | 0.09 |
| SNAP-m2 | Glutamate + 5 μM LY487379 | 4 | 3.8 | 0.9 | –1.43 | 0.11 |
| SNAP-m2 | Glutamate + 0.5 μM JNJ-42153605 | 5 | 4.2 | 1.9 | –0.95 | 0.05 |
| SNAP-m2 | Glutamate + 10 μM MNI-137 | 4 | 17.2 | 2.8 | –1.61 | 0.06 |
| SNAP-m2 | Glutamate + 10 μM Ro 64–5229 | 3 | 19.6 | 2.6 | –1.52 | 0.04 |
| azi-CRD | Glutamate | 26 | 11.6 | 0.5 | 1.19 | 0.03 |
| azi-CRD | DCG-IV | 10 | 1.1 | 0.2 | 0.94 | 0.10 |
| azi-CRD | LY379268 | 20 | 12.1 | 0.5 | 1.36 | 0.05 |
| azi-CRD | (2R,4R)-APDC | 36 | 6.5 | 1.2 | 1.10 | 0.05 |
| azi-CRD | Glutamate + 10 μM BINA | 10 | 1.6 | 0.3 | 1.16 | 0.05 |
| azi-CRD | Glutamate + 5 μM LY487379 | 22 | 4.5 | 0.6 | 0.91 | 0.04 |
| azi-CRD | Glutamate + 0.5 μM JNJ-42153605 | 10 | 4.7 | 1.3 | 0.84 | 0.03 |
| azi-CRD | Glutamate + 10 μM MNI-137 | 27 | 13.8 | 0.7 | 1.10 | 0.04 |
| azi-CRD | Glutamate + 10 μM Ro 64–5229 | 13 | 16.9 | 1.2 | 1.05 | 0.06 |
| azi-ECL2 | Glutamate | 15 | 5.1 | 0.6 | 0.96 | 0.07 |
| azi-ECL2 | DCG-IV | 24 | 0.9 | 0.1 | 1.05 | 0.06 |
| azi-ECL2 | LY379268 | 9 | 10.2 | 2.4 | 1.03 | 0.04 |
| azi-ECL2 | (2R,4R)-APDC | 13 | 6.7 | 1.3 | 1.14 | 0.05 |
| azi-ECL2 | Glutamate + 10 μM BINA | 16 | 2.5 | 0.2 | 1.06 | 0.07 |
| azi-ECL2 | Glutamate + 5 μM LY487379 | 22 | 3.5 | 0.2 | 0.98 | 0.05 |
| azi-ECL2 | Glutamate + 0.5 μM JNJ-42153605 | 17 | 2.2 | 0.1 | 0.97 | 0.06 |
| azi-ECL2 | Glutamate + 10 μM MNI-137 | 8 | 14.4 | 1.7 | 1.32 | 0.06 |
| azi-ECL2 | Glutamate + 10 μM Ro 64–5229 | 5 | 17.4 | 2.4 | 1.07 | 0.09 |
-
All EC50 and errors values are in μM, except for LY379268 (nM).
-
Table 1—source data 1
Source data for Table 1.
- https://cdn.elifesciences.org/articles/78982/elife-78982-table1-data1-v2.xlsx
Table 2
Live-cell fluorescence resonance energy transfer (FRET) max normalization experiment data and statistics.
| Sensor | Ligand | N | Mean max response | SEM |
|---|---|---|---|---|
| SNAP-m2 | Glutamate | - | 1 | - |
| SNAP-m2 | DCG-IV | 25 | 0.79 | 0.01 |
| SNAP-m2 | LY379268 | 23 | 1.01 | 0.01 |
| SNAP-m2 | (2R,4R)-APDC | 14 | 0.96 | 0.01 |
| SNAP-m2 | Glutamate + 10 μM BINA | 7 | 1.02 | 0.01 |
| SNAP-m2 | Glutamate + 5 μM LY487379 | 14 | 1.07 | 0.01 |
| SNAP-m2 | Glutamate + 0.5 μM JNJ-42153605 | 22 | 1.01 | 0.01 |
| SNAP-m2 | Glutamate + 10 μM MNI-137 | 22 | 0.85 | 0.02 |
| SNAP-m2 | Glutamate + 10 μM Ro 64–5229 | 35 | 0.87 | 0.01 |
| azi-CRD | Glutamate | - | 1 | - |
| azi-CRD | DCG-IV | 19 | 0.69 | 0.01 |
| azi-CRD | LY379268 | 25 | 1.06 | 0.02 |
| azi-CRD | (2R,4R)-APDC | 13 | 1.02 | 0.01 |
| azi-CRD | Glutamate + 10 μM BINA | 9 | 1.12 | 0.05 |
| azi-CRD | Glutamate + 5 μM LY487379 | 19 | 1.56 | 0.07 |
| azi-CRD | Glutamate + 0.5 μM JNJ-42153605 | 8 | 1.43 | 0.08 |
| azi-CRD | Glutamate + 10 μM MNI-137 | 18 | 0.86 | 0.02 |
| azi-CRD | Glutamate + 10 μM Ro 64–5229 | 18 | 0.59 | 0.03 |
| azi-ECL2 | Glutamate | - | 1 | - |
| azi-ECL2 | DCG-IV | 25 | 0.64 | 0.02 |
| azi-ECL2 | LY379268 | 22 | 1.14 | 0.04 |
| azi-ECL2 | (2R,4R)-APDC | 56 | 1.05 | 0.01 |
| azi-ECL2 | Glutamate + 10 μM BINA | 14 | 1.42 | 0.07 |
| azi-ECL2 | Glutamate + 5 μM LY487379 | 7 | 1.25 | 0.09 |
| azi-ECL2 | Glutamate + 0.5 μM JNJ-42153605 | 13 | 0.99 | 0.02 |
| azi-ECL2 | Glutamate + 10 μM MNI-137 | 58 | 0.78 | 0.03 |
| azi-ECL2 | Glutamate + 10 μM Ro 64–5229 | 8 | 0.84 | 0.05 |
-
All max response values are normalized to 1 mM glutamate.
-
Table 2—source data 1
Source data for Table 2.
- https://cdn.elifesciences.org/articles/78982/elife-78982-table2-data1-v2.xlsx
Table 3
Single-molecule fluorescence resonance energy transfer (smFRET) state occupancy data and statistics.
| Modulator | Glut (μM) | State (#) | Mean occupancy | SEM |
|---|---|---|---|---|
| None | 0 | 1 | 0.36067 | 0.048 |
| None | 0 | 2 | 0.56526 | 0.02692 |
| None | 0 | 3 | 0.06615 | 0.02385 |
| None | 0 | 4 | 0.00792 | 0.00792 |
| None | 15 | 1 | 0.01932 | 0.01049 |
| None | 15 | 2 | 0.27699 | 0.06688 |
| None | 15 | 3 | 0.29899 | 0.01579 |
| None | 15 | 4 | 0.4047 | 0.09147 |
| None | 1000 | 1 | 0.00642 | 0.00292 |
| None | 1000 | 2 | 0.07841 | 0.01209 |
| None | 1000 | 3 | 0.31131 | 0.02404 |
| None | 1000 | 4 | 0.60386 | 0.01743 |
| 10 μM BINA | 0 | 1 | 0.30527 | 0.02468 |
| 10 μM BINA | 0 | 2 | 0.51994 | 0.04492 |
| 10 μM BINA | 0 | 3 | 0.14826 | 0.04699 |
| 10 μM BINA | 0 | 4 | 0.02653 | 0.01748 |
| 10 μM BINA | 15 | 1 | 0.01424 | 0.00761 |
| 10 μM BINA | 15 | 2 | 0.11217 | 0.01526 |
| 10 μM BINA | 15 | 3 | 0.3367 | 0.07918 |
| 10 μM BINA | 15 | 4 | 0.53688 | 0.07621 |
| 10 μM BINA | 1000 | 1 | 0.00296 | 0.00154 |
| 10 μM BINA | 1000 | 2 | 0.03751 | 0.00782 |
| 10 μM BINA | 1000 | 3 | 0.21791 | 0.01663 |
| 10 μM BINA | 1000 | 4 | 0.74162 | 0.01093 |
| 5 μM MNI-137 | 0 | 1 | 0.74861 | 0.02014 |
| 5 μM MNI-137 | 0 | 2 | 0.22198 | 0.01316 |
| 5 μM MNI-137 | 0 | 3 | 0.02038 | 0.01004 |
| 5 μM MNI-137 | 0 | 4 | 0.00903 | 0.00541 |
| 5 μM MNI-137 | 15 | 1 | 0.10387 | 0.02484 |
| 5 μM MNI-137 | 15 | 2 | 0.74937 | 0.01688 |
| 5 μM MNI-137 | 15 | 3 | 0.12724 | 0.01026 |
| 5 μM MNI-137 | 15 | 4 | 0.01952 | 0.00254 |
| 5 μM MNI-137 | 1000 | 1 | 0.00207 | 0.000954 |
| 5 μM MNI-137 | 1000 | 2 | 0.5597 | 0.02561 |
| 5 μM MNI-137 | 1000 | 3 | 0.33098 | 0.03204 |
| 5 μM MNI-137 | 1000 | 4 | 0.10725 | 0.00734 |
-
Table 3—source data 1
Source data for Table 3.
- https://cdn.elifesciences.org/articles/78982/elife-78982-table3-data1-v2.xlsx
Key resources table
| Reagent type (species) or resource | Designation | Source or reference | Identifiers | Additional information |
|---|---|---|---|---|
| Cell line (Homo sapiens) | HEK 293T | Sigma Aldrich | Cat # 12022001 | |
| Transfected construct (Mus musculus) | SNAP-m2 | Liauw et al., 2021 | ||
| Transfected construct (Mus musculus) | SNAP-m2 (no-FLAG) | Liauw et al., 2021 (modified) | ||
| Transfected construct (Mus musculus) | azi-CRD | Liauw et al., 2021 | ||
| Transfected construct (Mus musculus) | azi-ECL2 | Genscript (modified) | ORF clone: OMu19627D | |
| Transfected construct (Homo sapiens) | pIRE4-Azi | Addgene | Plasmid # 105,829 | |
| Transfected construct (Mus musculus) | Gqo5 | Addgene (modified) | Plasmid # 24,500 | |
| Chemical compound, drug | Glutamate | Sigma Aldrich | Cat # 6106-04-3 | |
| Chemical compound, drug | LY379268 | Tocris | Cat # 2,453 | |
| Chemical compound, drug | DCG-IV | Tocris | Cat # 0975 | |
| Chemical compound, drug | (2R,4R)-APDC | Tocris | Cat # 1,208 | |
| Chemical compound, drug | LY487379 | Tocris | Cat # 3,283 | |
| Chemical compound, drug | BINA | Tocris | Cat # 4,048 | |
| Chemical compound, drug | JNJ-42153605 | Cayman Chemical | 21,984 | |
| Chemical compound, drug | Ro 64–5229 | Tocris | Cat # 2,913 | |
| Chemical compound, drug | MNI-137 | Tocris | Cat # 4,388 | |
| Chemical compound, drug | SNAP-Surface Alexa Fluor 549 | New England Biolabs | S9112S | |
| Chemical compound, drug | SNAP-Surface Alexa Fluor 647 | New England Biolabs | S9136S | |
| Chemical compound, drug | Oregon Green 488 BAPTA-1, AM | Thermo Fisher Scientific | O6807 | |
| Chemical compound, drug | Cy3 Alkyne | Click Chemistry Tools | TA117-5 | |
| Chemical compound, drug | Cy5 Alkyne | Click Chemistry Tools | TA116-5 | |
| Chemical compound, drug | 4-azido-L-phenylalanine | Chem-Impex International | Cat # 06162 | |
| Chemical compound, drug | Aminoguanidine (hydrochloride) | Cayman Chemical | 81,530 | |
| Chemical compound, drug | BTTES | Click Chemistry Tools | 1237–500 | |
| Chemical compound, drug | Copper (II) sulfate | Sigma Aldrich | Cat # 451657–10 G | |
| Chemical compound, drug | (+)-Sodium L-Ascorbate | Sigma Aldrich | Cat # 11140–250 G | |
| Chemical compound, drug | Glutamic-Pyruvic Transaminase | Sigma Aldrich | Cat # G8255-200UN | |
| Chemical compound, drug | Sodium Pyruvate | Gibco | 11360–070 | |
| Chemical compound, drug | DMEM | Corning | 10–013-CV | |
| Chemical compound, drug | Defined Fetal Bovine Serum | Thermo Fisher Scientific | SH30070.03 | |
| Chemical compound, drug | Penicillin-Streptomycin | Gibco | 15140–122 | |
| Chemical compound, drug | Lipofectamine 3000 Transfection Reagent | Thermo Fisher Scientific | L3000015 | |
| Chemical compound, drug | Poly-L-lysine hydrobromide | Sigma Aldrich | Cat # P2636 | |
| Chemical compound, drug | FLAG-tag antibody | Genscript | A01429 | |
| Software, algorithm | smCamera (Version 1.0) | http://ha.med.jhmi.edu/resources/ | ||
| Software, algorithm | ImageJ (Version 1.52 p) | http://imagej.nih.gov/ij/ | RRID:SCR_003070 | |
| Software, algorithm | OriginPro (2020b) | https://www.originlab.com/ | RRID:SCR_014212 | |
| Software, algorithm | Adobe Illustrator (2022) | https://www.adobe.com/ | RRID:SCR_010279 |
Additional files
Download links
A two-part list of links to download the article, or parts of the article, in various formats.
Downloads (link to download the article as PDF)
Open citations (links to open the citations from this article in various online reference manager services)
Cite this article (links to download the citations from this article in formats compatible with various reference manager tools)
Conformational fingerprinting of allosteric modulators in metabotropic glutamate receptor 2
eLife 11:e78982.
https://doi.org/10.7554/eLife.78982


