Type 1 piliated uropathogenic Escherichia coli hijack the host immune response by binding to CD14
- Institute of Science and Technology Austria, Austria
- VALANX Biotech GmbH, Austria
Figures
Figure 1 with 2 supplements
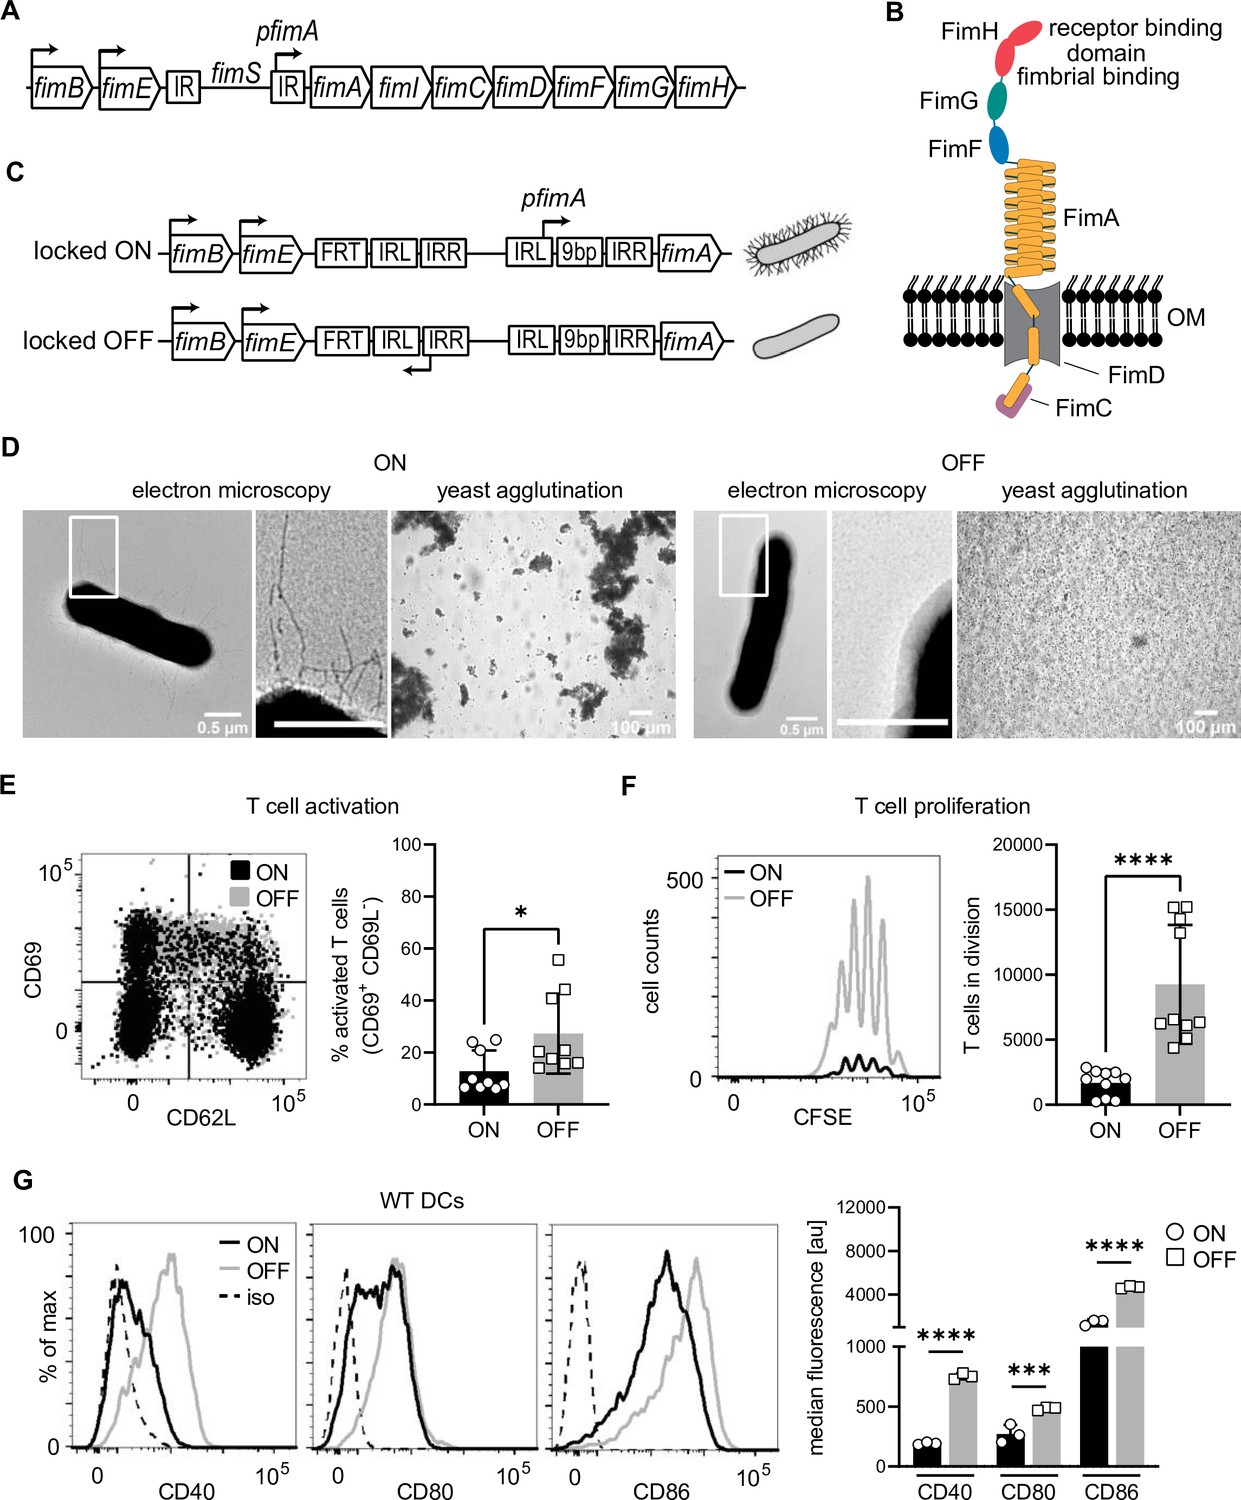
Type 1 piliated uropathogenic E. coli (UPECs) inhibit T cell activation and proliferation by decreasing co-stimulatory molecules on dendritic cells (DCs).
(A) Type 1 pili genes are expressed from the fim operon. Phase variation of the fim switch (fimS) harboring fimA promoter (pfimA) drives expression. fimB and fimE genes express site-specific recombinases, FimB and FimE, respectively, inverting the fimS region by binding to the inverted repeats (IR). (B) Type 1 pili consist of several repeating units of the rod protein FimA, two adaptor proteins FimF and FimG, and the tip protein FimH. Fimbrial- and a receptor-binding domain of the two-domain FimH protein are shown. FimD, outer membrane usher. FimC, chaperone. (C) Phase-locked mutants were generated by deleting the 9-bp recognition site for the site-specific recombinases in the left inverted repeat region of the fimS in either ON or OFF orientation by introducing FRT sites resulting in piliated and non-piliated bacteria (see Methods). (D) ON (left panel) and OFF mutants (right panel). Electron microscopy images, with zoomed in regions (white boxes) marked in inlays, and yeast agglutination assay. (E) Dot plot of CD69 and CD62L expression on T cells after co-culture with ON (black) and OFF (gray) stimulated DCs (left panel). Quantification of CD69+ CD62L− T cell frequencies (right panel) (four biological replicates). (F) CFSE (carboxyfluorescein succinimidyl ester) dilution profile of T cells after 96 hr of co-culture with ON (black) and OFF (gray) stimulated wild-type (WT) DCs (left). Quantification of T cells in division (right panel) (four biological replicates). (G) Expression level of co-stimulatory molecules (CD40, CD80, and CD86) of WT DCs after stimulation with ON (black) and OFF (gray) (left panel; iso – isotype control). Quantification of median fluorescence values of co-stimulatory molecules (right panel) (three biological replicates). *p < 0.1, ***p < 0.01, ****p < 0.001 by Student’s t-test; data are represented as means ± standard deviation (SD).
-
Figure 1—source data 1
In vitro T cell assay – T cell activation after contact with wild-type (WT) dendritic cells (DCs) after ON and OFF stimulation.
- https://cdn.elifesciences.org/articles/78995/elife-78995-fig1-data1-v2.xlsx
-
Figure 1—source data 2
In vitro T cell assay – T cells in division after contact with wild-type (WT) dendritic cells (DCs) after ON and OFF stimulation.
- https://cdn.elifesciences.org/articles/78995/elife-78995-fig1-data2-v2.xlsx
-
Figure 1—source data 3
Co-stimulators on wild-type (WT) dendritic cells (DCs) after ON and OFF stimulation.
- https://cdn.elifesciences.org/articles/78995/elife-78995-fig1-data3-v2.xlsx
Figure 1—figure supplement 1
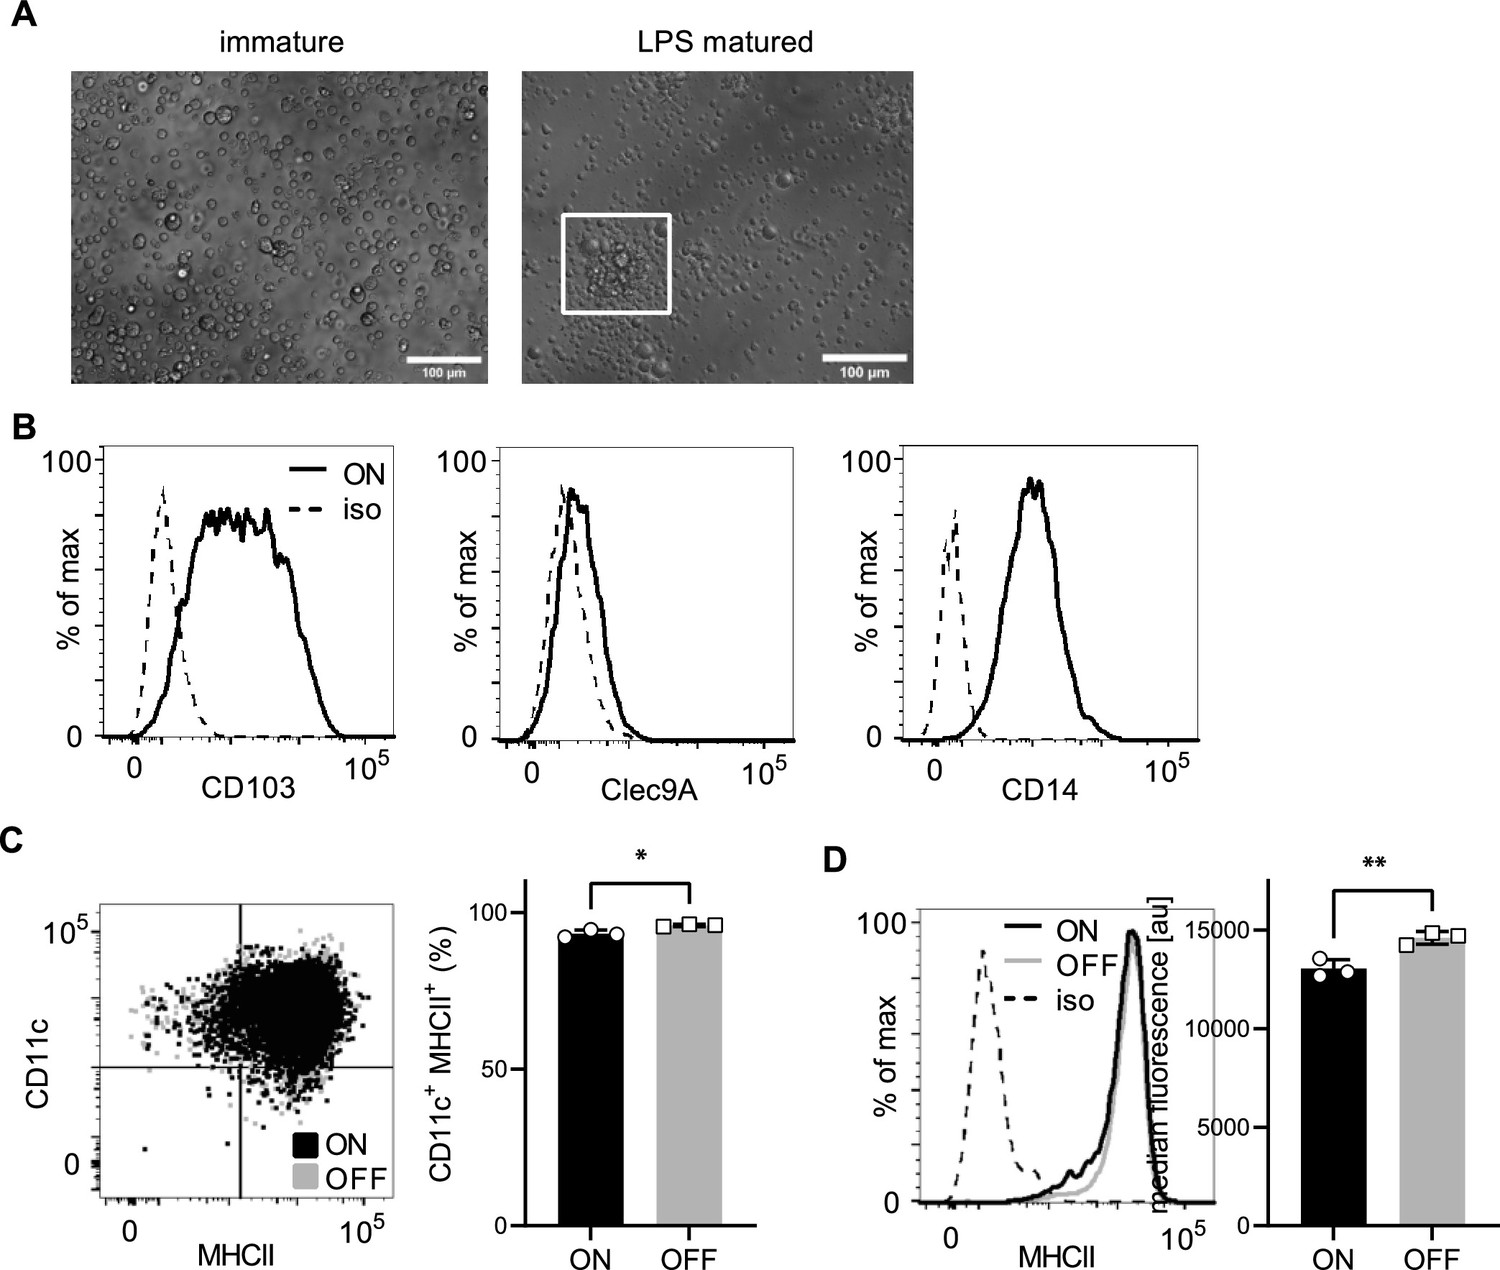
In vitro generated dendritic cells (DCs) from Hoxb8-progenitor cells resemble iCD103 DCs and differentiation of cells is not different after uropathogenic E. coli (UPEC) ON and OFF stimulation.
(A) Upon stimulation with recombinant lipopolysaccharide (LPS) (200 ng/ml) immature DCs change to a mature phenotype and cluster together (see cells highlighted in inlay). (B) In vitro generated iCD103 DCs express CD103, Clec9A, and CD14. (C) Differentiated DCs after ON (black) and OFF (gray) stimulation are defined by expression of CD11c integrin (DC marker) and upregulation of MHCII (activation marker) (left panel). Quantification of differentiated DCs after ON (black) and OFF (gray) stimulation (right panel) (three biological replicates). (D) Histograms of MHCII of wild-type (WT) DCs after stimulation with ON (black) and ON ΔfimH mutants (gray) (left panel; iso – isotype control). Quantification of median fluorescence values of MHCII (right panel) (three biological replicates). ns, not significant, *p < 0.1, **p < 0.05 by Student’s t-test; data are represented as means ± standard deviation (SD).
-
Figure 1—figure supplement 1—source data 1
Percent mature dendritic cells (DCs) after ON and OFF stimulation.
- https://cdn.elifesciences.org/articles/78995/elife-78995-fig1-figsupp1-data1-v2.xlsx
-
Figure 1—figure supplement 1—source data 2
MHCII expression after ON and OFF stimulation.
- https://cdn.elifesciences.org/articles/78995/elife-78995-fig1-figsupp1-data2-v2.xlsx
Figure 1—figure supplement 2
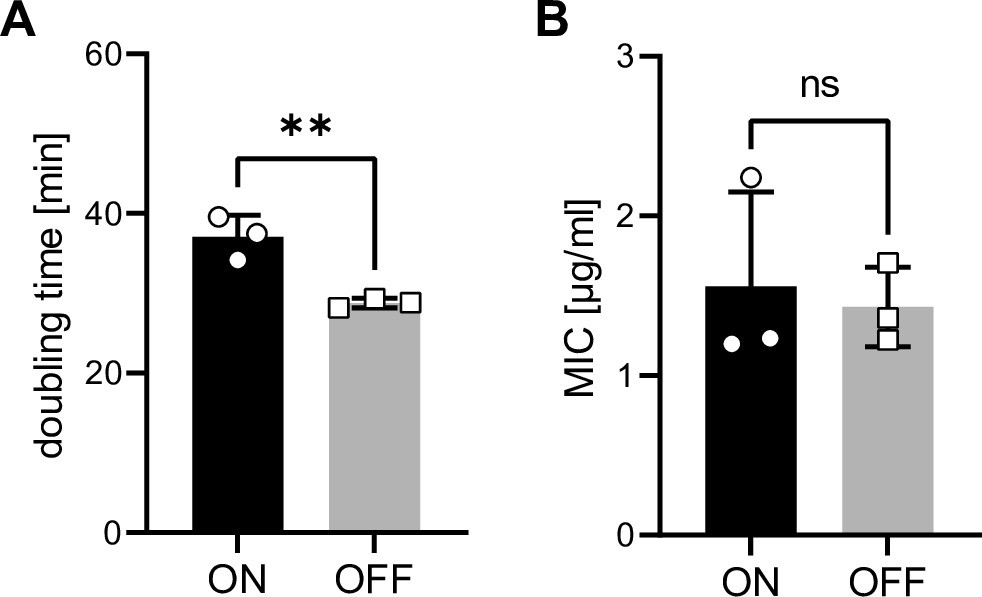
Uropathogenic E. coli (UPEC) ON and OFF bacteria exhibit slightly different growth rates but no difference in minimal inhibitory concentration (MIC) to gentamicin.
(A) Doubling time of ON and OFF bacteria in R10H20. (B) MIC to gentamicin for ON and OFF bacteria (MIC = 1.5 µg/ml; 5× MIC was used in the infection assays after 1 hr of co-culture of bacteria and dendritic cells [DCs]). ns, not significant, **p < 0.05 by Student’s t-test; data are represented as means ± standard deviation (SD).
-
Figure 1—figure supplement 2—source data 1
Growth rate and doubling time of ON and OFF uropathogenic E. coli (UPEC).
- https://cdn.elifesciences.org/articles/78995/elife-78995-fig1-figsupp2-data1-v2.xlsx
-
Figure 1—figure supplement 2—source data 2
Minimal inhibitory concentration (MIC) in R10H20 medium of ON and OFF uropathogenic E. coli (UPEC).
- https://cdn.elifesciences.org/articles/78995/elife-78995-fig1-figsupp2-data2-v2.xlsx
Figure 2 with 1 supplement
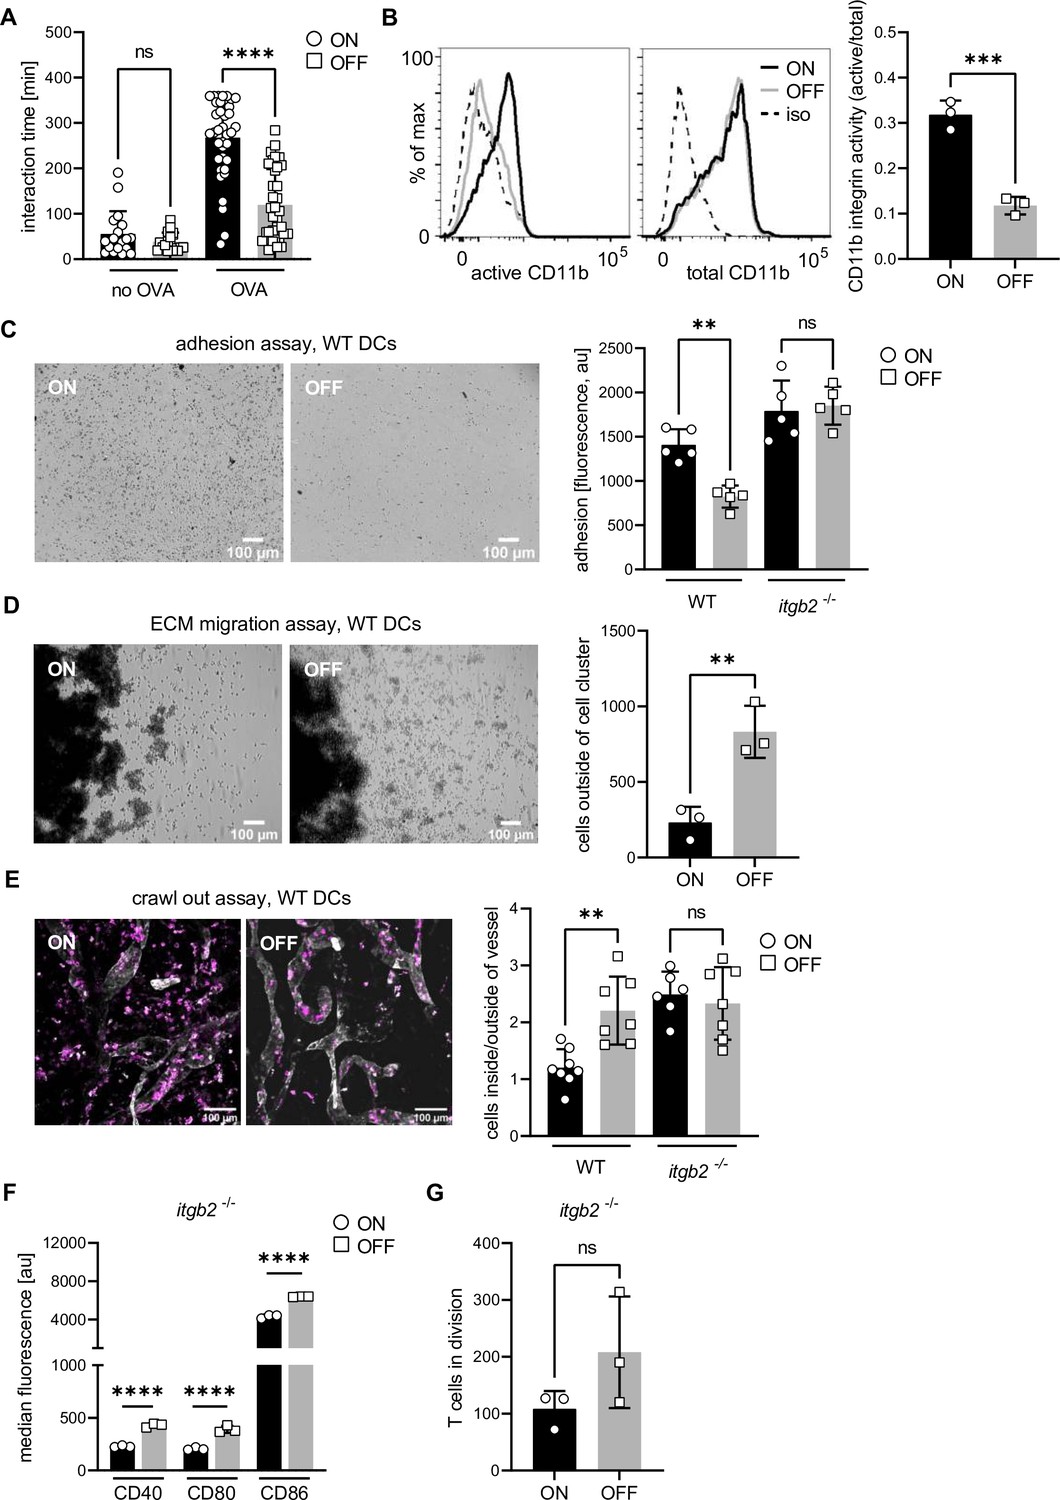
Overactivation of integrins increases dendritic cell (DC)–T cell contact time and adhesion of DCs to extracellular matrixes leading to decreased migratory capacity.
(A) Interaction time between ON and OFF stimulated DCs and T cells in the presence and absence of ovalbumin (OVA) peptide (two biological replicates). (B) Histograms of active and total CD11b integrin after ON (black) and OFF (gray) stimulation of DCs (left panel; iso – isotype control). Quantification of CD11b activity (active/total levels of CD11b) (right panel) (three biological replicates). (C) Adhesion assay of wild-type (WT) DCs after ON and OFF stimulation (left panel). Quantification of fluorescence signals, proxy for adherent cells, after ON (black) and OFF (gray) stimulation of WT and Itgb2−/− DCs (right panel) (five biological replicates) (see also Figure 2—figure supplement 1). (D) Extracellular matrix (ECM) migration assay of WT DCs after ON and OFF stimulation (left panel). Quantification of individual cells outside of cell cluster (right panel) (three biological replicates). (E) Ear crawl-out assay of WT DCs after ON and OFF stimulation. Endogenous DCs stained with anti-MHCII (magenta). Lymph vessels stained with anti-LYVE-1 (white) (left panel). Ratios of fluorescent signal inside and outside of lymph vessel after ON (black) and OFF (gray) stimulation of WT and Itgb2−/− DCs (right panel) (three biological replicates) (see also Figure 2—figure supplement 1). (F) Quantification of median fluorescence values of co-stimulatory molecules (CD40, CD80, and CD86) of Itgb2−/− DCs after stimulation with ON (black) and OFF (gray) (three biological replicates) (see also Figure 2—figure supplement 1). (G) Quantification of T cells in division after co-culture with Itgb2−/− DCs (three biological replicates) (see also Figure 2—figure supplement 1). ns, not significant, **p < 0.05, ***p < 0.01, ****p < 0.001 by one-way analysis of variance (ANOVA) followed by Dunnett’s multiple comparisons (A, C, and E) and by Student’s t-test (B, D, F, and G); data are represented as means ± standard deviation (SD).
-
Figure 2—source data 1
Dendritic cell (DC)–T cell contact times after ON and OFF stimulation.
- https://cdn.elifesciences.org/articles/78995/elife-78995-fig2-data1-v2.xlsx
-
Figure 2—source data 2
CD11b integrin staining of wild-type (WT) dendritic cells (DCs) after ON and OFF stimulation.
- https://cdn.elifesciences.org/articles/78995/elife-78995-fig2-data2-v2.xlsx
-
Figure 2—source data 3
Adhesion assay of wild-type (WT) dendritic cells (DCs) – fluorescent values after ON and OFF stimulation.
- https://cdn.elifesciences.org/articles/78995/elife-78995-fig2-data3-v2.xlsx
-
Figure 2—source data 4
Extracellular matrix (ECM) migration assay of wild-type (WT) dendritic cells (DCs) – single cells outside of cell cluster after ON and OFF stimulation.
- https://cdn.elifesciences.org/articles/78995/elife-78995-fig2-data4-v2.xlsx
-
Figure 2—source data 5
Ear crawl-out assay after ON and OFF stimulation.
- https://cdn.elifesciences.org/articles/78995/elife-78995-fig2-data5-v2.xlsx
-
Figure 2—source data 6
Co-stimulators on Itgb2−/− dendritic cells (DCs) after ON and OFF stimulation.
- https://cdn.elifesciences.org/articles/78995/elife-78995-fig2-data6-v2.xlsx
-
Figure 2—source data 7
In vitro T cell assay – T cells in division after contact with Itgb2−/− dendritic cells (DCs) after ON and OFF stimulation.
- https://cdn.elifesciences.org/articles/78995/elife-78995-fig2-data7-v2.xlsx
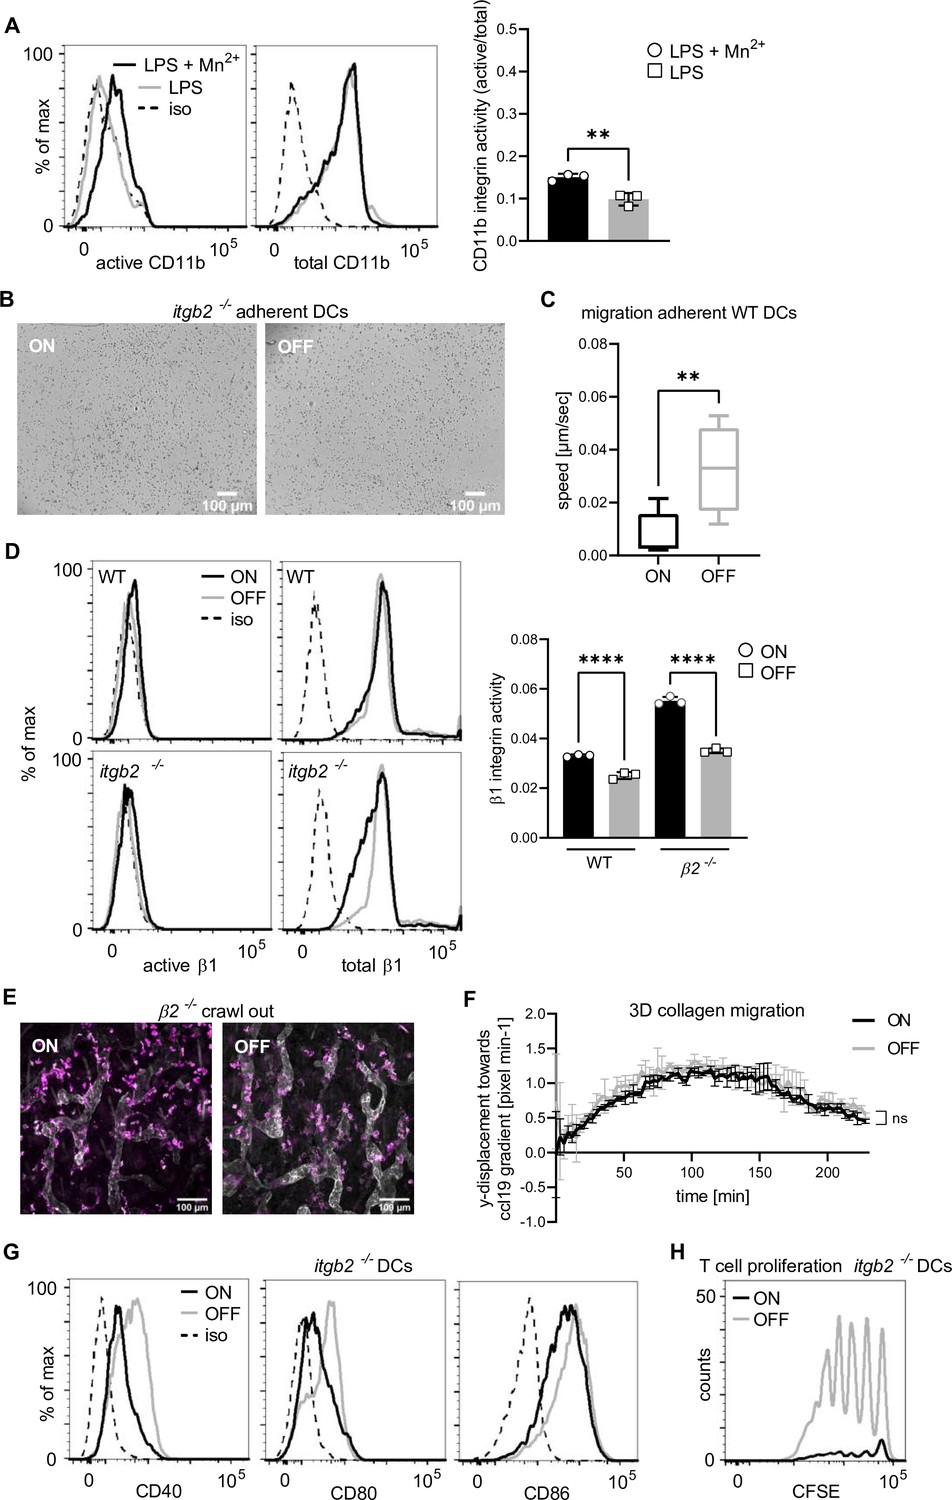
Figure 2—figure supplement 1
Type 1 piliated uropathogenic E. coli (UPECs) do not affect integrin-independent migration.
(A) Expression level of active and total CD11b integrin of wild-type (WT) dendritic cells (DCs) after lipopolysaccharide (LPS) plus Mn2+ stimulation (black) and LPS only stimulation (gray) (left panel; iso – isotype control). Quantification of CD11b integrin activity (active/total levels of CD11b) (right panel) (three biological replicates). (B) Adhesion assay of Itgb2−/− DCs after ON and OFF stimulation (quantification see Figure 2C). (C) Migration speed of adherent WT DCs in uniform CCL19 gradient (three biological replicates – ON 16 cells, OFF 8 cells). (D) Expression level of active and total β1 integrin after ON (black) and OFF (gray) stimulation of WT and Itgb2−/− DCs (left panel; iso – isotype control). Quantification of β1 integrin activity (active/total levels of CD11b) (right panel) (three biological replicates). It should be noted, that β1 integrin activity after UPEC ON stimulation of Itgb2−/− DCs might be artificially increased due to a slight decrease in total β1 integrin staining after ON stimulation. (E) Ear crawl-out assay of Itgb2−/− DCs after ON and OFF stimulation. Endogenous DCs stained with anti-MHCII (magenta). Lymph vessels stained with anti-LYVE-1 (white) (left panel) (quantification see Figure 2E). (F) 3D collagen migration assay of WT DCs after stimulation with ON (black) and OFF (gray) (three biological replicates). (G) Expression level of co-stimulatory molecules (CD40, CD80, and CD86) of Itgb2−/− DCs after stimulation with ON (black) and OFF (gray) (iso – isotype control) (quantification see Figure 2F). (H) CFSE dilution profile of T cells after 96 hr of co-culture with ON (black) and OFF (gray) stimulated Itgb2−/− DCs (quantification see Figure 2G). ns, not significant, **p < 0.05, ****p < 0.001 by one-way analysis of variance (ANOVA) followed by Dunnett’s multiple comparisons (D) and by Student’s t-test (A, C, and F); data are represented as means ± standard deviation (SD).
-
Figure 2—figure supplement 1—source data 1
CD11b integrin expression of wild-type (WT) dendritic cells (DCs) after lipopolysaccharide (LPS) and LPS + Mn treatment.
- https://cdn.elifesciences.org/articles/78995/elife-78995-fig2-figsupp1-data1-v2.xlsx
-
Figure 2—figure supplement 1—source data 2
Migration speed of adherent dendritic cells (DCs) after ON and OFF stimulation.
- https://cdn.elifesciences.org/articles/78995/elife-78995-fig2-figsupp1-data2-v2.xlsx
-
Figure 2—figure supplement 1—source data 3
Beta1 integrin activity on wild-type (WT) and Itgb2−/− dendritic cells (DCs) after ON and OFF stimulation.
- https://cdn.elifesciences.org/articles/78995/elife-78995-fig2-figsupp1-data3-v2.xlsx
-
Figure 2—figure supplement 1—source data 4
Migration in 3D collagen after ON and OFF stimulation.
- https://cdn.elifesciences.org/articles/78995/elife-78995-fig2-figsupp1-data4-v2.xlsx
Figure 3 with 1 supplement
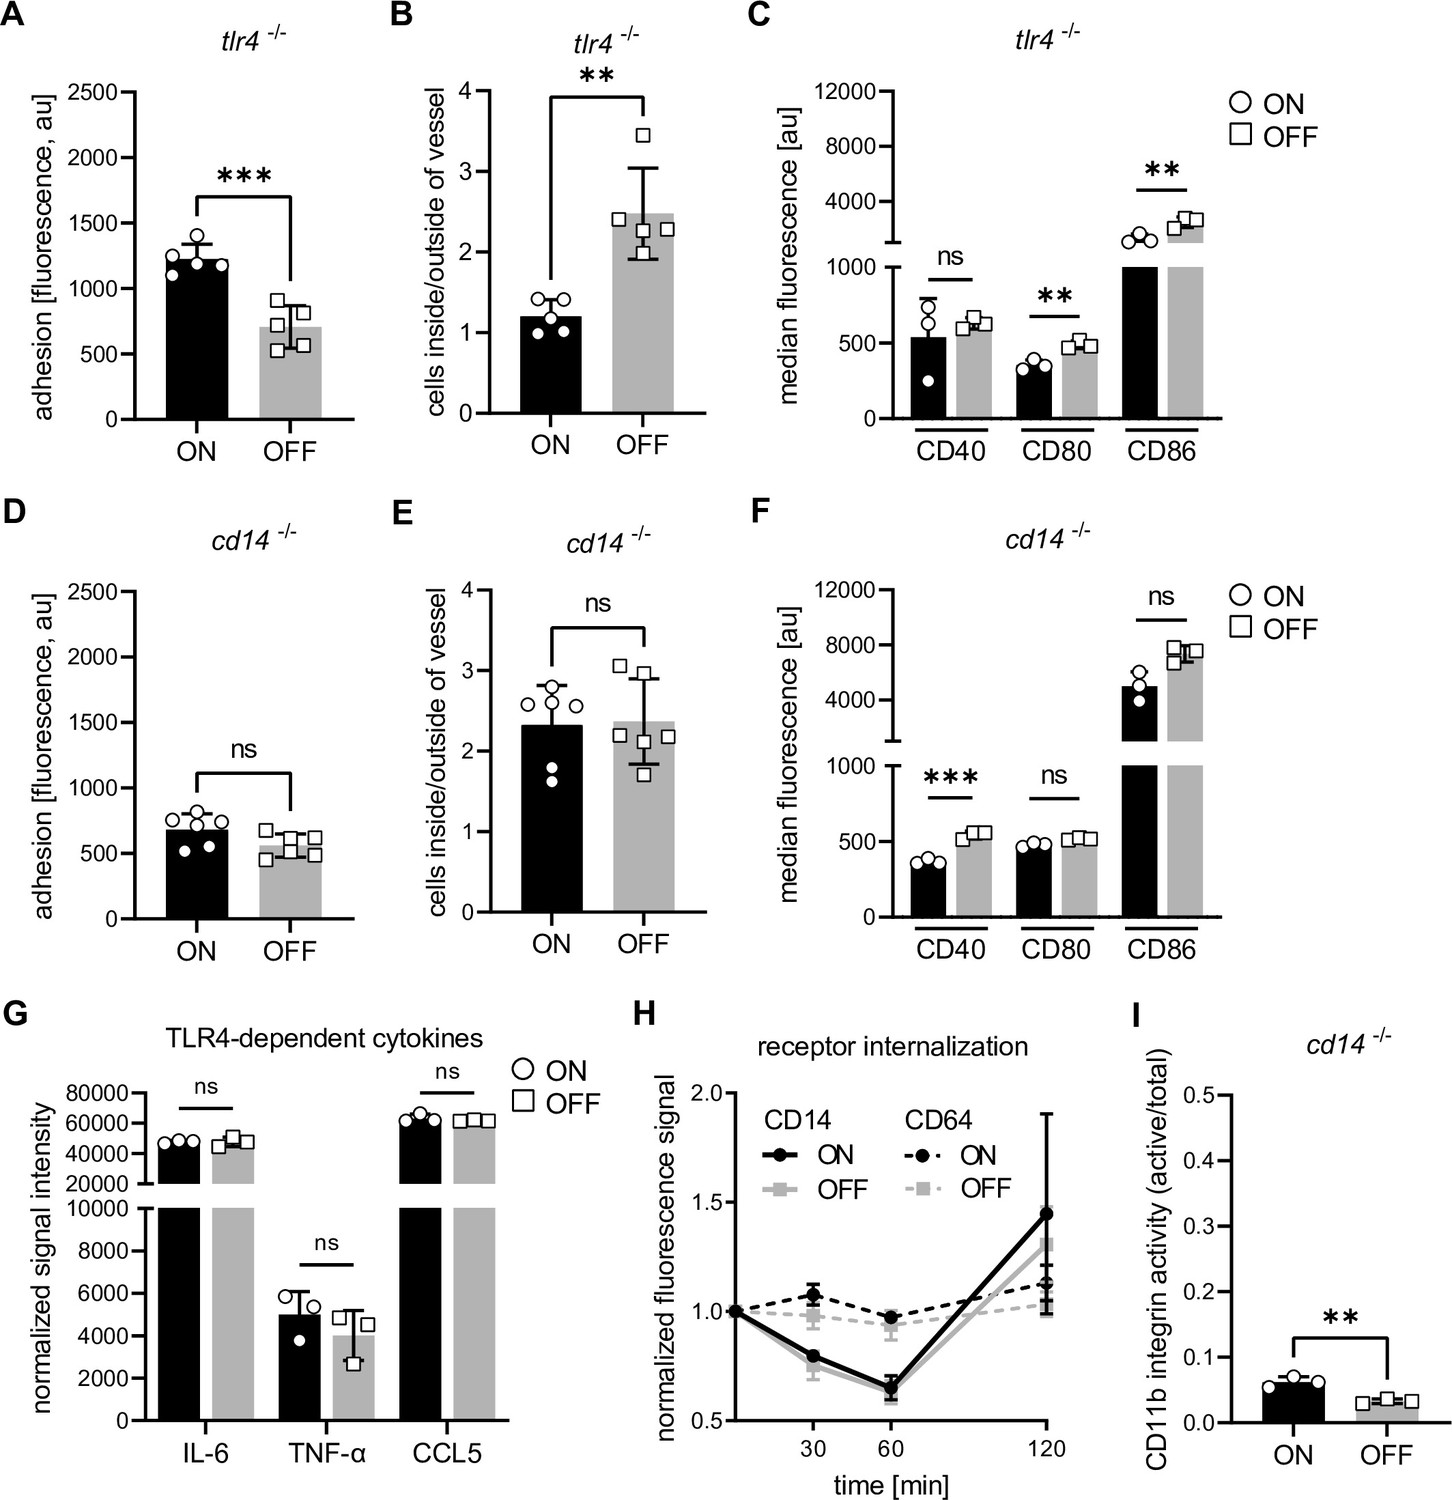
Interaction of type 1 piliated uropathogenic E. coli (UPEC) with CD14, but not TLR4, is important for the observed phenotypes.
(A) Adhesion assay of Tlr4−/− dendritic cells (DCs). Quantification of fluorescence signal after ON (black) and OFF (gray) stimulation (five biological replicates) (see also Figure 3—figure supplement 1). (B) Ratios of fluorescent signal inside and outside of lymph vessel after ON (black) and OFF (gray) stimulation Tlr4−/− DCs (two biological replicates) (see also Figure 3—figure supplement 1). (C) Quantification of median fluorescence values of co-stimulatory molecules (CD40, CD80, and CD86) on Tlr4−/− DCs stimulated with ON (black) and OFF (gray) (three biological replicates) (see also Figure 3—figure supplement 1). (D) Quantification of the adhesion assay of Cd14−/− DCs after ON (black) and OFF (gray) stimulation (six biological replicates) (see also Figure 3—figure supplement 1). (E) Ratios of fluorescent signal inside and outside of lymph vessel after ON (black) and OFF (gray) stimulation Cd14−/− DCs (three biological replicates) (see also Figure 3—figure supplement 1). (F) Quantification of median fluorescence values of co-stimulatory molecules (CD40, CD80, and CD86) on Cd14−/− DCs stimulated with ON (black) and OFF (gray) (three biological replicates) (see also Figure 3—figure supplement 1). (G) Cytokine production of ON (black) and OFF (gray) stimulated DCs. Normalized signal intensities of TLR4-dependent cytokines are shown (three biological replicates). (H) Receptor endocytosis on wild-type (WT) DCs stimulated with ON (black) and OFF (gray). CD14 receptor (solid lines) was stained on DCs fixed at indicated time points. CD64 receptor (dashed lines) served as endocytosis control (three biological replicates). (I) Quantification of CD11b activity (active/total levels of CD11b) of Cd14−/− DCs stimulated with ON (black) and OFF (gray) (three biological replicates) (see also Figure 3—figure supplement 1). ns, not significant, **p < 0.05, ***p < 0.01 by Student’s t-test; data are represented as means ± standard deviation (SD).
-
Figure 3—source data 1
Adhesion assay Tlr4−/− dendritic cells (DCs) – fluorescent values after ON and OFF stimulation.
- https://cdn.elifesciences.org/articles/78995/elife-78995-fig3-data1-v2.xlsx
-
Figure 3—source data 2
Ear crawl-out assay Tlr4−/− mice after ON and OFF stimulation.
- https://cdn.elifesciences.org/articles/78995/elife-78995-fig3-data2-v2.xlsx
-
Figure 3—source data 3
Co-stimulators on Tlr4−/− dendritic cells (DCs) after ON and OFF stimulation.
- https://cdn.elifesciences.org/articles/78995/elife-78995-fig3-data3-v2.xlsx
-
Figure 3—source data 4
Adhesion assay Cd14−/− dendritic cells (DCs) – fluorescent values after ON and OFF stimulation.
- https://cdn.elifesciences.org/articles/78995/elife-78995-fig3-data4-v2.xlsx
-
Figure 3—source data 5
Ear crawl-out assay Cd14−/− mice after ON and OFF stimulation.
- https://cdn.elifesciences.org/articles/78995/elife-78995-fig3-data5-v2.xlsx
-
Figure 3—source data 6
Co-stimulators on Cd14−/− dendritic cells (DCs) after ON and OFF stimulation.
- https://cdn.elifesciences.org/articles/78995/elife-78995-fig3-data6-v2.xlsx
-
Figure 3—source data 7
Cytokine array – TLR4-dependent cytokines after ON and OFF stimulation.
- https://cdn.elifesciences.org/articles/78995/elife-78995-fig3-data7-v2.xlsx
-
Figure 3—source data 8
Receptor endocytosis – median fluorescence and normalized fluorescence after ON and OFF stimulation.
- https://cdn.elifesciences.org/articles/78995/elife-78995-fig3-data8-v2.xlsx
-
Figure 3—source data 9
CD11b integrin staining of Cd14−/− dendritic cells (DCs) after ON and OFF stimulation.
- https://cdn.elifesciences.org/articles/78995/elife-78995-fig3-data9-v2.xlsx
Figure 3—figure supplement 1
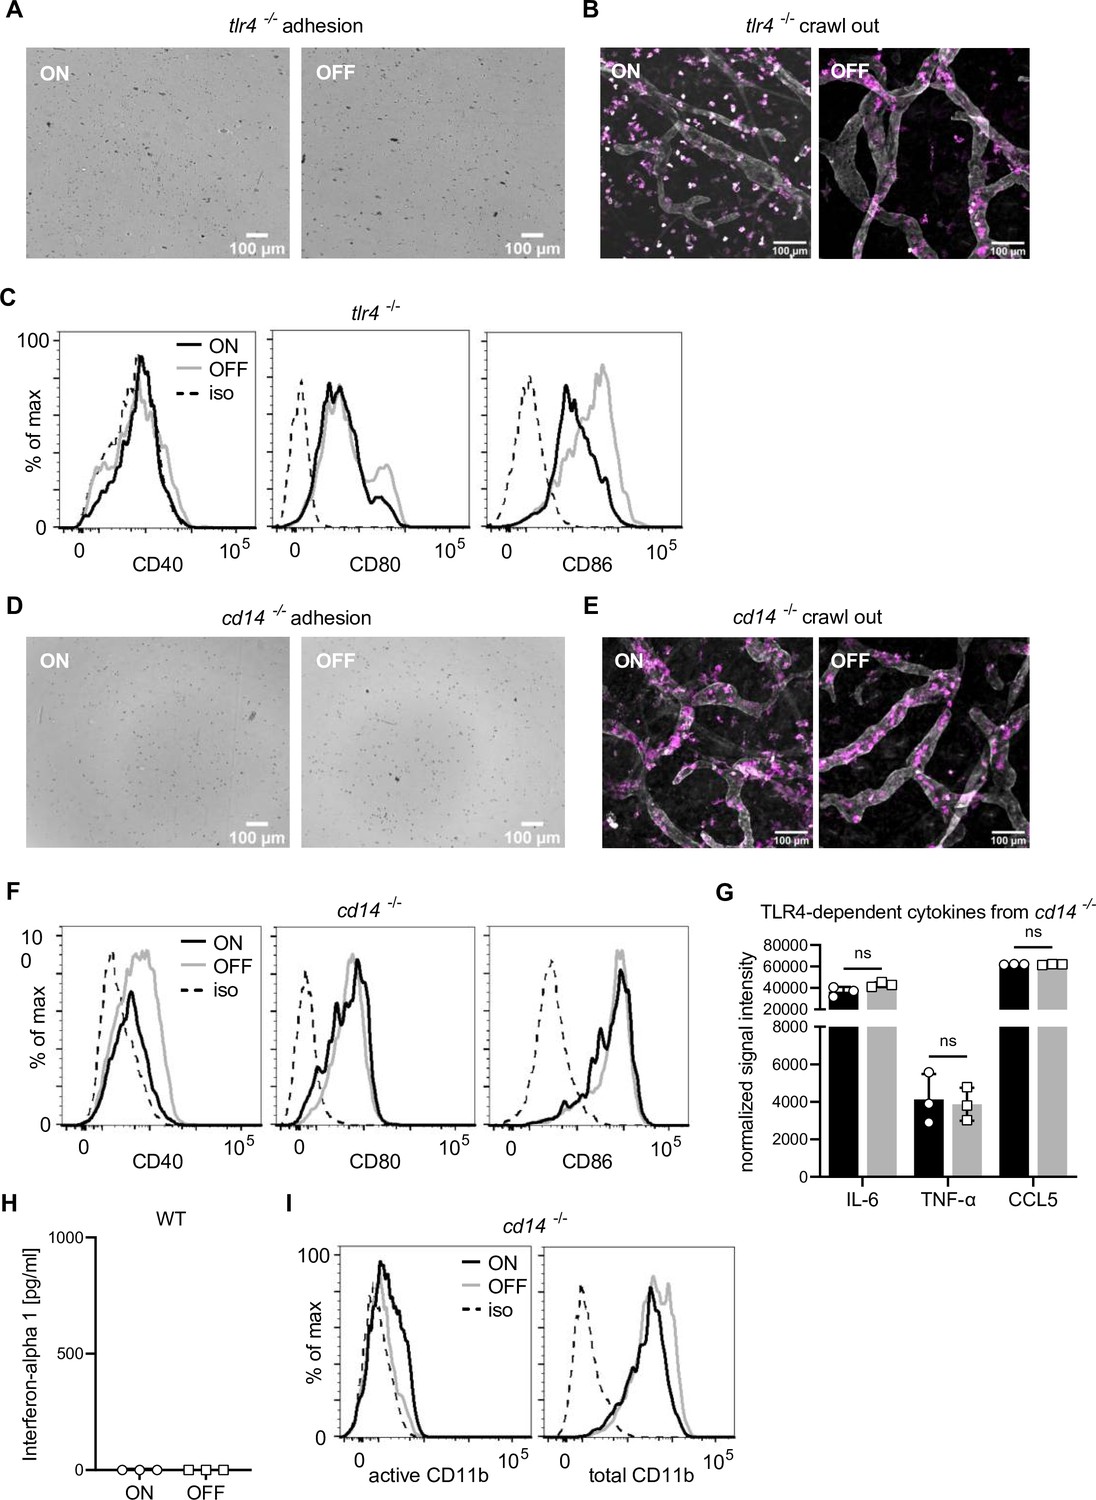
FimH and CD14, but not TLR4, are important for the observed adhesion phenotype.
(A) Adhesion assay of Tlr4−/− dendritic cells (DCs) after ON and OFF stimulation (quantification see Figure 3A). (B) Ear crawl-out assay of Tlr4−/− DCs after ON and OFF stimulation. Endogenous DCs stained with anti-MHCII (magenta). Lymph vessels stained with anti-LYVE-1 (white) (quantification see Figure 3B). (C) Expression level of co-stimulatory molecules (CD40, CD80, and CD86) of Tlr4−/− DCs after stimulation with ON (black) and OFF (gray) (iso – isotype control) (quantification see Figure 3C). (D) Adhesion assay of Cd14−/− DCs after ON and OFF stimulation (quantification see Figure 3D). (E) Ear crawl-out assay of Cd14−/− DCs after ON and OFF stimulation. Endogenous DCs stained with anti-MHCII (magenta). Lymph vessels stained with anti-LYVE-1 (white) (quantification see Figure 3E). (F) Expression level of co-stimulatory molecules (CD40, CD80, and CD86) of Cd14−/− DCs after stimulation with ON (black) and OFF (gray) (iso – isotype control) (quantification see Figure 3F). (G) Cytokine production of ON (black) and OFF (gray) stimulated Cd14−/− DCs. Normalized signal intensities of TLR4-dependent cytokines are shown (three biological replicates). (H) Interferon-alpha 1 production of ON (black) and OFF (gray) stimulated wild-type (WT) DCs. (I) Histograms of active and total CD11b integrin Cd14−/− DCs after ON (black) and OFF (gray) stimulation of DCs (iso – isotype control) (quantification see Figure 3I). ns, not significant by Student’s t-test; data are represented as means ± standard deviation (SD).
-
Figure 3—figure supplement 1—source data 1
Cytokine array – TLR4-dependent cytokines from Cd14−/− dendritic cells (DCs) after ON and OFF stimulation.
- https://cdn.elifesciences.org/articles/78995/elife-78995-fig3-figsupp1-data1-v2.xlsx
-
Figure 3—figure supplement 1—source data 2
Interferon-alpha 1 enzyme-linked immunosorbent assay (ELISA) after ON and OFF stimulation.
- https://cdn.elifesciences.org/articles/78995/elife-78995-fig3-figsupp1-data2-v2.xlsx
Figure 4 with 2 supplements
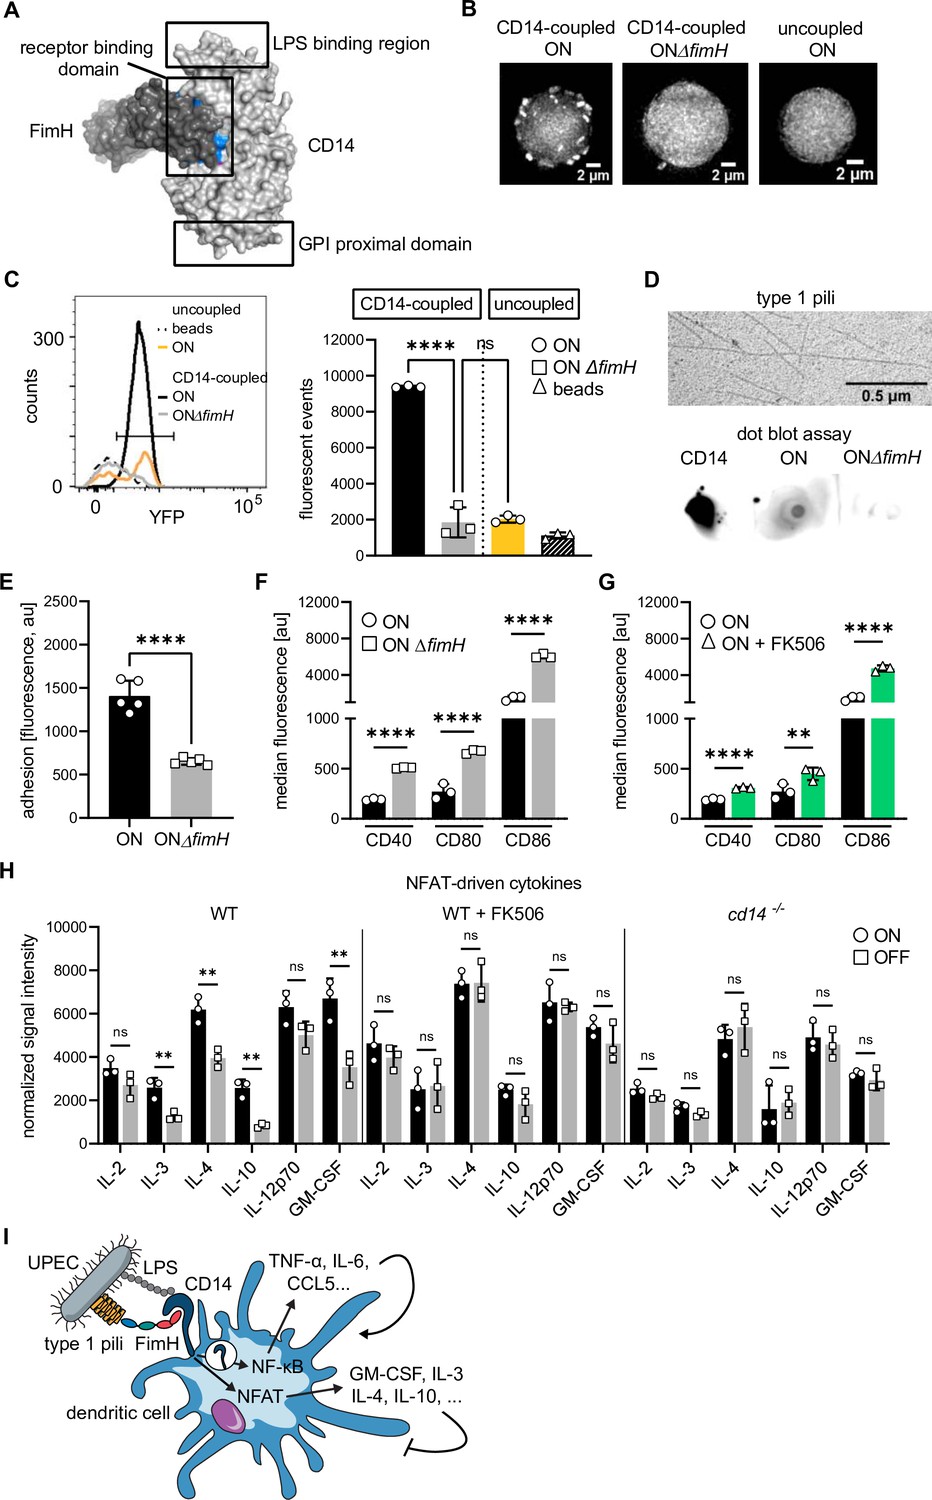
FimH binds to CD14 via protein–protein interactions and deletion of fimH rescues adhesion and expression of co-stimulatory molecules.
(A) In silico protein–protein docking analysis for FimH and CD14 (see also Supplementary files 1 and 3). FimH is shown in dark gray and CD14 in light gray. Surface plot of docked proteins from the view of CD14 on the membrane of the cell is shown. GPI proximal domain, lipopolysaccharide (LPS)- and receptor-binding domains are indicated. Top 10 amino acids predicted to interact during the binding are highlighted in blue for FimH and magenta for CD14 (most amino acids are buried inside the surface plot). (B) Microscopy images of bead-binding assay. ON or ON ΔfimH mutants expressing a constitutive yfp fluorescent marker bound to CD14-coupled or uncoupled beads are shown. (C) Flow cytometry analysis of bead-binding assay. Histogram of fluorescence events in the bacteria gate (left panel). Uncoupled beads (dashed black), ON bacteria bound to uncoupled beads (yellow), ON bacteria bound to CD14-coupled beads (black), ON ΔfimH mutants bound to CD14-coupled beads (gray). Quantification of fluorescent events in the bacterial gate (right panel) (three biological replicates) (gating strategy see Figure 4—figure supplement 2). (D) Type 1 pili extracts and dot blot assay. Electron microscopy images of type 1 pili extracts from ON bacteria (upper panel). Dot blot assay of type 1 pili extracts with biotinylated CD14 (lower panel). Pre-blotted biotinylated CD14 served as positive control. Bound CD14 was visualized with streptavidin–HRP antibody. (E) Quantification of fluorescence signals, proxy for adherent dendritic cells (DCs), after ON (black) and ON ΔfimH (gray) stimulation (five biological replicates) (see also Figure 4—figure supplement 1). ON data are the same as in Figure 2C. (F) Quantification of median fluorescence values of co-stimulatory molecules (CD40, CD80, and CD86) on wild-type (WT) DCs stimulated with ON (black) and ON ΔfimH mutants (gray) (three biological replicates) (see also Figure 4—figure supplement 1). ON data are the same as in Figure 1G. (G) Quantification of median fluorescence values of co-stimulatory molecules (CD40, CD80, and CD86) on WT DCs stimulated with ON (black) or ON after pre-treatment of DCs with 50 mM FK506 for 20 min prior to infection (green) (see also Figure 4—figure supplement 1). ON data are the same as in Figure 1G. (H) Cytokine production of ON (black) and OFF (gray) stimulated WT DCs, WT DCs pretreated with FK506 and Cd14−/− DCs. Normalized signal intensities of NFAT-dependent cytokines are shown (three biological replicates). (I) Schematic of uropathogenic E. coli (UPEC) binding to DCs. Type 1 piliated UPEC bind to CD14 receptor via FimH and LPS. LPS binding stimulates CD14 endocytosis and NF-κB-dependent cytokine expression (TNF-α, IL-6, CCL5, etc.) stimulating DC maturation. FimH binding stimulates NFAT pathway and expression of immune-modulatory cytokines (GM-CSF, IL-3, IL-4, IL-10, etc.). ns, not significant, **p < 0.05, ****p < 0.001 by one-way analysis of variance (ANOVA) followed by Dunnett’s multiple comparisons (C) and by Student’s t-test (E–H); data are represented as means ± standard deviation (SD).
-
Figure 4—source data 1
Bead-binding assay – fluorescent events inside bacteria gate after incubation with ON and ON ΔfimH bacteria.
- https://cdn.elifesciences.org/articles/78995/elife-78995-fig4-data1-v2.xlsx
-
Figure 4—source data 2
Adhesion assay of wild-type (WT) dendritic cells (DCs) – fluorescent values after ON and ON ΔfimH stimulation.
- https://cdn.elifesciences.org/articles/78995/elife-78995-fig4-data2-v2.xlsx
-
Figure 4—source data 3
Co-stimulators on wild-type (WT) dendritic cells (DCs) after ON and ON ΔfimH stimulation.
- https://cdn.elifesciences.org/articles/78995/elife-78995-fig4-data3-v2.xlsx
-
Figure 4—source data 4
Co-stimulators on wild-type (WT) dendritic cells (DCs) after ON stimulation with or without FK506.
- https://cdn.elifesciences.org/articles/78995/elife-78995-fig4-data4-v2.xlsx
-
Figure 4—source data 5
Cytokine array – NFAT-dependent cytokines after ON and OFF stimulation.
- https://cdn.elifesciences.org/articles/78995/elife-78995-fig4-data5-v2.xlsx
Figure 4—figure supplement 1
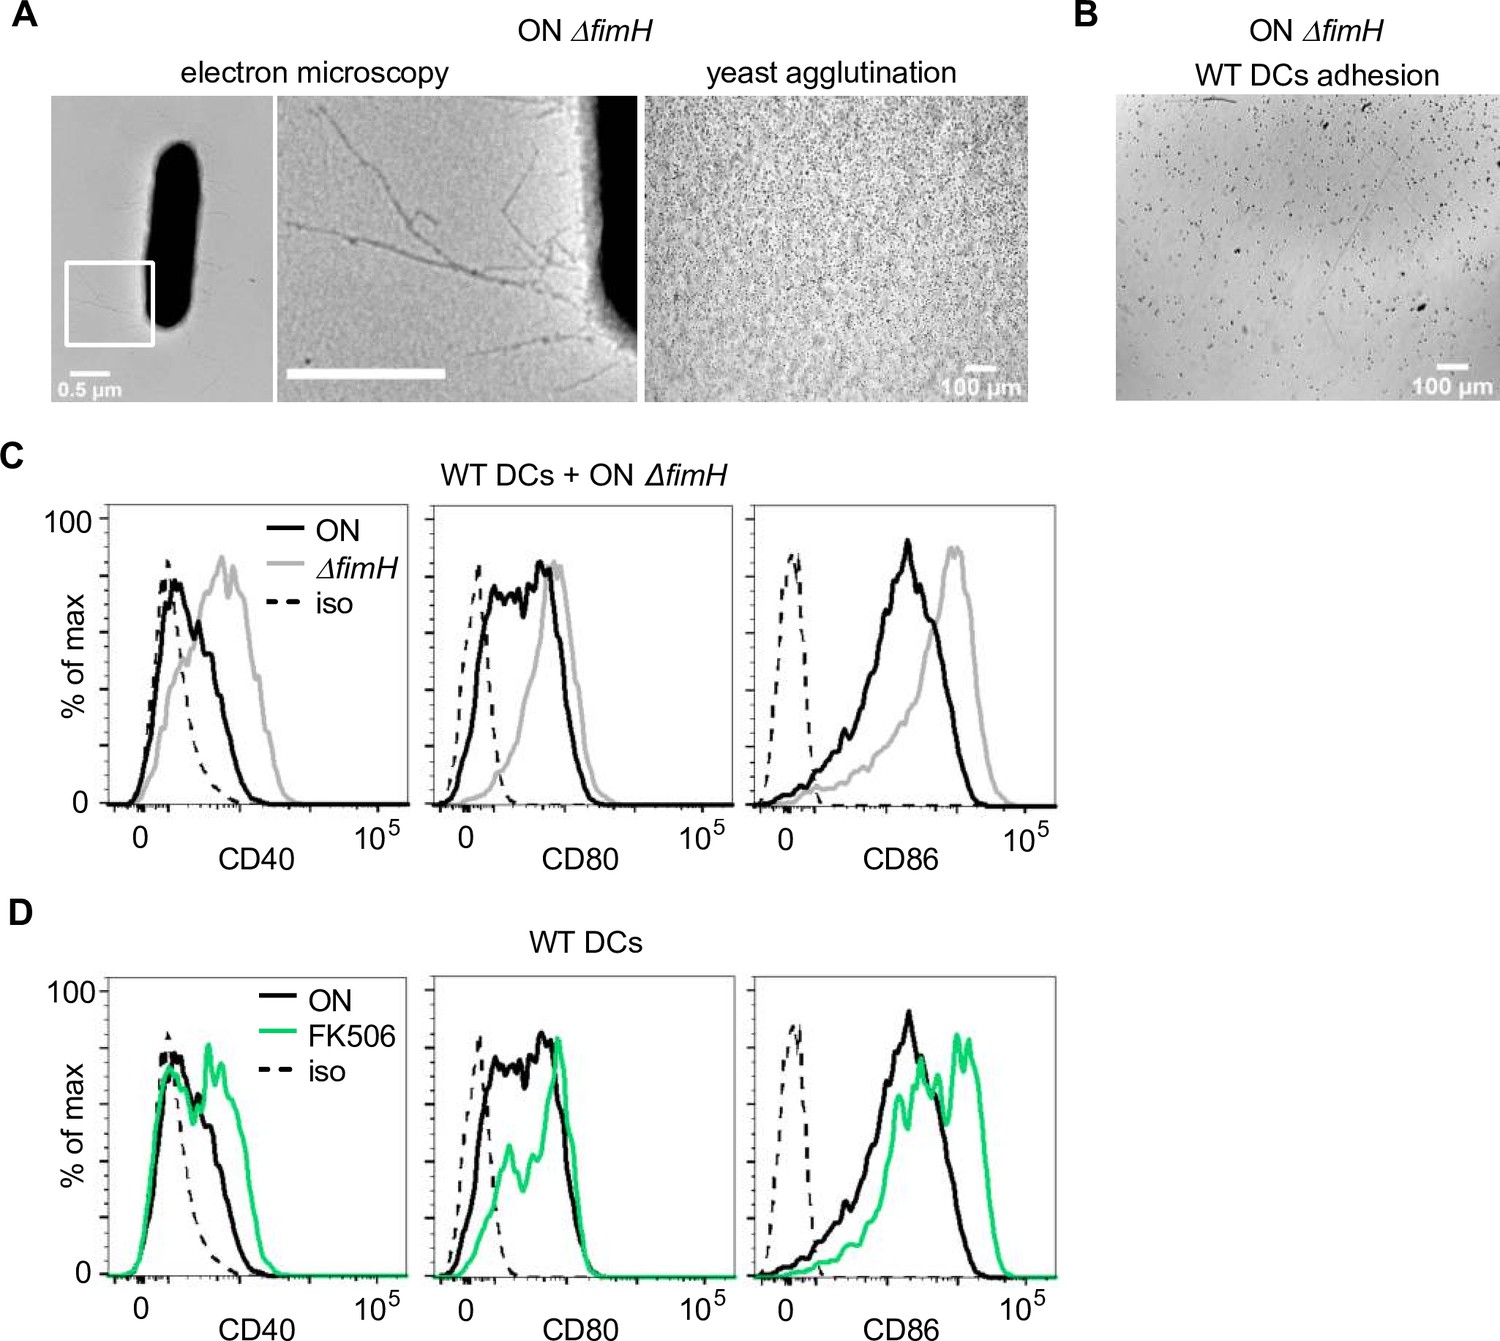
FimH is necessary for the observed phenotypes and binding of FimH to CD14 triggers overactivation of the NFAT pathway.
(A) Electron microscopy images, with zoomed in regions marked in inlays, (left panel) and yeast agglutination assay (right panel) of ON ΔfimH mutant. (B) Adhesion assay of dendritic cells (DCs) after ON ΔfimH stimulation (quantification see Figure 4E). (C) Expression level of co-stimulatory molecules (CD40, CD80, and CD86) of wild-type (WT) DCs after stimulation with ON (black) and ON ΔfimH mutants (gray) (iso – isotype control) (quantification see Figure 4F). (D) Expression level of co-stimulatory molecules (CD40, CD80, and CD86) of WT DCs after stimulation with ON (black) or ON after pre-treatment of DCs with 50 mM FK506 for 20 min prior to infection (green) (iso – isotype control) (quantification see Figure 4G).
Figure 4—figure supplement 2
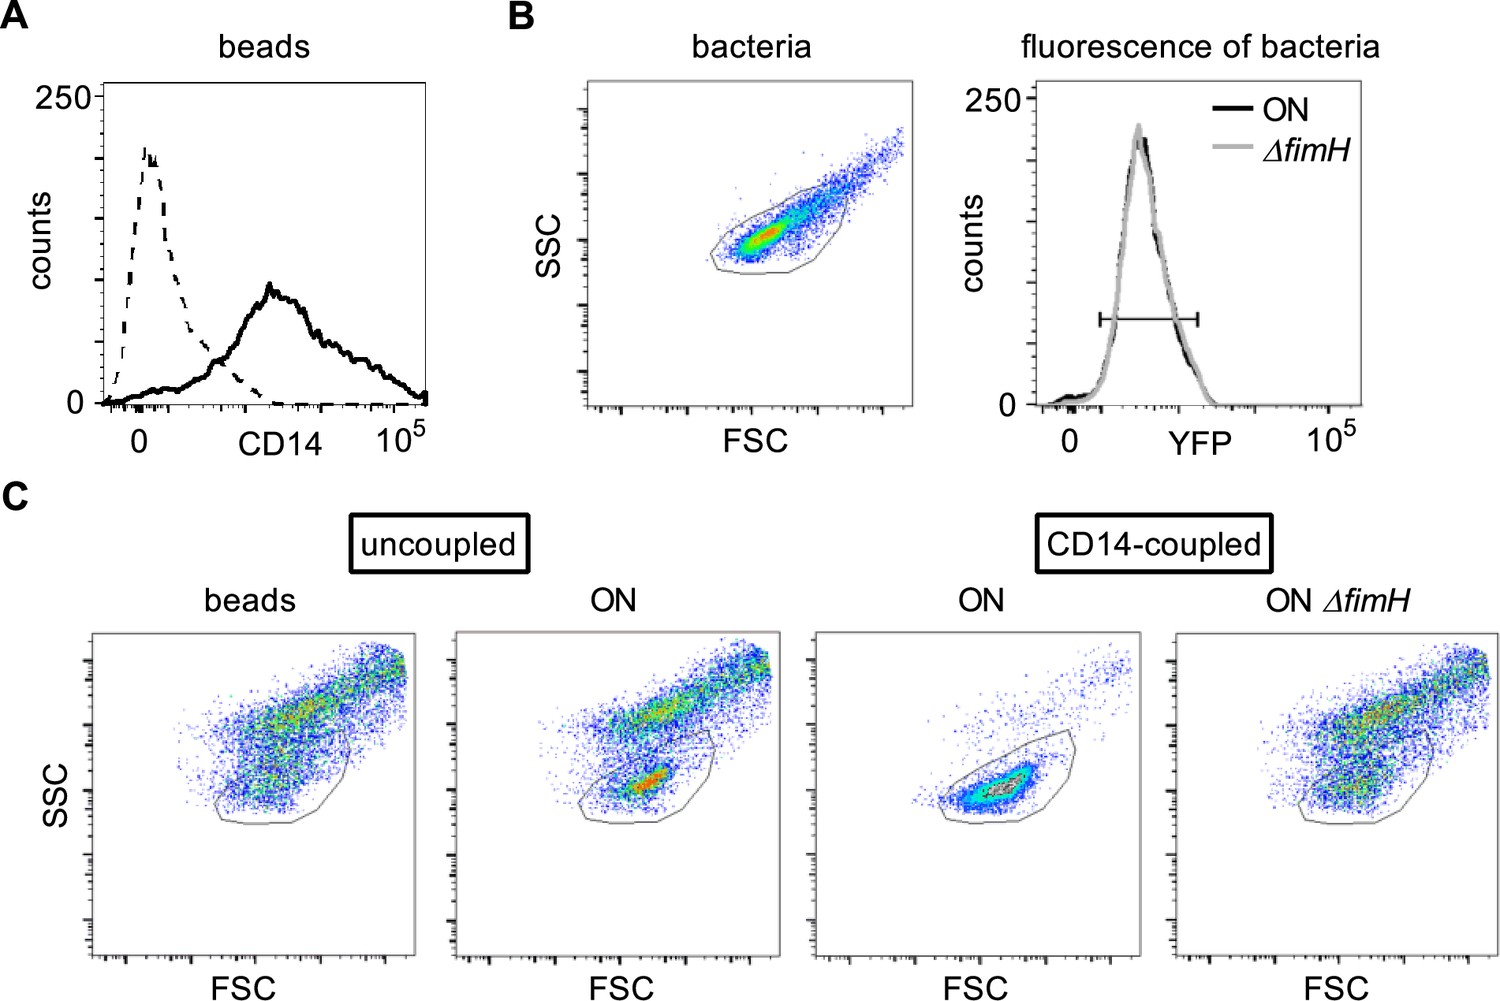
Bead assay using CD14-coupled magnetic beads.
(A) Coupling of recombinant CD14-Fc to the magnetic Protein A beads was confirmed by staining with anti-CD14 antibody (dashed black – uncoupled beads, solid black – CD14-coupled beads). (B) The scatter properties for the bead assay were defined by FSC and SSC properties of the bacteria (left panel). The yfp fluorescence signal of ON (black) and ON ΔfimH (gray) in the bacteria gate was used to define the fluorescent properties for analysis (right panel). (C) Events (beads ± bacteria) in FSC and SSC were recorded and are shown as dot plots. The bacteria gate as defined in A is shown.
Figure 5 with 2 supplements
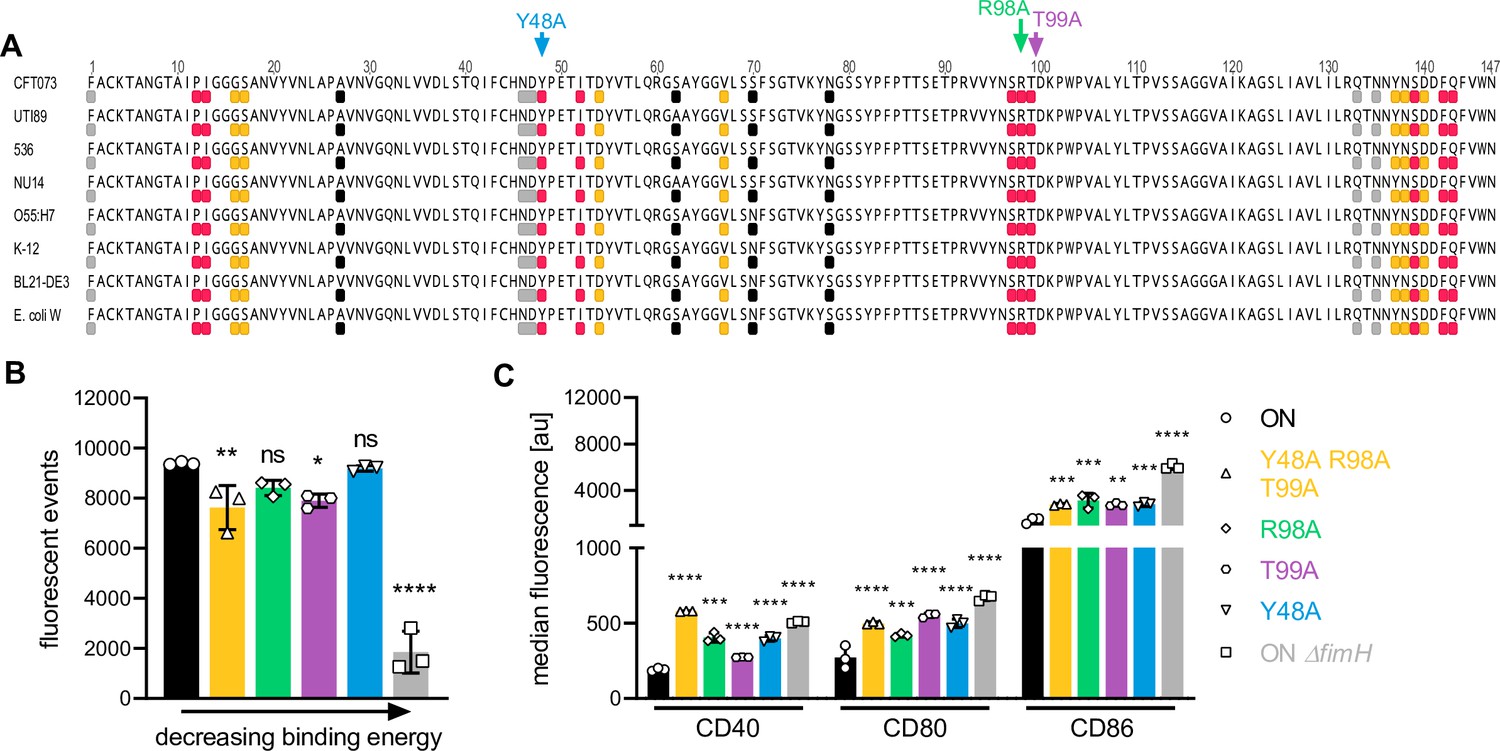
FimH binds to CD14 via highly conserved amino acid residues partially located in the mannose-binding domain.
(A) Receptor-binding domain of FimH from different E. coli strains is shown (uropathogenic E. coli [UPEC]: CFT073, UTI89, 536, NU14, EPEC: O55:H7; non-pathogenic; K-12, BL21-DE3, E. coli W). The top 10 amino acids on FimH showing strongest binding energy toward mouse CD14 (PDB: 1WWL) are shown in pink and toward human CD14 (PDB: 4GLP) are shown in orange. Amino acids I13, P12, and F42 are involved in both, mouse and human CD14, and therefore only shown in pink. Amino acids located in mannose-binding pocket and tyrosine gate are shown in gray. Amino acids I13, Y48, I52, Y137, and F142 are involved in mannose and CD14 binding and therefore only shown in pink. Common pathoadaptive mutations that differ between UPEC and non-pathogenic E. coli are shown in black. Amino acids mutated to generate FimH amino acid mutants were Y48 (binding energy −4.29 kcal/mol), T99 (binding energy −4.92 kcal/mol), and R98 (binding energy −7.23 kcal/mol) (see also Supplementary files 3 and 5). (B) Bead-binding assay of FimH amino acid mutants. Quantification of fluorescent events in the bacterial gate of ON (black), ON ΔfimH mutants (gray), and FimH amino acid mutants Y48A (blue), T99A (violet), R98A (green), and Y48A R98A T99A (yellow) (three biological replicates) (see also Figure 5—figure supplement 2). ON and ON ΔfimH data are the same as in Figure 4C. (C) Quantification of median fluorescence values of co-stimulatory molecules (CD40, CD80, and CD86) of wild-type (WT) dendritic cells (DCs) after stimulation with ON (black), ON ΔfimH mutants (gray), and FimH amino acid mutants Y48A (blue), T99A (violet), R98A (green), and Y48A R98A T99A (yellow) (three biological replicates) (see also Figure 5—figure supplement 2). ON and ON ΔfimH data are the same as in Figure 4F. ns, not significant, *p < 0.1, **p < 0.05, ***p < 0.01, ****p < 0.001 by one-way analysis of variance (ANOVA) followed by Dunnett’s multiple comparisons (the mean of the data were compared to the mean of ON); data are represented as means ± standard deviation (SD).
-
Figure 5—source data 1
Bead-binding assay – fluorescent events inside bacteria gate after incubation with amino acid mutants in FimH.
- https://cdn.elifesciences.org/articles/78995/elife-78995-fig5-data1-v2.xlsx
-
Figure 5—source data 2
Co-stimulators on wild-type (WT) dendritic cells (DCs) after stimulation with amino acids mutants in FimH.
- https://cdn.elifesciences.org/articles/78995/elife-78995-fig5-data2-v2.xlsx
Figure 5—figure supplement 1
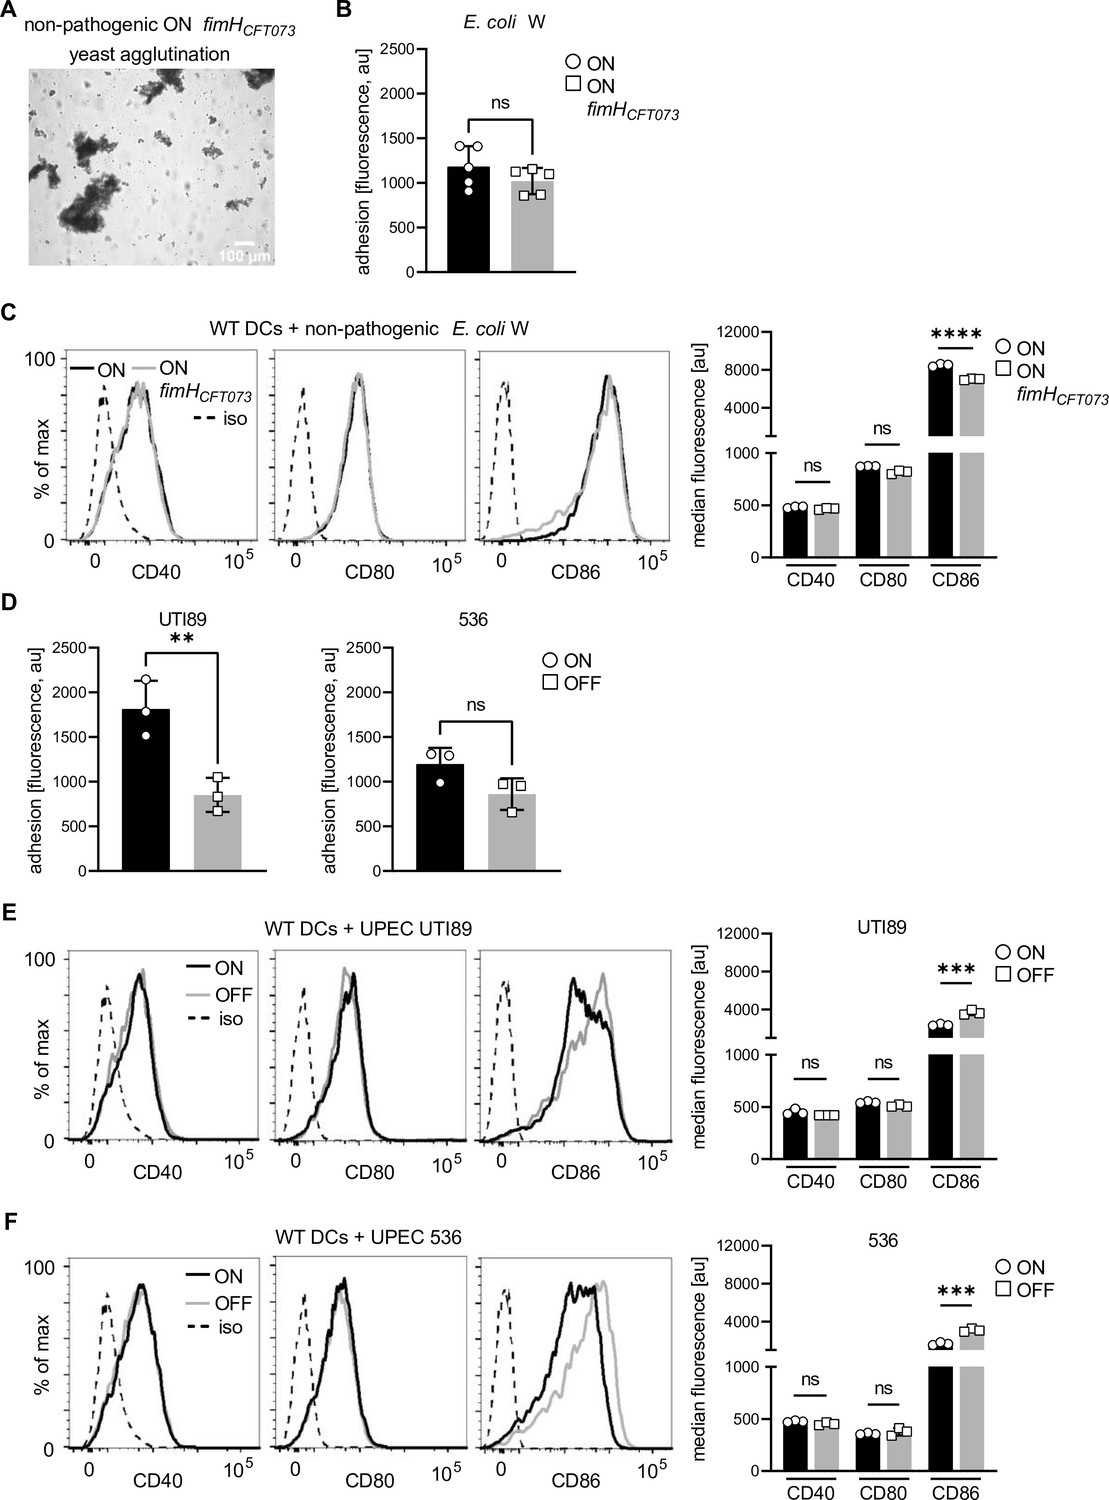
The quantitative effect depends on uropathogenic E. coli (UPEC) strain CFT073, but not on FimH from CFT073 alone.
(A) Yeast agglutination assay non-pathogenic ON mutant with pathogenic fimH (ON fimHCFT073). (B) Quantification of fluorescence signals, proxy for adherent dendritic cells (DCs), after ON (black) and ON fimHCFT073 (gray) stimulation of wild-type (WT) DCs (five biological replicates). (C) Expression levels of co-stimulatory molecules (CD40, CD80, and CD86) of WT DCs after stimulation with non-pathogenic ON (black) and non-pathogenic ON fimHCFT073 mutants (gray) (left panel; iso – isotype control). Quantification of median fluorescence values of co-stimulatory molecules (right panel) (three biological replicates). (D) Quantification of fluorescence signals, proxy for adherent DCs, after ON (black) and OFF (gray) stimulation of WT DCs with UPEC strain UTI89 and 536 (three biological replicates). (E) Expression levels of co-stimulatory molecules (CD40, CD80, and CD86) of WT DCs after stimulation with UTI89 ON (black) and OFF (gray) (left panel; iso – isotype control). Quantification of median fluorescence values of co-stimulatory molecules of WT DCs after stimulation with UTI89 ON (black) and OFF (gray) (three biological replicates). (F) Expression levels of co-stimulatory molecules (CD40, CD80, and CD86) of WT DCs after stimulation with 536 ON (black) and OFF (gray) (left panel; iso – isotype control). Quantification of median fluorescence values of co-stimulatory molecules of WT DCs after stimulation with 536 ON (black) and OFF (gray) (three biological replicates). ns, not significant, **p < 0.05, ***p < 0.01, ****p < 0.001 by Student’s t-test, data are represented as means ± standard deviation (SD).
-
Figure 5—figure supplement 1—source data 1
Adhesion assay of wild-type (WT) dendritic cells (DCs) – fluorescent values after ON and ON fimHCFT073 stimulation.
- https://cdn.elifesciences.org/articles/78995/elife-78995-fig5-figsupp1-data1-v2.xlsx
-
Figure 5—figure supplement 1—source data 2
Expression of co-stimulators on wild-type (WT) dendritic cells (DCs) after ON and ON fimHCFT073 stimulation.
- https://cdn.elifesciences.org/articles/78995/elife-78995-fig5-figsupp1-data2-v2.xlsx
-
Figure 5—figure supplement 1—source data 3
Adhesion assay of wild-type (WT) dendritic cells (DCs) – fluorescent values after stimulation with ON and OFF mutants from uropathogenic E. coli (UPEC) strains UTI89 and 536.
- https://cdn.elifesciences.org/articles/78995/elife-78995-fig5-figsupp1-data3-v2.xlsx
-
Figure 5—figure supplement 1—source data 4
Expression of co-stimulators on wild-type (WT) dendritic cells (DCs) after stimulation with ON and OFF mutants from uropathogenic E. coli (UPEC) strain UTI89.
- https://cdn.elifesciences.org/articles/78995/elife-78995-fig5-figsupp1-data4-v2.xlsx
-
Figure 5—figure supplement 1—source data 5
Expression of co-stimulators on wild-type (WT) dendritic cells (DCs) after stimulation with ON and OFF mutants from uropathogenic E. coli (UPEC) strain 536.
- https://cdn.elifesciences.org/articles/78995/elife-78995-fig5-figsupp1-data5-v2.xlsx
Figure 5—figure supplement 2
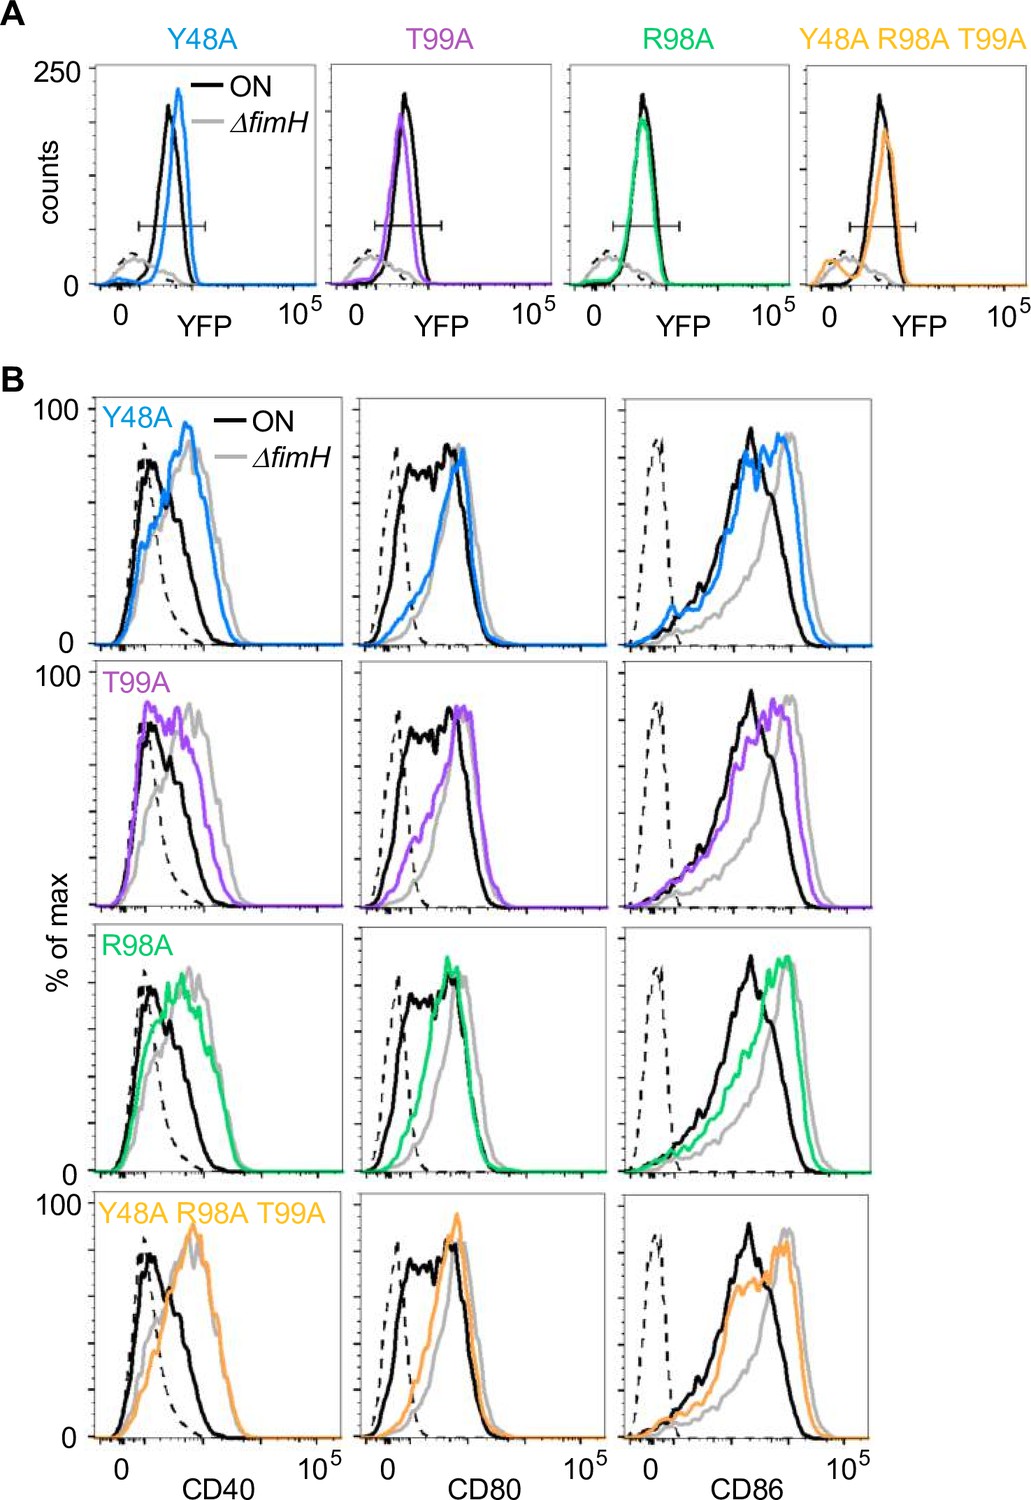
Analysis of amino acid mutants of FimH.
(A) Bead-binding assay with amino acid mutants. Fluorescence events in the bacteria gate of ON (black), ON ΔfimH (gray), Y48A (blue), T99A (violet), R98A (green), and Y48A R98A T99A (yellow) and uncoupled beads (dashed black) (quantification see Figure 5B). (B) Expression level of co-stimulatory molecules (CD40, CD80, and CD86) of wild-type (WT) dendritic cells (DCs) after stimulation with ON (black), ON ΔfimH (gray), Y48A (blue), T99A (violet), R98A (green), and Y48A R98A T99A (yellow) (iso – isotype control) (quantification see Figure 5C).
Figure 6 with 1 supplement
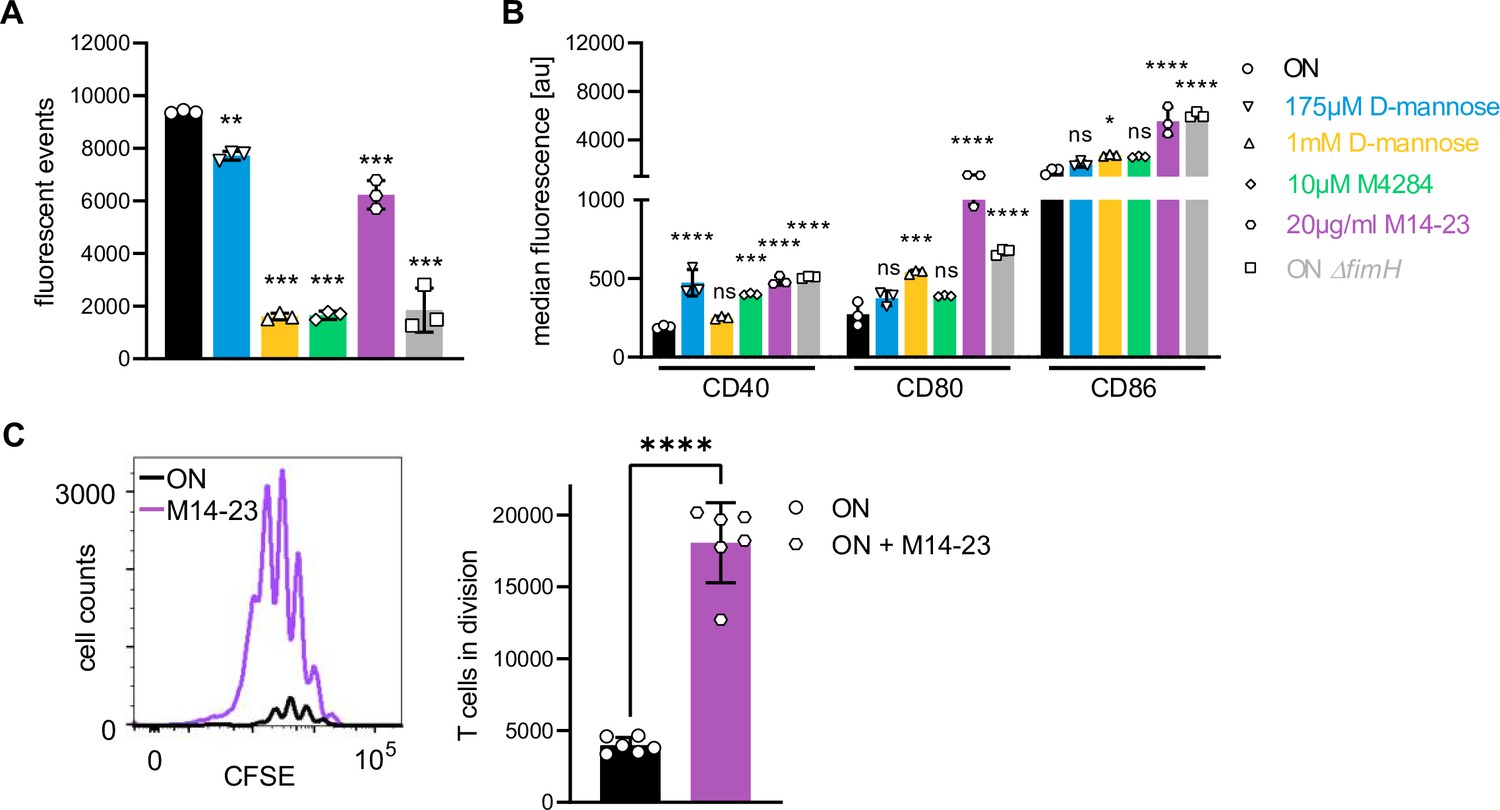
FimH antagonists and a blocking CD14 antibody (partially) block binding and rescue expression of co-stimulatory molecules on dendritic cells (DCs).
(A) Bead-binding assay of ON bacteria in the presence of FimH antagonists and blocking CD14 antibody. Quantification of fluorescent events in the bacterial gate of ON (black), ON ΔfimH mutants (gray), 175 µM D-mannose (blue), 1 mM D-mannose (yellow), 10 µM M4284 (green), and 20 µg/ml M14-23 antibody (violet) (three biological replicates) (see also Figure 6—figure supplement 1). ON and ON ΔfimH data are the same as in Figure 4E. (B) Quantification of median fluorescence values of co-stimulatory molecules (CD40, CD80, and CD86) of wild-type (WT) DCs after stimulation with ON (black), ON ΔfimH mutants (gray), and ON stimulation in the presence of 175 µM D-mannose (blue), 1 mM D-mannose (yellow), 10 µM M4284 (green), and 20 µg/ml M14-23 antibody (violet) (three biological replicates) (see also Figure 6—figure supplement 1). ON and ON ΔfimH data are the same as in Figure 4H. (C) CFSE dilution profile of T cells after 96 hr of co-culture with ON (black) and ON in the presence of 20 µg/ml M14-23 antibody (violet) stimulated WT DCs (left panel). Quantification of T cells in division (right panel) (three biological replicates). ns, not significant, *p < 0.1, **p < 0.05, ***p < 0.01, ****p < 0.001 by one-way analysis of variance (ANOVA) followed by Dunnett’s multiple comparisons (A, B); the mean of the data were compared to the mean of ON and by Student’s t-test (C); data are represented as means ± standard deviation (SD).
-
Figure 6—source data 1
Bead-binding assay – fluorescent events inside bacteria gate after incubation of ON mutants in the presence of inhibitors.
- https://cdn.elifesciences.org/articles/78995/elife-78995-fig6-data1-v2.xlsx
-
Figure 6—source data 2
Co-stimulators on wild-type (WT) dendritic cells (DCs) after stimulation with ON mutants in the presence of inhibitors.
- https://cdn.elifesciences.org/articles/78995/elife-78995-fig6-data2-v2.xlsx
-
Figure 6—source data 3
In vitro T cells in proliferation after contact with wild-type (WT) dendritic cells (DCs) after stimulation with ON mutants and treatment with M14-23.
- https://cdn.elifesciences.org/articles/78995/elife-78995-fig6-data3-v2.xlsx
Figure 6—figure supplement 1
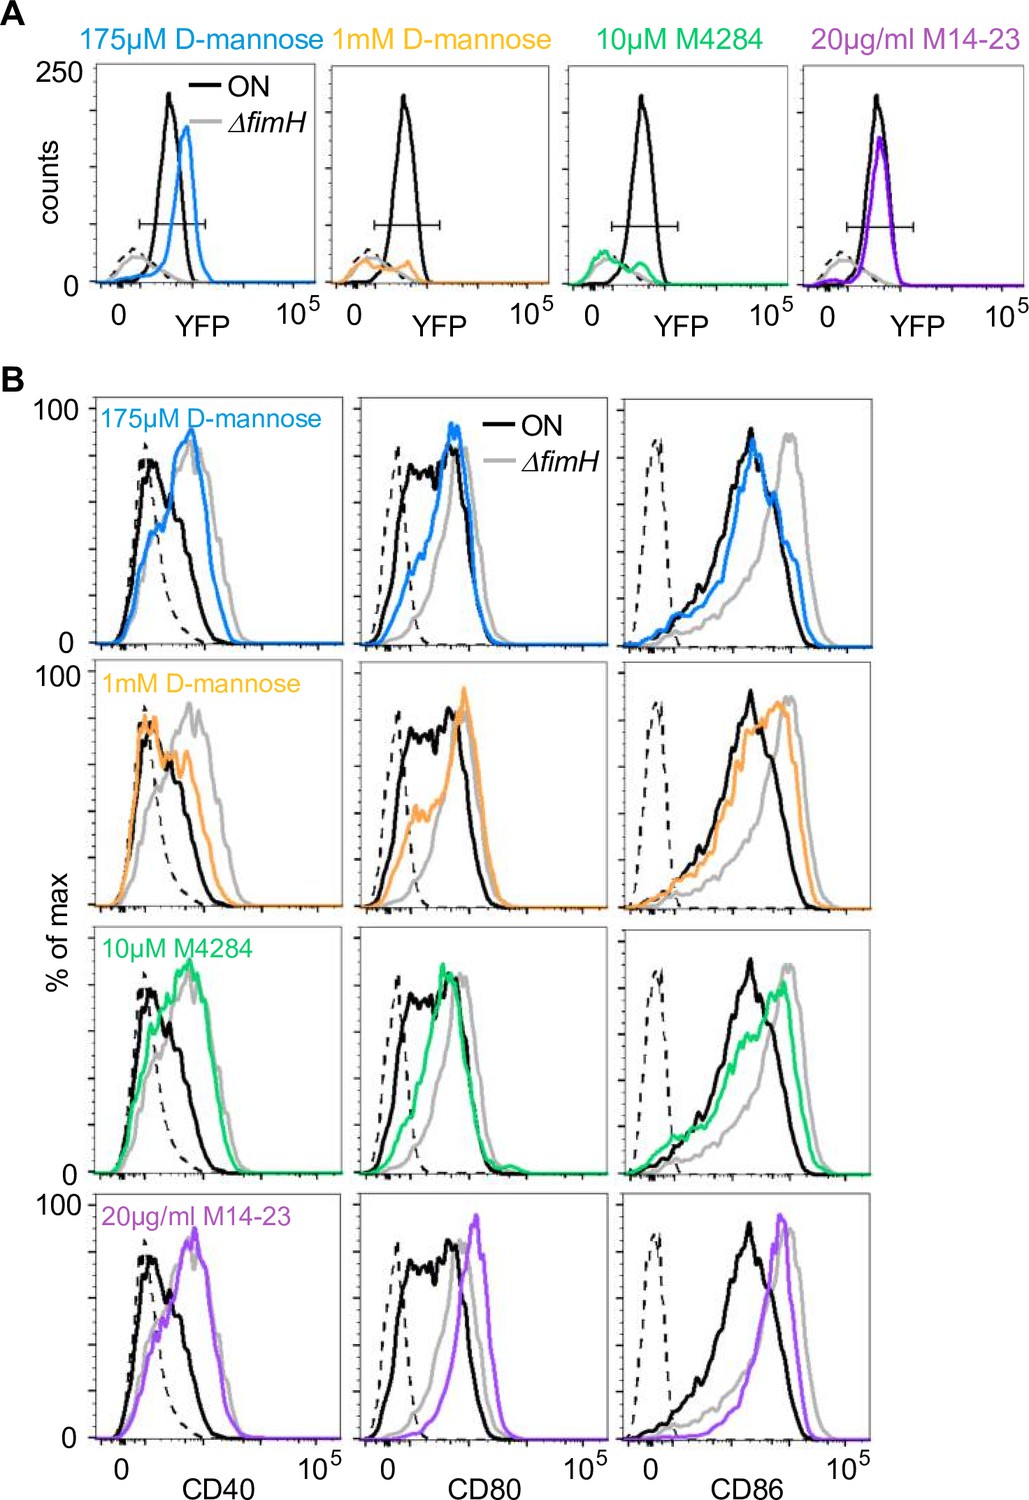
Analysis of FimH antagonists and a blocking CD14 antibody.
(A) Bead-binding assay with amino acid mutants. Fluorescence events in the bacteria gate of ON (black), ON ΔfimH mutants (gray), and ON stimulation in the presence of 175 µM D-mannose (blue), 1 mM D-mannose (yellow), 10 µM M4284 (green), and 20 µg/ml M14-23 antibody (violet) and uncoupled beads (dashed black) (quantification see Figure 6A). (B) Expression level of co-stimulatory molecules (CD40, CD80, and CD86) of wild-type (WT) dendritic cells (DCs) after stimulation with ON (black), ON ΔfimH mutants (gray), and ON stimulation in the presence of 175 µM D-mannose (blue), 1 mM D-mannose (yellow), 10 µM M4284 (green), and 20 µg/ml M14-23 antibody (violet) (iso – isotype control) (quantification see Figure 6B).
Figure 7
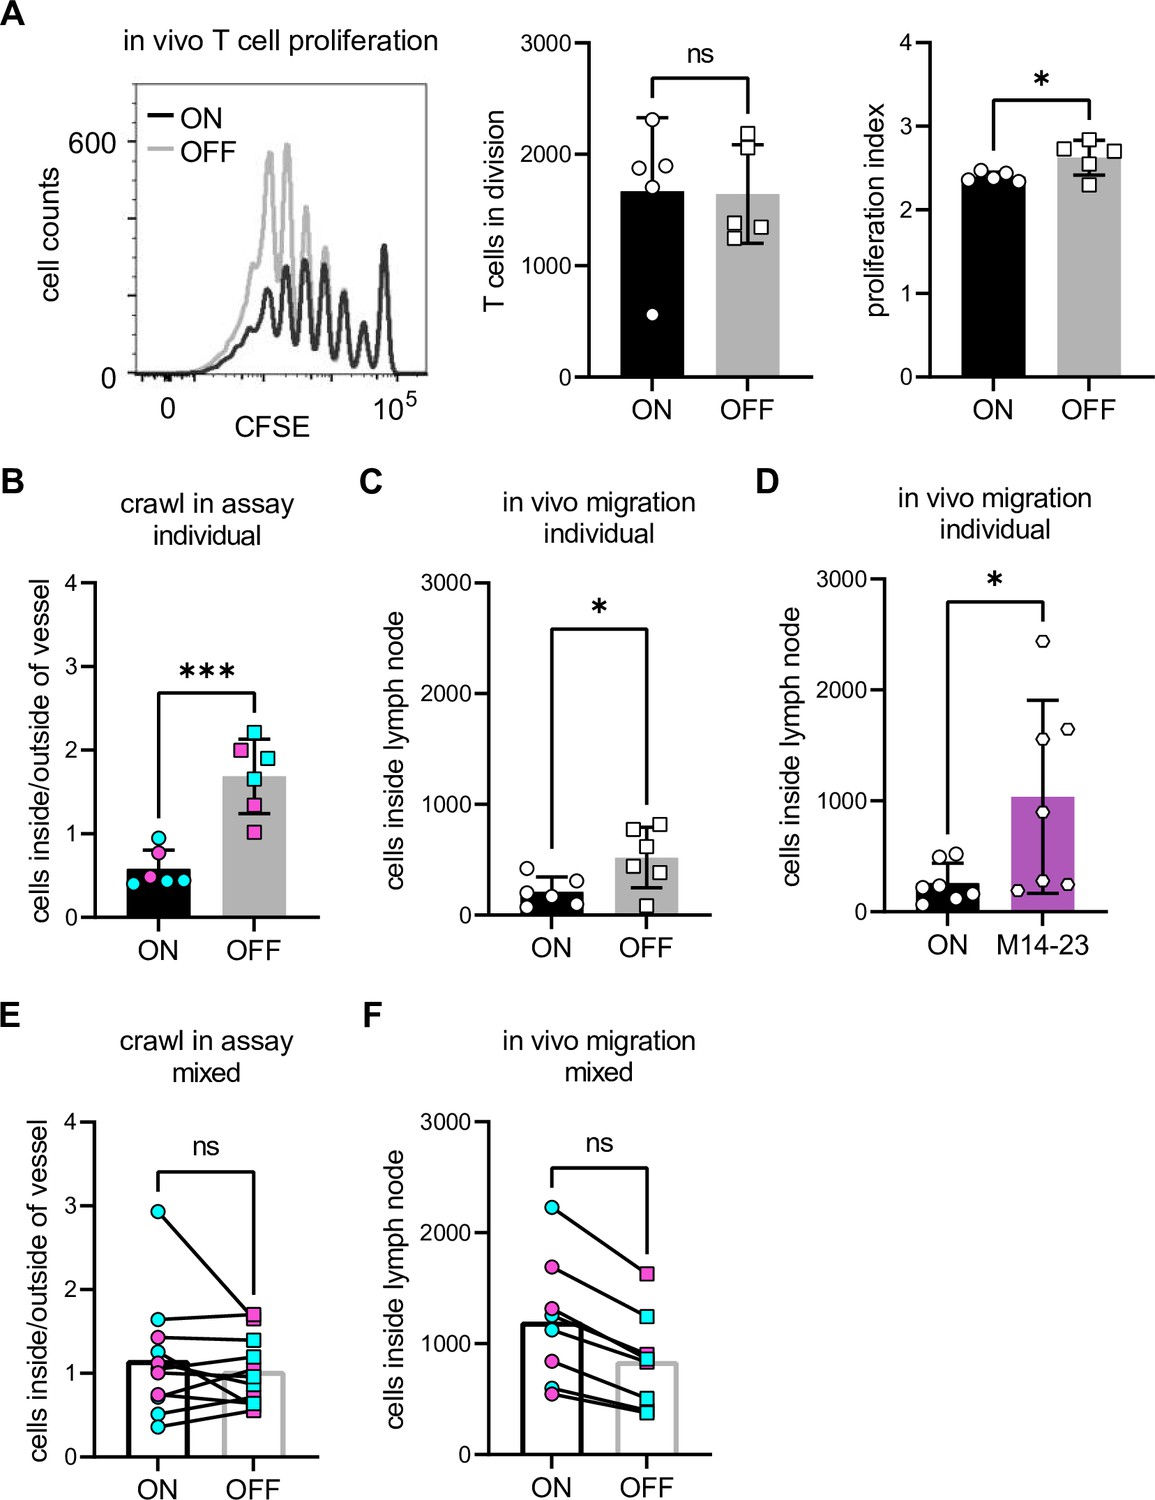
Immunosuppression of dendritic cells (DCs) by type 1 piliated uropathogenic E. coli (UPEC) is not cell autonomous.
(A) In vivo CFSE dilution profile of T cells after injection of ON (black) and OFF (gray) stimulated wild-type (WT) DCs (left panel). Quantification of T cells in division and the proliferation index (right panel) (three biological replicates). (B) Individual crawl-in assay of ON and OFF stimulated WT DCs. Ratios of fluorescent signal inside and outside lymph vessel after ON (black) and OFF (gray) stimulation. Exogenous DCs were stained with Oregon green (cyan) or TAMRA (Tetramethylrhodamine, magenta) and applied individually onto the ear sheets (six biological replicates). (C) Individual in vivo migration of WT DCs. Amount of DCs inside the popliteal lymph node after ON (black) and OFF (gray) stimulation. Exogenous DCs were stained with Oregon green and injected individually into the footpad of WT mice (six biological replicates). (D) Individual in vivo migration of WT DCs after treatment with blocking CD14 antibody. Amount of DCs inside the popliteal lymph node after ON stimulation (black) and ON stimulation in the presence of 20 µg/ml M14-23 antibody (violet). Exogenous DCs were stained with Oregon green and injected individually into the footpad of WT mice (seven biological replicates). (E) Mixed crawl-in assays. ON (black) and OFF (gray) stimulated cells were stained with either Oregon green (cyan) or TAMRA (magenta) and mixed in a 1:1 ratio before applying the cells onto the ear sheets (six biological replicates). (F) Mixed in vivo migration assays. ON (black) and OFF (gray) stimulated cells were stained with either Oregon green (cyan) or TAMRA (magenta) and mixed in a 1:1 ratio before injected into the footpad of WT mice (four biological replicates). ns, not significant, *p < 0.1, ***p < 0.01 by Student’s t-test; data are represented as means ± standard deviation (SD).
-
Figure 7—source data 1
In vivo T cells in proliferation after contact with wild-type (WT) dendritic cells (DCs) after ON and OFF stimulation.
- https://cdn.elifesciences.org/articles/78995/elife-78995-fig7-data1-v2.xlsx
-
Figure 7—source data 2
Individual ear crawl in assay – wild-type (WT) mice after ON and OFF stimulation.
- https://cdn.elifesciences.org/articles/78995/elife-78995-fig7-data2-v2.xlsx
-
Figure 7—source data 3
In vivo individual dendritic cell (DC) migration – cells inside the lymphnode after ON and OFF stimulation.
- https://cdn.elifesciences.org/articles/78995/elife-78995-fig7-data3-v2.xlsx
-
Figure 7—source data 4
In vivo individual dendritic cell (DC) migration – cells inside the lymphnode after stimulation with ON mutants and treatment with M14-23.
- https://cdn.elifesciences.org/articles/78995/elife-78995-fig7-data4-v2.xlsx
-
Figure 7—source data 5
Mixed ear crawl in assay – wild-type (WT) mice after ON and OFF stimulation.
- https://cdn.elifesciences.org/articles/78995/elife-78995-fig7-data5-v2.xlsx
-
Figure 7—source data 6
Mixed in vivo migration assay – cells inside the lymphnode normalized to preinjection mix after ON and OFF stimulation.
- https://cdn.elifesciences.org/articles/78995/elife-78995-fig7-data6-v2.xlsx
Tables
Table 1
Primers used for cloning.
| Oligonucleotide | Sequence |
|---|---|
| 110 | ATATGCATGCCAAAAGATGAAACATATATCATAAATAAGTTACGT |
| 112 | ATATGCATGCCAAAAGATGAAACATTCATAGAGGAAAGCATCG |
| 119 | CAGTAATGCTGCTCGTTTTGCCG |
| 120 | GACAGAGCCGACAGAACAAC |
| 128 | TGTGTAGGCTGGAGCTGCTTC |
| 130 | AAAAGAGAAGAGGTTTGATTTAACTTATTGATAATAAAGTTAAAAAAACACTGCTTCGAAGTTCC |
| 131 | CACTTTGTTTTGTAAACGAGTTTGACTGCCAACACTGCACAGTTTTCCCCCAAAAGATGAAACAT |
| 132 | ATTCATATGGAATAAATACAAGACAATCATAGAGGAAAGCATC |
| 133 | ATTCATATGGAATAAATACAAGACAAATATCATAAATAAGTTACGTATTTTTTCTCAAGCATAAAAATATTAAAAAACGAC |
| 134 | TTGTATTTATTCCATATGAATATCCTCCTTAGTTCCTATTCC |
| 146 | TAGCTTCAGGTAATATTGCGTACCTGCATTAGCAATGCCCTGTGATTTCTCCATATGAATATCCTCCTTAGTTCC |
| 148 | AGTGATTAGCATCACCTATACCTACAGCTGAACCCAAAGAGATGATTGTATGTGTAGGCTGGAGCTGCTTCG |
| 157 | AGCATCACCTATACCTACAGCTG |
| 158 | AGCTTCAGGTAATATTGCGTACC |
| 198 | AGTGATTAGCATCACCTATACCTACAGCTGAACCCGAAGAGATGATTGTAATGAAACGAGTTATTACC |
| 276 | TAGCTTCAGGTAATATTGCGTACCTGCATTAGCAATGCCCTGTGATTTCTTTATTGATAAACAAA |
| 296 | AGTGATTAGCATCACCTATACCTACAGCTGAACCCGAAGAGATGATTGTATTGACGGCTAGCTCAGTCCTAGGTA |
| 297 | TAGCTTCAGGTAATATTGCGTACCTGCATTAGCAATGCCCTGTGATTTCTTCAGCACTGTCCTGCTCCTTGTGAT |
| 3_SphI_pKD3_test | TGAATACCACGACGATTTCC |
| cam_test_R | CAACGGTGGTATATCCAGTGA |
| FarChro galK UO | GTTAATTATCATTTTGCACCGCGTC |
| galK-KpnI-r | CCGGGTACCTCAGCACTGTCCTGCTCC |
| galK-ver-F | CCTACTCTATGGGCTGGCAC |
| galk-ver-R | GGAAAGTAAAGTCGCACCCC |
Table 2
Used strains.
| Strain | Reference |
|---|---|
| E. coli W (ATCC 9637) | Archer et al., 2011 |
| CFT073 O6:K2:H1 (ATCC 700928) | Welch et al., 2002 |
| UTI89 O18:K1:H7 | Chen et al., 2006 |
| 536 O6:K15:H31 | Hochhut et al., 2005 |
| KT177 (UTI89 locked-ON::FRT) | This paper |
| KT178 (UTI89 locked-OFF::FRT) | This paper |
| KT179 (CFT073 locked-ON::FRT) | This paper |
| KT180 (CFT073 locked-OFF::FRT) | This paper |
| KT193 (CFT073 locked-ON::FRT ΔfimH::FRT) | This paper |
| KT232 (E. coli W locked-ON::FRT) | This paper |
| KT257 (CFT073 locked-ON::FRT ΔfimH attλ PR-mVenus::FRT) | This paper |
| KT260 (CFT073 locked-ON::FRT ΔgalK::FRT fimH::fimHY48A R98A T99A) | This paper |
| KT261 (CFT073 locked-ON::FRT ΔgalK::FRT fimH::fimHY48A) | This paper |
| KT262 (CFT073 locked-ON::FRT ΔgalK::FRT fimH::fimHR98A) | This paper |
| KT263 (CFT073 locked-ON::FRT ΔgalK::FRT fimH::fimHT99A) | This paper |
| MG002 (E. coli W locked-ON::FRT ΔgalK::FRT fimH::fimHCFT073) | This paper |
| VG003 (CFT073 locked-ON::FRT attλ PR-mVenus::FRT) | This paper |
| KT280 (536 locked-ON::FRT) | This paper |
| KT281 (536 locked-OFF::FRT) | This paper |
Table 3
Antibodies used.
| Antibody | Source | Identifier |
|---|---|---|
| Rat anti-MHC II (I-A/I-E) eFluor450 (clone M5/114.15.2) | eBioscience | 48-5321-82 |
| Armenian hamster anti-CD11c APC (clone N418) | eBioscience | 17-0114-82 |
| Rat anti-CD18 PE (clone C71/16) | BD | 553,293 |
| Rat anti-CD11b FITC (clone M1/70) | eBioscience | 11-0112-82 |
| Mouse anti-human CD11b (active epitope) APC (clone CBRM1/5) | eBioscience | 17-0113-41 |
| Rat anti-CD86 biotin (clone GL1) | eBioscience | 13-0862-85 |
| Armenian hamster anti-CD80 (clone 16–10 A1) | eBioscience | 13-0801-85 |
| Rat anti-CD40 (clone 1C10) | Biolegend | 102,802 |
| Armenian Hamster anti-CD103 Brilliant Violet 421 (clone 2E7) | Biolegend | 121,421 |
| Rat anti-CD14 Brilliant Violet 421 (clone Sa14-2) | Biolegend | 123,329 |
| Rabbit anti-CD14 (clone EPR21847) | Abcam | ab221678 |
| Mouse anti-CD64 (FcγRI) Brilliant Violet 421 (clone X54-5/7.1) | Biolegend | 139,309 |
| Rat anti-CD4 eFluor450 (clone GK1.5) | eBioscience | 48-0042-82 |
| Armenian Hamster anti-CD69 APC-eFluor780 (clone H1.2F3) | eBioscience | 47-0691-82 |
| Rat anti-CD62-L PE (clone MEL-14) | eBioscience | 12-0621-82 |
| Mouse anti-CD45.2 APC (clone 104) | eBioscience | 17-0454-82 |
| Rat IgG2b kappa Isotype Control eFluor450 (clone eB146/10H5) | eBioscience | 48-4031-82 |
| Armenian Hamster IgG Isotype Control APC (clone eBio299Arm) | eBioscience | 14-4888-81 |
| Rat IgG2a kappa Isotype Control PE (clone eBR2a) | eBioscience | 12-4321-81 |
| Rat IgG2b kappa Isotype Control FITC (clone eB149/10H5) | eBioscience | 11-4031-82 |
| Rat IgG1 kappa Isotype Control APC (clone eBRG1) | eBioscience | 17-4301-82 |
| Armenian Hamster IgG Brilliant Violet 421 (clone HTK888) | Biolegend | 400,936 |
| Rat IgG2a kappa Isotype Control Biotin (clone RTK2758) | Stemcell Technologies | 60,076 |
| Armenian Hamster IgG Isotype Control Biotin (clone eBio299Arm) | eBioscience | 13-4888-81 |
| Rat IgG2a kappa Isotype Control (clone RTK2758) | Stemcell Technologies | 60,076 |
| Alexa Fluor 647-conjugated Streptavidin | Jackson ImmunoResearch | 016-600-084 |
| Donkey anti-rat IgG H + L Alexa Fluor488 AffiniPure F(ab')2 Fragment | Jackson ImmunoResearch | 712-546-150 |
| Donkey anti-rat IgG H + L Alexa Fluor647 AffiniPure F(ab')2 Fragment | Jackson ImmunoResearch | 712-606-150 |
| Goat anti-rabbit Alexa Fluor488 | Invitrogen | A11008 |
| Rat anti-CD29 (clone 9EG7) | BD | 553,715 |
| Armenian Hamster anti-CD29 PE (clone HMβ1–1) | Biolegend | 102,207 |
| Armenian Hamster IgG Isotype Control PE (clone HTK888) | Biolegend | 400,907 |
| M14-23 (anti-mouse CD14 antibody) | Biolegend | 150,102 |
| Strep-Tactin HRP | iba-lifesciences | 2-1502-001 |
| Fc receptor block | eBioscience | 14-9161-73 |
Additional files
-
Supplementary file 1
PDB file of mouse CD14 and FimH.
- https://cdn.elifesciences.org/articles/78995/elife-78995-supp1-v2.txt
-
Supplementary file 2
PDB file of human CD14 and FimH.
- https://cdn.elifesciences.org/articles/78995/elife-78995-supp2-v2.txt
-
Supplementary file 3
Predicted free binding energies of mouse CD14, TLR4, and CD48 to FimH.
- https://cdn.elifesciences.org/articles/78995/elife-78995-supp3-v2.xlsx
-
Supplementary file 4
Amino acids of FimH responsible for binding mouse CD14 and mannose, and amino acids of mouse CD14 responsible for FimH and lipopolysaccharide (LPS) binding.
- https://cdn.elifesciences.org/articles/78995/elife-78995-supp4-v2.xlsx
-
Supplementary file 5
Predicted free binding energy of human CD14 and FimH.
- https://cdn.elifesciences.org/articles/78995/elife-78995-supp5-v2.xlsx
-
Transparent reporting form
- https://cdn.elifesciences.org/articles/78995/elife-78995-transrepform1-v2.docx
-
Source code 1
Pre-processing of files from the in vitro 3D collagen migration images.
Removes edge effects and stabilizes image. Resulting file is used for further analysis in migrationspeedREP script.
- https://cdn.elifesciences.org/articles/78995/elife-78995-code1-v2.zip
-
Source code 2
Returns migration speed of single cells in the in vitro 2D migration assay of adherent cells.
- https://cdn.elifesciences.org/articles/78995/elife-78995-code2-v2.zip
-
Source code 3
Reads data from the Tracking_pre-processing_for_brightfield script.
Returns average of migration speed and cell displacement in the in vitro 3D collagen migration assay as pixels/min.
- https://cdn.elifesciences.org/articles/78995/elife-78995-code3-v2.zip
-
Source code 4
Pre-processing of the ex vivo migration images.
Manual outlining of lymph vessels and adjustment of fluorescent intensities of dendritic cell (DC) signals for further analysis in LVmeanDCarea script.
- https://cdn.elifesciences.org/articles/78995/elife-78995-code4-v2.zip
-
Source code 5
Reads data from the lymphatics script.
Returns average of fluorescence intensity of dendritic cells (DCs) inside and outside of lymph vessels.
- https://cdn.elifesciences.org/articles/78995/elife-78995-code5-v2.zip
-
Source code 6
Plots maximum projection images of the ex vivo migration images.
- https://cdn.elifesciences.org/articles/78995/elife-78995-code6-v2.zip
Download links
A two-part list of links to download the article, or parts of the article, in various formats.
Downloads (link to download the article as PDF)
Open citations (links to open the citations from this article in various online reference manager services)
Cite this article (links to download the citations from this article in formats compatible with various reference manager tools)
Type 1 piliated uropathogenic Escherichia coli hijack the host immune response by binding to CD14
eLife 11:e78995.
https://doi.org/10.7554/eLife.78995


