Higher-order unimodal olfactory sensory preconditioning in Drosophila
- Department of Biology, Georgetown University, United States
- Department of Biological Sciences and Neuroscience & Mental Health Institute, University of Alberta, Canada
- Interdisciplinary Program in Neuroscience, Georgetown University, United States
Figures
Figure 1 with 1 supplement
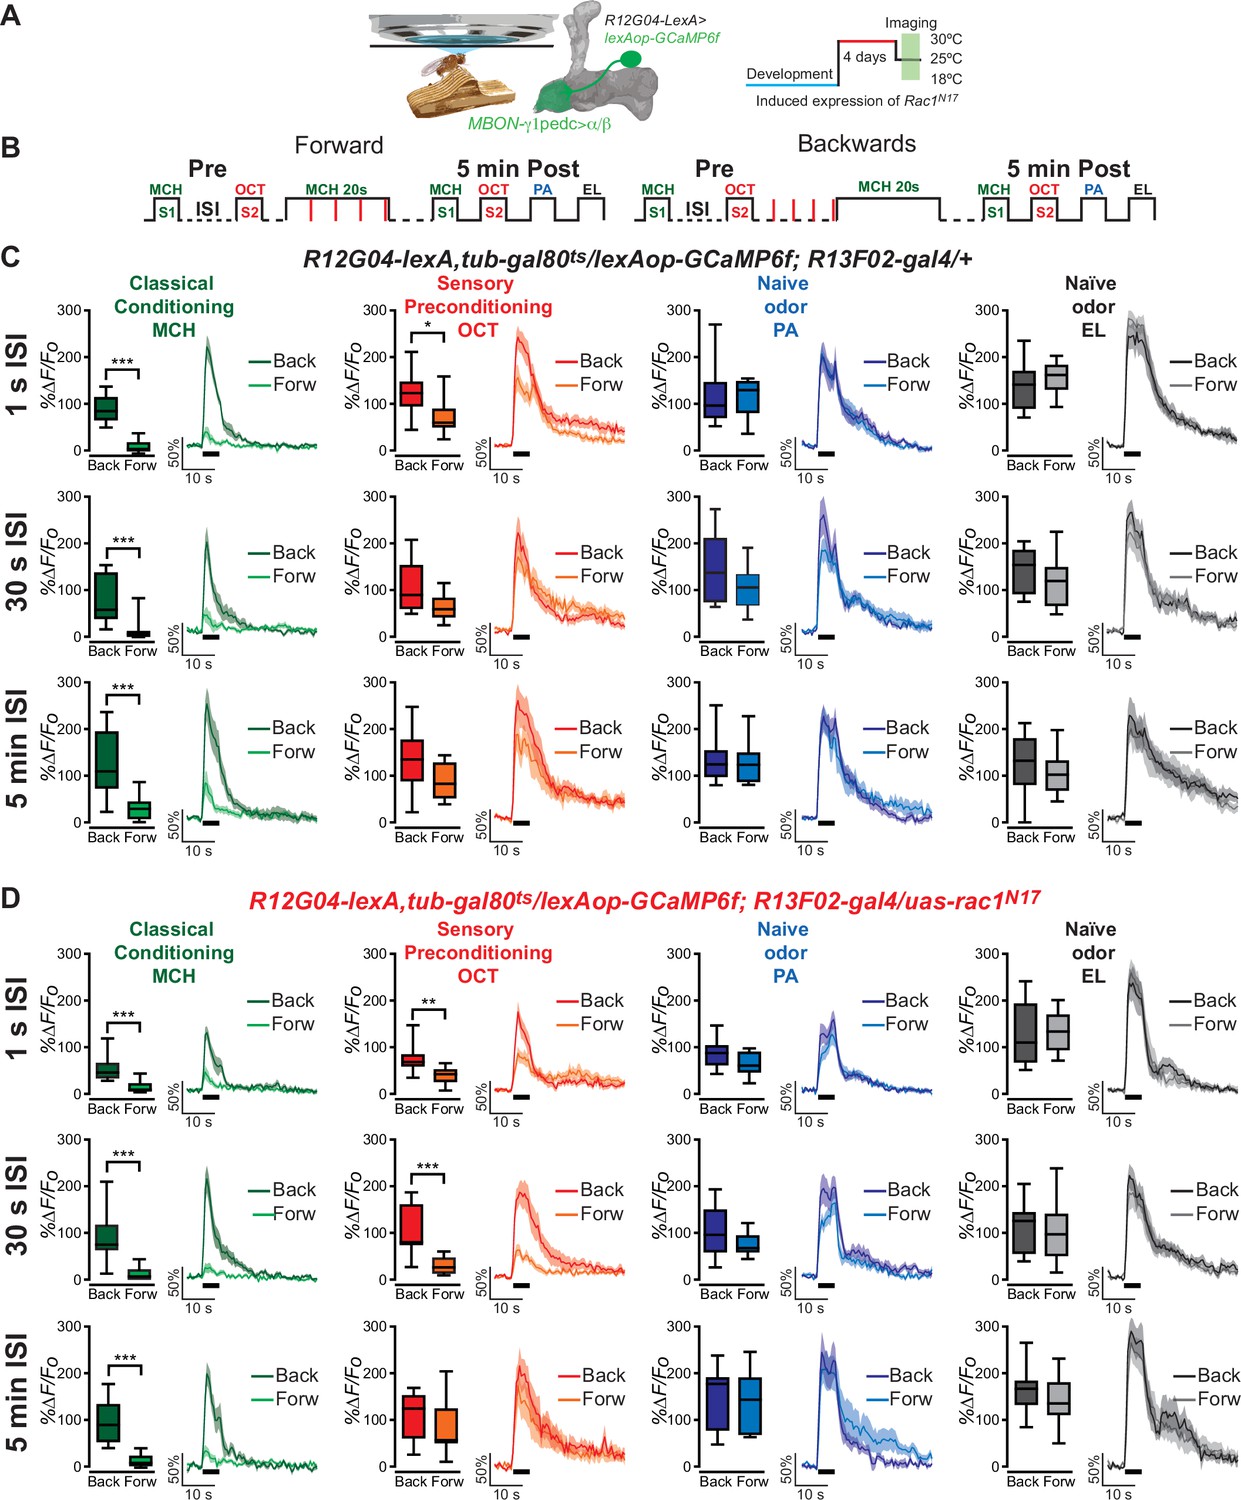
One-second interstimulus interval (ISI) during preconditioning induces depression to non-trained, pre-paired odor S2 in control flies.
(A) Diagram of the in vivo, under the microscope training imaging setup, MBON-γ1pedc>α/β diagram, and Rac1N17 expression induction. (B) Diagram of the experimental setup (odor schedule): preconditioning was induced by presentation of 4-methylcyclohexanol (MCH) and 3-octanol (OCT) (S1 and S2) with 1-s, 30-s, or 5-min ISI; then flies were aversively trained to MCH (S1) and 5 min later, post-conditioning responses were recorded. Responses were compared to flies trained using backwards conditioning. (C) S1 (MCH) responses were completely depressed 5 min after training in control flies preconditioned with 1-s, 30-s, or 5-min ISI. Non-parametric Mann–Whitney test p ≤ 0.0044; n = 8–10. A significant inhibition of post-trained response to S2 (OCT) was observed in control flies preconditioned with 1-s ISI. Non-parametric Mann–Whitney test p = 0.035; n = 10. In contrast, S2 (OCT) responses in control flies preconditioned with 30-s or 5-min ISI showed no significant change. Non-parametric Mann–Whitney test p ≥ 0.0630, n = 8–10. Neither naive odor (penthyl acetate [PA] and ethyl lactate [EL]) responses showed any significant reduction in flies preconditioned with 1-s, 30-s, or 5-min ISI. Non-parametric Mann–Whitney test p ≥ 0.0726, n = 8–10. (D) S1 (MCH) responses were completely depressed 5 min after training in flies expressing Rac1N17 preconditioned with 1-s, 30-s, or 5-min ISI. Non-parametric Mann–Whitney test p ≤ 0.0009; n = 8–12. A significant inhibition of post-trained response to S2 (OCT) was observed in flies preconditioned using a 1- or 30-s ISI. Non-parametric Mann–Whitney test p ≤ 0.0031; n = 8–12. In contrast, S2 (OCT) responses in flies preconditioned with 5-min ISI showed no significant change. Non-parametric Mann–Whitney test p = 0.4234, n = 8–9. Neither naive odor (PA and EL) responses showed any significant reduction in flies preconditioned with 1-s, 30-s, or 5-min ISI. Non-parametric Mann–Whitney test p ≥ 0.0726, n = 8–12. Boxplots represent distribution of %∆F/Fo responses across the 5 s of odor presentation. The thick black bar below each trace represents the time of odor presentation. The asterisk's number shows N digits after the decimal.
-
Figure 1—source data 1
One-second interstimulus interval (ISI) during preconditioning induces depression to non-trained, pre-paired odor S2 in control flies.
- https://cdn.elifesciences.org/articles/79107/elife-79107-fig1-data1-v2.xlsx
Figure 1—figure supplement 1
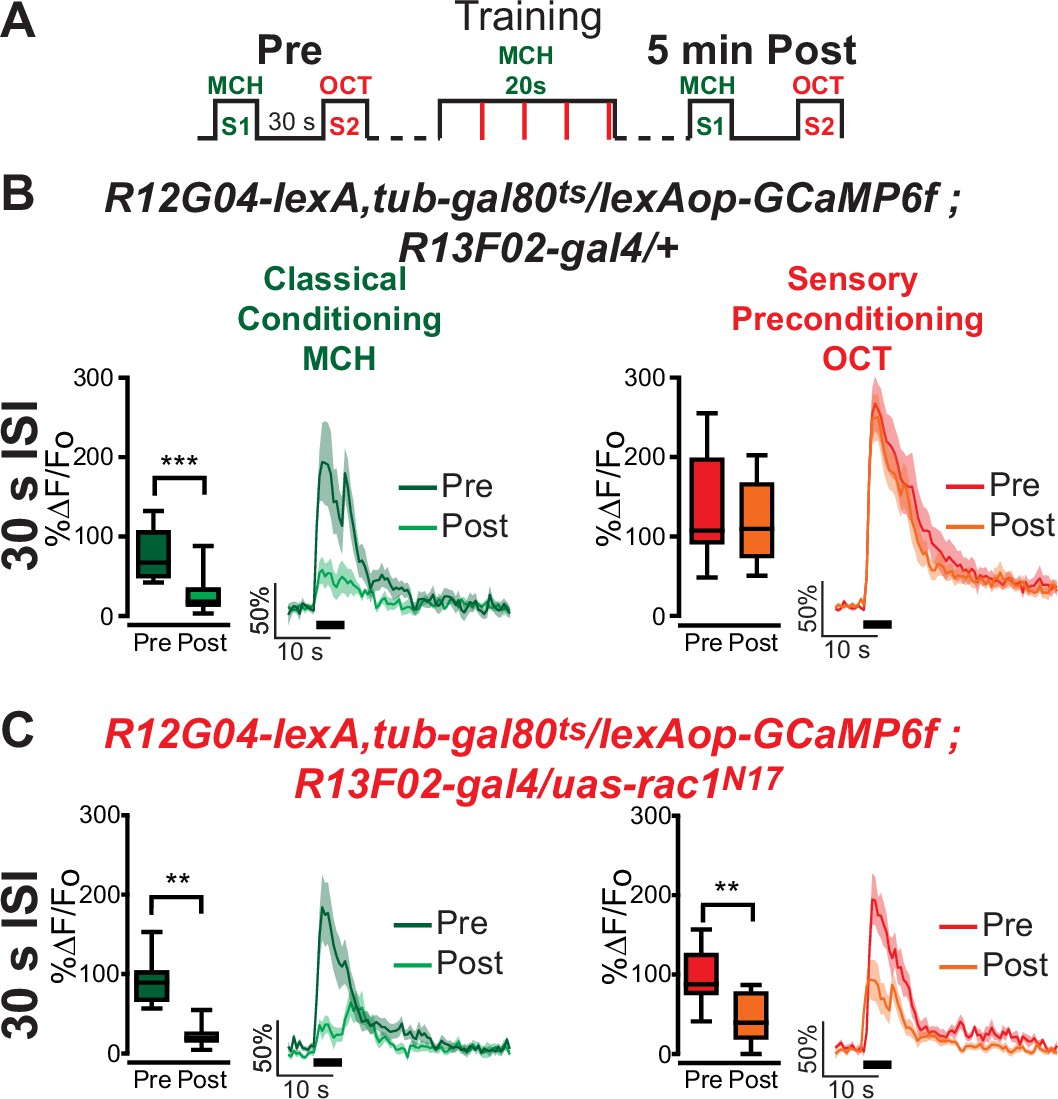
Rac1 inhibition induces depression to non-trained, pre-paired odor S2 in MBON-γ1pedc>α/β.
(A) Diagram of experimental setup (odor schedule): preconditioning responses were obtained for 4-methylcyclohexanol (MCH) and 3-octanol (OCT) (S1 and S2); later flies were aversively trained to MCH (S1) and 5 min later post-conditioning responses were recorded. (B, C) S1 (MCH) responses were completely depressed 5 min after training in both control and flies expressing Rac1N17. Non-parametric Wilcoxon-paired test p ≤ 0.0003; n = 10–11. No significant changes were detected to S2 (OCT) for control animals. Non-parametric Wilcoxon-paired test p = 0.2783; n = 11. However, a significant inhibition in the post-trained response to S2 (OCT) was observed in flies expressing Rac1N17. Non-parametric Wilcoxon-paired test p ≤ 0.0098; n = 10. The asterisk's number shows N digits after the decimal.
-
Figure 1—figure supplement 1—source data 1
Rac1 inhibition induces depression to non-trained, pre-paired odor S2 in MBON-γ1pedc>α/β.
- https://cdn.elifesciences.org/articles/79107/elife-79107-fig1-figsupp1-data1-v2.xlsx
Figure 2 with 1 supplement

Rac1 inhibition induces depression to sensory preconditioned odor S2 in MBON-γ1pedc>α/β using a different odor pair with orthogonal representation.
(A) Diagram of experimental setup (odor schedule): preconditioning responses were obtained for penthyl acetate (PA) and ethyl lactate (EL) (S1 and S2, respectively); later flies were aversively trained to PA (S1) and 5 min after, post-conditioning responses were recorded. (B, C) S1 (PA) responses were completely depressed 5 min after training in both control flies and flies expressing Rac1N17. Non-parametric Wilcoxon-paired test p ≤ 0.0078; n = 8–11. No significant changes were detected to S2 (EL) for control animals. Non-parametric Wilcoxon-paired test p = 0.5771; n = 11. Nevertheless, a significant inhibition of post-trained response to S2 (EL) was observed in flies expressing Rac1N17. Non-parametric Wilcoxon-paired test p = 0.0391; n = 8. Boxplots represent distribution of %∆F/Fo responses across the 5 s of odor presentation. The thick black bar below each trace represents the time of odor presentation. The asterisk's number shows N digits after the decimal.
-
Figure 2—source data 1
Rac1 inhibition induces depression to sensory preconditioned odor S2 in MBON-γ1pedc>α/β using a different odor pair with orthogonal representation.
- https://cdn.elifesciences.org/articles/79107/elife-79107-fig2-data1-v2.xlsx
Figure 2—figure supplement 1
Rac1 inhibition does not induce depression to repeated odor presentation in MBON-γ1pedc>α/β when the electric shock is excluded.
(A) Upper part, diagram of experimental setup (odor schedule): preconditioning responses were obtained for 4-methylcyclohexanol (MCH) and 3-octanol (OCT) (S1 and S2); later flies were presented with 20 s of MCH (S1) and 5 min later post-conditioning responses were recorded. Electric shocks were excluded. Both S1 (MCH) and S2 (OCT) responses showed no significant changes for both control and flies expressing Rac1N17. (B) Similarly, flies expressing Rac1N17 did not show increased odor depression when repeatedly presented (10 times).
-
Figure 2—figure supplement 1—source data 1
Rac1 inhibition does not induce depression to repeated odor presentation in MBON-γ1pedc>α/β when the electric shock is excluded.
- https://cdn.elifesciences.org/articles/79107/elife-79107-fig2-figsupp1-data1-v2.xlsx
Figure 3

Excluding preconditioning eliminates depression to the S2 odor.
(A) Diagram of experimental procedure (odor schedule): Flies were aversively trained to 4-methylcyclohexanol (MCH) (S1) and 5 min later post-conditioning responses to four odors were recorded (preconditioning was excluded). Responses were compared to flies trained using backwards conditioning. (B, C) S1 (MCH) responses were completely depressed 5 min after training in both control and flies expressing Rac1N17. Non-parametric Mann–Whitney test p ≤ 0.0147; n = 10–11. Neither 3-octanol (OCT), penthyl acetate (PA), nor ethyl lactate (EL) responses showed any significant reduction for both control and experimental flies. Non-parametric Mann–Whitney test p ≥ 0.072, n = 10–11. Boxplots represent distribution of %∆F/Fo responses across the 5 s of odor presentation. The asterisk's number shows N digits after the decimal.
-
Figure 3—source data 1
Excluding preconditioning eliminates depression to the S2 odor.
- https://cdn.elifesciences.org/articles/79107/elife-79107-fig3-data1-v2.xlsx
Figure 4 with 4 supplements

Repeated presentations of paired odors (S1/S2) induce behavioral sensory preconditioning.
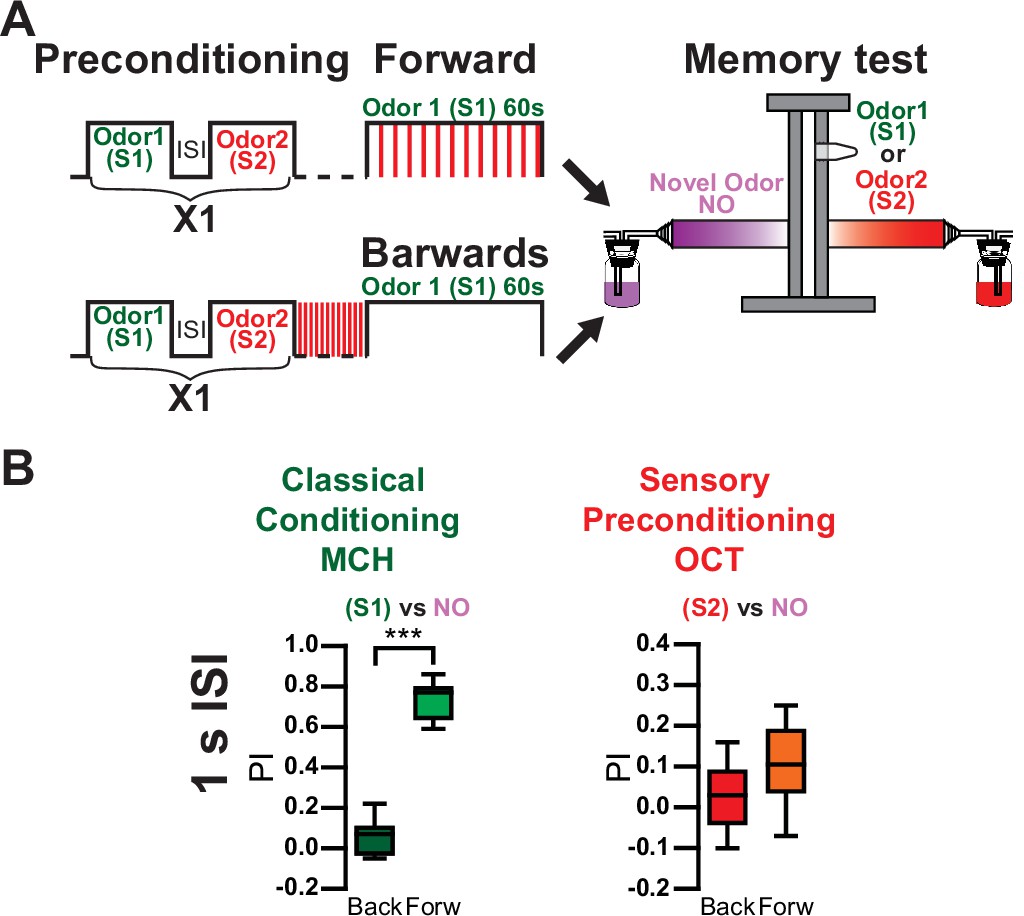
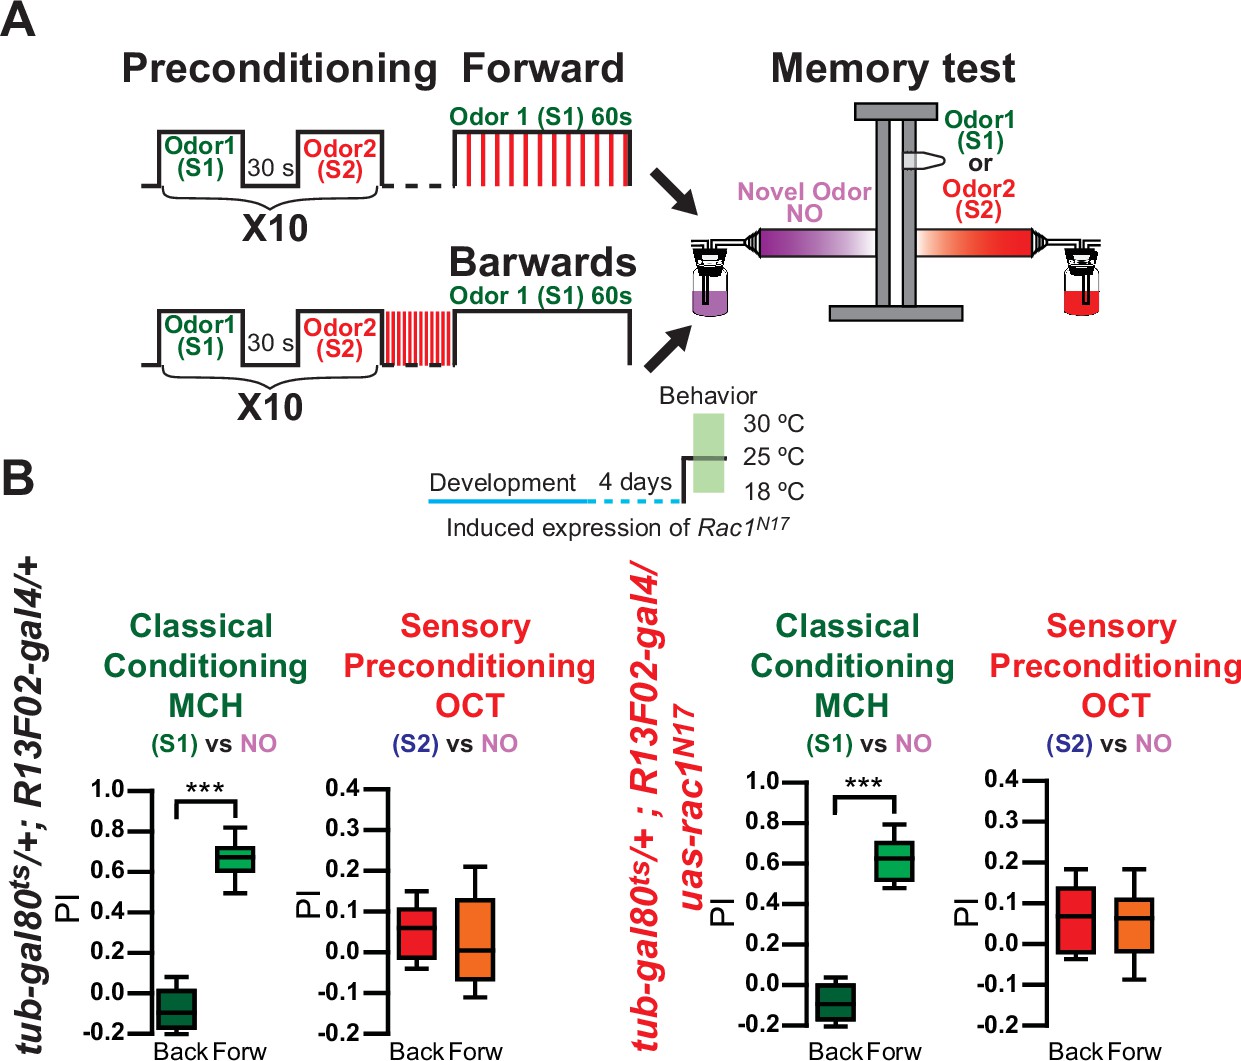
(A) Flies were trained using an Arduino microcontroller for precise odor delivery: Flies were preconditioned by 10 repeated presentations of S1/S2 odor pairs with 1-s interstimulus interval (ISI). Later flies were aversively trained to 4-methylcyclohexanol (MCH) (S1) by pairing 1-min odor presentation along 12 90 V, 1.25 s shocks. Right after training memory was tested in a T-maze by presenting either S1 vs. a novel odor (NO) or S2 vs. an NO. Performance index (PI) was compared to flies trained using backwards conditioning. (B) Memory to S1 was significantly different from flies trained with backwards conditioning, after 10× preconditioning presentations using 1-s, 30-s, or 5-min ISI. Non-parametric Mann–Whitney test p < 0.0001, n = 8–12. In contrast, memory to S2 was significantly different from flies trained with backwards conditioning, with 10× preconditioning presentations only using 1-s ISI in control flies. Non-parametric Mann–Whitney test p = 0.0019, n = 12. Memory to S2 was not significantly different from backwards conditioning, with 10× preconditioning presentations using 30-s or 5-min ISI in control flies. Non-parametric Mann–Whitney test p > 0.999, n = 8. (C) Memory to S1 in flies expressing Rac1N17 was significantly different from flies trained with backwards conditioning, after 10× preconditioning presentations using 30-s or 5-min ISI. Non-parametric Mann–Whitney test p = 0.0002, n = 8. Memory to S2 in flies expressing Rac1N17 was significantly different from flies trained with backwards conditioning, with 10× preconditioning presentations when using a 30-s ISI. Non-parametric Mann–Whitney test p = 0.0191, n = 8. Memory in flies expressing Rac1N17 to S2 was not significantly different from backwards conditioning, with 10× preconditioning presentations when using 5-min ISI. Non-parametric Mann–Whitney test p = 0.8981, n = 8. The asterisk's number shows N digits after the decimal. The following source data and figure supplements are available for Figure 4.
-
Figure 4—source data 1
Repeated presentations of paired odors (S1/S2) induce behavioral sensory preconditioning.
- https://cdn.elifesciences.org/articles/79107/elife-79107-fig4-data1-v2.xlsx
Figure 4—figure supplement 1
A single presentation of paired odors (S1/S2) does not induce behavioral sensory preconditioning.
(A) Control flies were trained using an Arduino microcontroller for precise odor delivery. Diagram of experimental setup (odor schedule): Flies were preconditioned by a single presentation of a S1/S2 odor pair with 1-s interstimulus interval (ISI). Later flies were aversively trained to 4-methylcyclohexanol (MCH) (S1) by pairing a 1-min odor presentation with 12 90 V, 1.25 s shocks. Right after training memory was tested in a T-maze by presenting either S1 vs. a novel odor (NO) or S2 vs. an NO. Performance index (PI) was compared to flies trained using backwards conditioning. (B) Memory to S1 was significantly different from flies trained with backwards conditioning. Non-parametric Mann–Whitney test p < 0.0001, n = 9. Memory to S2 was not significantly different from flies trained with backwards conditioning with 1× preconditioning presentations. Non-parametric Mann–Whitney test p = 0.0923, n = 10. The asterisk's number shows N digits after the decimal.
-
Figure 4—figure supplement 1—source data 1
A single presentation of paired odors (S1/S2) does not induce behavioral sensory preconditioning.
- https://cdn.elifesciences.org/articles/79107/elife-79107-fig4-figsupp1-data1-v2.xlsx
Figure 4—figure supplement 2
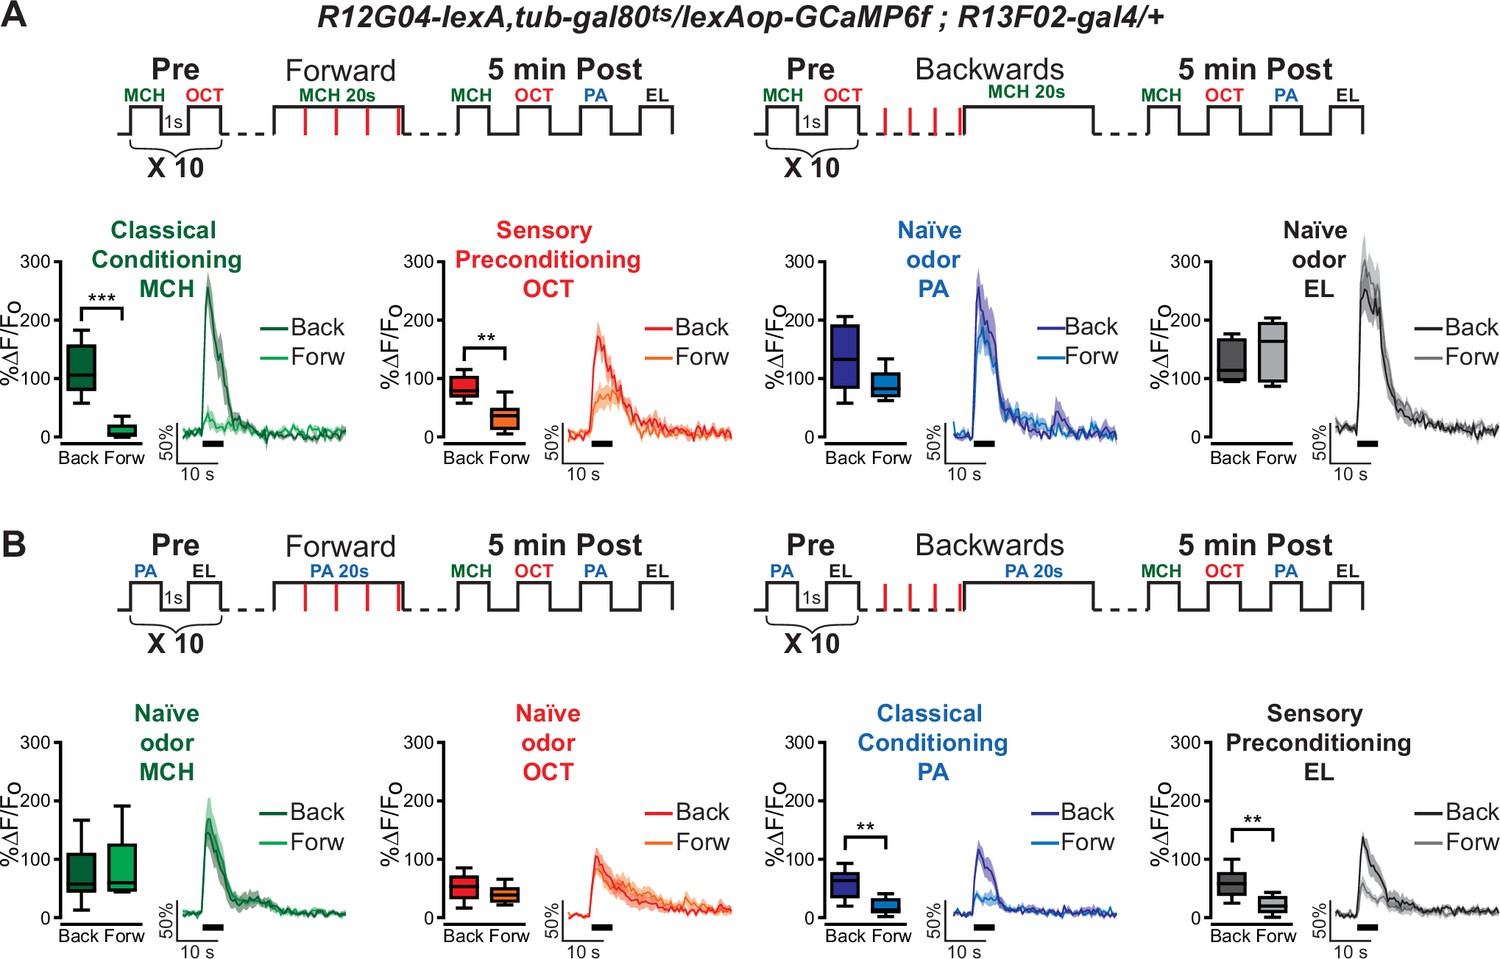
Repeated presentations of paired odors (S1/S2) induces sensory preconditioning in MBON-γ1pedc>α/β.
(A) Upper part, diagram of experimental setup (odor schedule): preconditioning was induced by 10 repeated presentations of 4-methylcyclohexanol (MCH) and 3-octanol (OCT) (S1 and S2) with a 1-s interstimulus interval (ISI); later flies were aversively trained to MCH (S1) and 5 min later post-conditioning responses were recorded for MCH, OCT, penthyl acetate (PA), and ethyl lactate (EL). Responses were compared to flies trained using backwards conditioning. S1 (MCH) responses were completely depressed 5 min after training. Non-parametric Mann–Whitney test p ≤ 0.0043; n = 5–6. A significant inhibition of post-trained response to S2 (OCT) was also observed. Non-parametric Mann–Whitney test p = 0.0087; n = 5–6. Neither PA nor EL responses showed any significant reduction. Non-parametric Mann–Whitney test p ≥ 0.2468, n = 5–6. (B) Upper part, diagram of experimental setup (odor schedule): preconditioning was induced by 10 repeated presentations of PA and EL (S1 and S2) with 1-s ISI; later flies were aversively trained to PA (S1) and 5 min later post-conditioning responses were recorded for MCH, OCT, PA, and EL. Responses were compared to flies trained using backwards conditioning. S1 (PA) responses were completely depressed 5 min after training. Non-parametric Mann–Whitney test p ≤ 0.0077; n = 8. A significant inhibition of post-trained response to S2 (EL) was also observed. Non-parametric Mann–Whitney test p = 0.0019; n = 8. Neither MCH nor OCT responses showed any significant reduction. Non-parametric Mann–Whitney test p ≥ 0.5054, n = 8. Boxplots represent distribution of %∆F/Fo responses across the 5 s of odor presentation. The thick black bar below each trace represents the time of odor presentation. The asterisk's number shows N digits after the decimal.
-
Figure 4—figure supplement 2—source data 1
Repeated presentations of paired odors (S1/S2) induces sensory preconditioning in MBON-γ1pedc>α/β.
- https://cdn.elifesciences.org/articles/79107/elife-79107-fig4-figsupp2-data1-v2.xlsx
Figure 4—figure supplement 3
TARGET temperature control for Rac1 inhibition does not show behavioral expression of sensory preconditioning.
(A) Diagram of experimental setup (odor schedule): Flies were kept at 18°C then transferred to 25°C before training. Flies were preconditioned by 10 repeated presentations of S1/S2 odor pairs with 30-s interstimulus interval (ISI). Later flies were aversively trained to 4-methylcyclohexanol (MCH) (S1) by pairing 1-min odor presentation with 12 90 V, 1.25 s shocks. Right after training memory was tested in a T-maze by presenting either S1 vs. a novel odor (NO) or S2 vs. an NO. Performance indices (PI) were compared with flies trained using backwards conditioning. (B) Memory to S1 was significantly different from flies trained with backwards conditioning, for both control and flies bearing Rac1N17. Non-parametric Mann–Whitney test p < 0.0002, n = 8. In contrast, Memory to S2 was not significantly different in both genotypes. Non-parametric Mann–Whitney test p ≥ 0.4873, n = 8. The asterisk's number shows N digits after the decimal.
-
Figure 4—figure supplement 3—source data 1
TARGET temperature control for Rac1 inhibition does not show behavioral expression of sensory preconditioning.
- https://cdn.elifesciences.org/articles/79107/elife-79107-fig4-figsupp3-data1-v2.xlsx
Figure 4—figure supplement 4
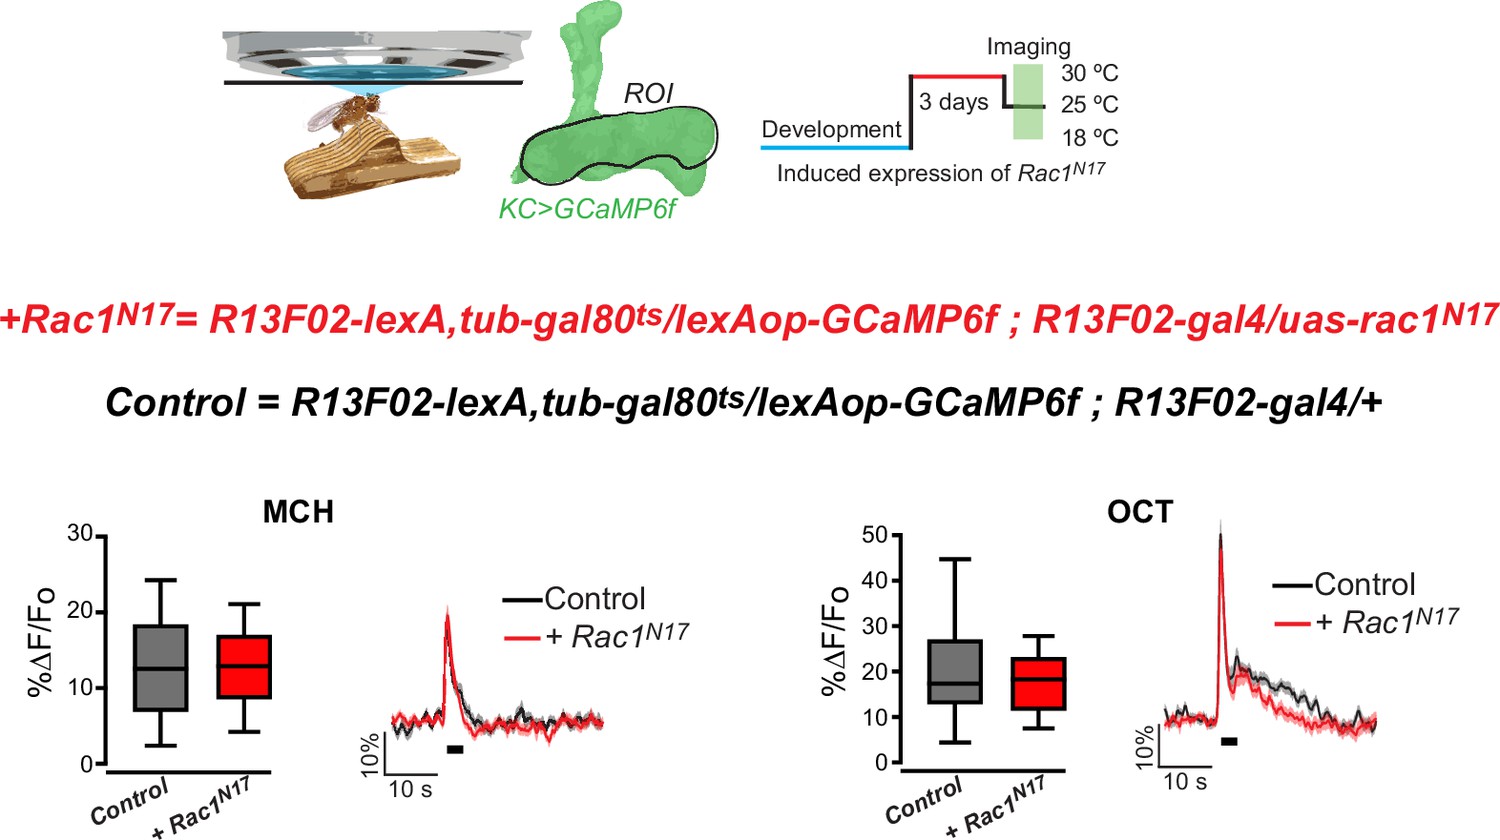
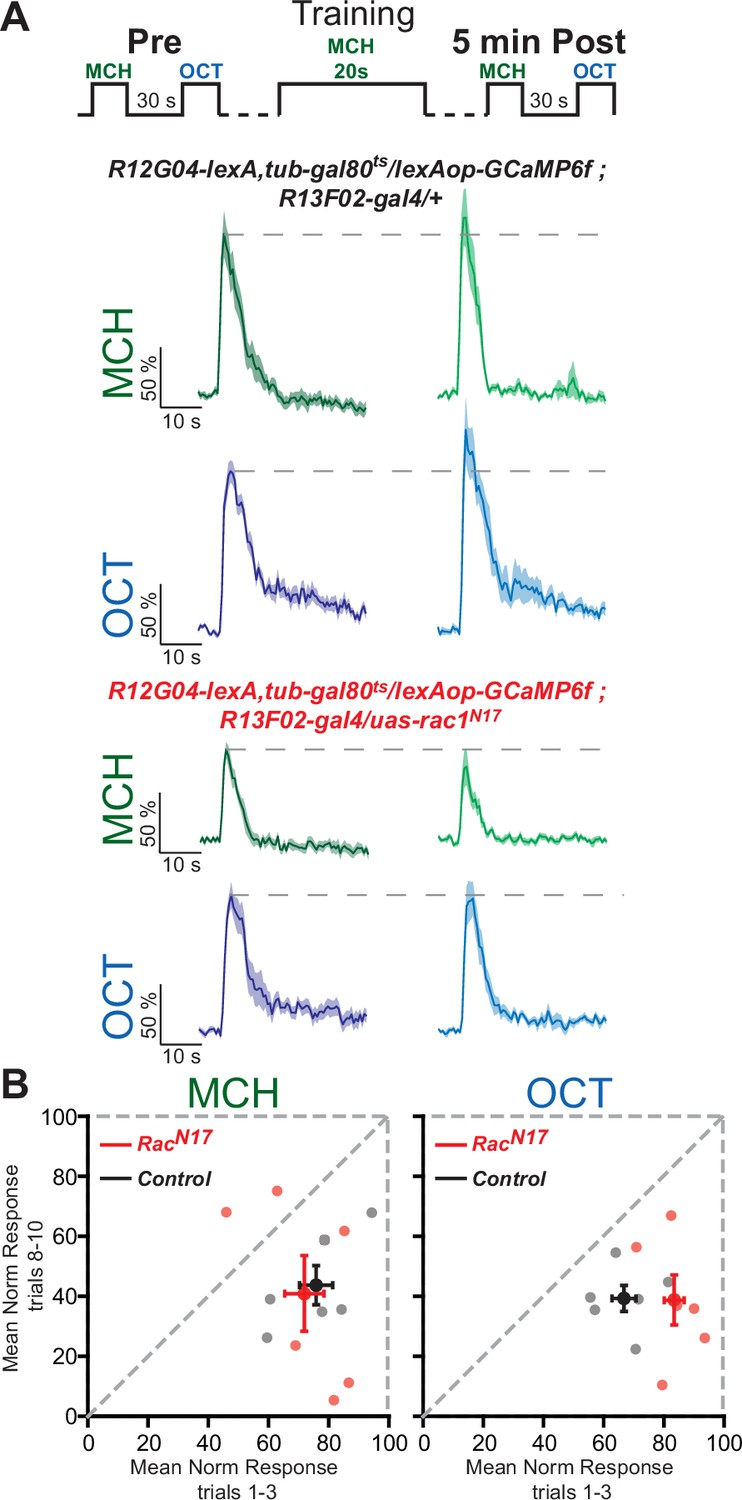
Rac1 inhibition does not changes dynamics of calcium odor responses in γ lobes of Kenyon cells (KC).
Top part, diagram of the in vivo, under the microscope imaging setup. Rac1N17 was expressed in KC using R13F02-gal4>uas-rac1N17 using the temperature conditional system Target (tub-gal80ts). At the same time the calcium reporter was expressed in KC using R13F02-lexA>lexAop-GCaMP6f. There is no significant difference in 4-methylcyclohexanol (MCH) responses in flies expressing Rac1N17. Non-parametric Mann–Whitney test p = 0.616, n = 13–14. Similarly, no significant differences were detected in 3-octanol (OCT), non-parametric Mann–Whitney test p = 0.1852, n = 13–14.
-
Figure 4—figure supplement 4—source data 1
Rac1 inhibition does not changes dynamics of calcium odor responses in γ lobes of Kenyon cells (KC).
- https://cdn.elifesciences.org/articles/79107/elife-79107-fig4-figsupp4-data1-v2.xlsx
Videos
Video 1
Expression patterns of MB112C-splitGal4 driver expressing GFP.
Brains where dissected and stained using anti-GFP and anti-nc82 as a counterstain.
Video 2
Expression patterns of R12G04-LexA driver expressing GFP.
Brains where dissected and stained using anti-GFP and anti-nc82 as a counterstain.
Video 3
Expression patterns of R13F02-Gal4 driver expressing GFP.
Brains where dissected and stained using anti-GFP and anti-nc82 as a counterstain.
Additional files
Download links
A two-part list of links to download the article, or parts of the article, in various formats.
Downloads (link to download the article as PDF)
Open citations (links to open the citations from this article in various online reference manager services)
Cite this article (links to download the citations from this article in formats compatible with various reference manager tools)
Higher-order unimodal olfactory sensory preconditioning in Drosophila
eLife 11:e79107.
https://doi.org/10.7554/eLife.79107


