Balancing selection on genomic deletion polymorphisms in humans
- Department of Biological Sciences, University at Buffalo, United States
- University College London, Genetics Institute, United Kingdom
- The Francis Crick Institute, United Kingdom
- Institute of Computer Science (ICS), Foundation of Research and Technology-Hellas, Greece
Figures
Figure 1 with 2 supplements
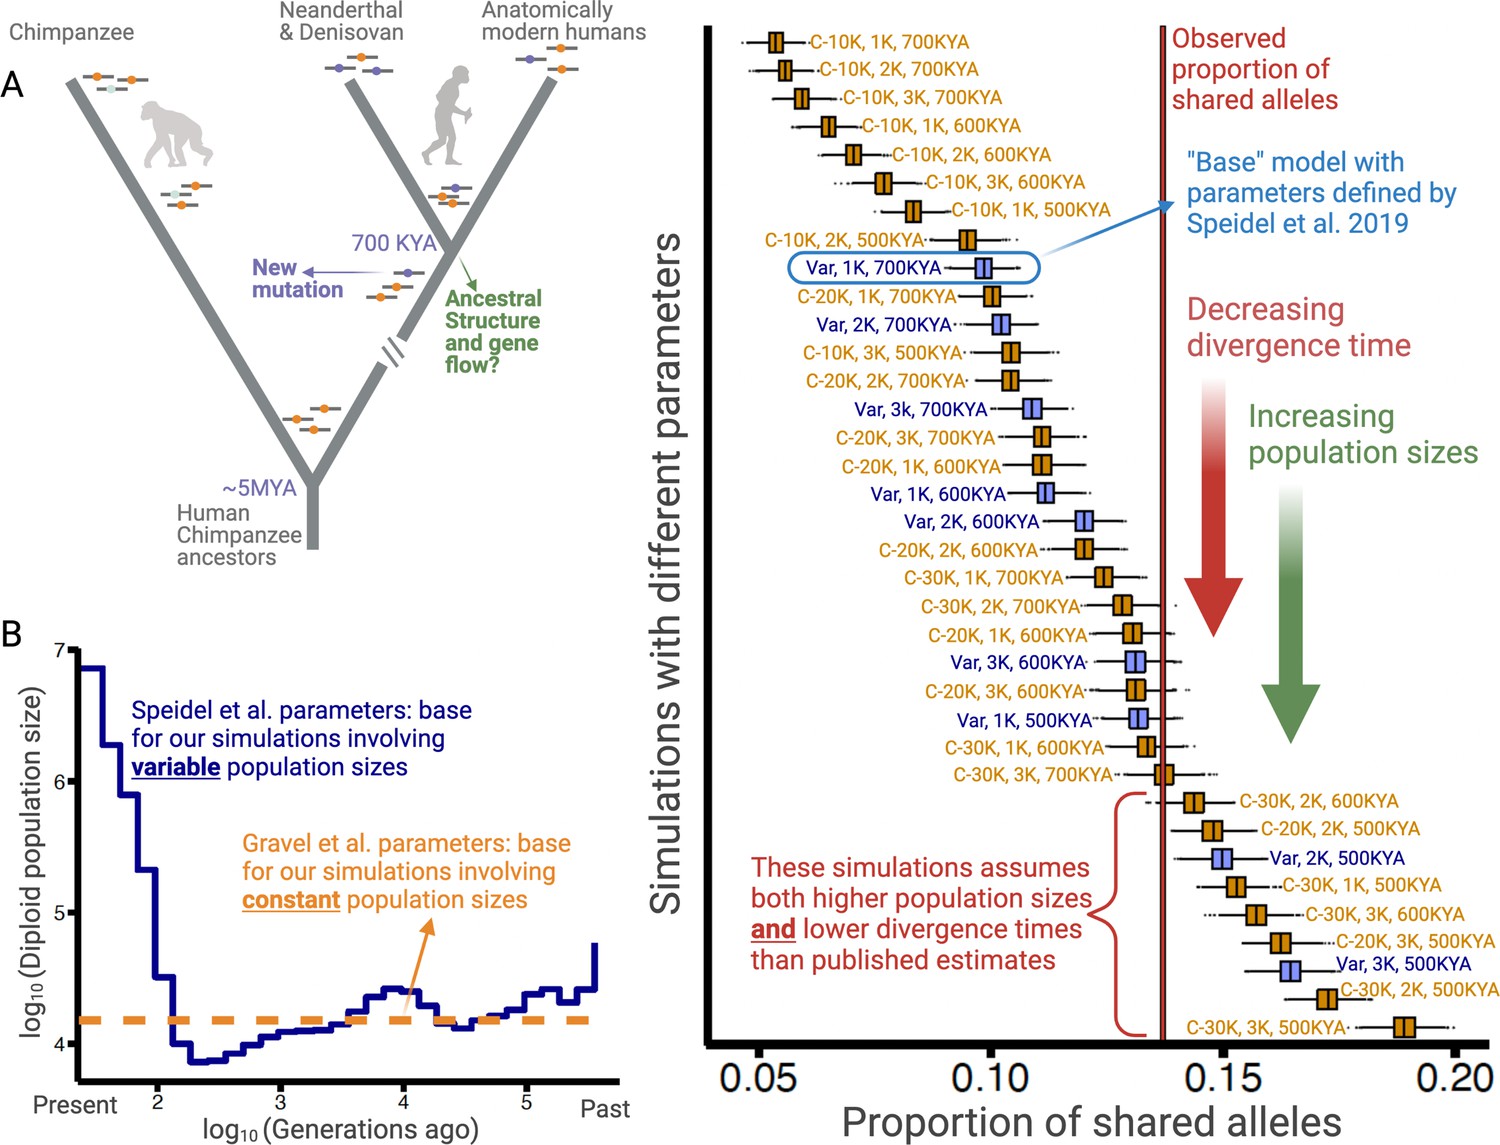
Excess of ancient polymorphisms segregating in anatomically modern humans (AMHs).
(A) A schematic representation of derived ‘ancient’ variants (purple) that emerged before the AMH-archaic hominin divergence (and after hominin-chimp divergence), and have remained polymorphic in the AMH lineage. The ancestral variants are indicated as orange, and the derived chimpanzee-specific variants are indicated in light blue. (B) The Speidel et al. and Gravel et al. simulation parameters. Speidel et al. provide parameters that involve varying population sizes for the YRI population. (C) Expected distribution of the proportion of ancient polymorphisms in YRI under different models. Each distribution is labeled with three parameters in the form (AMH-Ne, Archaic-Ne, time since archaic-AMH divergence). The simulations where we used variable effective population size published by Spiedel et al. are indicated by blue color and labeled ‘Var’. The simulations where AMH-Ne is constant are shown in orange, and provide the population size used. The vertical line represents the empirical proportion of ancient polymorphisms in YRI.
Figure 1—figure supplement 1
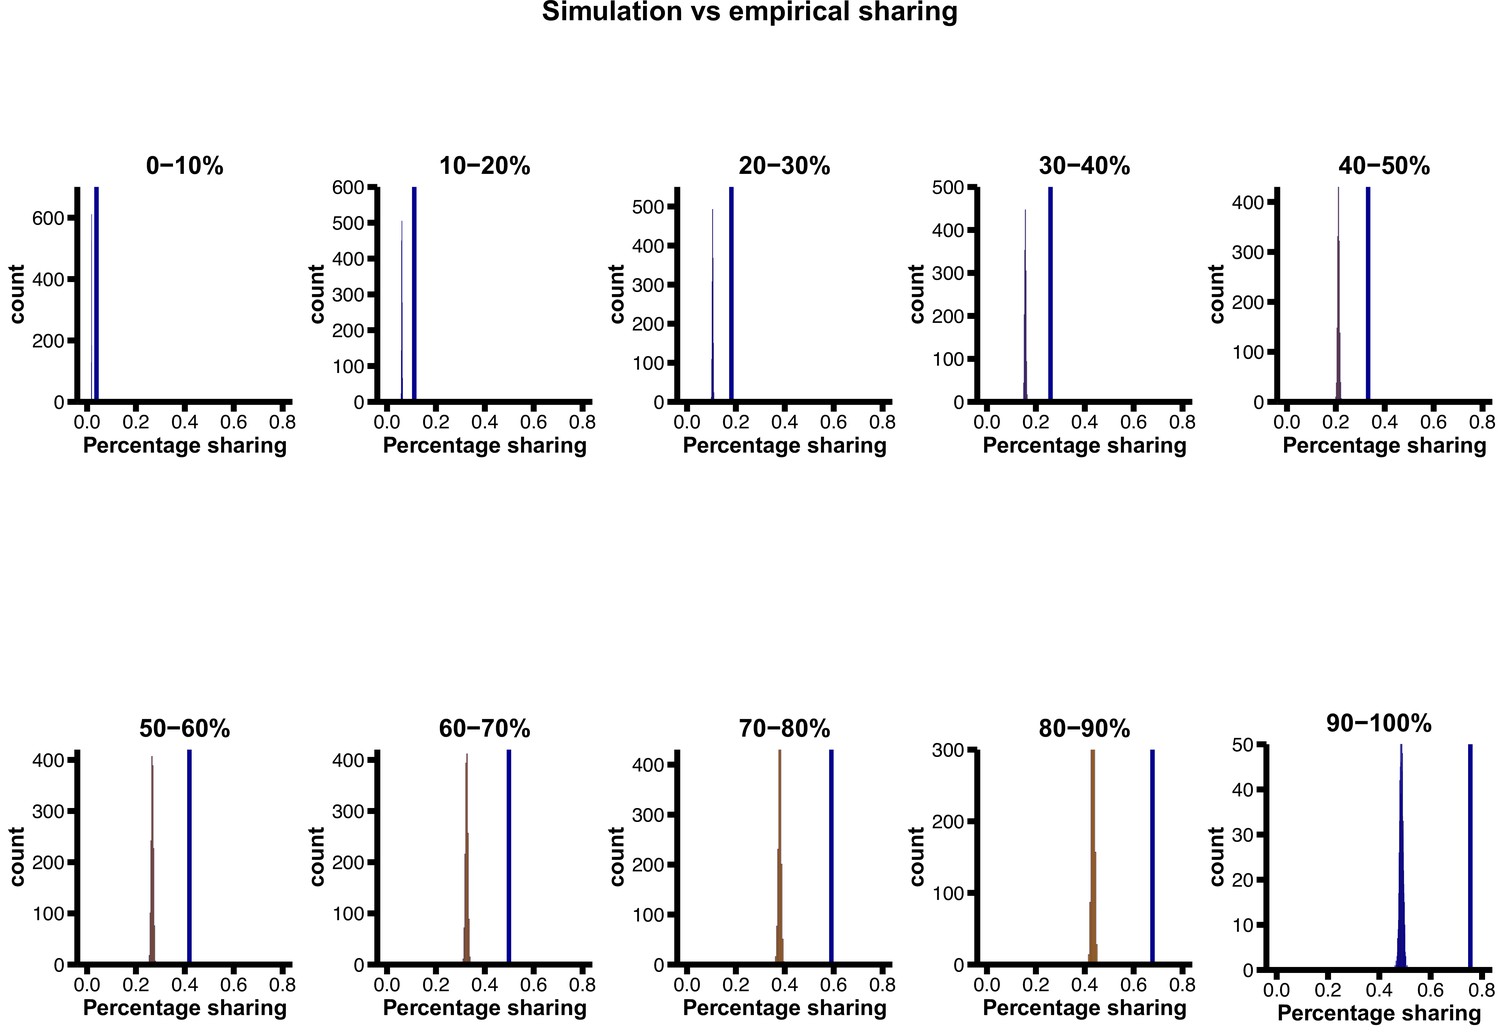
Proportion of ancient polymorphisms in observed data (YRI), relative to neutral expectation (‘base’ model parameters) in various derived allele frequency bins.
The vertical blue line indicates the observed sharing, while the distributions are simulated expectations. The excess of ancient polymorphisms in observed data becomes more pronounced at higher derived allele frequencies.
Figure 1—figure supplement 2
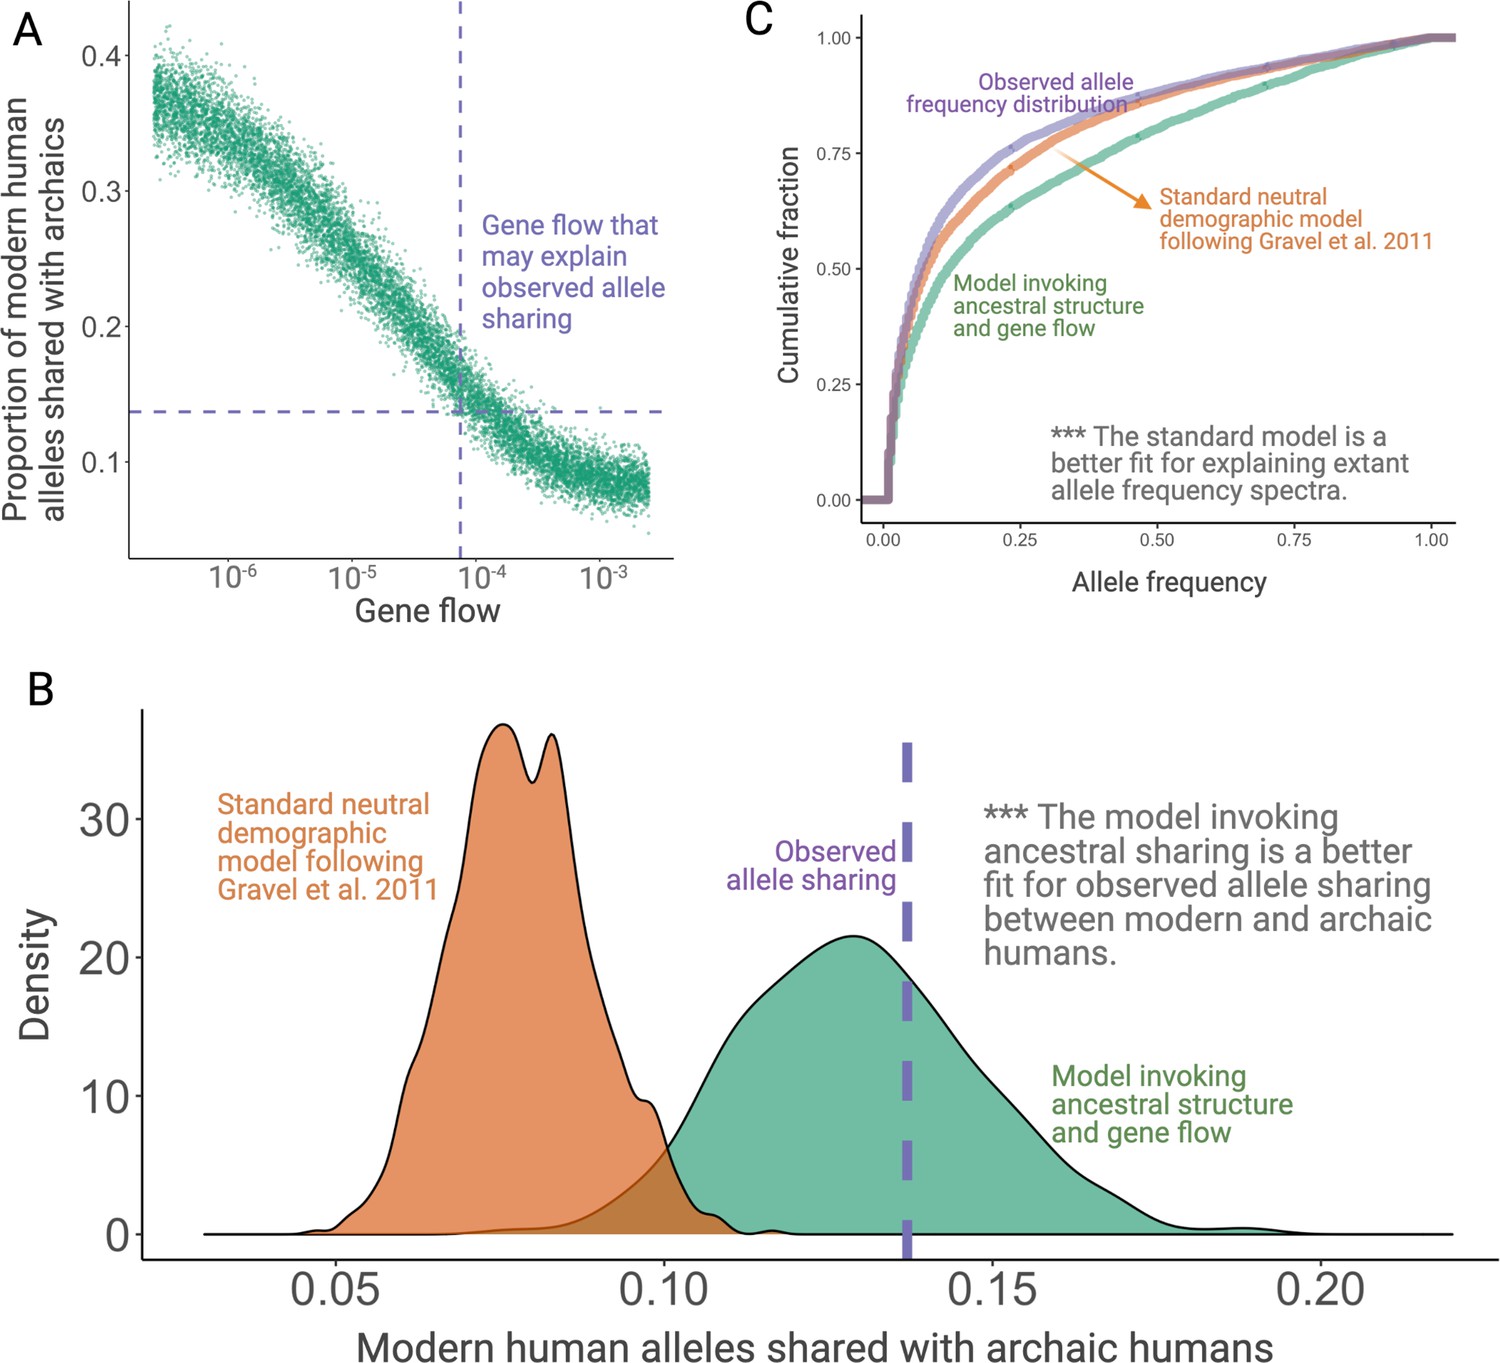
Simulation results.
(A) Results from simulations invoking structure in the population that was ancestral to both anatomically modern humans (AMHs) and archaic hominins. In this model, we have three latent subgroups in the ancestral populations. The x-axis refers to the fraction of each subgroup that is formed by the migrants of each of the other subgroups in each generation. (B) Proportion of ancient polymorphisms in YRI. The purple line is the observed proportion of ancient polymorphisms in Yoruba (YRI). The green and orange density plots indicate the distribution of the proportion of ancient polymorphisms in neutral simulations with and without ancestral structure, respectively. We used Gravel et al. parameters for these simulations. (C) Comparison of the allele frequency spectra of simulated single nucleotide variants (SNVs) with observed SNVs. The purple, orange, and green lines represent allele frequency spectra in the YRI population using actual SNVs, neutral simulations without ancestral structure, and neutral simulations invoking ancestral structure, respectively.
Figure 2 with 1 supplement
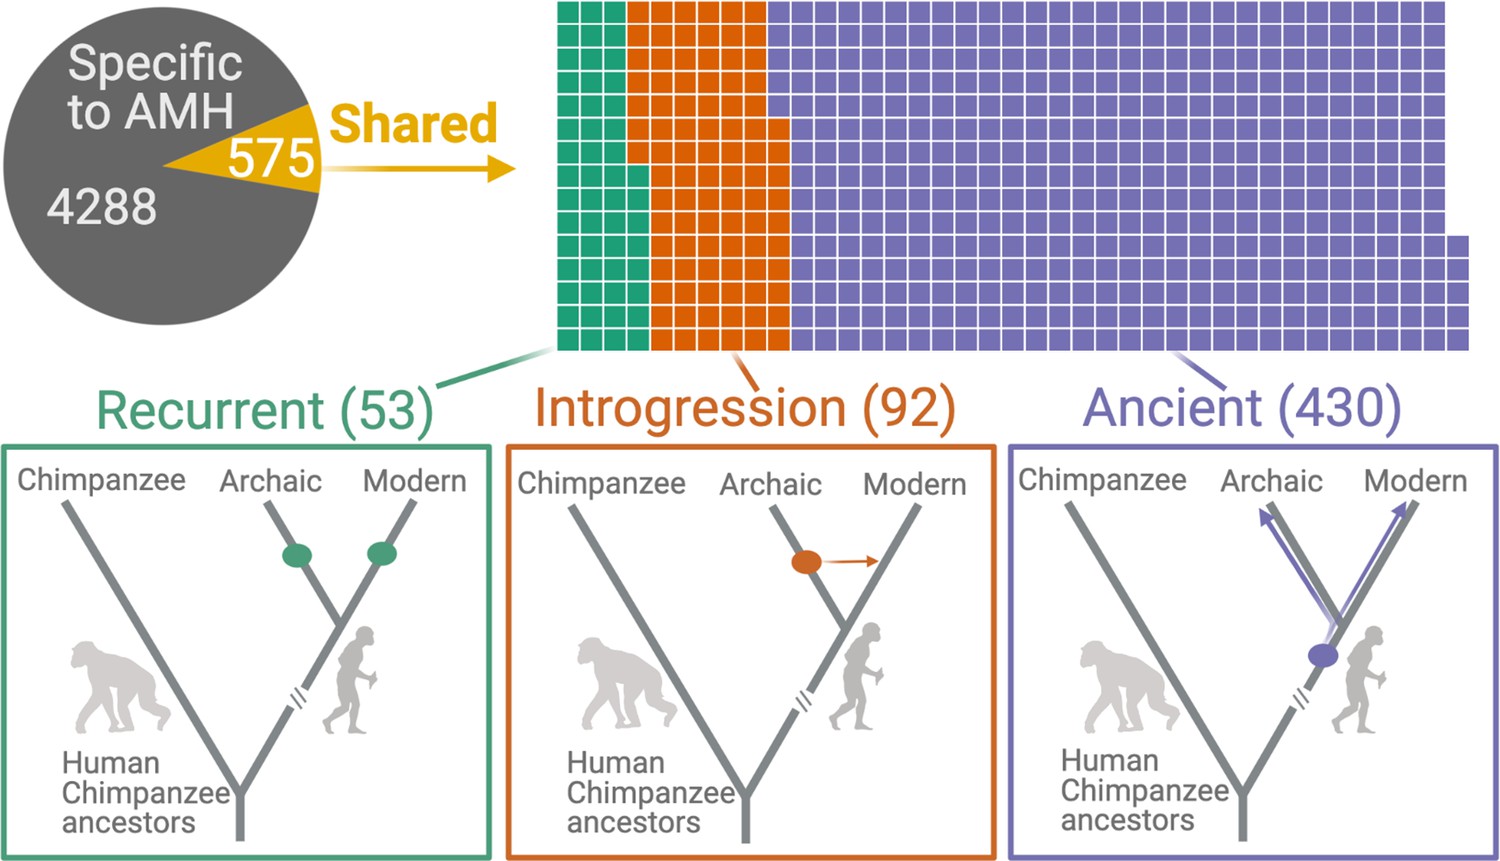
Deletions in anatomically modern humans (AMHs) that are shared with archaic hominins.
The top panel shows the categorization of deletion polymorphisms as AMH-specific, recurrent (green), introgressed (orange), or ancient (purple). The evolutionary histories of shared deletions are summarized schematically in the bottom panel.
Figure 2—figure supplement 1
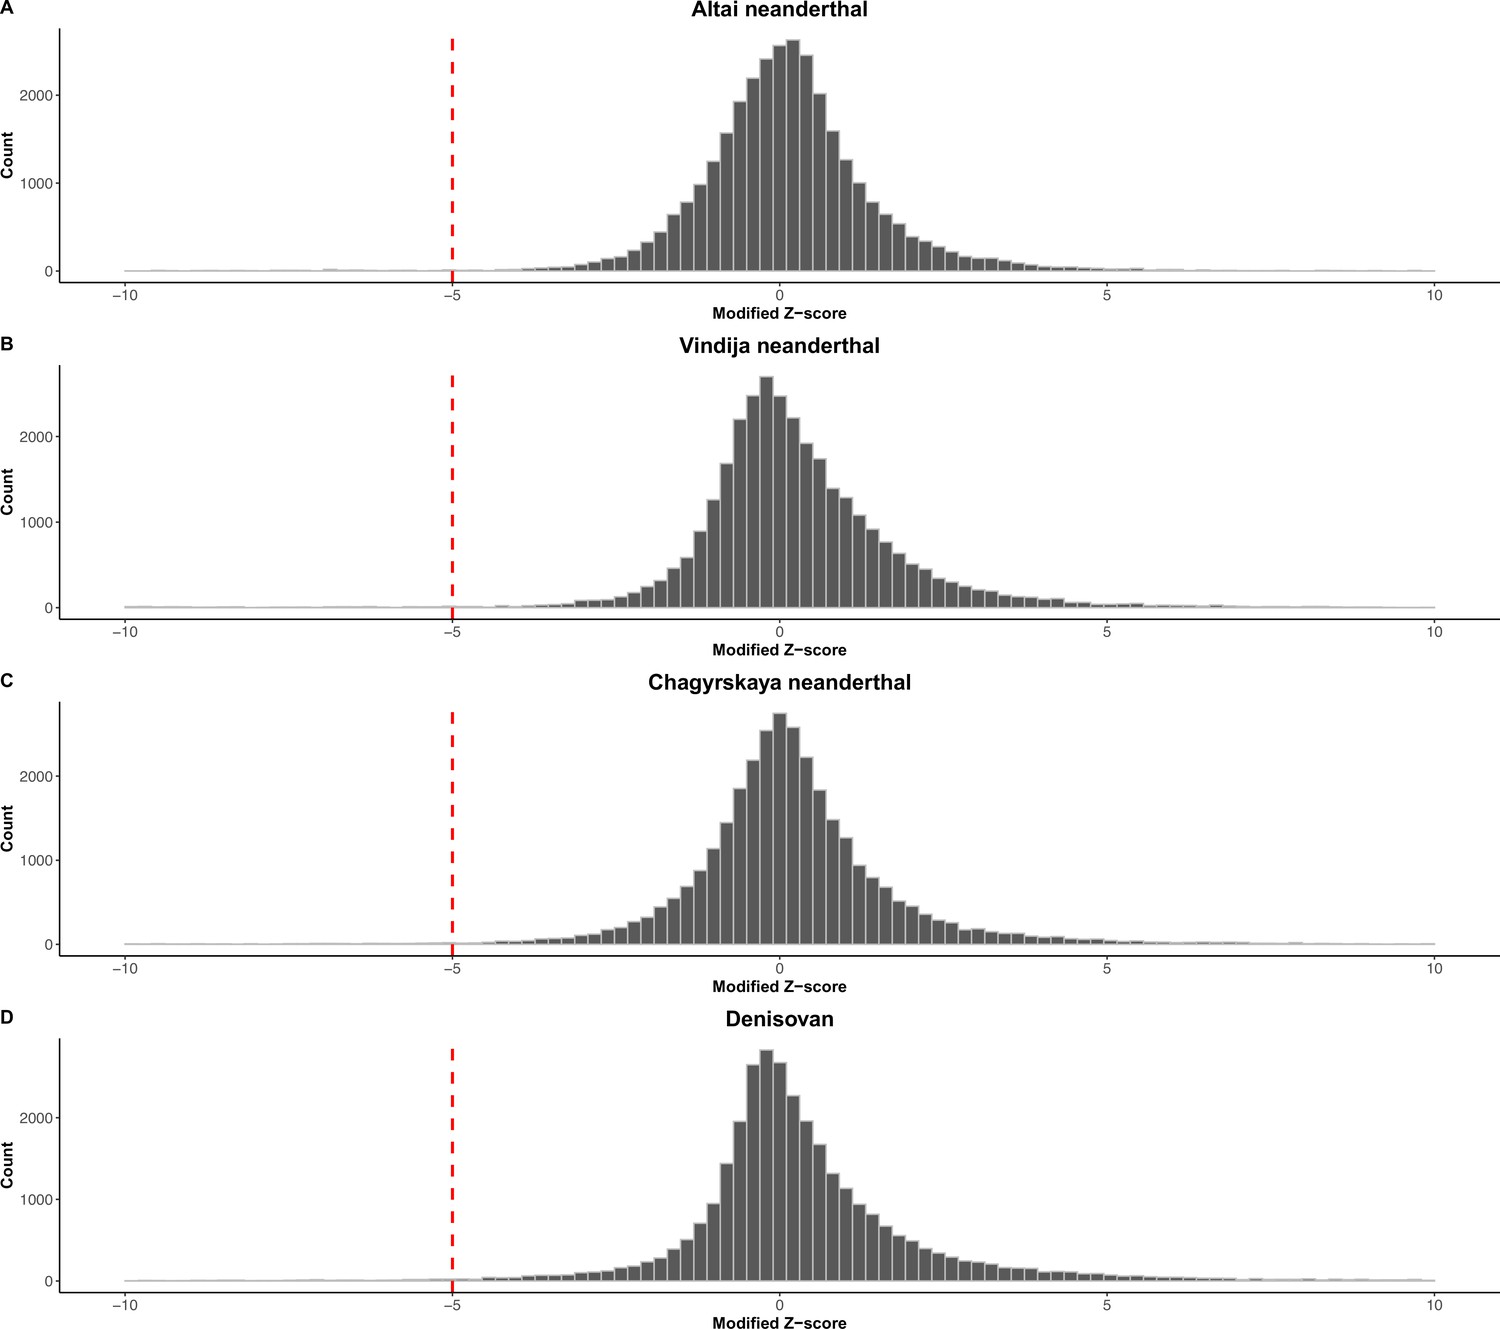
Read depth-based pipeline to identify deletions in archaic hominin genomes: Distribution of the modified Z-score of the read depth across the 32,154 biallelic anatomically modern human (AMH) deletions in the archaic genomes.
(A) Altai neanderthal. (B) Vindija neanderthal. (C) Chagyrskaya neanderthal. (D) Denisovan.
Figure 3 with 1 supplement

Age estimates of the haplotypes harboring polymorphic deletions.
The x-axis shows the age estimates, obtained using Relate, for the deletions. For orienting the reader regarding the age of these variants, we provide below a schematic phylogeny representing recent human evolution.
Figure 3—figure supplement 1
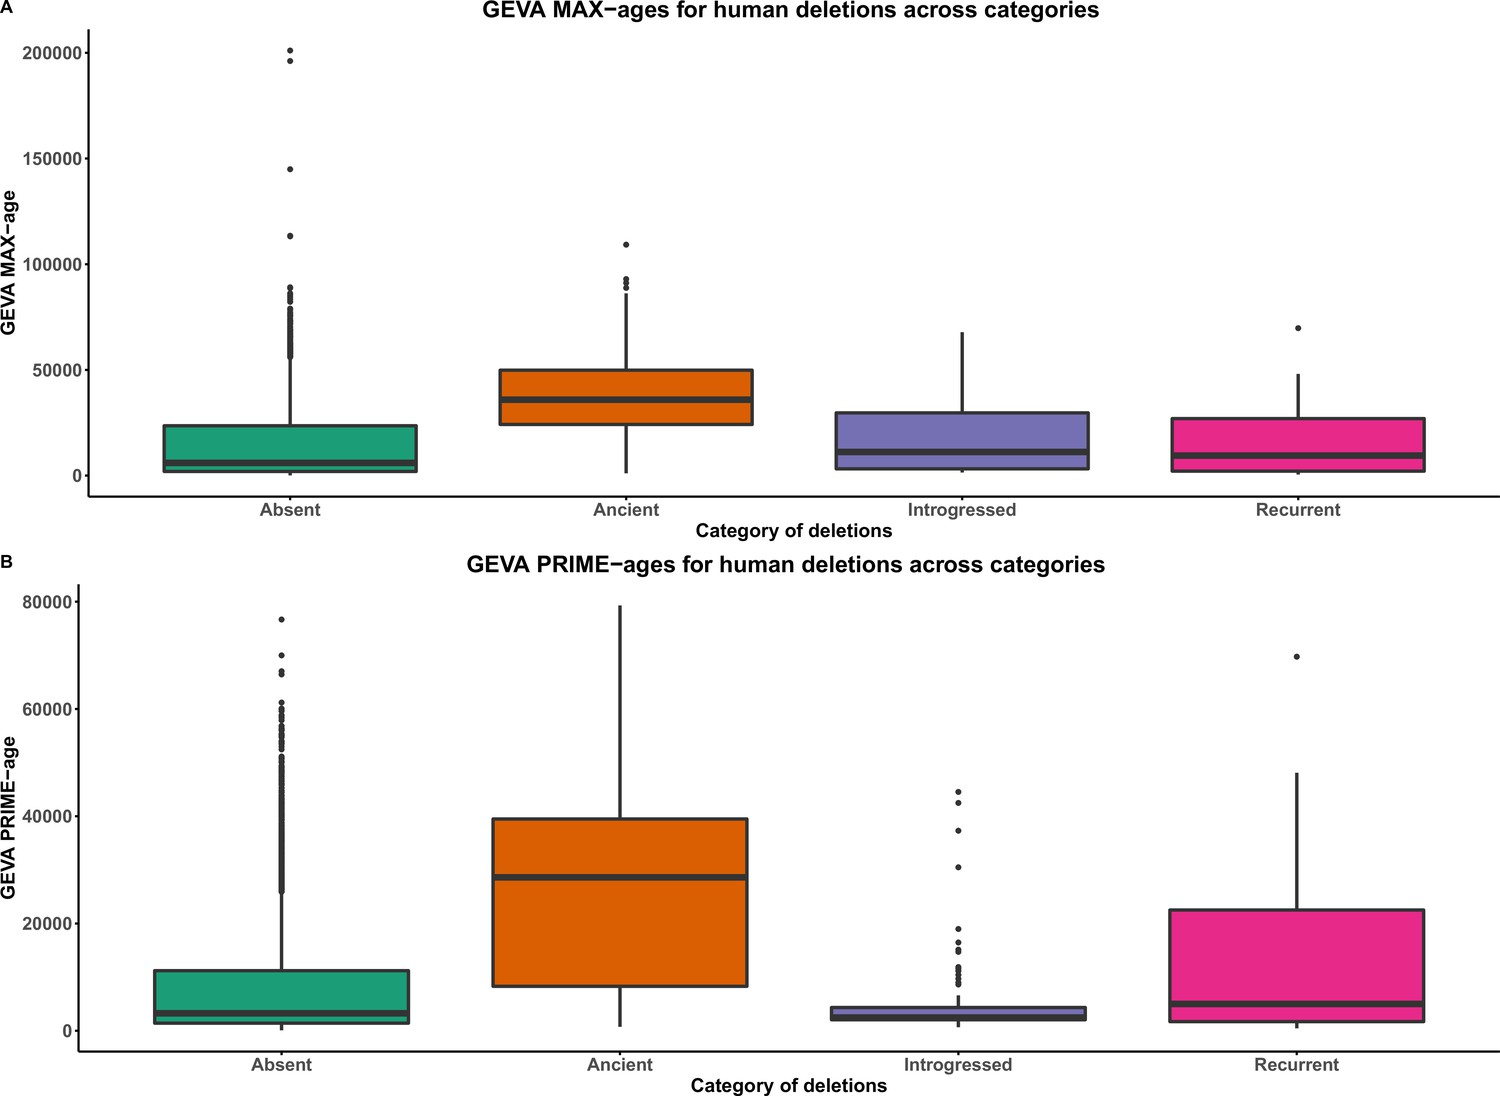
GEVA ages of deletions across categories.
Absent denotes polymorphic deletions in anatomically modern humans (AMHs) that are not present in any of the four high-coverage archaic genomes. Introgressed refers to the shared deletions that were introgressed from archaic hominins into AMHs. Recurrent refers to the shared deletions that emerged independently in the AMH and archaic hominin lineages. Ancient refers to the AMH deletions that are shared with archaic hominins by common descent. (A) GEVA PRIME-ages. (B) GEVA MAX-ages. With both GEVA PRIME and GEVA MAX measures, we observe that ancient deletions are significantly older than absent, recurrent, and introgressed deletions. This implies that our pipeline to identify ancient deletions is sound.
Figure 4
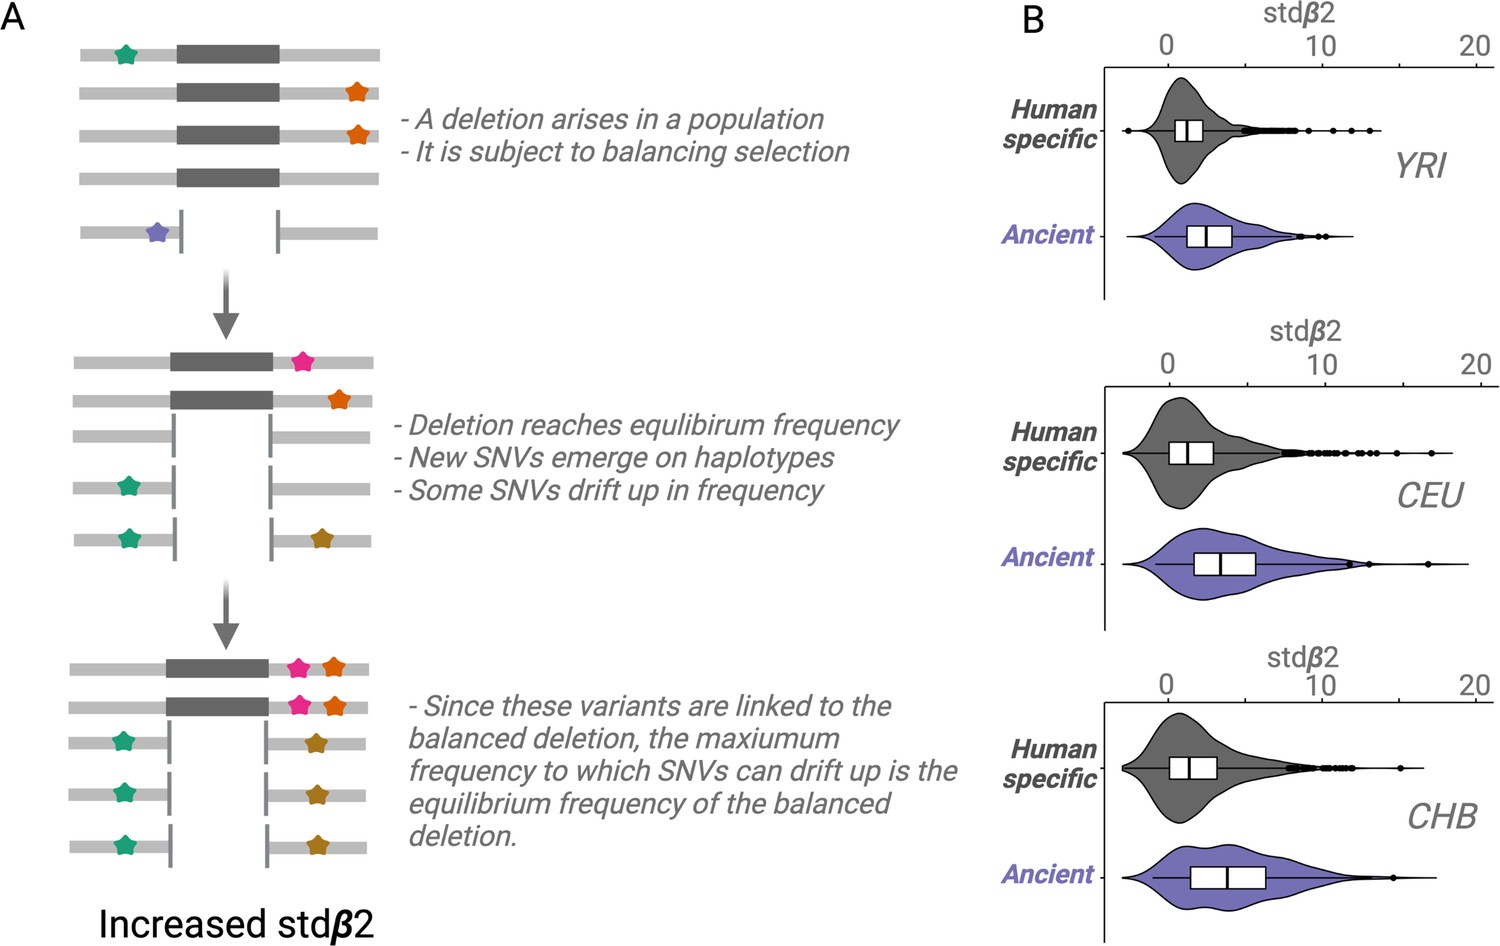
An empirical assessment of putative balancing selection among ancient deletions.
(A) The conceptual framework in which stdβ2 statistic works. The last step demonstrates ‘Goldilocks’ drift (the process that results in allelic class build-up). (B) A box plot for stdβ2 for anatomically modern human (AMH)-specific, versus ancient deletions (frequency >5% in respective populations). Higher stdβ2 values for older deletions represented in purple empirically show that older deletions are significantly enriched for targets of balancing selection. All comparisons are significant, p<10–7 (Wilcoxon).
Figure 5
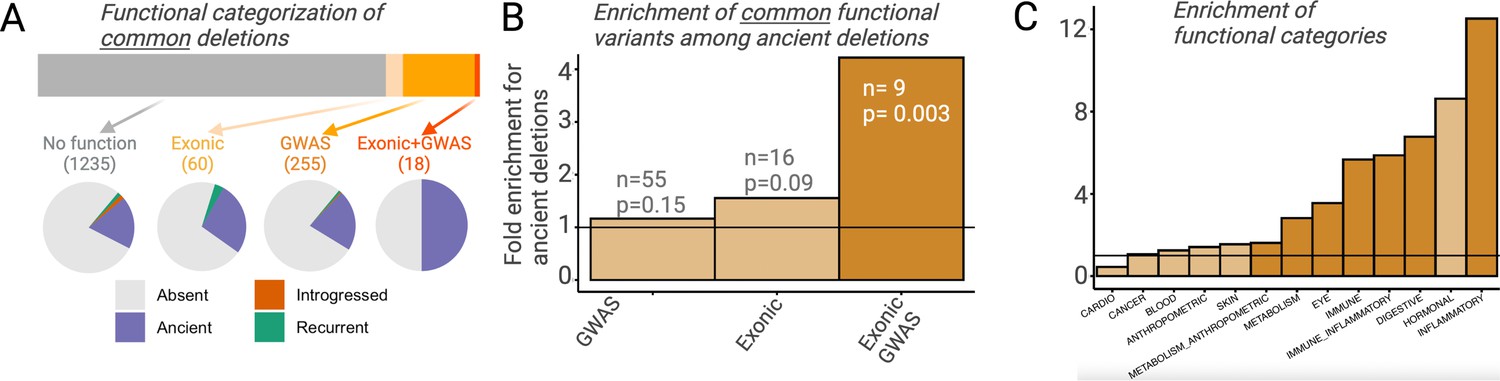
Functional enrichment among ancient deletions.
(A) Functional categorization of common deletions. Within each category, the proportions of deletions falling under different evolutionary categories are shown in pie charts. (B) Permutation-based analysis of enrichment of functionality among ancient deletions, relative to non-ancient deletions. The black horizontal line indicates the expected ratio of 1.0. For each definition of functionality, the number of functional ancient deletions, and the p-value associated with the enrichment are provided. (C) Permutation-based enrichment analysis for different phenotypic categories (based on genome-wide association studies [GWAS]) among ancient deletions, relative to non-ancient deletions. The black horizontal line indicates the expected ratio of 1.0. Dark orange indicates a statistically significant deviation from the expected ratio of 1.0. Light orange means no significant deviation from the expected ratio of 1.0.
Figure 6
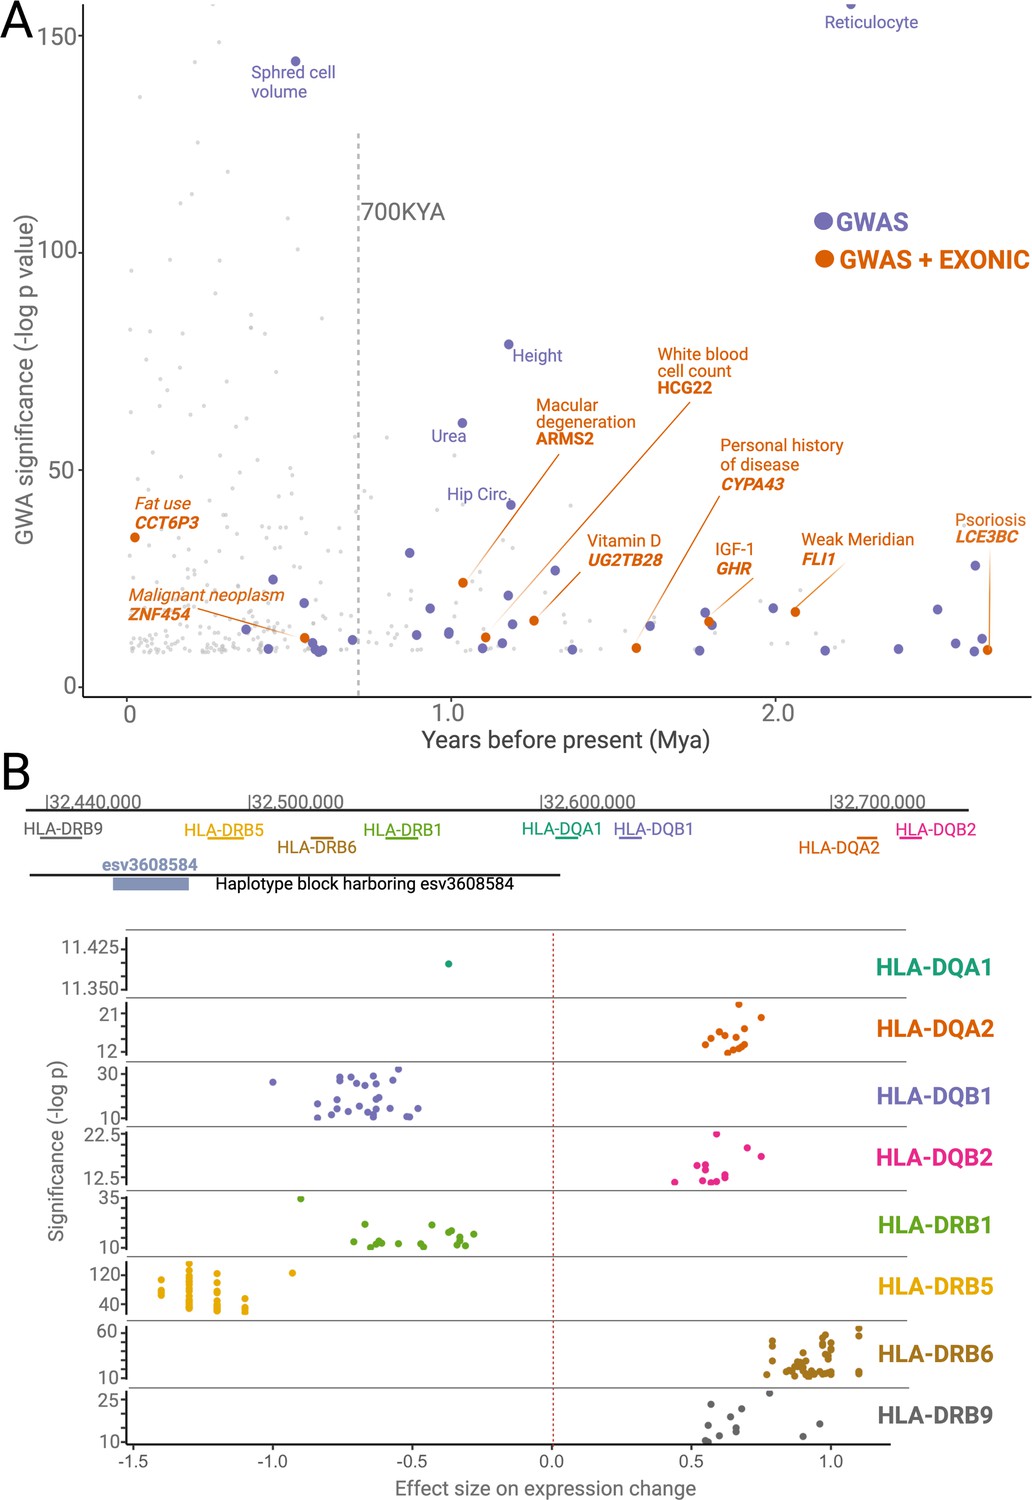
Phenotypic effects associated with deletions.
(A) The significance levels (-log(p-value)) of phenotypic associations of deletions with genome-wide association studies (GWAS) traits as a function of their emergence time. Gray points indicate non-ancient deletions. Purple and orange points indicate non-exonic ancient deletions with GWAS hits and exonic ancient deletions with GWAS hits, respectively. The genes whose exons are covered by ancient deletions, and the traits associated with ancient deletions are mentioned in the plot. (B) The significance levels (-log(p-value)) and sizes of expression level changes of nearby HLA genes associated with the presence of the deletion esv3608584. Each color refers to a different HLA gene. Each point in a given color represents a different tissue. Only those tissues whose expression level changes are statistically significant are shown here.
Figure 7 with 1 supplement
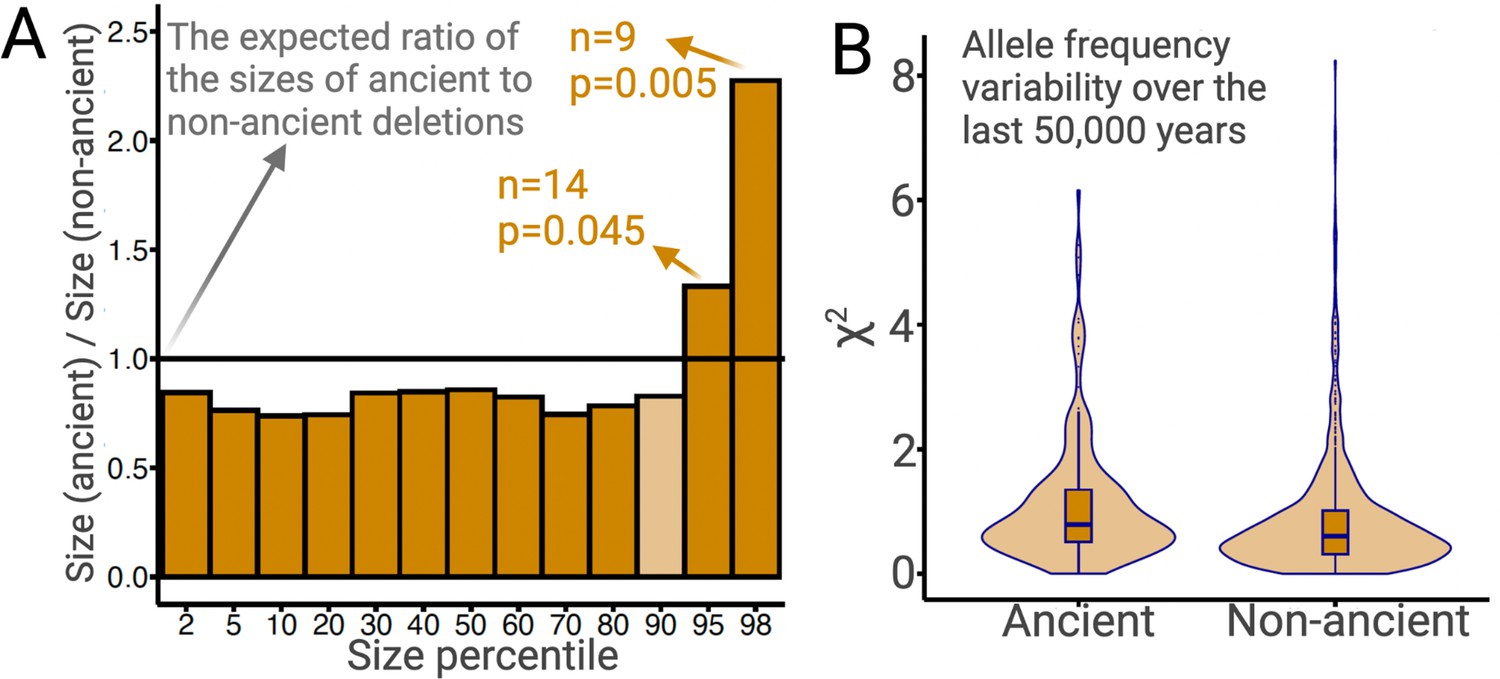
Ancient versus non-ancient deletions.
(A) The ratios of sizes of ancient deletions to those of non-ancient deletions at different size percentiles. The black horizontal line refers to the expected ratio of 1.0. Dark orange bars refer to a statistically significant (permutation test) deviation from the expected ratio. Light orange bars mean that the deviation from the extend ratio of 1.0 is not statistically significant. (B) The estimated measure of allele frequency change (χ2) between 50,000 and 5000 years before present in common ancient versus common non-ancient deletions. Ancient deletions have significantly (p=2 × 10⁻⁷, Wilcoxon) higher frequency variability over the last 50,000 years.
Figure 7—figure supplement 1
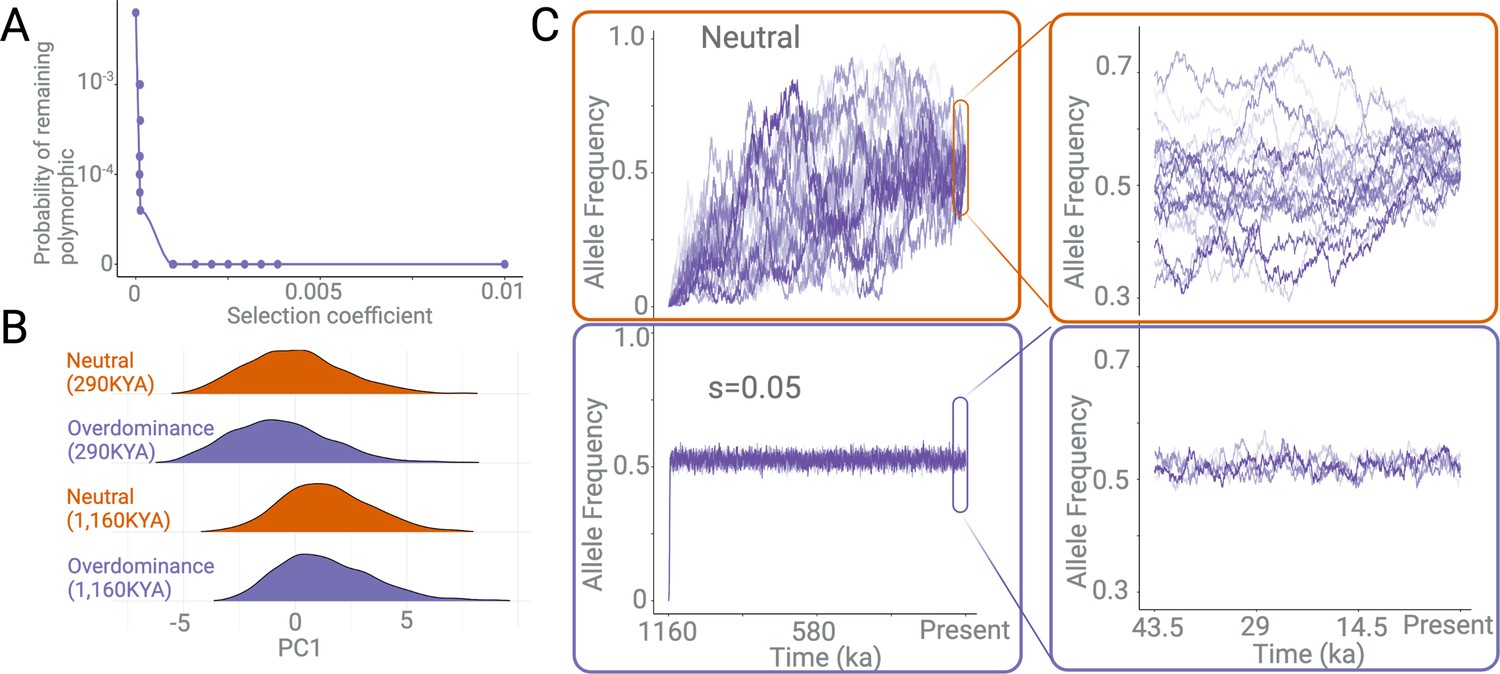
Effects of negative selection and overdominance.
(A) The probability of a polymorphism persisting in the population for 1,000,000 years under different negative selection pressures. (B) Density plots of the first principle component of multiple summary statistics based on variants simulated under neutral versus overdominance (s=0.05) scenarios. This is shown for two categories of variants: (1) those that emerged 290 kya and (2) those that emerged 1160 kya. There is no discernible difference between overdominance and neutrality within the time frame of these simulations. (C) The allele frequency trajectories of variants over 1,000,000 years, under neutrally (top), versus under overdominance (bottom). The x-axis represents the time since the emergence of a variant in years, assuming a 29-year generation time. The right panel is a zoomed-in version of the same allele frequency trajectories in the last ~50,000 years.
Additional files
-
Supplementary file 1
This table contains the status, in the 4 high-coverage archaic hominin genomes, of all 32,152 biallelic deletions reported in the 1000G Phase-3 dataset.
- https://cdn.elifesciences.org/articles/79111/elife-79111-supp1-v3.csv
-
Supplementary file 2
This table contains information about the 4,863 deletions that we used in our analysis.
- https://cdn.elifesciences.org/articles/79111/elife-79111-supp2-v3.csv
-
Supplementary file 3
This table categorizes, into 18 categories, the 1,675 traits associated with the 4,863 deletions.
- https://cdn.elifesciences.org/articles/79111/elife-79111-supp3-v3.csv
-
MDAR checklist
- https://cdn.elifesciences.org/articles/79111/elife-79111-mdarchecklist1-v3.docx
Download links
A two-part list of links to download the article, or parts of the article, in various formats.
Downloads (link to download the article as PDF)
Open citations (links to open the citations from this article in various online reference manager services)
Cite this article (links to download the citations from this article in formats compatible with various reference manager tools)
Balancing selection on genomic deletion polymorphisms in humans
eLife 12:e79111.
https://doi.org/10.7554/eLife.79111


